Impact of Migrant Workers on Total Factor Productivity in Chinese Construction Industry
by
Gui Ye
1,2,*, 
Yuhe Wang
1,2,
Yuxin Zhang
3,*,
Liming Wang
4,
Houli Xie
5,
Yuan Fu
1 and
Jian Zuo
6 1
School of Construction Management and Real Estate, Chongqing University, Chongqing 400045, China
2
The International Research Center for Sustainable Built Environment, Chongqing University, Chongqing 400045, China
3
College of Materials Science and Engineering, Chongqing University, Chongqing 400044, China
4
School of Civil Engineering, Inner Mongolia University of Science & Technology, Baotou 014010, China
5
Chongqing Construction Technology Development Center, Chongqing 400015, China
6
School of Architecture and Built Environment, University of Adelaide, Adelaide, South Australia 5005, Australia
*
Authors to whom correspondence should be addressed.
Sustainability 2019, 11(3), 926; https://doi.org/10.3390/su11030926
Submission received: 30 November 2018
/
Revised: 7 February 2019
/
Accepted: 9 February 2019
/
Published: 12 February 2019
(This article belongs to the Section Economic and Business Aspects of Sustainability)
Abstract
:Total factor productivity (TFP) is of critical importance to the sustainable development of construction industry. This paper presents an analysis on the impact of migrant workers on TFP in Chinese construction sector. Interestingly, Solow Residual Approach is applied to conduct the analysis through comparing two scenarios, namely the scenario without considering migrant workers (Scenario A) and the scenario with including migrant workers (Scenario B). The data are collected from the China Statistical Yearbook on Construction and Chinese Annual Report on Migrant Workers for the period of 2008–2015. The results indicate that migrant workers have a significant impact on TFP, during the surveyed period they improved TFP by 10.42% in total and promoted the annual average TFP growth by 0.96%. Hence, it can be seen that the impact of migrant workers on TFP is very significant, whilst the main reason for such impact is believed to be the improvement of migrant workers’ quality obtained mainly throughout learning by doing.
1. Introduction
Total factor productivity (TFP) plays a vital role in promoting the sustainable development of the construction industry. From the perspective of economic growth, economic theories, typically the classical growth theory [1], the neoclassical growth theory [2,3] and new growth theory [4,5] all suggest that the drivers of construction growth are labor, capital and TFP. As the previous researchers noted, the growth brought by the increase of labor and capital is exogenous and has a diminishing marginal utility, and a steady state of zero growth will approach ultimately [6,7]. Thus, labor and capital-driven development is unsustainable. On the contrary, TFP-driven development is endogenous and sustainable. Because this development mainly relies on innovation, such as technological progress, improvement of laborer’s quality and management innovation [8,9], which does not diminish rather even increases the marginal utility. To achieve sustainable development, consequently, it is a common strategy for any country to pursue higher TFP in construction.
To improve TFP, it is fundamental and essential to measure it properly, however, the absence of migrant workers data may have an effect on the measurement result of TFP. Generally, the measurement of TFP is a complex input-output process, involving diverse input resources [9]. In these resources, labor is the most important one for labor-intensive construction industry. Thus, accuracy of labor input data has a significant effect on the rationality and validity of TFP measurement. Although numerous measurement practices have given labor input considerable attention [8,9,10,11,12,13], it is noted that the official statistic data which do not usually include the information of migrant workers have been applied to measure TFP. This phenomenon occurs largely because the group of migrant workers has had a poor status and been treated unfairly [14,15]. With the motivation to circumvent all kinds of labor regulations and unionization [16,17], a statistical discrimination against migrant workers arises in construction of most countries, which is achieved mainly through the manners of unregister and non-contract [18,19]. Naturally, such groups have been almost omitted in official statistics [20,21]. The previous related studies have not focused on this factor [8,9,10,11,12,22,23,24,25,26,27], maybe these researchers mistakenly believe that the official data used already contain the data of migrant workers. Unfortunately, migrant workers are becoming overrepresented in construction of developed and developing countries [17,28]. Therefore, TFP measurement result will obviously not be precise if the effect of migrant workers is not incorporated.
In line with previous studies [14,29,30], in this paper migrant workers by definition mean adult workers entering into a different national or non-local labor market. In that case, some countries such as China where migrant workers account for a significant proportion of construction workers, measuring the impact of migrant workers on TFP should be specially marked. Due to hukou (household registration) system, China has a large number of migrant workers (known as Nongmingong in China) making up the majority of the labor force [30,31], while the construction industry, besides manufacturing, has long been the largest industry to offer employment opportunities for this group [32,33]. The national survey organized by the Chinese Bureau of Statistics [34] reported that more than 80% workers (54 million) employed in construction were migrant workers in 2017. Therefore, the impact of migrant workers on TFP must not be ignored in Chinese construction sector. In other words, we suspect that migrant workers will have a significant impact on TFP in Chinese construction industry. However, there has been few measurement practices paying attention to this group.
Against this unique background, the main objective of this paper is to validate and measure the potential impact of migrant workers on TFP in Chinese construction industry. To the best of our knowledge, there are no prior studies adding the factor of migrant workers to measure TFP in China and elsewhere. Therefore, we innovate in the field of TFP measurement studies with consideration of migrant workers. On this basis, the second objective is to discuss and analyze the possible reasons for such an impact, which contributes to obtaining more information to better understand how to improve TFP effectively by applying the factor of migrant workers.
The contribution of this article is twofold. In theory, our work tries to make up for the existing defects and to enrich the body of knowledge on TFP measurement in construction industry through consideration of the factor of migrant workers. In practice, our conclusions are of great importance for policy makers and construction firm managers, because they can acquire valuable reference to progress TFP growth. In addition, our findings can not only be adapted to Chinese construction sector, but also can be applied to most countries, such as Malaysia and Singapore where the proportions of migrant workers have reached about 69% and 64%, respectively [17,35].
2. Methodology
2.1. Research Design and Scheme
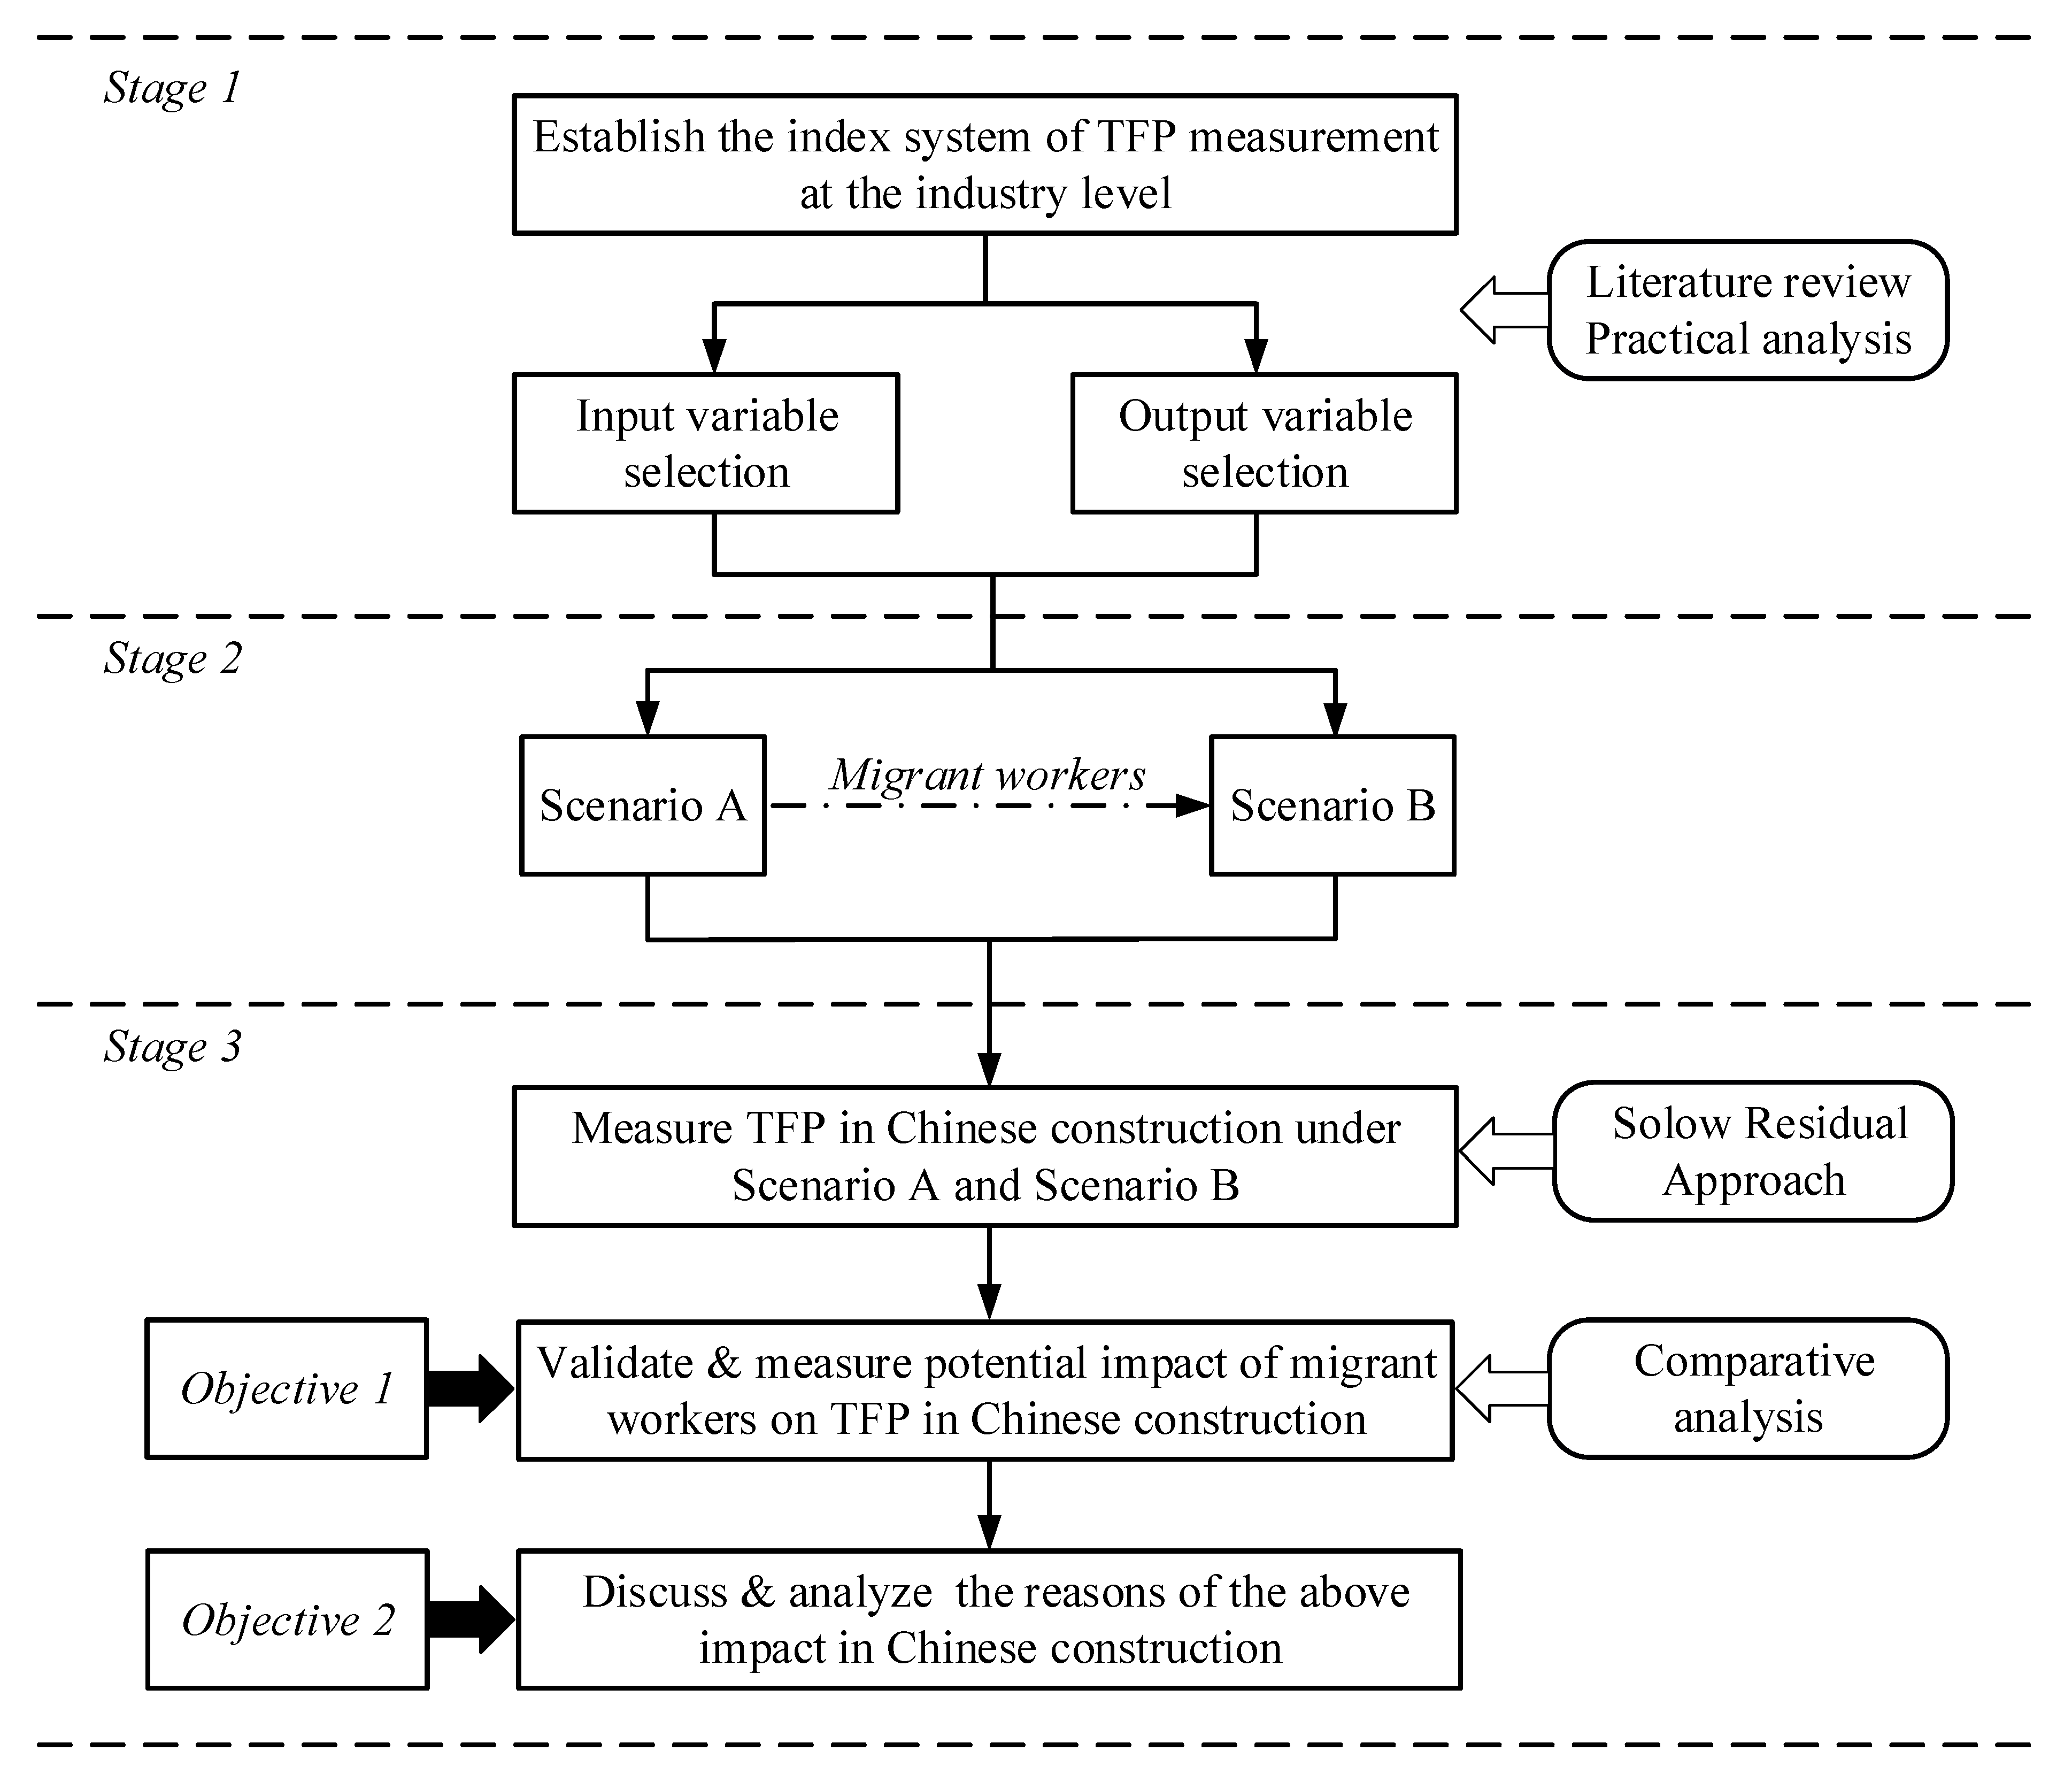
As a comprehensive indicator for evaluating efficiency in resource usage [36], TFP is only measured indirectly through a comparison between input and output [11,37], namely relying on the index system of input and output [38,39]. Therefore, it is extremely difficult to measure the impact of migrant workers on TFP directly. In that circumstance, we draw lessons from the common paradigm of experimental design to assess the impact indirectly by setting Scenario A and Scenario B. On this basis, a comparative analysis concerning two scenarios is conducted to obtain the impact of migrant workers on TFP indirectly. Hence, the following three-stage research design and scheme is planned, just exhibited in Figure 1.
2.1.1. Establishing the Index System of TFP Measurement
As stated above, to measure the impact of migrant workers on TFP, an index system of TFP measurement must be established firstly. Consequently, in stage 1 our main task is to identify the input factors and output factors in the establishing system and select the detailed variables and indicators for each factor. By a scientific review of literature, a summary of these factors was recorded in Table 1. As could be seen, these studies basically reached consensus on the identification of input and output factors.
In terms of output, the number of output indicators is related to the research method. Generally, the measurement method at construction industry level can be divided into two kinds: production function method and DEA-based index method (see Table 1). For function method, the decision-making unit (DMU) is only one, whilst the output is a single-output. By contrast, for index method, DMU is usually multiple and the output can be a single-output or multi-output. For example, Wang et al. [11] and Will et al. [45] used DEA-Malmquist and Färe-Primont DEA to measure TFP in Chinese construction industry, respectively. In their studies 31 provinces were treated as 31 DMUs, 2 outputs were selected. Similarly, Li et al. [10] and Chancellor [44] regarded 8 states as 8 DMUs to measure TFP in Australia, but the total value added was the only output. From a practical analysis perspective, in this paper we innovatively measure TFP by taking the factor of migrant workers into account. Nevertheless, the practical data of migrant workers have only the total data at the industry level (see Section 3), which means only one DMU. Meanwhile, the total value added and total output value are usually used to measure the gross output, while the former is more preferred than the latter since it could avoid double–counting [25,40]. Consequently, we choose the production function method to complete the measurement, whilst the total value added is selected as the single output variable.
In terms of input, labor and capital must be considered. In addition, intermediate input including materials purchased, energy goods and non-industrial services [8,43], is also an important input factor. However, due to data constraints, intermediate input is not a mandatory option [9,10,11,12,22,23]. Furthermore, taking account of the fact that the data of intermediate input are rarely available in a developing country like China, labor and capital were ultimately selected as the input variables. On this basis, for labor input, number of employees and hours worked are alternative indicators, what is more, the latter is recommended by OECD [47]. However, due to data limitations, number of employees was selected as labor input rather than hours worked. Similarly, fixed assets stock and total assets stock are two mainly employed indicators (see Table 1), but total assets include intangible assets such as trademark right and business reputation which should be seen more as outcome than input [48]. Thus, we finally selected fixed assets as the indicator to measure capital input.
2.1.2. Creating Scenario A and Scenario B
In stage 2 our main task is to create Scenario A and Scenario B based on stage 1’s findings. In Scenario A, all input and output data do not include the data of migrant workers, the measurement result is regarded as a baseline for the subsequent comparison analysis. Correspondingly, in Scenario B the related data of migrant workers are added into Scenario A from both the input and output side. Hence, from the perspective of experimental design, Scenario A is considered to be control group, while Scenario B is just the experimental group where migrant workers are the only control variable.
2.1.3. Measuring the Impact of Migrant Workers on TFP
Against this background, in stage 3 our main task is to measure the impact of migrant workers on TFP and to explore the potential reasons. As a mature production function method, Solow Residual Approach is selected to perform the above scheme. This method has the following advantages. Firstly, few variables are used, which makes data collection relatively easy [2], especially in the global context of lack of data on migrant workers [20]. In addition, this method is mainly applied to measure TFP from a macro perspective, such as nation and industry [37], consequently, it is suitable for our research.
In detail, we apply Solow Residual Approach to measure TFP under Scenario A and Scenario B firstly. Subsequently, a comparative analysis concerning the impact of migrant workers on TFP in Chinese construction industry is conducted. In that case, the impact of migrant workers on TFP can be expressed throughout a subtraction formula, i.e., the impact of migrant workers on TFP = measurement result in Scenario B - measurement result in Scenario A. On this basis, reasons for the above impact are discussed and analyzed.
2.2. Solow Residual Approach
Solow Residual Approach, proposed by Robert M. Solow [2], is a neoclassical economics tool measuring the contribution of TFP to economic growth. Such method requires an aggregate production function, according to the previous research [49,50,51], the function is written as
where Y is the aggregate output measured by total value added, K and L represent capital and labor input in period t measured by fixed assets and number of employees, A(t) expresses the level of TFP.
TFP measurement involves various behaviors and technology assumptions. For this study, constant return of scale and Hicks-neutral production technology are assumed. Differentiate Equation (1) with respect to time, we derive
To minimize cost or maximize profit, according to marginal utility theory, the following equation is established
where and are the income shares of capital and labor, with the condition of constant return of scale, Equation (2) is rewritten as
For discrete data such as time series in this work, Equation (5) is derived as [52]
If we define Solow Residual is SR, TFP change rate in production can be obtained
To measure SR, the three growth rates and parameter on the right side of Equation (6) are calculated. Generally, Y is usually actual value of the current period. Herein, to obtain ΔY/Y, the effect of price factor will be excluded firstly.
In line with statistical rules and previous research [12], the gross value added (Y) includes four components, just exhibited as follows
where D is depreciation of fixed assets in study period, R represents staff salaries including laborage payable and welfarism payable, M reflects profit, N presents tax and surtax.
is also determined in advance. From an economics perspective, is the income share of labor in essence [52]. Under this circumstance, we derive
In addition, the growth rates for input variables are also estimated. For labor input, the number of employees is adopted, therefore, ΔL/L would be obtained easily. On the contrary, for capital input, ΔK/K is much harder to obtain than ΔL/L, because fixed assets are cumulative figures that are effected by depreciation, incremental fixed assets investment and price factor. To solve this problem, the Perpetual Inventory Method (PIM) is used as follows [53,54,55]
where Kt+1 and Kt represent fixed assets in the period t+1 and t, δt+1 and It+1 express depreciation rate and incremental fixed assets investment, Dt+1 and Pt+1 reflect depreciation of fixed assets and the price index. Herein, K0 is fixed assets stock in 0 period, it is calculated as follows [50,53].
where I0 is initial incremental fixed assets investment, g and δ are the average capital growth rate and depreciation rate. On this basis, ΔK/K is obtained.
3. Research Data
According to the research scheme reported in Section 2.1, the input and output data without including migrant workers (Scenario A) and the relevant data of migrant workers must be obtained. On this basis, the data of Scenario B can be acquired and presented in Figure 2. Due to data availability, the surveyed period is restricted from 2008 to 2015.
In this paper, TFP measurement is based on two-input factors comprising fixed assets and number of employees and an output factor being the value added. As mentioned in Section 1, the official statistics of Chinese construction sector (Yearbook) does not include the information of migrant workers. Therefore, in Scenario A the relevant raw data excluding migrant workers is mainly sourced from China Statistical Yearbook on Construction published by the Chinese Bureau of Statistics. For output data, the raw value added data are current value. Thus, the value added index in construction deriving from China Statistical Yearbook was introduced to eliminate the effect of price factor. By doing so, 2008 was selected as base year, all raw output data were at the price level of 2008. Similarly, the fixed assets investment price index originating from China Statistical Yearbook was applied to remove the effect of price factor on capital input. However, just as described in Equation (9), fixed assets are also influenced by depreciation and incremental fixed assets investment. Accordingly, these data from China Statistical Yearbook on Construction are collected. In addition, the selection of 0 period in PIM is very vital. Due to data limitation, 1989 was considered as 0 period, whilst the period of 1989 to 2000 was selected to calculate the average capital growth rate (g) and depreciation rate (δ). In fact, these arrangements were reasonable, because the average depreciation rate was up to 8.23% in the period. In other words, fixed assets formed before 1989 would be fully depreciated in 2000 at the latest. Then, according to Equations (9) and (10), all raw fixed assets data were at the 1989 price level. Fortunately, data collection of labor input is much easier. Following the previous studies [10], the number of employees should be embodied by annual average numbers. Nevertheless, the raw labor input data are a year-end volume, so we dealt with it simply by following formula: the current labor input = (year-end number of employees + last year-end number of employees)/2 [56]. Regarding labor input, employee salary data from China Statistical Yearbook on Construction should also be collected, which is used to estimate the share of labor input.
As we have noted, the production tools that may form fixed assets are provided by construction enterprises rather than migrant workers who are generally only pure suppliers of labor force [33]. This means that migrant workers only have an impact on labor input and do not affect capital input at all. Apart from an input perspective, according to Equation (7), migrant workers will also effect output by salaries of migrant workers. Therefore, the data of migrant workers collected are just the number and salaries, which are mainly from Chinese Annual Report on Migrant Workers. For the number of migrant workers in Chinese construction, the Report did not provide directly, but the total number in China and the detailed proportion in construction could be obtained. Thus, the raw number of migrant workers would be acquired through a simple multiplication. In fact, the data may include a fraction of migrant workers who have been counted in China Statistical Yearbook on Construction. Hence, to avoid repeated statistics as much as possible, we need to figure out the proportion of migrant workers ignored in the Yearbook. According to Chinese prevailing labor law and social insurance law, contract signing rate and pension insurance participation rate of migrant workers can effectively reflect the ignored proportion [33], especially the latter which is a mandatory rule. The two rates have been about 25% and 5% since 2008, respectively [57], which meant that the majority of migrant workers (95%) were not included into official statistics in the surveyed period. Therefore, the number of migrant workers is derived based on such proportion ultimately, namely the migrant workers input = the average number illustrated in the Report × 95%. For the salaries of migrant workers, apart from the factor of the total number, the average monthly salary level and months worked in a year are also important affecting factors. The data of these two factors both come from the Report, except the average months worked in 2008 and 2009 (no statistics in the Report). Nevertheless, during the whole study period the average months worked of migrant workers were very stable. To solve the missing data, a linear single moving average method with the reverse direction was used. According to application principles, the distance per moving was 3. On this basis, salary data of migrant workers were obtained, namely the salaries of migrant workers = the number of migrant workers × the average monthly salary × the average months worked. Obviously, the process of data collection on migrant workers is based on a vital hypothesis, namely the official statistics (Yearbook) does not include the data of migrant workers, or at least it excludes the vast majority. Up to now, this hypothesis is only proposed based on literature analysis, which is not enough. Thus, in the next section we will further analyze and validate this hypothesis, which will also confirm the rationality of the data collection process on migrant workers.
In summary, the data of Scenario A and migrant workers were collected and listed in Table 2. On this basis, as could be presented in Figure 2 the data of Scenario B would be obtained. In addition, assumptions used in the modelling and data collection are vital, which are the basis of this research. Thus, a systematic summary on these assumptions is very necessary, reported as follows:
- Assumption 1: The data of migrant workers are assumed to not be included in the official statistics of Chinese construction sector (Yearbook).
- Assumption 2: For Scenario B, capital input is assumed to not be affected by migrant workers.
- Assumption 3: Free competition market is assumed in Chinese construction industry.
- Assumption 4: Return of scale is assumed to be constant.
- Assumption 5: Hicks-neutral production technology is assumed.
4. Results
4.1. TFP Measurement under the Circumstance of Scenario A
By applying the data collected in Section 3 to Solow Residual Approach, the measurement result on TFP under the circumstance of Scenario A is obtained. Figure 3 just presents the results.
The figure shows that during the whole sample period (T: 2008/2009–2014/2015) TFP increased by 60.44%, whilst a vast growth fluctuation always existed. According to the fluctuation trend, our results indicate that during the first period (T1: 2008/2009–2010/2011) TFP rose significantly (19.80%), SR (TFP change rate) was 13.40% in 2008/2009, then dropped quickly and continuously to a bottom of 1.36% in 2010/2011. However, in subsequent years (T2: 2011/2012–2012/2013) TFP raised noticeably (36.59%), SR grown dramatically to a new top (14.80%) in 2012/2013. By contrast, in the last two years (T3: 2013/2014–2014/2015) TFP climbed up slightly (4.05%), SR plunged steeply to a new bottom (−0.37%) in 2014/2015. Furthermore, on a yearly basis, the results show that the annual average TFP growth was 6.99% during the surveyed period in Scenario A.
However, we pay special attention to the phenomenon that SR plunged steeply to be negative in 2014/2015. For the collapse, we insist that some important factor might be ignored, as migrant workers mentioned in Section 1. Apart from this perspective, the share of labor input () can further prove our inference. From a perspective of economics, is the income share of labor input in essence [52]. Hence, according to Equation (8) the change of this parameter may prove some valuable evidences to support the above finding. Table 3 just reports the parameter under Scenario A and Scenario B during the surveyed period.
As can be seen in the table, in Scenario A the share gained the top by 0.64 in 2013, whilst during the entire research period the average share was only 0.61. Nevertheless, according to the previous studies, this share was usually 2/3 or even up to 3/4 in developed countries [58,59,60,61]. For developing countries, it is considered to be higher, because the marginal product of capital is expected to be higher [49,62]. Besides, for a labor-intensive industry, the share is considered to be much bigger than a general industry. For example, as a labor-intensive industry, agriculture in China was proved to have a higher share reaching to nearly 0.75 in a previous study [63]. Thus, as a labor-intensive industry in a developing countries like China, the share of labor input should be more nearly 3/4 rather than 2/3 in Chinese construction sector, but all of our data in Scenario A were less than 2/3. In other words, some important factors about labor input in the Chinese construction sector are indeed ignored during this period. By contrast, in Scenario B the average share was 0.73 during the whole research period which is consistent with previous research and the above analysis. Thus, the data of migrant workers is not included in the official statistics. Obviously, except literature analysis, assumption 1 has also been confirmed and supported from the perspective of theoretical analysis. In this case, it is necessary to consider the factor of migrant workers to re-measure TFP under the circumstance of Scenario B.
4.2. TFP Measurement under the Circumstance of Scenario B
Subsequently, adding the data of migrant workers described in Table 2 into Scenario A (detailed process can be seen in Figure 2), the measurement result on TFP in Scenario B can be presented graphically, as shown in Figure 4.
This figure illustrates that in Scenario B TFP cumulatively increased by 70.86%, whist the annual average TFP growth was 7.95% during the study period (T: 2008/2009–2014/2015). Similarly, an obvious growth fluctuation always existed, SR showed basically the same trend as Scenario A, namely downward, upward and downward in turn. According to the trend, our results exhibit that during the first downward period (T1: 2008/2009–2010/2011) TFP grew significantly by 22.07%, SR was 10.80% in 2008/2009, then dropped steadily to a bottom (3.23%) in 2010/2011. However, in subsequently upward years (T2: 2011/2012–2012/2013) TFP increased remarkably by 32.68%, SR rose rapidly to a new top (12.82%) in 2012/2013. On the contrary, in the last two years (T3: 2013/2014–2014/2015) TFP climbed only by 16.11% in total, SR presented a slow downward trend, and finally reached to a new bottom (4.20%) in 2014/2015.
4.3. The Impact of Migrant Workers on TFP
Based on the results in Scenario A and Scenario B, by conducting the comparative analysis reported in research design and scheme, the impact of migrant workers on TFP is derived, as can be seen in Table 4.
On the one hand, the table exhibits that migrant workers dramatically improved TFP by 10.42% in total during the surveyed period. On the other hand, the results show that the annual average TFP growth was increased by 0.96% deriving from migrant workers. Although 0.96% seemed very small, compared with the baseline of 6.99%, it emerged amazing growth by 13.73%. Therefore, our findings effectively verify and validate our initial suspicion and guess reported in Section 1, namely enormous influence of migrant workers on TFP does exist in Chinese construction industry.
Apart from the view of whole surveyed period, on the basis of the fluctuation trend stated in Figure 3 and Figure 4, from a sub-period perspective, the impact of migrant workers on TFP is exhibited clearly in Table 5.
The table shows that the impact of migrant workers on TFP was mainly concentrated in the third sub-period (T3: 2013/2014–2014/2015), in this sub-period, migrant workers improved TFP by 12.06%. In contrast, the impact was not significant in T1 and T2, although these two periods had more years (five years) compared with T3 (two years). In detail, in the first sub-period migrant workers increased TFP only by 2.27%, interestingly, in the second sub-period the accumulative impact was even −3.91%. Obviously, without considering the positive or negative, the impact in T2 was much bigger than T1. Consequently, the impact of migrant workers on TFP seems to have an intuitive rule, namely the influence of migrant workers on TFP has been increasing with the extension of time.
5. Discussion
Based on the above findings, it can be seen that migrant workers have a significant impact on TFP improvement. According to research aims and design of this article, hence, in the following discussion we mainly focus on what the reasons of such enormous impact is. By doing so, we can provide enough and full interpretations for the above enormous impact. On this basis, the intuitive impact rule of migrant workers on TFP is analyzed and discussed. Simultaneously, to improve TFP effectively, some suggestions are proposed.
5.1. Cause Analysis on the Significant Impact of Migrant Workers on TFP
From a reason perspective, it is believed that the improvement of migrant workers’ quality mainly results in the above enormous impact. On the one hand, TFP can be improved by many factors, such as technological progress, improvement of laborer’s quality and management innovation [8,9], but TFP growth most usually arises because of increased knowledge about production methods [37]. In other words, at the personal level, TFP growth mainly depends on quality improvement. TFP was evaluated by Solow residential approach in this work, where all the labor input including migrant workers was regarded as a homogeneous individual. During this process, quality difference and change is not taken into account at all. Therefore, we explain the impact of migrant workers on TFP only from the view of quality difference and change. On the other hand, Kangasniemi et al. [64] stated that migrant workers are regarded as no different to the official statistic employees, except the quality they embody. Meanwhile, the previous studies argued that the quality improvement of laborer would increase TFP [37,65,66]. Thus, the quality improvement of migrant workers can increase TFP as well. On the basis of the above analysis, quality improvement is considered to be the main reason for the significant impact of migrant workers on TFP.
Furthermore, the improvement of migrant workers’ quality is considered to be obtained mainly throughout learning by doing. In general, at the personal level, quality improvement usually depends on education, training and learning by doing [37,41,64]. For education, migrant workers are usually not well-educated [31,67], whilst the education level of this group has not improved significantly. For example, during the entire study period, nearly 60% of migrant workers’ education level was junior middle school [34]. Hence, education is not the main way to improve the quality of migrant workers. Similarly, migrant workers’ quality improvement may not be mainly attributed to training. Because they usually lack training as well [31,67], embarrassedly, this situation has not been effectively improved. For instance, according to Chinese Annual Report on Migrant Workers, during the surveyed period the proportion of trained migrant workers did not grow outstandingly, and always remained about 30% [34]. In this case, learning by doing is considered to be the main way to improve migrant workers’ quality. In fact, learning by doing is work-based learning, namely it mainly relies on the accumulation of work experience to improve quality. Interestingly, migrant workers often have low levels of absence and work longer hours [14,67]. Therefore, these features just offer the possibility and basis for learning by doing.
Subsequently, from a path view, learning by doing to grow migrant workers’ quality is thought to basically rely on an invisible path dependency on migrant workers’ work selection. For migrant workers in Chinese construction sector, on the one hand, they are usually not well-educated, and lack training, work skill and experience [31,68]. Hence, the initial quality of this group is too poor, they cannot find a better job in other industries. In this case, low quality usually forces migrant workers to serve in construction, because they do not have a better choice. On the other hand, according to Chinese Annual Report on Migrant Workers, during the whole study period migrant workers in construction had higher income by nearly 15% than other industries, meanwhile, migrant workers in construction were often offered free accommodation which could save about 15% of income [34]. Thus, more income (one of the best options) and lack of skill and education (no better choice) have encouraged migrant workers to stay and serve in construction for a long time. In that condition, whether it is a passive or active choice, a virtual path dependence on work selection has been formed, which causes migrant workers to work in construction industry for a long period. On this basis, according to the so-called economic theory of learning by doing [41], the quality of migrant workers will be gradually improved mainly by learning by doing. In particular, for this path of basically replying on the accumulation of work experience to improve quality, low quality of migrant workers just provides more improvement spaces.
5.2. Cause Analysis on the Intuitive Impact Rule of Migrant Workers on TFP
As stated in the last section, we analyzed and confirmed that the improvement of migrant workers’ quality is the main reason for the vast impact of migrant workers on TFP, whilst discussing and verifying that quality improvement is obtained mainly throughout learning by doing in Chinese construction sector. Under this proposed logical frame, path dependence on work selection to form and promote learning by doing is explored and revealed. On the basis of these findings, therefore, in this section we explore and propose the possible explanations for the intuitive impact rule of migrant workers on TFP reported in Section 4.3.
In our opinion, the game between the initial low quality and quality improvement through learning by doing determines the impact ruler of migrant workers on TFP. On the one hand, during the surveyed period more than 26 million migrant workers (see Table 2) as new comers served in construction, while they were usually not well-educated, and lack training, work skill and experience [31,68]. Hence, the initial quality of these migrant workers was believed to be too poor. Moreover, a positive correction existed between the quality of labor force and TFP, which has been proved by many economists [37,65,66]. Naturally, the initial low quality of the new comers would reduce TFP. On the other hand, based on the path dependency on migrant workers’ work selection, all migrant workers’ quality will be improved throughout learning by doing, which would increase TFP. Obviously, over time the share of new migrant workers will be less and less, and decrease of TFP caused by the initial low quality will be weaker and weaker. On the contrary, the share of migrant workers with experience and skill will be more and more, growth of TFP from learning by doing will be stronger and stronger. In this case, the dynamic game between TFP decrease from the initial poor quality of new migrant workers and TFP growth from the quality improvement of all migrant workers, just explains and depicts the interesting impact rule of migrant workers on TFP.
Based on the above theoretical analysis, by applying the data of number of migrant workers in Table 2, maybe more information can be provided to interpret the intuitive impact rule of migrant workers on TFP stated in Table 5. In detail, at the beginning of the research period, nearly 30 million migrant workers served in Chinese construction industry, which provided a solid basis for quality improvement throughout learning by doing. In T1, the growth in the number of migrant workers was relatively moderate, the annual average number of new comers was about 4.3 million. Hence, quality improvement throughout learning by doing to increase TFP played a major role, the result of the game was that TFP only increased by 2.27%. In contrast, the growth of migrant workers was extremely large in T2, whilst the annual average number of new comers was about 7.1 million; even in 2013 more than 10 million new migrant workers poured into construction. In this case, the initial poor quality of new comers to reduce TFP acted a more important role, the result of the game was that TFP decreased by 3.91%. Unfortunately, in T3 the number growth basically stopped, therefore, on the whole only quality improvement throughout learning by doing to increase TFP worked. What’s more, the scale of learning by doing was extremely huge. Under this condition, the impact of migrant workers on TFP (12.06%) was mainly concentrated in this sub-period.
5.3. Suggestions and Applications
In fact, to improve TFP, Chinese government has taken a series of measures, such as purchasing advanced mechanical equipment and introducing new technique [11,23,45]. From a based-result perspective, the effectiveness of these measures is poor; TFP is still perceived to be low compared with other sectors in China [6,9,69]. For this unsatisfactory performance, the main reason may be that migrant workers are not taken into account. Embarrassedly, as an identified important influencing factor, improving TFP in Chinese construction industry from the perspective of migrant workers is rarely involved among these measures.
Therefore, according to our findings, making policy to improve TFP in the future should pay special attention to the group of migrant workers, in particular, some measures should be made to increase the quality of migrant workers. For example, from a policy perspective, these measures, such as encouraging communication and respecting learning among migrant workers, should be taken to enhance the effect of learning by doing. Besides, as a short-term and effective strategy, more trainings, including on-job and even off-job training, should be provided to migrant workers. More importantly, the comparative advantage of construction (relative high income vs poor working environment and labor protection) is gradually disappearing [34]. More importantly, well-educated young migrant workers are reluctant to work in construction industry, whilst the experienced migrant workers have been leaving construction sector since 2014 [34,70]. Accordingly, as a long-term strategy, these activities, such as improving the poor working conditions and proving enough labor rights, must be implemented immediately to attract and retain migrant workers.
6. Conclusions
In this paper, we measured and verified the impact of migrant workers on TFP in Chinese construction industry during the period of 2008–2015; Solow Residual Approach was used to conduct the measurement throughout comparing two scenarios, namely Scenario A without considering migrant workers and Scenario B including migrant workers.
The findings of this work can be summarized as follows. Firstly, for Scenario A, during the surveyed period TFP increased by 60.44%, whilst the annual average TFP growth was 6.99%. Secondly, for Scenario B, the total and annual average TFP growth was 70.86% and 7.95%, respectively. Thirdly, migrant workers have an outstanding impact on TFP: during the study period this group improved TFP by 10.42% in total and increased the annual average TFP growth by 0.96%. Fourthly, from the perspective of economics, it is believed that the group of migrant workers is not really covered in the official statistics of Chinese construction sector. Finally, the reasons for the above vast impact were discussed and analyzed, which indicated that the main reason for such an impact was the quality improvement of migrant workers obtained mainly throughout learning by doing.
On this basis, it is indispensable to emphasize the value of our study. In theory, our work enriches the body of knowledge on TFP measurement mainly by validating and revealing the reasons of migrant workers’ impact on TFP. In practice, our findings can provide valuable reference for making policies to improve TFP. For example, from a policy perspective, the training of migrant workers should be paid special attention. More importantly, these explored conclusions are universal and applicable to any country owning migrant workers.
The limitations of this study are appreciated. Firstly, we validated and explored the reasons of migrant workers’ impact on TFP. However, we did not discuss in detail and explain completely the mechanism of forming such impact, in particular revealing the mechanism by some quantitative formulas. Secondly, five important assumptions were used in this work, nevertheless, only assumption 1 and 2 were discussed and verified before the application. By convention, the remaining assumptions are used directly. Obviously, this may pose a certain threat to our conclusions. Last but not least, due to our research aim and design, it is indifferent to detailed discuss and analyze the results in Figure 3 and Figure 4, especially from a year by year perspective to discuss the evolution of SR. Undoubtedly, we may acquire more abundant information to support our findings if they are analyzed and revealed. Looking to the future, these limitations will be overcome.
Author Contributions
G.Y. had the idea and finished the conceptualization; G.Y. and Y.W. conceived and designed the research scheme; G.Y. and Y.Z. provided supervision; Y.W. performed the scheme; Y.W., H.X. and L.W. collected and analyzed the data; G.Y., Y.Z., H.X. provided the method of estimating capital stock; Y.W. and Y.F. wrote the paper; G.Y., Y.Z. and J.Z. modified the draft. All the authors approved the final manuscript.
Acknowledgments
The funding of this work from the Fundamental Research Funds for the Central Universities (No.2018CDXYJG0047, 2018CDJSK03PT17), Graduate Scientific Research and Innovation Foundation of Chongqing, China (No. CYB18065) and Social Science Planning Project of Chongqing, China (No.2018YBGL055, 2018ZD04) is gratefully acknowledged.
Conflicts of Interest
The authors declare no conflict of interest.
References
- Schumpeter, J.A. The Theory of Economic Development; Harvard University Press: Cambridge, MA, USA, 1934. [Google Scholar]
- Solow, R.M. Technical Change and the Aggregate Production Function. Rev. Econ. Stat. 1957, 39, 312–320. [Google Scholar] [CrossRef]
- King, R.G.; Rebelo, S.T. Transitional dynamics and economic growth in the neoclassical model. Am. Econ. Rev. 1993, 83, 908–931. [Google Scholar]
- Hellwig, M.; Irmen, A. Endogenous technical change in a competitive economy. J. Econ. Theory 2001, 101, 1–39. [Google Scholar] [CrossRef]
- Carraro, C.; Gerlagh, R.; van der Zwaan, B. Endogenous technical change in environmental macroeconomics. Resour. Energy Econ. 2003, 25, 1–10. [Google Scholar] [CrossRef]
- Wang, Y.Y.; Li, Z.F.; Shi, F. Factors Influencing Mechanism of Construction Development Transformation in China Based on SEM. Discret. Dyn. Nat. Soc. 2015, 2015, 219865. [Google Scholar] [CrossRef]
- Reijnders, L.S.M. Wealth, Wages, and Wedlock: Explaining the College Gender Gap Reversal. Scand. J. Econ. 2018, 120, 537–562. [Google Scholar] [CrossRef]
- Zhi, M.; Hua, G.B.; Wang, S.Q.; Ofori, G. Total factor productivity growth accounting in the construction industry of Singapore. Constr. Manag. Econ. 2003, 21, 707–718. [Google Scholar] [CrossRef]
- Liu, B.S.; Chen, Y.; Wang, R.; Shen, Y.H.; Shen, Q.P. Different interaction mechanisms of market structure in the construction industry TFP from the spatial perspective: A case study in China. Ksce J. Civ. Eng. 2016, 20, 23–33. [Google Scholar] [CrossRef]
- Li, Y.; Liu, C. Malmquist indices of total factor productivity changes in the Australian construction industry. Constr. Manag. Econ. 2010, 28, 933–945. [Google Scholar] [CrossRef] [Green Version]
- Wang, X.; Chen, Y.; Liu, B.; Shen, Y.; Sun, H. A total factor productivity measure for the construction industry and analysis of its spatial difference: A case study in China. Constr. Manag. Econ. 2013, 31, 1059–1071. [Google Scholar] [CrossRef]
- Xiaolong, X.; Qiping, S.; Yaowu, W.; Jinfeng, L. Measuring the Productivity of the Construction Industry in China by Using DEA-Based Malmquist Productivity Indices. J. Constr. Eng. Manag. 2008, 134, 64–71. [Google Scholar]
- Lee, Y.S.; Kim, J.J.; Lee, T.S. Measuring productivity changes in the Korean construction management industry. Ksce J. Civ. Eng. 2016, 20, 2154–2161. [Google Scholar] [CrossRef]
- Moriarty, E.; Wickham, J.; Krings, T.; Salamonska, J.; Bobek, A. ‘Taking on almost everyone?’ Migrant and employer recruitment strategies in a booming labour market. Int. J. Hum. Resour. Man. 2012, 23, 1871–1887. [Google Scholar] [CrossRef]
- Vakulenko, E.; Leukhin, R. Wage Dicrimination Against Foreign Workers in Russia. Ekon. Polit. 2016, 11, 121–142. [Google Scholar] [CrossRef]
- Wang, Z.K. China’s “labour shortage” and migrant workers’ lack of social security. Int. Labour Rev. 2014, 153, 649–658. [Google Scholar] [CrossRef]
- Chan, A.P.C.; Wong, F.K.W.; Hon, C.K.H.; Lyu, S.; Javed, A.A. Investigating ethnic minorities’ perceptions of safety climate in the construction industry. J. Saf. Res. 2017, 63, 9–19. [Google Scholar] [CrossRef] [PubMed]
- Dequiedt, V.; Zenou, Y. International migration, imperfect information, and brain drain. J. Dev. Econ. 2013, 102, 62–78. [Google Scholar] [CrossRef] [Green Version]
- Swider, S. Building China: Precarious employment among migrant construction workers. Work Eemploy. Soc. 2015, 29, 41–59. [Google Scholar] [CrossRef]
- Kerr, S.P.; Kerr, W.; Ozden, C.; Parsons, C. High-Skilled Migration and Agglomeration. Annu. Rev. Econ. 2017, 9, 201–234. [Google Scholar] [CrossRef] [Green Version]
- Srour, F.J.; Srour, I.; Lattouf, M.G. A survey of absenteeism on construction sites. Int. J. Manpow. 2017, 38, 533–547. [Google Scholar] [CrossRef]
- Tan, D.; Wang, G.; Cao, D. Growth characteristics and impacting factors of the total factor productivity in the construction industry. J. Tongji Univ. (Nat. Sci.) 2015, 43, 1901–1907. [Google Scholar]
- Chen, Y.; Liu, B.S.; Shen, Y.H.; Wang, X.Q. Spatial analysis of change trend and influencing factors of total factor productivity in China’s regional construction industry. Appl. Econ. 2018, 50, 2824–2843. [Google Scholar] [CrossRef]
- Kapelko, M.; Abbott, M. Productivity Growth and Business Cycles: Case Study of the Spanish Construction Industry. J. Constr. Eng. Manag. 2017, 143, 05016026. [Google Scholar] [CrossRef]
- Chau, K.W.; Walker, A. The measurement of total factor productivity of the Hong Kong construction industry. Constr. Manag. Econ. 1988, 6, 209–224. [Google Scholar] [CrossRef]
- Bernard, V.; Mohamed, A.-W. Measuring the Construction Industry’s Productivity Performance: Critique of International Productivity Comparisons at Industry Level. J. Constr. Eng. Manag. 2015, 141, 04014085. [Google Scholar]
- Zhan, W.; Pan, W.; Javed, A.A.; Chau, K.W. Correlation analysis of key influencing factors to the total factor productivity of the Hong Kong construction industry. In 21st International Conference on Advancement of Construction Management and Real Estate, CRIOCM 2016; Webster, C., Chau, K.W., Chan, I.Y.S., Lu, W., Eds.; Springer: Singapore, 2018; pp. 565–575. [Google Scholar]
- Rosenblum, M.R. Alternatives to Migration in the United States: Policy Issues and Economic Impact. Am. Behav. Sci. 2012, 56, 1101–1122. [Google Scholar] [CrossRef]
- Mendola, M. Migration and technological change in rural households: Complements or substitutes? J. Dev. Econ. 2008, 85, 150–175. [Google Scholar] [CrossRef] [Green Version]
- Wang, F.; Fan, J.; Reisner, A.; Mi, H. Health Consciousness, Smog Consciousness and Chinese Elderly Migrant Workers’ Preferred Retirement Place. Sustainability 2017, 9, 2016. [Google Scholar] [CrossRef]
- Zhang, L.; Sharpe, R.V.; Li, S.; Darity, W.A. Wage differentials between urban and rural-urban migrant workers in China. China Econ. Rev. 2016, 41, 222–233. [Google Scholar] [CrossRef]
- Zhang, L.; Wang, G.-X. Urban citizenship of rural migrants in reform-era China. Citizsh. Stud. 2010, 14, 145–166. [Google Scholar] [CrossRef]
- Chen, Y.; Tan, Y.; Zhang, Q. Rural migrants’ participation in old-age insurance: A case study of the inter-provincial migrant workers from Sichuan, China. Chin. J. Popul. Resour. Environ. 2017, 15, 120–131. [Google Scholar] [CrossRef]
- CBS(Chinese Bureau of Statistics). Chinese Annual Report on Migrant Workers in 2017. 2018. Available online: http://www.stats.gov.cn/tjsj/zxfb/201804/t20180427_1596389.html (accessed on 10 August 2018).
- Abdul-Rahman, H.; Wang, C.; Wood, L.C.; Low, S.F. Negative impact induced by foreign workers: Evidence in Malaysian construction sector. Habitat Int. 2012, 36, 433–443. [Google Scholar] [CrossRef] [Green Version]
- Lowe, J.G. The measurement of productivity in the construction industry. Constr. Manag. Econ. 1987, 5, 101–113. [Google Scholar] [CrossRef]
- Mankiw, N.G. Macroeconomics, 7th ed.; Worth Publishers: New York, NY, USA, 2009. [Google Scholar]
- Arbolino, R.; Carlucci, F.; Cira, A.; De Simone, L.; Ioppolo, G.; Yigitcanlar, T. Factors affecting transport privatization: An empirical analysis of the EU. Transp. Res. Part A Policy Pract. 2018, 110, 149–160. [Google Scholar] [CrossRef]
- Carlucci, F.; Cira, A.; Ioppolo, G.; Massari, S.; Siviero, L. Logistics and land use planning: An application of the ACIT indicator in European port regions. Land Use Policy 2018, 75, 60–69. [Google Scholar] [CrossRef]
- Chau, K.W. Estimating industry-level productivity trends in the building industry from building cost and price data. Constr. Manag. Econ. 1993, 11, 370–383. [Google Scholar] [CrossRef]
- Tan, W. Total factor productivity in Singapore construction. Eng. Constr. Archit. Manag. 2000, 7, 154–158. [Google Scholar] [CrossRef]
- Crawford, P.; Vogl, B. Measuring productivity in the construction industry. Build. Res. Inf. 2006, 34, 208–219. [Google Scholar] [CrossRef]
- Ruddock, L.; Ruddock, S. Evaluation of trends in the UK construction industry using growth and productivity accounts. Constr. Manag. Econ. 2011, 29, 1229–1239. [Google Scholar] [CrossRef]
- Chancellor, W. Drivers of productivity: A case study of the Australian construction industry. Constr. Econ. Build. 2015, 15, 85–97. [Google Scholar] [CrossRef]
- Will, C.; Weisheng, L. A Regional and Provincial Productivity Analysis of the Chinese Construction Industry: 1995 to 2012. J. Constr. Eng. Manag. 2016, 142, 05016013. [Google Scholar] [Green Version]
- De Jorge Moreno, J.; De Jorge Huertas, V.; Rojas Carrasco, O. Assessment of the efficiency of the Spanish construction industry using parametric methods: Case study. J. Constr. Eng. Manag. 2016, 142, 05016008. [Google Scholar] [CrossRef]
- Ozyurt, S. Total Factor Productivity Growth in Chinese Industry: 1952–2005. Oxf. Dev. Stud. 2009, 37, 1–17. [Google Scholar] [CrossRef]
- Ye, G.; Wang, Y.; Wang, H.; Fu, Y.; Gong, X. Research on innovation-driven development performance in Chinese construction industry during post-financial crisis era. J. Nanchang Inst. Technol. 2018, 37, 76–83. [Google Scholar]
- Silaghi, M.I.P.; Alexa, D. Sources of Growth: Evidence from Ten Central and Eastern European Countries during 1993–2008. Panoeconomicus 2015, 62, 643–661. [Google Scholar]
- Park, J. Total factor productivity growth for 12 Asian economies: The past and the future. Jpn. World Econ. 2012, 24, 114–127. [Google Scholar] [CrossRef]
- Paquet, A.; Robidoux, B. Issues on the measurement of the Solow residual and the testing of its exogeneity: Evidence for Canada. J. Monet. Econ. 2001, 47, 595–612. [Google Scholar] [CrossRef]
- Burda, M.C.; Severgnini, B. Solow residuals without capital stocks. J. Dev. Econ. 2014, 109, 154–171. [Google Scholar] [CrossRef] [Green Version]
- Feng, C.; Wang, M.; Liu, G.C.; Huang, J.B. Green development performance and its influencing factors: A global perspective. J. Clean. Prod. 2017, 144, 323–333. [Google Scholar] [CrossRef]
- Li, K.X.; Jin, M.; Qi, G.; Shi, W.; Ng, A.K.Y. Logistics as a driving force for development under the Belt and Road Initiative—The Chinese model for developing countries. Transp. Rev. 2018, 38, 457–478. [Google Scholar] [CrossRef]
- Du, M.Z.; Wang, B.; Wu, Y.R. Sources of China’s Economic Growth: An Empirical Analysis Based on the BML Index with Green Growth Accounting. Sustainability 2014, 6, 5983–6004. [Google Scholar] [CrossRef] [Green Version]
- Wang, Z.; Feng, C. A performance evaluation of the energy, environmental, and economic efficiency and productivity in China: An application of global data envelopment analysis. Appl. Energy 2015, 147, 617–626. [Google Scholar] [CrossRef]
- Wang, Y.; Zhang, S.; Yang, J.; Xiaoyu, T. Research on the paths of cultivating the spirit of the craftsman for construction industry under the New Normal. Constr. Econ. 2018, 39, 14–19. [Google Scholar]
- Solow, R.M. Investment and Technical Progress; Stanford University Press: Palo Alto, CA, USA, 1959. [Google Scholar]
- Romer, P.M. Crazy Explanations for the Productivity Slowdown. Nber Macroecon. Annu. 1987, 2, 163–202. [Google Scholar] [CrossRef] [Green Version]
- Mankiw, N.G.; Romer, D.; Weil, D.N. A Contribution to the Empirics of Economic-Growth. Q. J. Econ. 1992, 107, 407–437. [Google Scholar] [CrossRef]
- Mankiw, N.G. Principles of Economics; Cengage Learning: Stanford, CT, USA, 2013; Volume 36, pp. 257–272. [Google Scholar]
- Schadler, S.; Mody, A.; Abiad, A.; Leigh, D. Growth in the central and eastern European countries of the European Union. IMF Occa. Pap. 2006, 252, 1–52. [Google Scholar]
- Cao, K.H.; Birchenall, J.A. Agricultural productivity, structural change, and economic growth in post-reform China. J. Dev. Econ. 2013, 104, 165–180. [Google Scholar] [CrossRef] [Green Version]
- Kangasniemi, M.; Mas, M.; Robinson, C.; Serrano, L. The economic impact of migration: Productivity analysis for Spain and the UK. J. Prod. Anal. 2012, 38, 333–343. [Google Scholar] [CrossRef]
- Feyrer, J. The US productivity slowdown, the baby boom, and management quality. J. Popul. Econ. 2011, 24, 267–284. [Google Scholar] [CrossRef]
- Dunbar, G.R.; Easton, S.T. Working parents and total factor productivity growth. J. Popul. Econ. 2013, 26, 1431–1456. [Google Scholar] [CrossRef]
- Hopkins, B. Analysing the ‘migrant work ethic’—Comparing managers’ perceptions of local workers and Central and Eastern European migrants in the United Kingdom. Eur. Urban Reg. Stud. 2017, 24, 442–452. [Google Scholar] [CrossRef]
- Combes, P.P.; Démurger, S.; Li, S. Migration externalities in Chinese cities. Eur. Econ. Rev. 2015, 76, 152–167. [Google Scholar] [CrossRef] [Green Version]
- Yuan, J.F.; Yi, W.; Miao, M.Y.; Zhang, L. Evaluating the Impacts of Health, Social Network and Capital on Craft Efficiency and Productivity: A Case Study of Construction Workers in China. Int. J. Environ. Res. Public Health 2018, 15. [Google Scholar] [CrossRef] [PubMed]
- Wang, T.; Li, Y.L.; Zhang, L.M.; Li, G.J. Case Study of Integrated Prefab Accommodations System for Migrant On-Site Construction Workers in China. J. Prof. Issues Eng. Educ. Pract. 2016, 142, 05016005. [Google Scholar] [CrossRef]
Figure 1.
The research design and scheme.

Figure 2.
The process of data collection.

Figure 3.
Slow Residual (SR) measurement in Scenario A.
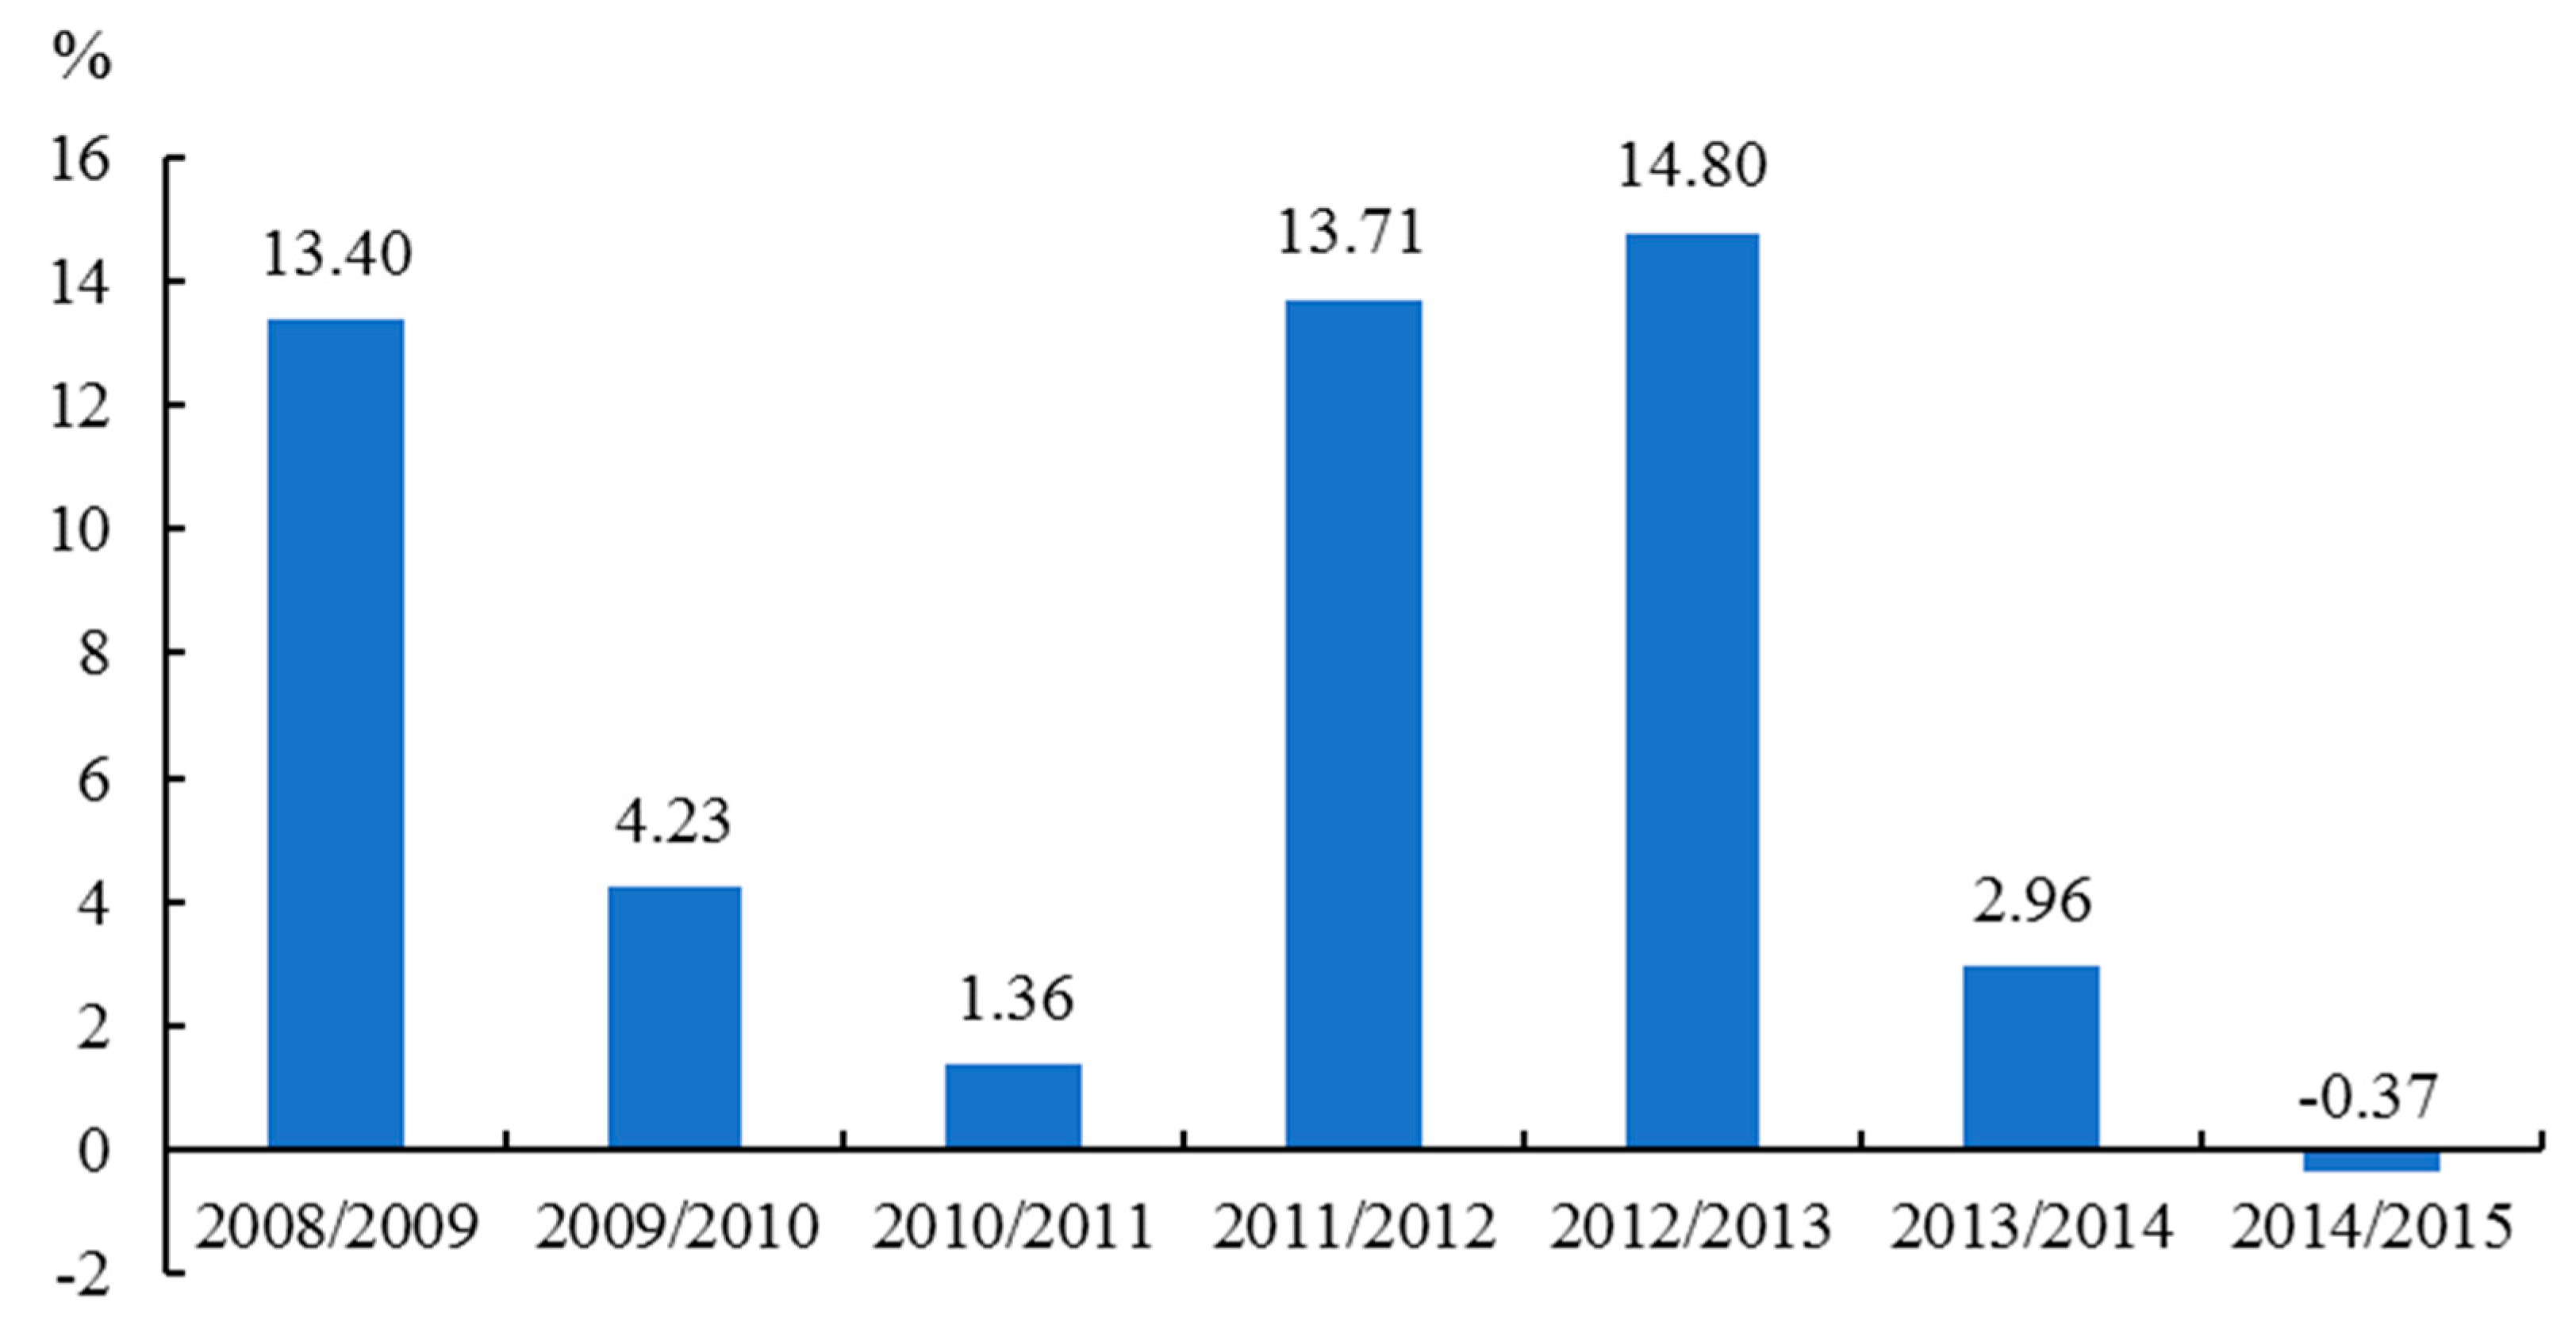
Figure 4.
SR measurement in Scenario B.


Table 1.
Review of the Literature on total factor productivity (TFP) Measurement at the Industry Level.
Table 1.
Review of the Literature on total factor productivity (TFP) Measurement at the Industry Level.
| Author(s) | Method | Input-output Factor (Indicator) System |
|---|---|---|
| Zhi et al. [8] | Production function | 3 inputs: labor (hours worked), capital (fixed assets), intermediate (real value); 1 output: total value added |
| Liu et al. [9] | DEA-Malmquist | 2 inputs: total assets, operational investment; 2 outputs: total pre-tax profits, profits of projects settlement accounts |
| Li et al. [10] | DEA-Malmquist | 2 inputs: labor (number of employees), capital (construction work done); 1 output: total value added |
| Wang et al. [11] | DEA-Malmquist | 3 inputs: labor (number of employees), capital (total assets), total power of machinery and equipment owned; 2 outputs: total value added and output value |
| Xiaolong et al. [12] | DEA-Malmquist | 2 inputs: labor (number of employees), capital (fixed assets); 1 output: total value added |
| Lee et al. [13] | Malmquist | 2 inputs: labor (number of employees), capital (total assets); 2 outputs: total revenue, market share |
| Tan et al. [22] | DEA-Malmquist | 2 inputs: labor (number of employees), capital (total assets); 1 output: total value added |
| Kapelko et al. [24] | DEA-Malmquist | 3 inputs: labor (employee costs), capital (fixed assets), material (costs); 1 output: total revenue |
| Chau et al. [25] | Production function | 4 inputs: labor, material, plant and equipment, overheads; 1 output: gross output |
| Bernard et al. [26] | Production function | 3 inputs: labor (hours worked), capital (-), material (-); 1 output: total value added |
| Lowe [36] | Production function | 2 inputs: labor and capital; 1 output: total output |
| Chau [40] | Production function | 2 (3) inputs: labor, capital, or intermediate; 1 output: gross output value or total value added |
| Tan [41] | Production function | 2 inputs: labor (labor hours), capital (fixed assets); 1 output: total value added |
| Crawford et al. [42] | Production function | 3 inputs: labor (hours worked), capital (non-ICT assets), material (-); 1 output: total value added |
| Ruddock et al. [43] | Production function | 3 inputs: labor (hours worked), capital (non-ICT & ICT assets), intermediate (-); 1 output: total value added |
| Chancellor [44] | DEA | 2 inputs: labor input (number of employees), capital input (capital stock); 1 output: total value added |
| Will a et al. [45] | Färe-Primont DEA | 4 inputs: number of employees, paid up total capital, total assets, total power of machinery and equipment owned; 2 outputs: output value, floor space of buildings completed |
| Moreno et al. [46] | Production function | 3 inputs: labor (number of employees), capital (fixed assets), material (costs); 1 output: total sales |
Table 2.
The related data of input and output from 2008 to 2015.
| Indicator | Year | |||||||
|---|---|---|---|---|---|---|---|---|
| 2008 | 2009 | 2010 | 2011 | 2012 | 2013 | 2014 | 2015 | |
| Total value added (Billion yuan RMB) | 1248.89 | 1535.87 | 1754.67 | 1836.39 | 2162.95 | 2660.54 | 2819.37 | 2969.29 |
| Fixed assets (Billion yuan RMB) | 336.93 | 375.64 | 401.61 | 420.60 | 456.49 | 493.01 | 507.29 | 531.31 |
| Number of employees (10 thousands of persons) | 3224.33 | 3493.76 | 3916.50 | 4006.46 | 4059.86 | 4397.80 | 4532.67 | 4815.32 |
| Salaries of employees (Billion yuan RMB) | 730.63 | 949.11 | 1130.64 | 1308.15 | 1635.28 | 2109.97 | 2215.04 | 2274.19 |
| Number of migrant workers (10 thousands of persons) | 2955.26 | 3318.02 | 3704.91 | 4250.50 | 4590.42 | 5671.94 | 5803.63 | 5561.89 |
| Salaries of migrant workers (Billion yuan RMB) | 444.27 | 528.40 | 706.56 | 992.22 | 1206.12 | 1664.91 | 1910.56 | 1970.62 |
Table 3.
The share of labor input under two scenarios.
| Year | ||||||||
|---|---|---|---|---|---|---|---|---|
| 2008 | 2009 | 2010 | 2011 | 2012 | 2013 | 2014 | 2015 | |
| Scenario A | 0.59 | 0.61 | 0.60 | 0.59 | 0.62 | 0.64 | 0.63 | 0.63 |
| Scenario B | 0.69 | 0.71 | 0.71 | 0.72 | 0.74 | 0.76 | 0.76 | 0.76 |
Table 4.
The accumulative impact of migrant workers on TFP during the surveyed period.
| Indicator (%) | Scenario A | Scenario B | The Impact of Migrant Workers |
|---|---|---|---|
| (1) | (2) | (3) = (2) − (1) | |
| Accumulative TFP growth | 60.44 | 70.86 | 10.42 |
| Annual average TFP growth | 6.99 | 7.95 | 0.96 |
Table 5.
The accumulative impact of migrant workers on TFP during the sub-period.
| Accumulative TFP Growth (%) | Scenario A | Scenario B | The Impact of Migrant Workers |
|---|---|---|---|
| (1) | (2) | (3) = (2) − (1) | |
| T1(2008/2009-2010/2011) | 19.80 | 22.07 | 2.27 |
| T2(2011/2012-2012/2013) | 36.59 | 32.68 | −3.91 |
| T3(2013/2014-2014/2015) | 4.05 | 16.11 | 12.06 |
| T(2008/2009-2014/2015) | 60.44 | 70.86 | 10.42 |
© 2019 by the authors. Licensee MDPI, Basel, Switzerland. This article is an open access article distributed under the terms and conditions of the Creative Commons Attribution (CC BY) license (http://creativecommons.org/licenses/by/4.0/).
Share and Cite
MDPI and ACS Style
Ye, G.; Wang, Y.; Zhang, Y.; Wang, L.; Xie, H.; Fu, Y.; Zuo, J. Impact of Migrant Workers on Total Factor Productivity in Chinese Construction Industry. Sustainability 2019, 11, 926. https://doi.org/10.3390/su11030926
AMA Style
Ye G, Wang Y, Zhang Y, Wang L, Xie H, Fu Y, Zuo J. Impact of Migrant Workers on Total Factor Productivity in Chinese Construction Industry. Sustainability. 2019; 11(3):926. https://doi.org/10.3390/su11030926
Chicago/Turabian StyleYe, Gui, Yuhe Wang, Yuxin Zhang, Liming Wang, Houli Xie, Yuan Fu, and Jian Zuo. 2019. "Impact of Migrant Workers on Total Factor Productivity in Chinese Construction Industry" Sustainability 11, no. 3: 926. https://doi.org/10.3390/su11030926
Note that from the first issue of 2016, this journal uses article numbers instead of page numbers. See further details here.