Article

Livelihoods Strategies and Household Resilience to Food Insecurity: A Case Study from Rural Tunisia

1
Rural Economic Department, National Agronomic Research Institute of Tunisia (INRAT), Avenue Hedi Karray, Tunis-Menzah 1004, Tunisia
2
Resilient Agricultural Livelihood Systems Program–RALSP, International Center for Agricultural Research in the Dry Areas–ICARDA, Amman 950764, Jordan
*
Author to whom correspondence should be addressed.
Sustainability 2019, 11(3), 907; https://doi.org/10.3390/su11030907
Submission received: 23 December 2018 / Revised: 15 January 2019 / Accepted: 17 January 2019 / Published: 11 February 2019
(This article belongs to the Section Sustainable Agriculture)

Abstract

:
Due to the decrease of household incomes, the increase of food prices, and the negative effects of climate change on agricultural production, Tunisia faces a food insecurity challenge, especially in rural and arid areas. The purpose of our research is to understand and explore household resilience to food insecurity in two villages, Selta and Zoghmar, in central Tunisia. A cross-sectional survey of 250 sample households was conducted in the villages. Factor analysis and regression models were employed to analyze the data using SPSS version 21. The results indicate that only around 36% of the households were resilient at different levels. In Selta, 62.8% and in Zoghmar 66.7% of the households were vulnerable. As indicated by the factor loadings and beta coefficients, income and food access, adaptive capacity, and the social safety net were important dimensions of household resilience to food insecurity, being positively correlated with the resilience index. However, asset possession, and climate change negatively affect household resilience. Therefore, interventions must target strategies that address the different levels of resilience reflected by the resilience estimators. These estimators were generated by focusing mainly on building farmers’ knowledge of how to face the different difficulties and challenges.

1. Introduction

Tunisia, a Mediterranean country bordered by the Sahara, has a variable climate with alternating periods of drought and intense rainfall that generate runoff and inflows of water. These flows are sometimes very important. Tunisia is subjected to an irregular climate and is also characterized by high aridity. In fact, climate projections indicate rising temperatures, changes in rainfall patterns, changes in the frequency of extremes, a rising sea level, and intensification of desertification. Undoubtedly, these changes will increase the country’s environmental and socio-economic vulnerability [1]. This is in a country where agriculture is its backbone, economically speaking. Agriculture constitutes 10% of gross domestic product and employs 18% of the active population. Tunisia also suffers from an over-exploitation of ground water. It mobilizes most of its productive natural resources; using 4.3 million ha of its 4.5 million ha of arable land [2]. Agricultural production remains very dependent on the climatic conditions that influence rain-fed agriculture, particularly in the central and Southern regions. This makes water resources the most valuable economic and environmental ‘good’ for Tunisia. With less than 500 m3/inhabitant/year, the country is already in a situation of water scarcity. Tunisian agriculture is very vulnerable to climate change [3]. As a result, the area under cereal crops will decline because of this. Similarly, the tree farming area for the dried fruit species will decline in terms of its relative importance at the national level—particularly in the central and Southern regions. In addition, the number of livestock (cattle, sheep, and goats) is likely to decrease as well. The largest decreases would be felt mainly in the center and the South of the country because of the restriction of the grazing space, decline of feed production, and diseases caused by climate change-driven new pathogens [4]. Sidi Bouzid governorate, located in central Tunisia, is characterized by a large and rapidly increasing food and feed shortage, highly variable income levels, and limited natural resources—particularly arable land and water. The inhabitants are poor, most are socially disadvantaged, and disfavored in terms of infrastructural and institutional support.
This calls for urgent measures to be taken to challenge the imposed food insecurity situations. Indeed, this requires a global approach in terms of resilience, where all its dimensions should be included. However, empirical research on food insecurity in Tunisia, in general, and in the arid area, in particular, is scarce.
As a concept, references to resilience can be found in more than one discipline—art, literature, law, psychology, and engineering [5] are some examples. This reflects its wide variety of meanings and definitions [6]. It was considered as new in the social sciences [7], but has now become one of the keywords in recent scholarly and policy debates on food security [8]. At the Food and Agriculture Organization (FAO) in 2008, a well-built formulation of the concept for studying food systems and food security was started following the novel contribution of Alinovi et al. [9].
The objective of this study is to identify and analyze the main dimensions of household resilience to food insecurity and compare the results between two villages, Zoghmar and Selta, in Sidi Bouzid. The important contributions identified in this study can serve policy makers to build household resilience to food insecurity in rural and arid areas.

2. Materials and Methods
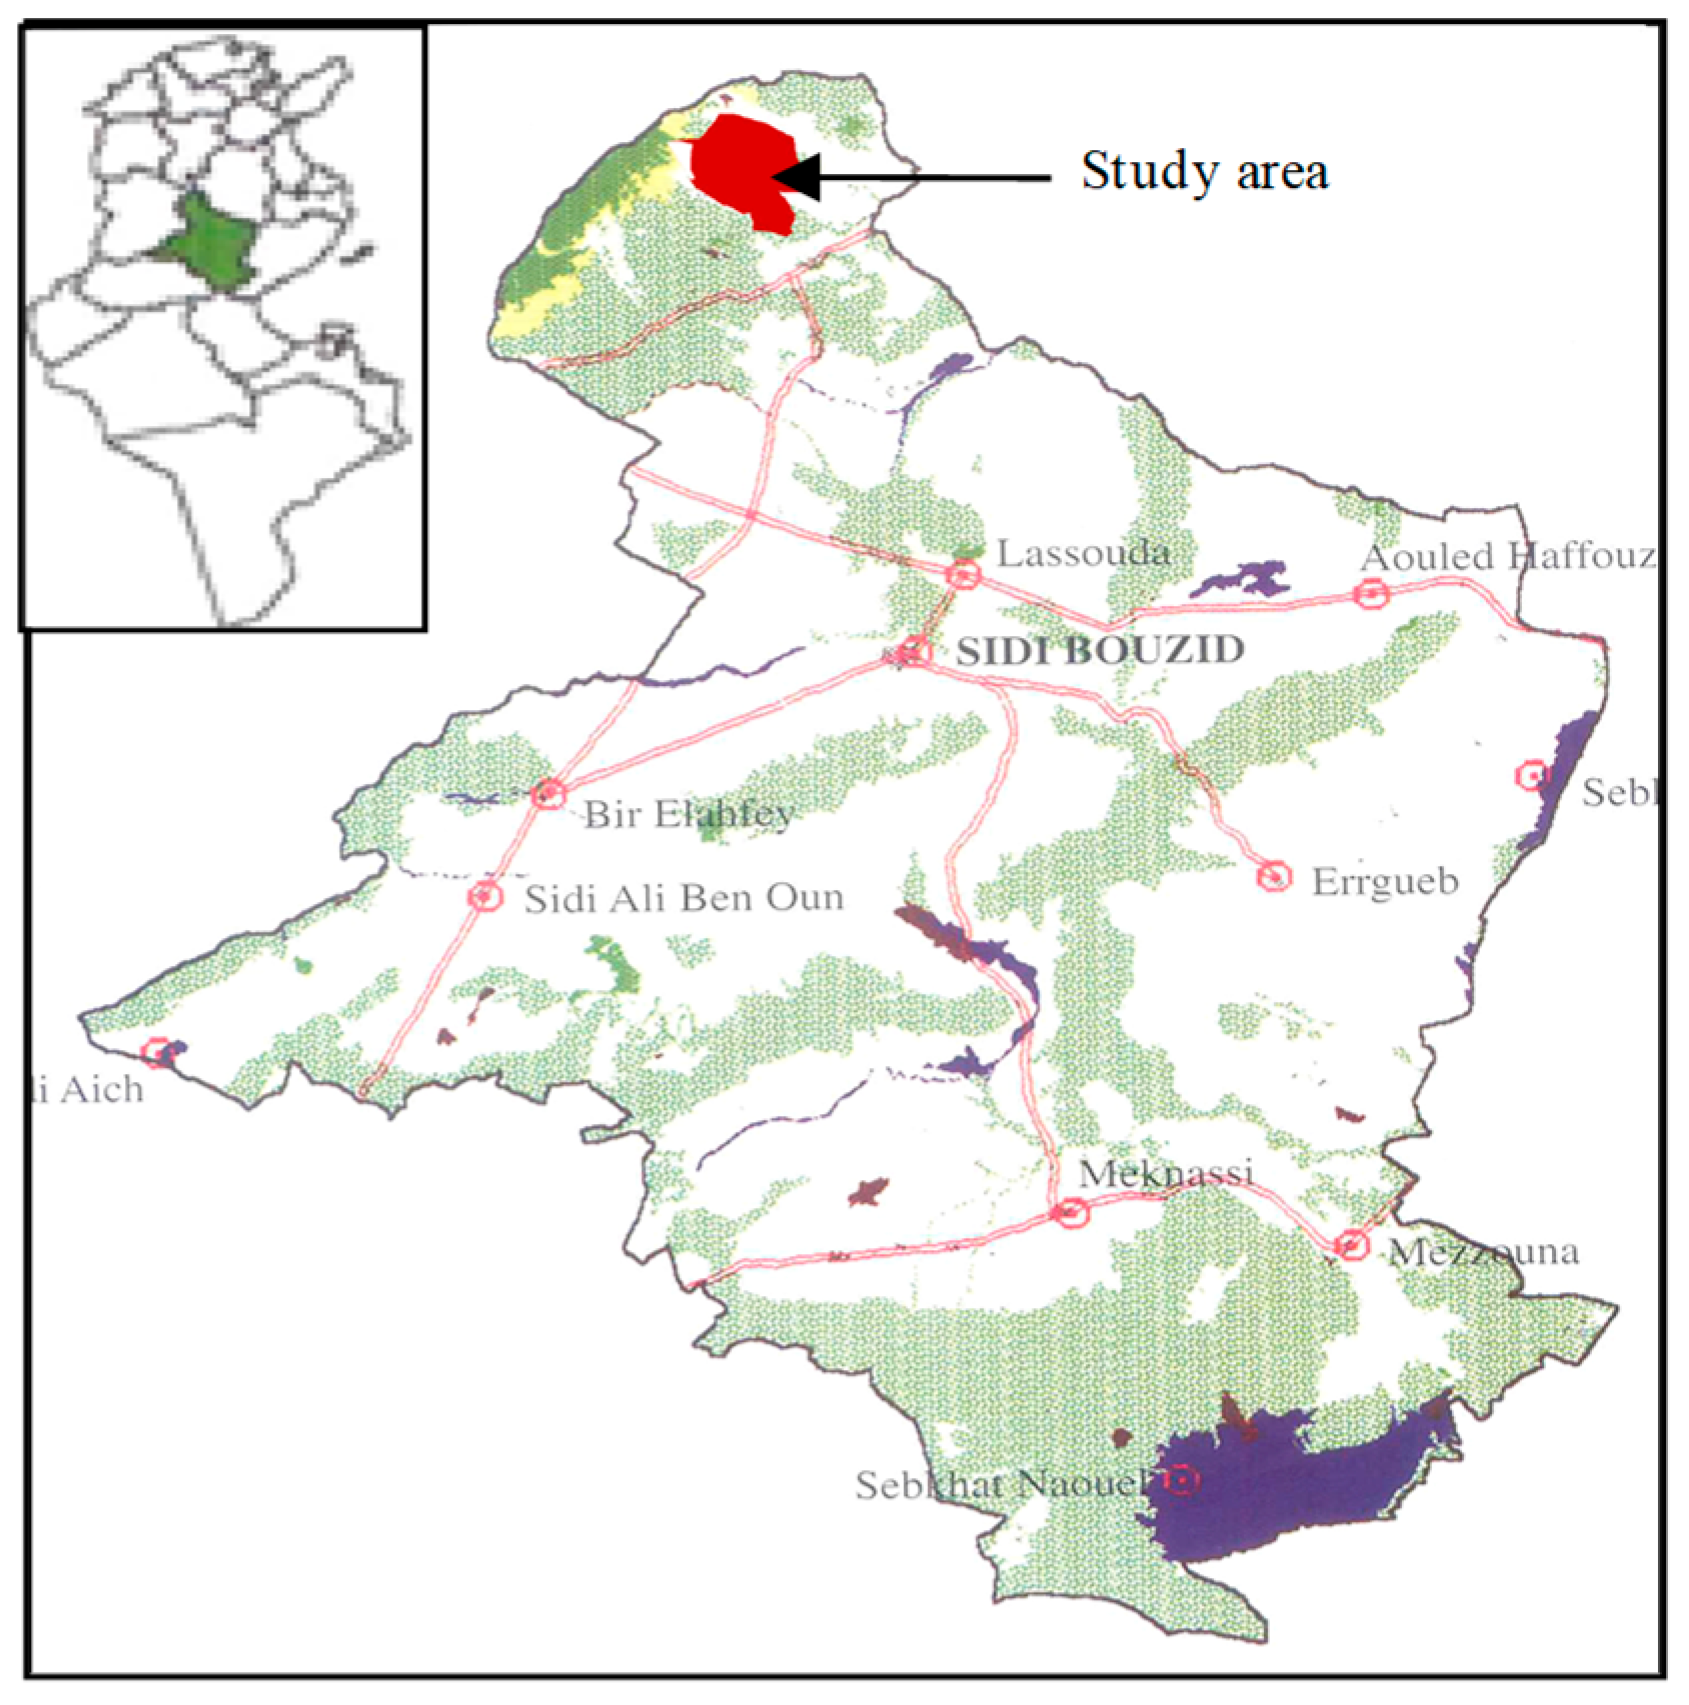
2.1. Study Area

Sidi Bouzid governorate is in central Tunisia. It covers an area of 7405 km2 and it has an arid climate with an annual rainfall of between 200 and 300 mm. It is divided into 12 districts, 10 municipalities, 111 sub-districts, and 12 rural councils (Figure 1). Sidi Bouzid governorate is characterized by low levels of economic activity, a high incidence of drought, and a high concentration of rural population (75%). For many years, it was disfavored in terms of infrastructural and institutional support besides having limited natural resources, particularly arable land and water. A large number of small farmers derive most of their family incomes from a barley/livestock-based system. Sidi Bouzid is typical of the barley-sheep belt in central Tunisia and across North Africa. Barley is a drought tolerant crop and local sheep are very much adapted to the prevailing climate conditions. Sheep fattening practice is quite profitable in the region. According to national statistics, Sidi Bouzid is ranked number one nationwide in terms of collected milk, with a contribution of 293,000 L/day (11 to 15% of the national volume). The dairy cattle population is about 35,000 cows, which are owned by the majority of the small producers (≤6 cows). The daily production volume per farm is between 20 to 60 L [10].

2.2. Data Collection and Analysis Procedure

The data used in this empirical application have been collected through two random sample surveys conducted in Zohmar and Selta sub-districts of Sidi Bouzid Governorate. Primary data were obtained through farmer interviews using a structured questionnaire. A socioeconomic questionnaire was also used to collect information required to study characteristics of the communities within the geographical area of interest. From a Rapid Rural Appraisal (RRA), field visits and expert consultations have a simple random sampling approach was used to select a representative sample of 250 households within the two sub-districts (Zoghmar, 105 and Selta, 145).
The questionnaire was designed and developed by the socio-economic teams both at the International Center for Agricultural Research in the Dry Areas (ICARDA) and the Tunisian National Research Agronomic Institute (INRAT). The questionnaire was pre-tested, modified, and implemented within the two regions. Data covers information on household head’s background, demographic characteristics, financial, physical, natural and social capitals, household gross income, agricultural production, farmers’ practices and inputs used, utilization of farm production, access and management of water resources, livestock production and management, food security, and access to credit. Information on system vulnerability and local coping mechanisms used by households were also collected. The analysis was conducted using SPSS® (IBM) version 21.
The approach adopted was characterized by the steps taken to generate the RI model. These steps included developing a theoretical framework, identifying and developing relevant variables, standardizing to allow for comparison, weighting and aggregating the variables, and conducting uncertainty measures to gauge the robustness of the variables.

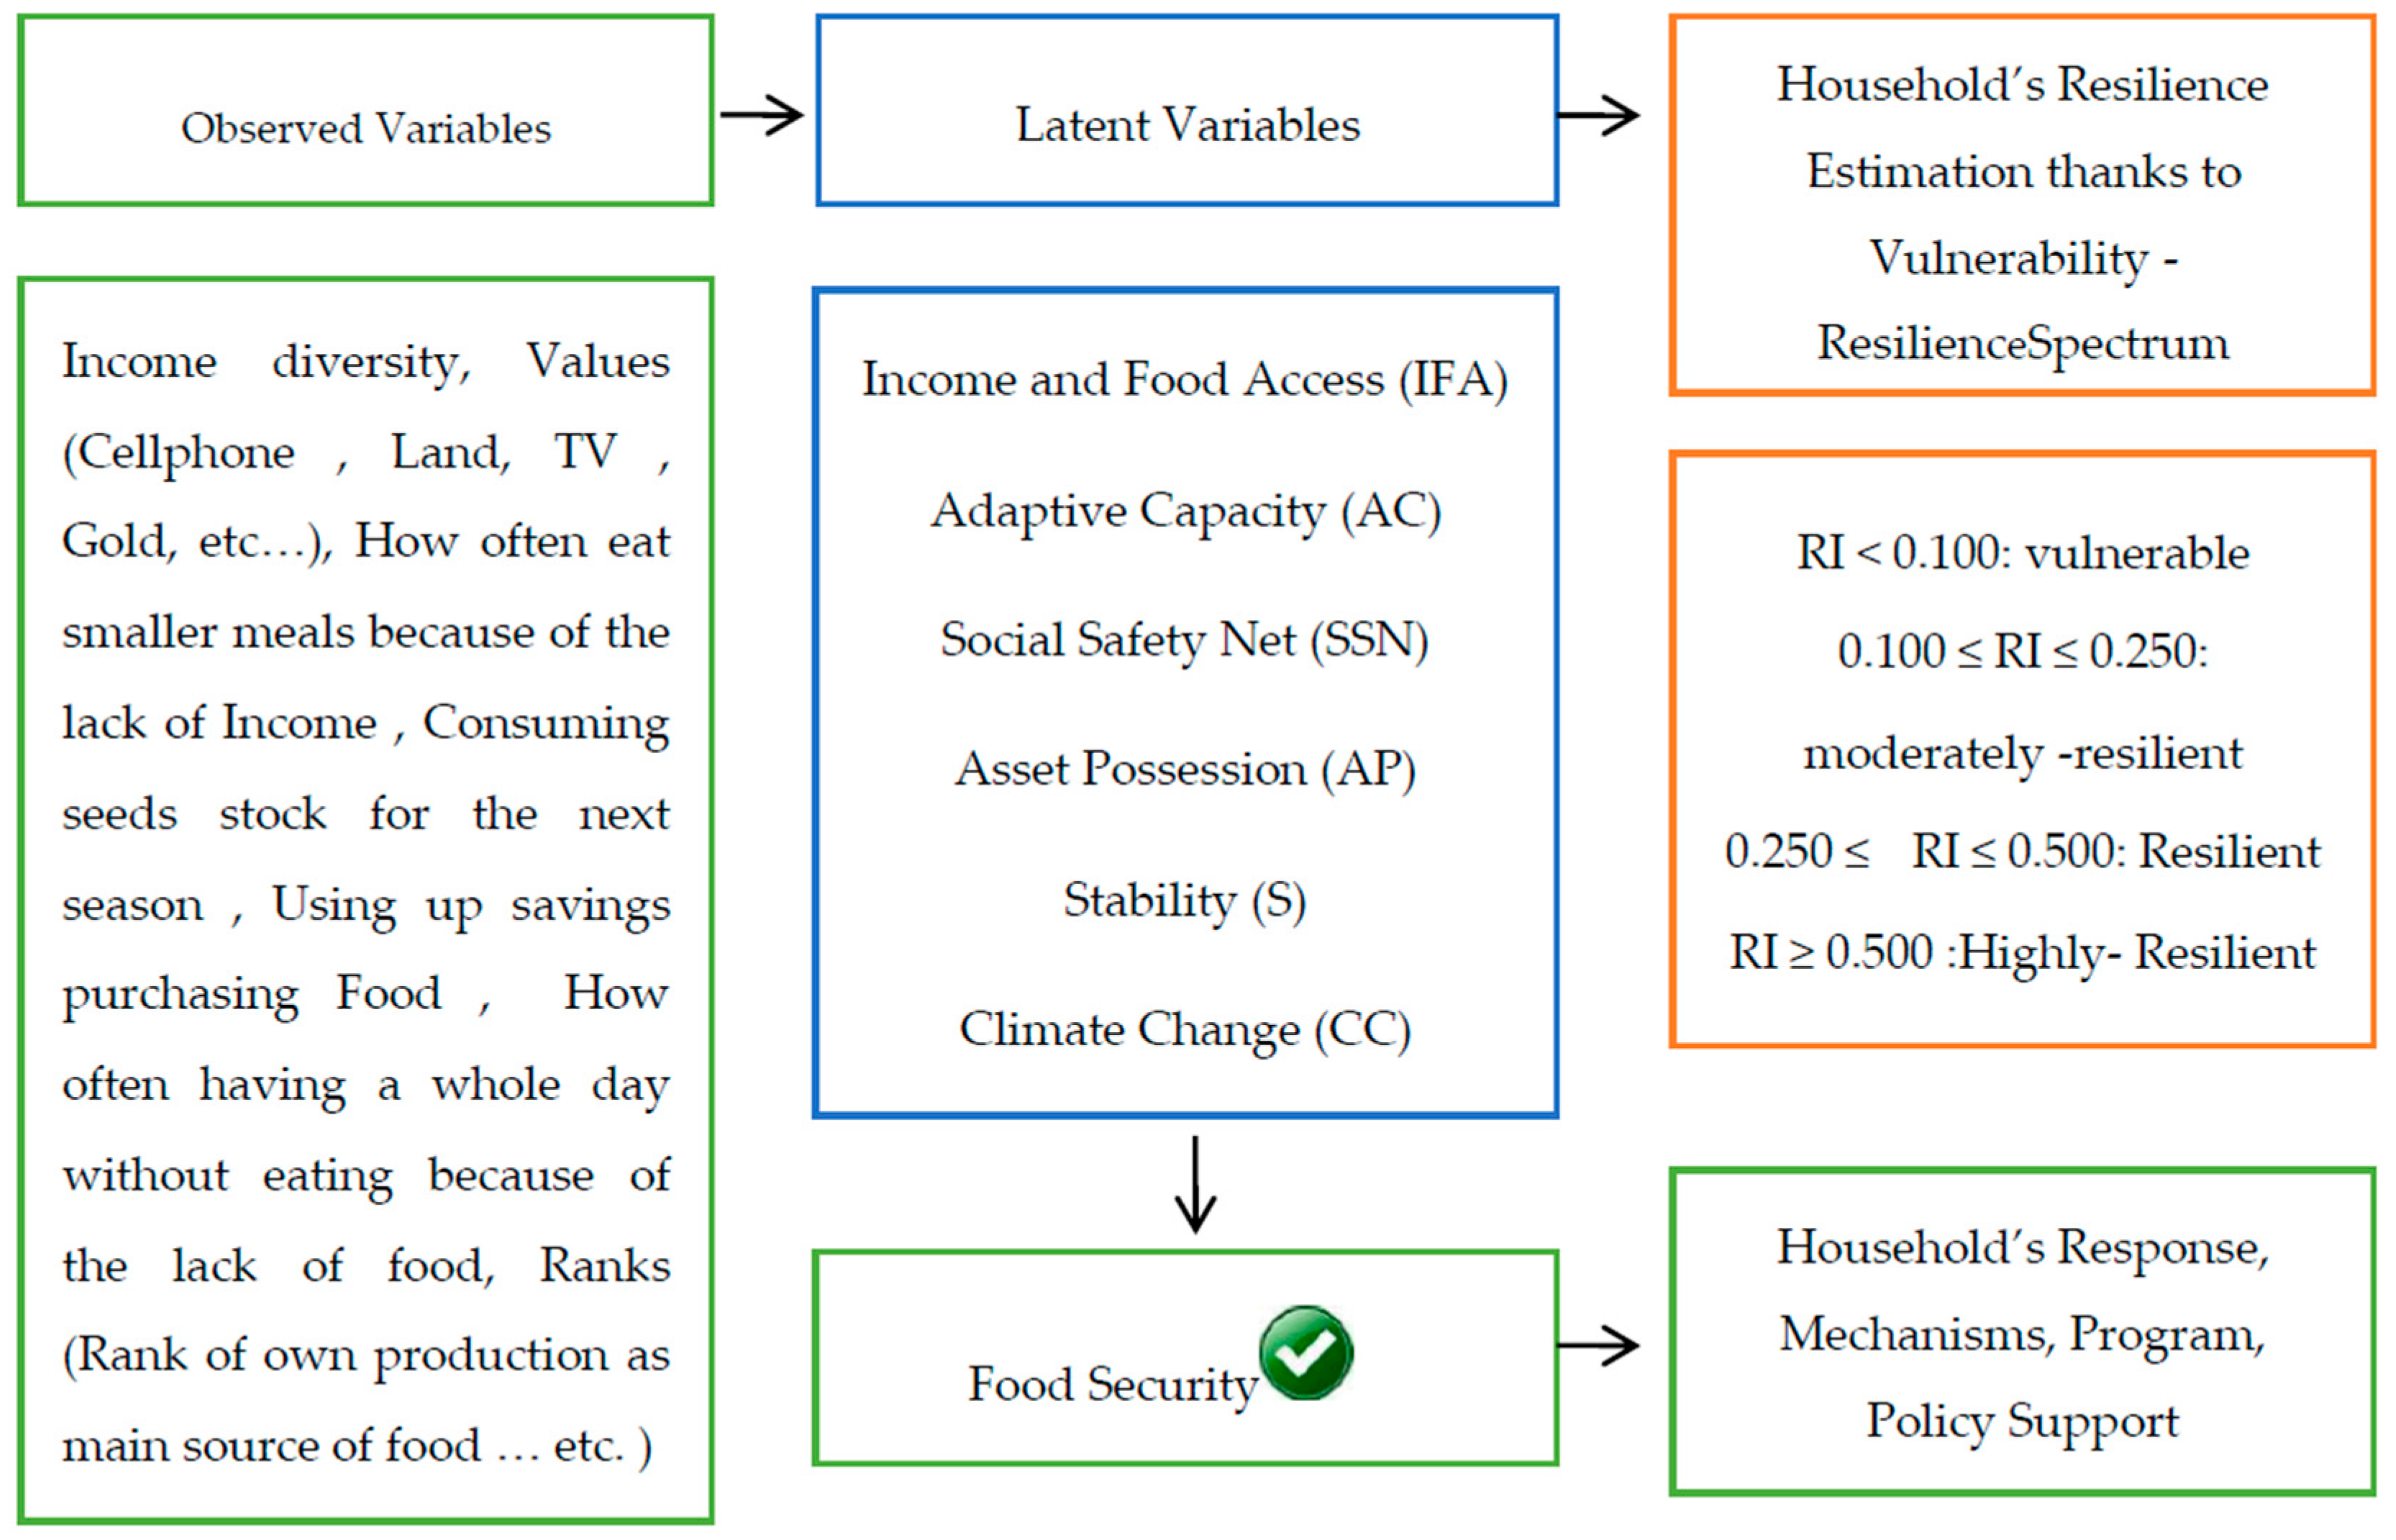
2.3. Empirical Model

When it comes to household resilience, it has at its core the notion of complex dynamic processes that aptly describes the nature and dynamics of vulnerability and changes [11]. As for its origins, the term “resilience” implies strength and resistance, but more recent applications in ecology, socio-ecological systems, disaster management, and urban sustainability, emphasize that resilience requires flexibility, learning, and change [12]. Actually, building resilience in the context of a household and/or a community requires full participation at the community level. It is built through community decision making identifying the appropriate interventions and determining what constitutes success at the community level. “A resilient system has the capacity to respond positively to change, maintaining or improving function” [13]. In fact, in order to define resilience, it is necessary to clarify conceptual and theoretical relations with several concepts—vulnerability, stability, sustainability, adaptability capacity, robustness, and transformability [14].
The choice of the resilience approach is not arbitrary. Developing and refining models in food security research and studies has resulted in resilient systems that also involve households as components. These components are not passive and simply sub-systems, but also, they are adaptive complex approaches [7]. These have as origins the vulnerability approach and the many flaws and weaknesses such models involve [9]. Resilience thinking is a systemic thinking [14]. Resilience thinking therefore necessarily includes a system thinking, while a system thinking does not imply application of the concepts from resilience thinking. The household is an essential component of the food system that is in continuous interaction with its environment (economical, ecological, cultural, institutional, technological, etc.). In the case of food insecurity, households make important decisions to improve their resilience, thereby reorganizing the functioning of the food system. Improving the food system resilience necessarily depends on how decision-makers decipher the feedback of households to shocks and how they can incorporate it into their intervention measures.
A helpful framework for household resilience to food security has been provided by researchers at the FAO, as mentioned earlier. The analytical framework used in this paper is based on it (Figure 2). Household resilience to food insecurity is a latent variable observable per se [15]. This latent variable is a function of eight other variables, themselves latent, and estimated from a given number of observed variables. Figure 1 shows the analytical framework that represents a rational measuring of the households’ resilience to food insecurity. This model of a household’s resilience index can be expressed mathematically as:
RI = f (AC, AP, SSN, IFA, S, CC)
where RI is the resilience index, AC is the adaptive capacity, AP is asset possession, SSN is the social safety net, IFA is income and food access, S is stability, and CC is climate change. Burton [16] argues that there are two fundamental and important tasks or steps to be taken when it comes to furthering resilience scholarship. The first is the measurement tools in order to better understand the factors contributing to resilience and the second is the selection of the relevant factors of resilience to a particular shock [14].
A consensus on how to measure resilience has not been reached among researchers. While some researchers employ qualitative techniques [18], others construct an RI and statistically measure the relative status of the household resilience. In this current paper, quantitative techniques are employed to measure the status of a households’ resilience to seasonal food insecurity. The main tool used to perform the analysis is a series of multivariate techniques (principal component analysis, factor analysis, and optimal scaling). Bartlett’s [19] scoring methods were used to analyze the data. If the observed variables are measured on a continuous scale, principal component analysis is used to select the parsimonious variables used to estimate the first latent variables. Otherwise the optimal scaling method is used. The initial phase of variable selection was based on the literature and the researchers’ experience of the study area.
In addition to its use in variable selection, optimal scaling was used to estimate the factor scores of the latent dimensions from dummy variables. Factor analysis, using principal axis factoring, was used to estimate such scores from the continuous variables. The variance accounted for in each factor in the solution was computed from the eigenvalue used to estimate the weighted scores of each latent variable and the overall RI for each household. This is, per se, also a latent indicator. That is the indices of each household were generated weighting the scores using the following simple formula:
RIn = ∂1 Factor 1 + ∂2 Factor 2 + ∂3 Factor 3 + … + ∂n Factor n
where RIn is the resilience index of the nth household, ∂n is the variance explained by each factor, factors1, 2, 3 … n are the respective factors generated by the factor analysis representing each latent dimension.

3. Results and Discussion

3.1. Estimation of the Latent Indicators

Before building the RI, some latent indicators were estimated based on the data survey. As explained in the conceptual framework, identification of the relevant variables is a basic requirement for designing effective future policy and intervention objectives in Sidi Bouzid. For this purpose, two steps of analysis were undertaken. First, relevant multivariate analyses were run (i.e., principal components/factor analysis for continuous variables and optimal scaling for non-continuous ones) using the available indicators of each latent dimension separately [17]. Then, relevant variables were selected based on the factor loadings and other statistical criteria. These criteria included Kaiser-Meyer-Olkin (KMO) statistics of sampling adequacy and Bartlett’s test of sphericity, communalities, and variance explained by the factor generated. Secondly, these variables were used to estimate the respective final latent dimensions that are later used to estimate the overall RI. In light of these, the following observed variables were identified, defined, and used to estimate their respective latent dimensions.

3.1.1. Income and Food Access (IFA)

It is important that the latent dimension of the household’s resilience is related directly to the household’s capacity to access food. Traditionally, this has been measured by income [17]. However, in this current study, our focus was set not only on the existing literature measuring the IFA, but also on other generated indicators that seemed essential to reflect the reality of the farmers facing food insecurity.
The carefully chosen indicators estimating IFA are:
  • Total income per day per person (TIPDPP). This is a continuous included observed variable measuring the IFA. Its calculation is based on the different sources of income (livestock income, crop income, and other income)
  • Storage after harvest (SAH). The quantity of grain held in stock (quintals (1 quintal = 100 kg))
  • Diversity (D). This measure is based on the number of days/month, on average, that the household consumes certain items, such as wheat, barley, other cereal (rice, sorghum, millet, maize, etc.), roots and tubers (potatoes and sweet potatoes), legumes, sugar or sugar products, groundnuts or cashew nuts, etc.
  • Index adaptation strategy (IAS). This was estimated from the average number of coping strategies available to the household when it lacks food—purchasing food on credit to overcome daily food insecurity, borrowing food, seeking help from relatives or the community, adults eating less so that children can eat more, consuming seeds saved for next season, etc. Its value lies between 0 and 1 where 0 equates to no coping strategy and 1 equates to a maximum of 11 coping strategies
  • Food access (FA). This is a continuous observed variable that was estimated as an average of the responses to six questions that sought to understand the household’s ability to access food. Its values lie between 0 and 3. The question was concerned mainly with different aspects of the households’ abilities to access food. The questions addressed such issues as:
    • How often was the household worried that it would not have enough food to eat for the month?
    • How often was the household unable to eat its preferred food because of a lack of income?
    • How often did the household eat fewer meals per day because of not having enough food?
Due to the high correlation among them, all these IFA estimators can produce a latent variable that fits the common pattern in the data. They all have continuous scales. A factor analysis was run to estimate the IFA using the principal axis factoring method and the scoring method suggested by Bartlett [19], using SPSS version21. Considering the communalities and the initial commonalities before rotation we note that they are all above 0.30, which is good (Table 1). Two factors were extracted and based on the analysis of the eigenvalues. We notice that the total variance explained shows that these two components explain 57.138% of the total variance.
The relative size of the factor loading of each variable has an important policy implication (i.e., the higher the loading, the more important it is, and the greater the attention that should be paid to it). These indicators play important roles in estimating the IFA dimension, although they differ in their correlation coefficients. As expected, the factor loadings and correlation coefficients of all variables are different. Only the roles of D and SAH seem to have less correlation with IFA, and therefore, are less representative of it. That may be explained by the farmers not considering diversity but sticking to common Tunisian meals (milk and cereal products) to be food secure (D). Additionally, they rarely consider the harvest savings as a source of food for coping with food insecurity (SAH). Crop harvests are mostly sold to meet household needs. IAS is the factor most correlated with IFA. The households mention using different strategies to overcome food insecurity. The most used strategies were selling small ruminants (67.1%), purchasing food on credit (58%), borrowing money from relatives and neighbors (53.1%), and borrowing food and getting help from relatives and the community (51.7%). TIPDP, FA, and IAS were captured by Factor 1, while SAH and D were captured by Factor 2. The relative size of the factor loading of each variable has, therefore, important policy implication (i.e., the higher the loading, the more important it is, and the more attention that should be given to it). In general, as suggested by the statistical criteria mentioned above, the factor scores can be used to estimate the IFA as follows:
IFA = (0.33141 × Factor 1 + 0.23997 × Factor 2)/2
The result obtained from this equation was further used as one of the latent indicators in constructing an overall RI for each household.

3.1.2. Adaptive Capacity (AC)

Scholars have analyzed AC from different angles [20].It is considered as an essential dimension of resilience that not only measures the household’s ability to adapt to facing shocks [14], but AC is also critical in reducing food insecurity. It refers to the conditions that enable people to [21]:
  • Anticipate and respond to changes
  • Minimize, cope with, and recover from the consequences of change
  • Take advantage of new opportunities.
  • In our study, the included observed variables estimating AC are all continuous variables.
  • Income diversity (ID): with values between a minimum of 1 and a maximum of 5
  • Available coping strategies (ACS): with values ranging from 0 to 16
  • Number of off-farm incomes (NOFI): with values ranging from 0 to 10
  • Number of house assets (NHA): with values ranging between 1 and 22.
All the variable values are based on a counted measurement scale and factor analysis was run, using the principal axis factoring method, to estimate the AC latent variable.
Table 2 shows that the measure of the adequacy of the KMO sampling is 0.524 and Bartlett’s sphericity test is significant (value p = 0.000, chi squared = 28.798). These results indicate that our sample is suitable for this factor analysis. Two factors are generated from the analysis representing 60.5% of the total variance. The first factor has an eigenvalue of 1.365 that represents more than 34% of the variance and the second has an eigenvalue of 1.055 and represents a variance of 26%. The ID and ACS were captured by the first factor and NOFI and the NHA were captured by the second. We also note that all the variables are positively correlated with the latent variable, AC. The off-farm income and the number of farm and household assets are the ones most correlated with the latent variable, AC. This seems to be explained by rural households being more likely to work in a sector other than agriculture or to sell farm assets to address food insecurity. We also notice that, based on the KMO measure of sampling, almost 52.4% of the variability can be explained by the underlying factors. In other words, it indicates that our sample is suitable for this second factor analysis. Additionally, the Bartlett test is significant (p = 0.000, which is less than 0.05). This means that the variables are sufficiently highly correlated to provide a reasonable basis for factor analysis, as in this case. The initial communalities are above 0.30, which is good. Only two factors were extracted based on the analysis of the eigenvalues. The total variance explained is 60.50% of the total variance. The equation estimating the AC latent variable is:
AC = (0.34122 × Factor 1 + 0.26378 × Factor 2)/2

3.1.3. Social Safety Net (SSN)

The SSN can be considered as the system’s capacity to mitigate shocks (in our case, food insecurity). The idea is that the more the households practice these indicators, the stronger they are socially integrated, and the more resilient they become [14]. Accordingly, the following indicators of SSN were identified in the present study, which seeks to estimate the household’s resilience index (RI):
  • Member of a social organization or association (MSOA): (Yes/No).
  • Borrow food or get help from a relative or the community (BFHRC): (Yes/No).
  • Send the children to live with relatives (SCLR): (Yes/No).
  • Accept food aid from an international organization (AFAIO): (Yes/No).
  • Borrow money from relatives or neighbors (BMRN): (Yes/No).
  • Level of participation, contribution and policy making (LPCPM): (Yes/No).
The variables are not continuous, so an optimal scaling was adequate to estimate the latent variable, SSN, by transforming the observed variables. As expected, the loadings and correlations of all variables with SSN were positive (Table 3).
The analysis shows that the total Cronbach’s alpha is about 0.8 indicating a high level of internal consistency for our specific sample. Moreover, the first factor generated by this procedure is very satisfying and can be used to represent SSN. This factor alone accounts for about 28% of the variance. By adding the second, both factors account for about 49% of the total variance. In addition, with the exception of the variable MSOA, the factor loadings of all observed variables are greater than or equal to 0.3. BFHRC, SCLR, and BMRN were captured by Factor1, while AFAIO was captured by Factor 2. Additionally, we note that the correlations of all the variables with SSN are positive. We ought to point out that the variable BMRN is most correlated with the latent variable SSN. The first solution that households favor is to borrow money from relatives or neighbors. The acceptance of food aid is also strongly correlated with SSN, which shows the efforts of non-governmental and international organizations, such as FAO, UNDP, etc., in their poverty alleviation programs. Being an MSOA has little correlation with SSN, which reflects the lack of an associative or political fabric in the rural area.
The SSN score for further estimating overall household resilience was estimated as:
SSN = (0.27588 × Factor1 + 0.21864 × Factor2)/2

3.1.4. Assets Possession (AP)

AP is a key element of household resilience because the more assets a household has, the more shocks it will be able to weather, thus improving its resilience. Five observed variables were used to estimate the AP components that we considered important for an agricultural household, especially one in a rural environment where sheep husbandry is dominant. The number of livestock is a kind of security guarantee for households for coping with food insecurity or climatic shocks. The households can sell animals to meet their needs (destocking) and the flock size can be rapidly increased when the household financial status improves. The large demand on animal products is also an important driver for households to maintain sheep. The larger the size of the herd, the greater the resilience of the household was supposed to be. Agricultural and non-agricultural assets are also considered means that can be divested when needed. The value of the house is also an important indicator that gives an idea of the standard of living of rural households. The higher the value of the house, the more the opportunities for the household to circumvent food insecurity. Finally, land ownership is also a relevant indicator of a household’s ability to cultivate or rent land.
The AP latent variable was estimated from five different observed variables:
  • Total owned land (ha) (TOwLH): This is an interesting variable, knowing that only 2.9% in Zoghmar, and only 7.6% in Selta are landless farmers
  • Herd size (HS): was included because it is an also an intriguing observed variable. Given the lack of water resources, the system of production is mostly dependent on raising livestock, and therefore, the practice of sheep herding [10]
  • House value (HVal): Amount in Tunisian dinars
  • Value of agricultural assets (AA): Amount in Tunisian dinars
  • Value of non-agricultural assets (NAA): Amount in Tunisian dinars.
Running the factor analysis estimating AP with principal component analysis, promax rotation, and Barlett’s scoring method, two indicators were extracted. Table 4 shows that the measure of the adequacy of the KMO sampling is of the order of 0.566 and the test of Bartlett’s sphericity is significant (value p = 0.000, chi squared = 114.417). These results indicate that our sample is suitable for this factor analysis. The first factor generated is satisfactory and can be used to represent the latent AP indicator. This factor alone accounts for about 36% of the variance, while the three factors together represent about 58%. Therefore, these two factors were used to estimate our latent variable AP. In addition, the factor loads, and the correlations of each observed variable are positive. The first three variables, TOwLH, HS, and HVal, are captured by Factor 1, while AA, and NAA are captured by Factor 2. The variables HS, AA, and NAA are the most correlated with the latent variable AP. In fact, households are not in favor of selling or renting their home or land. Rather, they are in favor of selling a certain number of animals or a few agricultural or NAA when needed.
The following formula is used to estimate the AP:
AP = (0.358 × Factor1 + 0.2182 × Factor 2)/2

3.1.5. Stability (S)

The fifth latent variable in our study to estimate the RI is stability (S). It was estimated from a set of five different variables. In marketing research, survey research, and social and behavioral sciences research, categorical data is dealt with most frequently [22].
The observed variables chosen to reflect the stability latent variable are:
  • Farming experience (FExp)
  • Number of households off-farm (NHHOF)
  • Family size (FS)
  • Number of members of the household studying in superior school or university (NSup)
  • Number of females in the household (NFem)
All four variables are measured on continuous scales. A component factor analysis was run as the most suitable tool for estimating the latent variable, S. Two factors were extracted.
Table 5 shows that the first factor generated was satisfactory in explaining about 44% of the variance. However, the contribution of the second factor was also significant, as together, they accounted for about 65.54% of the total variance. The variables FS and NHHOF are the most correlated with the latent variable, S. Having a large family offers more stability when facing food insecurity, especially if the household has members who work off-farm. In addition, a higher number of females in the household offers greater stability, especially in rural areas where agricultural work is mainly done by women.
The following formula is used to estimate the S:
S = (0.43772 × Factor 1 + 0.21775 × Factor 2)/2

3.1.6. Climate Change (CC)

This is one of the most important dimensions of household resilience in our study. Much of the previous literature on resilience has missed or not even considered it as a main latent variable in estimating resilience. Therefore, the CC indicator is a very interesting one to consider—not only the water resources scarcity in Sidi Bouzid, but also the severe weather conditions encountered.
The inter-annual precipitation variability (CV%), which ranges from 38% to 59%, is, on average, 51% [17]. The included variables were chosen using several questions reflecting observed households’ shocks and the CC realities encountered and observed (for the previous decade) are:
  • Observed drought (OD): (Yes/No)
  • Observed flood (OF): (Yes/No)
  • Observed hail storms (OHS): (Yes/No)
  • Observed timely rains (OTR): (Yes/No)
  • Observed dry spells (ODS): (Yes/No)
  • Observed temperature fluctuations – highs (OTFH): (Yes/No)
  • Observed temperature fluctuation – lows (OTFL): (Yes/No)
  • Observed changes in soil salinity (OCSS): (Yes/No)
Not all of these variables are measured on a continuous scale. They are all dummy variables that take a value of one or two. They were collected using questions about previously enumerated major shocks that had been encountered by the households in the past 10 years.
As a result, optimal scaling was used to estimate the CC latent variable as it relates to the dummy variables. Table 6 shows that the first factor explains about 33% of the variation. While it is satisfactory and could be used to represent the CC, the contributions of all three factors were significant, accounting for about 61% of the total variation. We also noted that all the variables are positively correlated with the latent variable, CC. The variables ODS, OTFH, OTR, and OHS are the ones most strongly correlated with the latent variable, CC.
The following formula is used to estimate CC:
CC = (0.3314 × Factor 1 + 0.146 × Factor 2 +0.1356 × Factor 3)/3
All variables have factor loadings that are positive and close to or greater than 0.3. OD is captured by Factor 3, OF is captured by Factor 2, while the rest and most of the observed variables are captured by Factor 1.

3.2. Estimating an Overall Resilience Index (RI)

The overall RI for each household is estimated by applying principle component analysis and using the factor method—taking the latent variables estimated earlier, which have been normalized/standardized using factor analysis or optimal scaling (i.e. mean = 0 and variance = 1). The six building blocks (latent factors) were analyzed using Bartlett’s method for factor scores saved in the SPSS active data set in order to calculate the overall index. The model shows that three factors together accounted for about 72% of the total variance (Table 7). The KMO statistic for the model was 0.541 and Bartlett’s test of sphericity was significant (p-value = 0.000 with chi-square = 203.538). RI can be successfully written as:
RI = 0.29455 × Factor 1 + 0.26124 × Factor 2 + 0.16798 × Factor 3
Consequently, the household RI was built by calculating the weighted sum of the three factors (the weights are proportional to the variance explained by each factor), as suggested by DiStefano [23].
RI, like all composite indices, is a relative measure of the level of household resilience, or vulnerability, to food insecurity. It is a composite index that simply shows the level of resilience among the studied subjects.
In addition to suggesting its own cut-off points to categorize households into different resilience levels, this paper has two main objectives that were successfully accomplished. The first is to identify the important building blocks and determinants of household resilience. The second is to examine the different resilience levels for the two villages, Zoghmar and Selta. The second objective can be used to consider what are the policy implications and the strategies that can be implemented.
The paper uses the following ranges of RI scores, which are randomly proposed and used as a grouping method for four levels of resilience:
  • Vulnerable (RI < 0.100) with all values coded 0;
  • Moderately resilient (0.100 ≤ RI < 0.250) with all values coded 1
  • Resilient (0.250 ≤RI < 0.500) with all values coded 2
  • Highly resilient (RI ≥0.500) with all values coded 3. The results (Table 8) shows that 64.4% of the surveyed households were vulnerable, while 35.6% were resilient to different degrees (10.4% moderately, 13.6% resilient, and 11.6% highly).
Table 9 shows that the households in Zoghmar are more vulnerable than those in Selta. However, in Zoghmar there are more highly resilient households (14.3%) than in Selta (9.7%). The two villages represent different production systems. In Zoghmar, biophysical characteristics facilitate the diversification of agricultural activities. For instance, sheep production is the main source of revenue for more than half the local population, whereas in Selta farmers, they rely more on goats and beehives because of the proximity of Mount Mghila. When it comes to plantations, olive trees are more common in Selta because they require less labor and its soil is stony soil. In Zoghmar farmers rely more on cereals which provide them with usable by-products, such as straw, insuring livestock feed is available throughout the year.
Most of the households in both villages are vulnerable—62.8% of our sample’s households in Selta and 66.7% in the Zoghmar district. This point out the importance of the political and strategic decisions that should be taken in the two study villages.

3.3. Relative Importance of the Latent Dimensions of Household Resilience

It should be acknowledged that the latent dimensions do not equally contribute to household resilience. Some have more significant impacts than others, although the role of each is still crucial in estimating resilience. To identify the effects of each latent variable on household resilience, a simple regression analysis was run using the ordinary least squares (OLS) algorithm. This gives the effects in terms of a standardized (β) coefficient. The household resilience scores were used as dependent variable and five of the latent variables, as explanatory variables. The latent variable S was removed from linear regression to avoid a problem of multicollinearity between the variables.
The following is the empirical model used to predict household resilience (RI).
RI = ∂+ β1 × IFA + β2 × AC + β3 × SSN + β4 × AP +β5 × CC + ℮
where RI is household resilience; ∂ is a constant; β1-5 are the coefficients of each variable, ℮ is an error term representing the negligible information of the variables used to estimate resilience but excluded from the model above. Our first table of interest (Table 10) shows that the R value, which represents the simple correlation, is 0.966, which indicates a high degree of correlation. In addition, the R2 value indicates how much of the total variation in the dependent variable, RI, can be explained by the independent variables, IFA, AC, SSN, AP, and CC. In our case, 93% can be explained, which is large.
SPSS recommends examining the β coefficients for the relative importance of each variable in determining a dependent variable (in this paper Zoghmar’s and Selta’s households’ resilience to food insecurity). Accordingly, Table 11 shows, that, irrespective of the negative signs, AC was the most important dimension. This contributed more (β = 0.614) to the regression model. It was followed by SSN (β = 0.337), IFA (β = 0.328), AP (β = −0.035), and finally, CC (β = −0.283).
A 0.614 unit increase in the household’s AC increases the households’ resilience by one standard deviation. A 0.283 unit decrease in climate change increases the households’ resilience by one standard deviation. The logic behind this is that the return to equilibrium after facing climatic shocks and challenges remains temporary. Neither a long-term solution nor a long-term program has ever existed to allow farmers to adapt the farming systems in the two villages to the changes in terms of expected weather. In addition, AP, like CC, is characterized by a negative β. In fact, a decrease of 0.035 unit in AP increases the resilience of the households in the two sub-districts by one standard deviation. This seems to be explained by two main reasons. The weak AP of smallholders is exacerbated by the under exploitation of farm assets because of poor management. In this direction, the lack of market information is a major handicap for good asset management. The relative importance of this dimension of a household’s resilience to seasonal food insecurity has clear policy implications because it minimizes intervention costs. Policy makers and implementers can emphasize the important dimensions of resilience when planning to improve the resilience capacity of households.

4. Concluding Remarks and Policy Implications

One of the most important conclusions based on this study is the significant need for concrete policy implementations in Selta and Zoghmar. Facing more than one challenge, especially with the accelerated deterioration of natural resources, added to the exhaustion of the development model based on the agricultural sector’s [24] resilience, which means that improving governmental policy is crucial to facilitating the development of the two zones. The major focus should be to work on the elaboration and successful implementation of the strategies along with education. The essential goals should be strengthening the households’ knowledge of the coping strategies to deal with food shortages and their awareness of the climatic challenges. Different coping strategies and approaches should be adopted taking in account the resilience estimators analyzed in this study. This reflects the important intensity of the call regarding appropriate policy interventions based on the current research. In this regard, AC played the most significant role in household resilience to food insecurity in the study areas. This latent variable is highly correlated with number of off-farm income sources (NOFI) and number of household assets (NHA). Strategies such as creating opportunities for off farm income generating activities especially for youth should be included in any political program and interventions in these areas. SSN and IFA are found to play a moderate role in the household resilience to food insecurity. Regarding the observed variables estimating SSN, we notice the importance of informal solidarity networks among community, especially in terms of borrowing money and food. However, the household heads membership to professional organizations (association, political group, ONG, etc.) was very week. This result suggests the need to focus on developing producers’ organizations and household associations, which will contribute to improve the SSN resilience dimension. The best example for those associations are the Mutual Agricultural Services Organization (SMSA) where they could play a strong role in helping poor households through ensuring a simple and attractive credit system, allowing families to purchase indispensable household needs and agricultural inputs, lowering the costs of technologies and services and fostering decent rural employment.
Among strategies that can help the poor actors to do better and improving IFA, is creating local markets close to the poor households, located in in less-favored areas, particularly mountainous areas (i.e. Selta) and characterized by a lack of proper agricultural infrastructure to support farming. Another vital strategy that should be considered is providing micro-finance loans and smart subsidies are proving vital facilities for many farmers in enabling them to manage risk, make investments in water harvesting technologies, diversification of food products, and creating opportunities for farm income generating activities by promoting private-label products (i.e. Sidi Bouzid meat lamb).
As regards AP, the policy recommendation suggests to emphasize on the good management of assets. Strategies related to improving farmers’ know-how on land and livestock management are strongly recommended, especially under the dynamic threat of climate change. Furthermore, findings indicate that CC has a significant and negative impact on household’s resilience to food insecurity. Autonomous household’s adaptation was insufficient to adequately address the threats posed by climate change. Interventions could include, for instance, subsidizing more of what increases households’ resilience, such as varieties that are highly drought adaptive, or by implementing programs (drought preparedness plans, soil erosion and water harvesting plans, etc.) that target the farmers’ knowledge of how to face climate change difficulties in the best possible ways.
It is also crucial to consolidate public investments to improve the quality of human and animal health services in study area A, One Health approach addressing simultaneously human, animal, and environment health should be an important pillar of the coping strategy to increase resilience of the households and mitigate effects of climate change.
The study shows the relevant role of resilience in synergizing the implementation of the 2030 agenda, especially the first of the 17 Sustainable Development Goals (SDGs) related to the eradication poverty considered as the key challenge to achieve sustainable development, integrating environmental, and social and economic dimensions. A further research including additional resilience indicators related to SDGs in different agro-ecological zones will be useful in improving understanding of food insecurity impacts and vulnerabilities and in formulating, evaluating, and improving response strategies.

Author Contributions

Conceptualization, M.Z.D., B.D., H.D.H. and M.Z.; Data curation, M.Z.D., C.K., S.J. and O.J.; Formal analysis, M.Z.D., B.D., H.D.H., C.K. and O.J.; Funding acquisition, B.D. and M.R.; Investigation, H.D.H.; Methodology, M.Z.D., B.D., H.D.H. and M.Z.; Resources, M.R.; Software, C.K., S.J. and O.J.; Supervision, M.Z.D. and B.D.; Validation, M.Z.D. and B.D.; Writing–original draft, M.Z.D., B.D., H.D.H. and M.Z.; Writing–review & editing, H.D.H. and M.R.

Acknowledgments

Funding support for this work was provided by CGIAR Research Program (CRP) on Integrated Agricultural Production Systems for Improved Food Security and Livelihoods in Dry Areas (Dry land Systems), led by the International Centre for Agricultural Research in the Dry Areas (www.icarda.org), in collaboration with the “Use of conservation agriculture in crop-livestock systems (CLCA) in the drylands for enhanced water use efficiency, soil fertility and productivity in NEN and LAC countries” project, funded by the International Fund for Agricultural Development (www.ifad.org) under a grant agreement with ICARDA.

Conflicts of Interest

The authors declare no conflict of interest.

References

  1. World Bank. Tunisia in a Changing Climate: Assessment and Actions for Increased Resilience and Development. A World Bank Study; Verner, D., Ed.; World Bank: Washington, DC, USA, 2013; ISBN 978-0-8213-9857-9. [Google Scholar]
  2. Institut National de la Statistique (INS). 2015. Available online: http://www.ins.tn/fr/p%C3%A9riode-de-r%C3%A9ference/2015 (accessed on 12 December 2018).
  3. Stambouli, T.; Hammami, R.; Ouissi, A.; Ben Alaya, A.; Laajili-Ghezal, L. Virtual water balance estimation in Tunisia. J. New Sci. 2017, 31, 1783–1793. [Google Scholar]
  4. Verner, D.; Treguer, D.O.; Redwood, J.; Christensen, J.; Mcdonnell, R.; Elbert, C.; Konishi, Y. Climate Variability, Drought, and Drought Management in Tunisia’s Agricultural Sector; World Bank Group: Washington, DC, USA, 2018; 114p. [Google Scholar]
  5. Alexander, D.E. Resilience and disaster risk reduction: An etymological journey. Nat. Hazards Earth Syst. Sci. 2013, 13, 2707–2716. Available online: https://www.nat-hazards-earth-syst-sci.net/13/2707/2013/nhess-13-2707-2013.pdf (accessed on 12 December 2018). [CrossRef]
  6. Jones, L.; Tanner, T. Measuring ‘Subjective Resilience’: Using Peoples’ Perceptions to Quantify Household Resilience; Working Paper 423; Overseas Development Institute: London, UK, 2015. [Google Scholar]
  7. Ciani, F. A Resilience-Based Approach to Food Insecurity: The Impact of Hurricane Mitch on Rural Household in Nicaragua. Ph.D. Thesis, University of Florence, Gainesville, FL, USA, 2012. [Google Scholar]
  8. Errico, M.; Pietrelli, R.; Romano, D. Household resilience to food insecurity: Evidence from Tanzania and Uganda. In Proceedings of the 90th Annual Conference of the Agricultural Economics Society, Coventry, UK, 4–6 April 2016; Available online: https://ageconsearch.umn.edu/record/236350/files/marco_d_errico%20upload.pdf (accessed on 12 December 2018).
  9. Alinovi, L.; Mane, E.; Romano, D. Towards the Measurement of Household Resilience to Food Insecurity: An Application to Palestinian Households. 2008. Available online: http://www.stats.gov.cn/english/ICAS/papers../P020071017475481721768.pdf (accessed on 12 December 2018).
  10. Dhraief, M.Z.; Oueslati, M.; Daly, H.; Bedhiaf, S.; Dhehibi, B.; Kassam, S.; Aw-Hassan, A. Analysis Report of the Baseline Survey for the CRP DS Project in Sidi Bouzid Site; ICRDA: Beirut, Lebanon, 2015; 123p. [Google Scholar]
  11. Béné, C.; Headey, D.; Haddad, L.; Grebmer, K.V. Is resilience a useful concept in the context of food security and nutrition programs? Some conceptual and practical considerations. Food Secur. 2016, 8, 123–138. [Google Scholar] [CrossRef]
  12. Bizikova, L.; Tyler, S.; Moench, M.; Keller, M.; Echeverria, D. Climate resilience and food security in Central America: A practical framework. Clim. Dev. 2015. [Google Scholar] [CrossRef]
  13. Frankenberger, T. Enhancing Resilience to Food Security Shocks in Africa, TANGO International TOPS Knowledge Sharing Meeting, Washington, DC, USA, 2012. Available online: http://www.fsnnetwork.org/sites/default/files/resilience_ppt.pptx (accessed on 12 December 2018).
  14. Guyu, F.D.; Muluneh, W. Household resilience to seasonal food insecurity: Dimensions and magnitudes in the “Green Famine” belt of Ethiopia. Appl. Sci. Rep. 2015, 3, 125–143. [Google Scholar]
  15. Boukary, A.G.; Diaw, A.; Wünscher, T. Factors Affecting rural households’ resilience to food insecurity in Niger. Sustainability 2016, 8, 181. [Google Scholar] [CrossRef]
  16. Burton, C.G. The Development of Matrices for Community Resilience to Natural Disasters. Ph.D. Thesis, University of South Carolina, Columbia, SC, USA, 2012, unpublished. [Google Scholar]
  17. Alinovi, L.; Mane, E.; Romano, E. Measuring Household Resilience to Food Insecurity: Application to Palestinian Household. 2009. Available online: http://citeseerx.ist.psu.edu/viewdoc/download?doi=10.1.1.175.7411&rep=rep1&type=pdf (accessed on 10 October 2018).
  18. Nelli, N. The Resilience of Rural Ethiopian Livelihoods: A Case Study from Hararghe Zone, Eastern Ethiopia. Master’s Thesis, University of Jyväskylä, Jyväskylän yliopisto, Finland, 2011. Available online: https://jyx.jyu.fi/bitstream/handle/123456789/37212/URN%3aNBN%3afi%3ajyu-201201161033.pdf?sequence=1&isAllowed=y (accessed on 12 December 2018).
  19. Bartlett, M.S. Properties of sufficiency and statistical tests. Proc. R. Stat. Soc. 1937, 160, 268–282. [Google Scholar] [Green Version]
  20. Cramer, L.; Forch, W.; Mutie, L.; Thornton, F.K. Connecting women, connecting men: How communities and organizations interact to strengthen adaptive capacity and food security in the face of climate change. Gend. Technol. Dev. 2016, 20, 169–199. [Google Scholar] [CrossRef]
  21. McClanahan, T.R.; Allison, E.H.; Cinner, J.E. Managing fisheries for human and food security. Fish Fish. J. 2013, 16. [Google Scholar] [CrossRef]
  22. Mathers, N.; Fox, N.; Hunn, A. Surveys and Questionnaires, The NIHR Research Design Service for Yorkshire and the Humber. 2009. Available online: https://www.rds-yh.nihr.ac.uk/wp-content/uploads/2013/05/12_Surveys_and_Questionnaires_Revision_2009.pdf (accessed on 12 December 2018).
  23. DiStefano, C.; Zhu, M.; Mindrila, D. Understanding and using factor scores: Considerations for the applied researchers. Pract. Assess. Res. Eval. 2009, 14, 1–11. [Google Scholar]
  24. Elloumi, M.; Véronique, A.; Selmi, S. Policies and strategies of livestock farmers in Sidi Bouzid Governorate (central Tunisia). Afr. Contemp. 2016, 219, 63–79. [Google Scholar] [CrossRef]
Figure 1. Sidi Bouzid governorate. Source: Dhraief et al., 2015 [10].
Sustainability 11 00907 g001
Figure 2. Analytical framework for the study; modified from Alinovi et al. 2009 [17] Source: Own elaboration based on Alinovi et al. 2009 [17], 2018.
Sustainability 11 00907 g002
Table 1. Communalities, factor loadings, and correlations of variables with IFA.
Indicators of IFACommunalitiesFactors and Their LoadsCorr. IFA
InitialExtraction12
FA1.0000.5970.7260.2630.585**
TIPDPP1.0000.4650.6470.2170.505**
IAS1.0000.5150.6300.3430.608**
SAH1.0000.655−0.3660.7220.450**
D1.0000.626−0.4250.6670.374**
EigenvaluesTotal
Variance (%)
Cumulative (%)
1.5911.312
33.14123.997
33.14157.138
KMO test of sampling adequacy = 0.598
Bartlett’s test of sphericity is significant at p = 0.000; chi-square = 82.320
Extraction method: principal component analysis
**: Correlation is significant at the 0.01 level
Source: Factor analysis result, 2018.
Table 2. Communalities, factor loadings, and correlation of variables with AC.
Indicators of ACCommunalitiesFactors and Their LoadsCorr. AC
InitialsExtraction12
NHA1.0000.5720.755 0.627**
ID1.0000.3660.605 0.460**
NOFI1.0000.7760.4130.7780.803**
ACS1.0000.705−0.5090.6680.006
EigenvaluesTotal
Variance (%)
Cumulative (%)
1.3501.062
34.12226.378
34.12260.501
KMO test of sampling adequacy = 0.524
Bartlett’s test of sphericity is significant at p = 0.000; chi-square = 28.798
Extraction method: principal component analysis
**: Correlation is significant at the 0.01 level
Source: Factor analysis result, 2018.
Table 3. Factor loadings and correlations of transformed variables with SSN.
Indicators of SSNFactors and Their LoadsCorr. SSN
12
BFHRC0.802−0.2540.471**
SCLR0.6870.0600.576**
BMRN0.5460.4920.734**
AFAIO0.2090.7590.635**
LPCPM−0.3640.6400.112
MSOA0.256−0.1240.124
EigenvaluesTotal1.6551.312Total Cronbach’s alpha = 0.796
Variance (%)27.58821.864
Cumulative (%)27.58849.452
Cronbach’s alpha0.4750.285
Source: Factor analysis result, 2018.
Table 4. Factor loadings and correlations of transformed variables with AP.
Indicators of APCommunalitiesFactors and Their LoadsCorr. AP
InitialsExtraction12
TOwLH1.0000.5040.7560.2170.439**
HS1.0000.6190.6950.2700.759**
HVal1.0000.6440.665−0.2480.352**
AA1.0000.562 0.7990.602**
NAA1.0000.5550.2810.6950.734**
EigenvaluesTotal
Variance (%)
Cumulative (%)
1.7931.092
35.86521.834
35.86557.699
KMO test of sampling adequacy = 0.566
Bartlett’s test of sphericity is significant at p = 0.000; chi-square = 114.417
Extraction method: principal component analysis
**: Correlation is significant at the level of 0.01
Source: Factor analysis result, 2018.
Table 5. Factor loadings and correlations of transformed variables with S.
Indicators of SCommunalitiesFactors and Their LoadsCorr. S
InitialsExtraction12
FS1.0000.8460.920 0.854**
NFem1.0000.7820.883 0.547**
NSup1.0000.5830.599−0.4730.302**
FExp1.0000.6890.1600.8140.420**
NHHOF1.0000.3780.4220.4470.621**
EigenvaluesTotal
Variance (%)
Cumulative (%)
2.1461.234
43.77221.775
43.77265.547
KMO test of sampling adequacy = 0.595
Bartlett’s test of sphericity is significant at p = 0.000; chi-square = 334.863
Extraction method: principal component analysis
**: Correlation is significant at the 0.01 level (2-tailed)
Source: Factor analysis result, 2018.
Table 6. Factor loadings and correlations of transformed variables with CC.
Indicators of CCFactors and Their LoadsCorr. CC
123
OTR0.816−0.099−0.0960.628**
ODS0.7050.3880.0260.760**
OTFL0.6550.139−0.1770.552**
OTFH0.6610.3530.0500.717**
OHS0.583−0.0690.4070.616**
OCSS0.400−0.5970.0780.144*
OF−0.3500.6930.2910.064
OD−0.027−0.1580.8860.228**
EigenvaluesTotal2.6521.1701.085Total Cronbach’s alpha = 0.910a
Variance (%)33.14914.62413.565
Cumulative (%)33.14947.77361.338
Cronbach’s alpha0.7120.1660.090
A: the total Cronbach’s alpha value is based on the total eigenvalue
**correlation is significant at the 0.01 level
Source: Factor analysis result, 2018.
Table 7. Factor loadings, explained variance, correlations and beta (β) coefficient of the latent dimension for the household RI.
VariableFactors and Their LoadsCorrelation With (RI)
123
S0.7560.1720.4460.457**
AC0.6840.4750.2930.690**
AP0.583 −0.5680.009
IFA−0.3280.761−0.1610.594**
SSN−0.5010.5940.3440.501**
CC−0.172−0.6170.506−0.517**
Eigenvalue1.6141.4531.498
Variance (%)29.45526,12416,798
Cumulative (%)29.45555.57972.377
KMO test of sampling adequacy = 0.541
Bartlett’s test of sphericity is significant at p = 0.000; chi-square = 203.538
Extraction method: principal component analysis
**: Correlation is significant at the 0.01 level (2-tailed)
Source: Factor analysis result, 2018.
Table 8. Household resilience spectrum-based analysis of two villages, Selta and Zoghmar.
NProportion (%)Cumulative Proportion (%)
Vulnerable (RI < 0.100)16164.464.4
Moderately resilient (0.100 ≤ RI < 0.250)2610.474.8
Resilient (0.250 ≤ RI < 0.500)3413.688.4
Highly resilient (RI ≥ 0.500)2911.6100.0
Total250100.0
Source: Analysis of household survey data, 2018.
Table 9. Household resilience spectrum-based analysis in the villages of Selta and Zoghmar.
N1Selta sub-District (%)N2Zoghmar Sub-District (%)
Vulnerable9162.87066.7
Moderately resilient1611.0109.5
Resilient2416.6109.5
Highly resilient149.71514.3
Total145100.0105100.0
Source: Analysis of households’ survey data, 2018.
Table 10. Model summary OLS regression model.
Model Summary
ModelRR2Adjusted R2Std. error of the estimate
10.966a0.9330.9320.11488
a. Predictors: (constant), CC, AP, SSN, IFA, AC
Source: Regression analysis result, 2018.
Table 11. Relative importance of each latent variable in household resilience in Selta and Zoghmar villages.
Latent VariablesUnstandardized CoefficientsStandardized Coefficients
β
tSig.Collinearity Statistics
BStd. errorToleranceVIF
Constant−0.0000.007 0.0001,0000.7601.316
IFA0.7540.0440.32817.3240.0000.9221.084
AC1.2550.0350.61435.6890.0000.8771.140
CC−0.9660.060−0.283−16.0610.0000.7621.312
SSN0.8430.0470.33717.8400.0000.8761.142
AP−0.0730.037−0.035−1.9680.0500.7601.316
a: Dependent variable: RI. Source: Regression analysis result, 2018.

