Article

The Impact of the Community Built Environment on the Walking Times of Residents in a Community in the Downtown Area of Fuzhou

1
School of Geoscience and Civil Engineering, Kanazawa University, Kanazawa 920-1192, Japan
2
School of Architecture, Fuzhou University, Fuzhou 350116, China
*
Author to whom correspondence should be addressed.
Sustainability 2019, 11(3), 691; https://doi.org/10.3390/su11030691
Submission received: 23 December 2018 / Revised: 18 January 2019 / Accepted: 21 January 2019 / Published: 28 January 2019

Abstract

:
By means of on-site and network investigation, we collected data relevant to residents of communities, point of interest (POI) data, and land-use data of Fuzhou. We set traffic walking time and leisure walking time as an independent variable, built environment as dependent variable, and gender, age, education level and income level as control variables. Six linear regression models were established using Statistical Product and Service Solutions (SPSS). The results showed that in the 5D (i.e., Density, Diversity, Design, Destination and Distance) elements of the built environment, the density was negatively correlated with the traffic walking time, whereas other elements were positively correlated with the walking time, but the degree of influence was different.

1. Introduction

On the basis of case-related data, this study quantitatively analyzed the correlation between the resident walking times and the community built environment and identified the urban built environment factors that significantly affected resident walking. This study was conducted to provide a theoretical basis and a practical direction for creating a healthy urban space.
We aimed to clarify the relationship between health and urban planning. Modern urban planning originates from public health problems [1]. After more than 100 years of urban development, rapid urbanization has introduced new health problems to human beings [2]. Urban health has once again attracted the attention of scholars in various fields [3,4]. The current path of urban planning to promote health has manifested in two ways. The first is through a reduction in the impact of pollution on the human body, which means adopting certain protective measures and planning methods to prevent pollutants from spreading to places where people gather and to reduce the human body’s absorption of particulate matter. The second way is through the promotion of physical activity to promote healthy lifestyles by improving community-built environments [1]. In 2003, the ‘American Journal of Public Health’ published an article on the theme of the “Built Environment and Health”. In the same year, the ‘American Journal of Health Promotion’ also published a special issue entitled “Health Promotion and Community Design”. These articles showed the importance of a building environment in relation to health [5].
A complex relationship exists between a healthy life and a community built environment, but increasing evidence shows that the occurrence of chronic diseases is related to a lack of physical activity in the modern lifestyle [6,7]. Effective physical activity is important to reduce the incidence of chronic diseases, such as obesity, and to enhance the health of the population [7]. In studies of building environmental health, scholars often favor physical activity as a mediating factor between built environments and health. This research mainly has focused on traffic physical activity and leisure physical activity [5,8].
To research physical activity and a community built environment, we also need to define a built environment and physical activity. The definition of a built environment includes all buildings and places that are constructed and transformed artificially. In particular, this definition refers to those built environments that can be changed by policies and human behavior. These include the locations and designs of residential buildings, commercial buildings, offices, schools, and other types of buildings as well as the locations and designs of pedestrian paths, bicycle paths, green ways, and roads [9]. Cerveor et al. concluded that the built environment affecting physical activity has 3D elements, including density, diversity, and design [10]. Based on this definition, Ewing and Cervero added destination accessibility and distance to transit, and proposed the 5D elements of built environmental measurement, including density, diversity, design, destination, and distance [11]. Physical activity is defined as any bodily movement caused by the contraction of the skeletal muscles [12]. General physical activity is divided into occupational, traffic, housework, and leisure activities [13].
Existing studies on physical activities show that built environment planning and design can significantly influence the spatial and temporal behavior of residents, as well as guiding traffic behavior and physical activities [14]. Using data from the U.S. Health and Nutrition Survey, Kelly et al. found that areas with high-density accessibility and road connectivity tended to have higher health levels under the control of individual characteristics because they established hierarchical models [15]. Jiawen Yang and French found that long periods of car use significantly increased the proportion of obesity, whereas non-motorized transportation helped reduce body mass index and obesity [7]. Vojnovic’s study found that short distances and highly connected neighborhood characteristics encouraged residents to increase physical activities, such as walking and cycling [16]. Handy pointed out that density is an important measurement for judging interference with physical activity [17]. The influence of density on physical activity is mainly reflected in traffic walking [18,19,20]. The relationship between density and leisure physical activity is not clear [8]. Frank pointed out that there are not enough existing studies to show which case is more appropriate for using the density index. Thus, many studies regard density as a potential influencing factor [21,22]. Learnihan pointed out that when mixed land use reached a certain level, it had the greatest impact on traffic walking [23]. McCormack pointed out that the accessibility of public space not only increased walking physical activity but also promoted leisure physical activity [24]. Frank et al. thought that street connectivity was positively correlated with physical activity [25,26,27]. Handy et al. found that street connectivity was negatively correlated with physical activity or had no relationship [28,29,30]. In 2010, the New York City government provided a strong design basis for designers to build healthier buildings, streets, and public spaces to combat obesity, entitled “Active Design Guidelines: Promoting Physical Activity and Health in Design.” The aim was to encourage citizens to choose healthier travel, integrate physical activity into a healthy lifestyle for daily life, and finally to achieve the goals of friendliness and livability. The design elements of a public space, such as street scale, street pavement, greening condition, and street furniture, play an active role in walking activities [31,32]. Rhodes believed that the aesthetic perception of a built environment played a positive role in leisure physical activities [33]. Safety perception is positively correlated with physical activity [34], but some studies have found that safety perception had a more significant impact on women [35]. Susan and Berke took walking as a research object when they studied the relationship between built environments and physical activity [36,37]. Thus, from the perspective of healthy urban planning, a large number of documents have clarified the impact of building environment on sports activities. Thus, we can establish that walking time is an important factor in measuring community sports activities.
Health is an essential requirement for promoting the all-round development of human beings. In October 2016, China promulgated the “Plan Outline of the Healthy China 2030.” Building healthy cities has become an important strategy for China. To prevent urban problems in the process of rapid urbanization in China, it is necessary to attach importance to the study of the relationship between the built environment of Chinese cities and the promotion of walking, which will play an active guiding role in promoting urban health. Taking the community in the downtown area of Fuzhou as an example, this study integrated a social survey, a point of interest (POI), and road traffic network and land use data and explored the impact of the built environment characteristics on walking times at the community scale. This study primarily analyzed the factors of a community built environment that have a clear impact on the community.

2. Research Method and Variable Selection

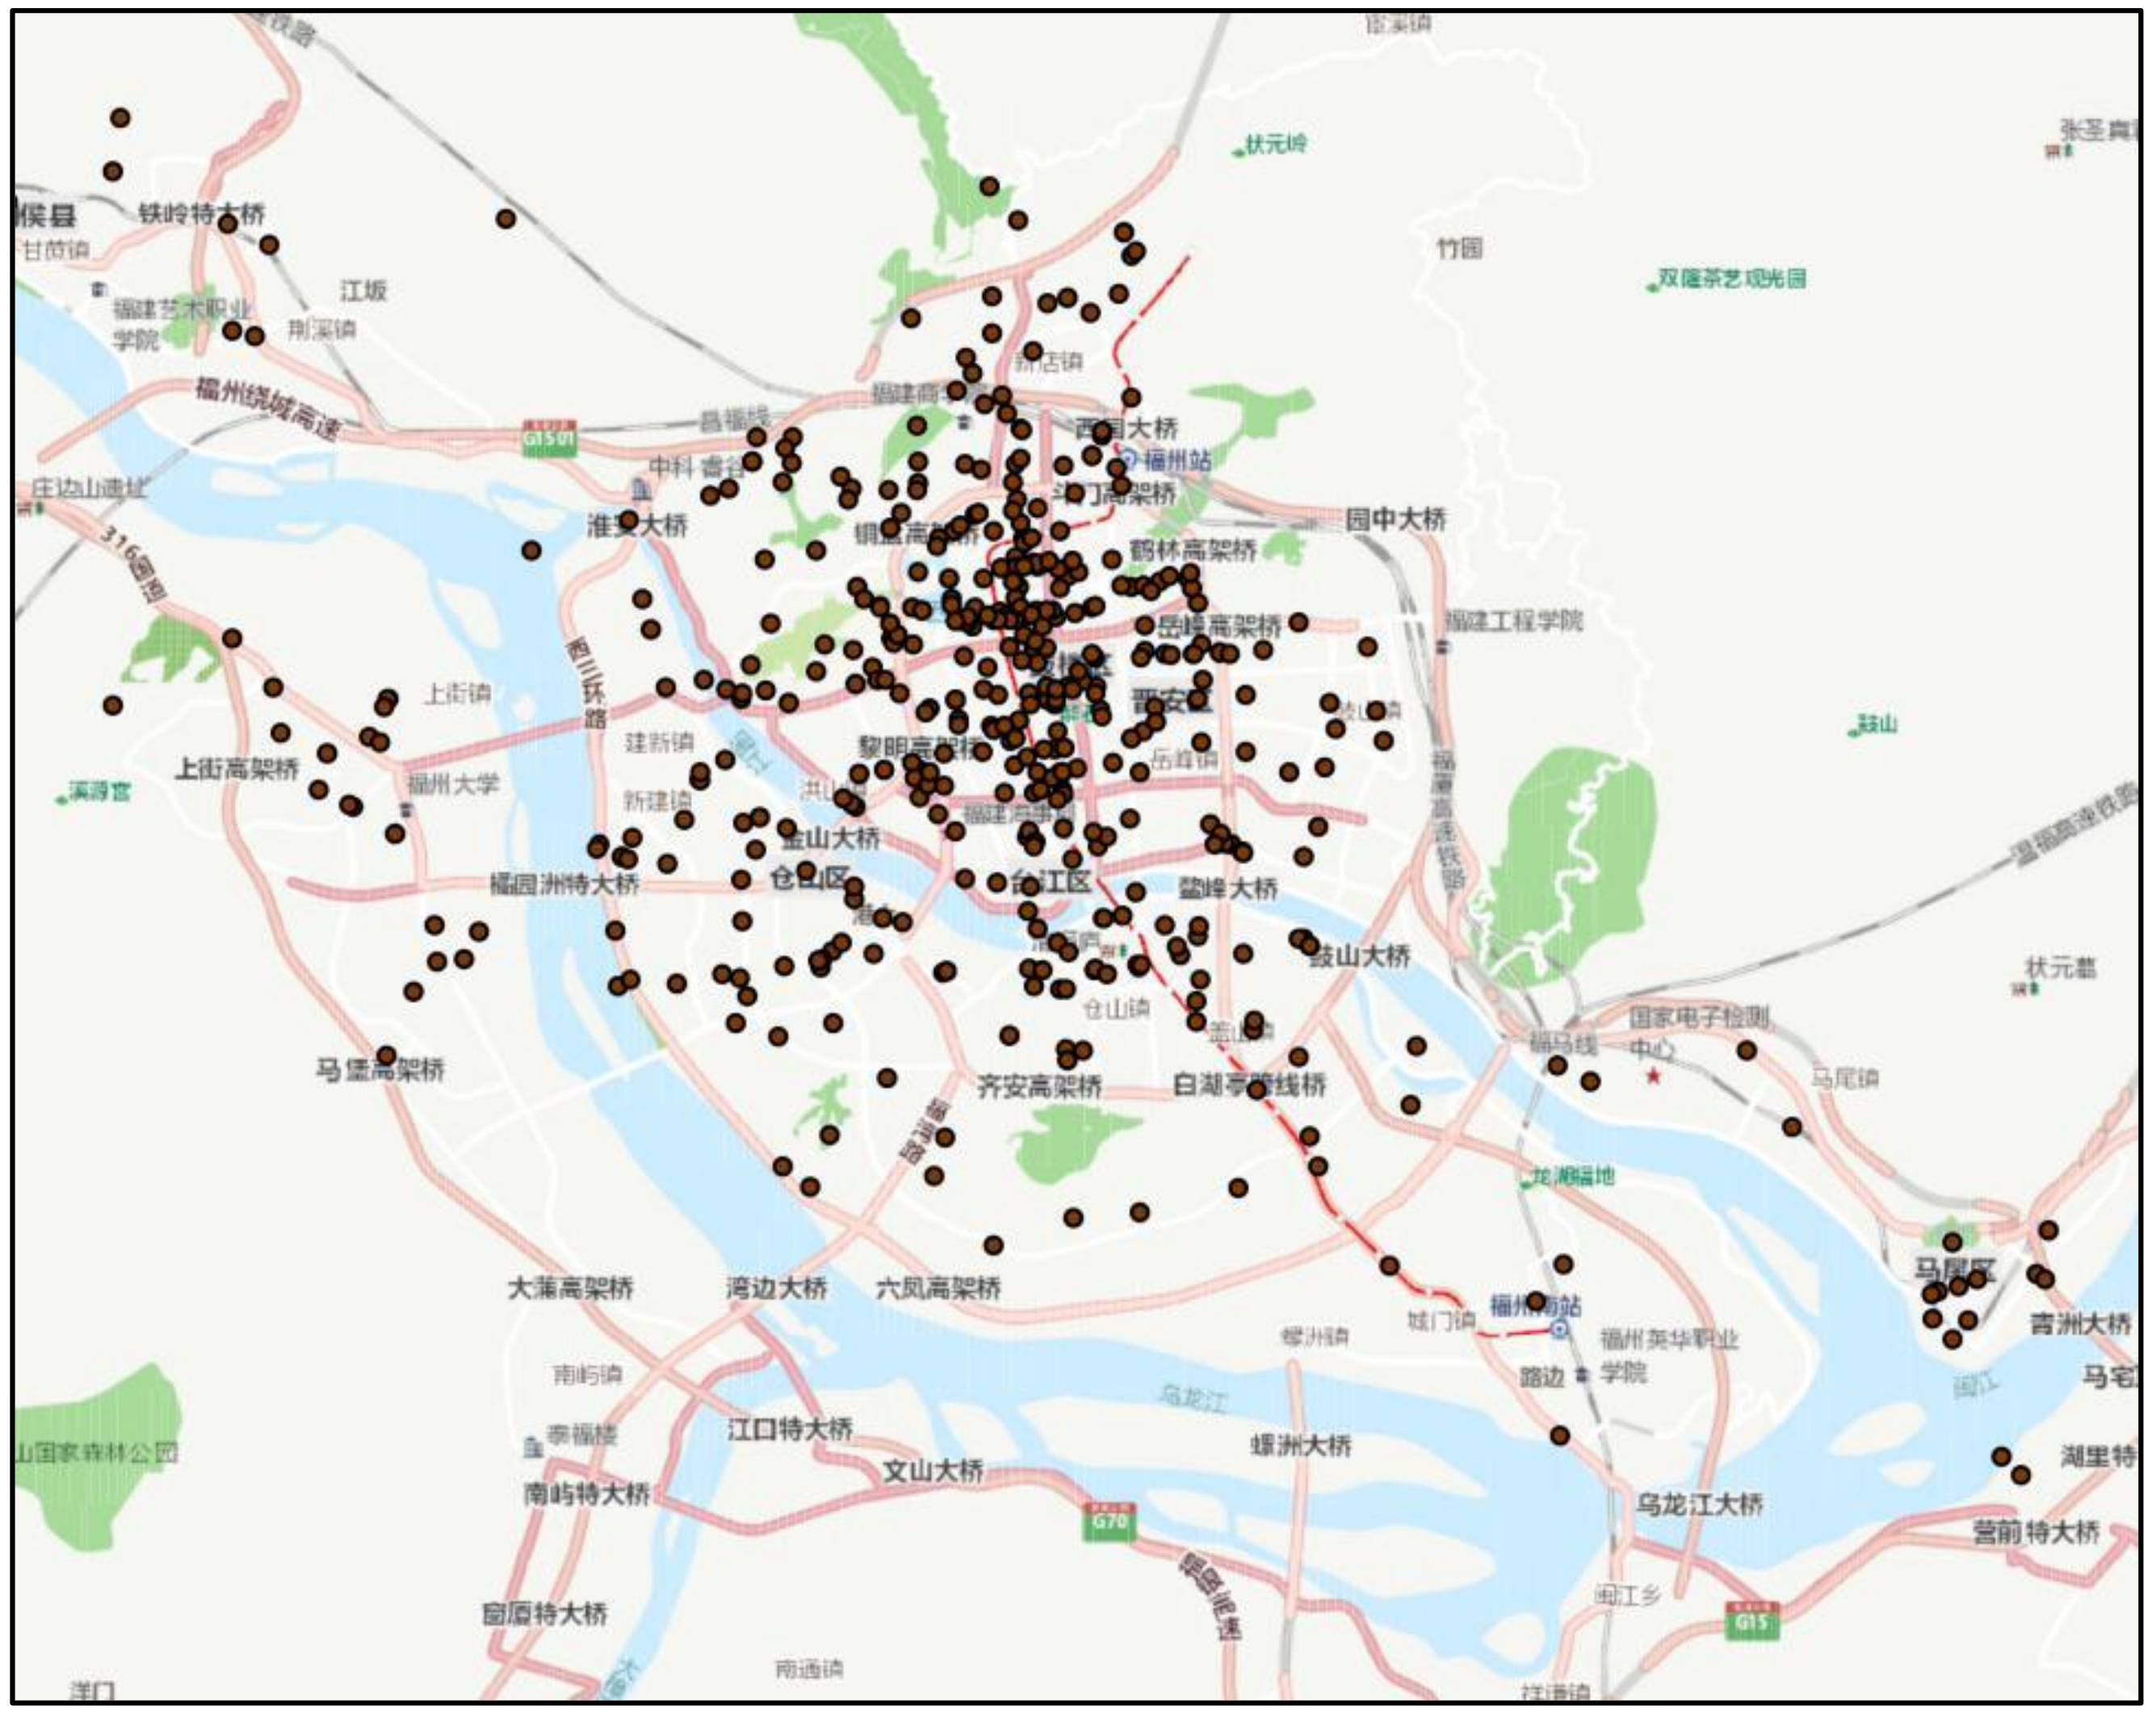
2.1. Data Sources and Research Methods

From June to August in 2017, we conducted a social survey in the central city of Fuzhou with the theme of “Building Environment and Walking Activities.” This survey covered the basic information of the social population, the community built environment, walking times, and subjective perception evaluations. In total, 2000 questionnaires were sent out and 1712 surveys were collected. After removing the questionnaires lacking major information, such as family address, physical activity, and environmental assessment, we obtained 1424 valid samples. After manual inquiry and coordinate correction, we obtained the spatial location of the respondent’s residence (Figure 1). At the same time, the research also used the Fuzhou POI captured on a map website in a 2017 Fuzhou land-use status map, as well as other information.
According to the availability of the data and the complex causal relationship between the built environment and walking activities, this study constructed a structural equation to test the existence of multiple impact paths. That is to say, we tested the relationship between the built environment and the traffic walking time, as well as the relationship between the built environment and the leisure walking time, to explain the environmental impact factors that promoted walking times. In this study, we used a field survey, POI data collection, an objective evaluation of the Geographic Information System (GIS) data, and a subjective evaluation of the respondents to measure the relevant variables.

2.2. Variable Factor Analysis

2.2.1. Explained Variables

We identified two explanatory variables (Table 1). The first variable was the traffic walking time and the second variable was the leisure walking time. The traffic walking time refers to the walking time during purposeful work or shopping activities every day. We believed that the traffic walking time could essentially reflect the characteristics of general traffic physical activity. Therefore, it could be used as an interpreted variable to reflect the relationship between traffic physical activity and an urban built environment. The leisure walking time refers to the walking time of aimless leisure activities every day, which we used as an explanatory variable to reflect the relationship between leisure physical activities and the urban built environment.
To avoid the uncertainty of the geographical background, the analysis scope of the physical activity and the built environment needed to be unified [38,39]. Because the space range within the 500-m search radius around the residences was similar to the 15-min life circle of the community [40], this study took the 500-m area around the residences of the respondents as the research scope (in the community). The walking time took the form of hours needed to collect data.
According to the survey, 34.16% of the respondents did not walk for more than half an hour on work days, and 63.43% of the respondents did not walk for more than one hour on work days. 27.71% of the respondents did not walk more than half an hour on rest days, and 50.62% of the respondents did not walk more than one hour on rest days. Of those who walked for less than half an hour, 90% owned a car and used it by themselves. These data indicate that a lack of physical activity among citizens in Fuzhou is common.

2.2.2. Explanatory Variables

The explanatory variables of this study included the built environment characteristics (Table 1). This study took the sample residences as the center of a circle and 500 m as the search radius to measure the built environment characteristics in this area. In this study, the characteristics mainly included the density of built environment, the diversity of the built environment facilities, the design of the built environment space, the destination accessibility, and the distance to transit of the built environment. Additionally, we wanted to increase the safety factors of the built environment. Considering foreign research and Chinese characteristics, we selected the factors of street population density and POI density for building environmental density. We determined street population density using data from China’s sixth population census in 2010. The POI density was based on the data of relevant interest points in Fuzhou City in 2017 obtained from a map application programming interface (API). We conducted a connection analysis using GIS software to evaluate the compactness of the social and economic activities in the communities. The higher the numerical value was, the more compact the community activities were. We determined the diversity of the built environment using a land-use mixing factor. We explained the function mixing degree of the land use with a data information entropy model. The higher the numerical value was, the higher the land mixing degree was.
We selected the accessibility of the public transport, living service facilities, catering facilities, commercial facilities, sports facilities, and park green space facilities as the explanatory variables for the accessibility of the built environmental facilities. Using the POI data captured by a map website, we expressed the accessibility of the facilities by the proportion of the POI number of various facilities in the range of 500 m to the POI number of all facilities. The higher the numerical value, the better the accessibility was and the higher the convenience.
We selected the quantity of park green space, the satisfaction in the community walking environment, the feelings related to the community green coverage, and the condition of the public space facilities as the explanatory variables for the spatial quality of the built environment. We selected community security and traffic safety as the explanatory variables for the security of the built environment. We defined park green space as the ratio of the number of park green spaces to the total land use within 500 m. Other explanatory variables were defined according to subjective evaluation data.
For the explanatory variables, we added the traffic modes and the degree of love for sports. We divided the traffic modes into non-individual motor traffic and individual motor traffic. We classified public transportation, nonmotorized vehicles, and walking trips as non-individual motorized trips with a value of 1. We classified cars, taxis, and electric vehicles as individual motorized trips, with a value of 0. The percentage of non-individual motorized trips in the sample was 46.8%, and the percentage of individual motorized trips was 53.2%. We generally believed that the physical activity of nonindividual motorized travel was higher than that of individual motorized travel. The degree of love for sports had an impact on the walking time.

2.2.3. Control Variable

Sample individual characteristics, such as age, gender, education level, marital status, psychological status, and income status, also affected physical activity (Table 1). This study controlled related variables together. The average age of the participants in the social survey was 31 years old, which we considered to be relatively young. Of these participants, 41% had higher education, 37.7% were women, and 62.8% were men.

3. Result Analysis

3.1. The Impact of an Urban Built Environment on Traffic Walking Time

Viewed from the influence of built environment density (Model 1, Table 2), we did not identify a significant correlation between the traffic walking time and the density of the street population. We also did not find a significant correlation between the length of the traffic walking time and the density of the POI, or the mixing degree of function in the community where the residents lived. At the 0.01 level in particular, the degree of functional mixing had a higher correlation with the length of traffic walking time, which verified that the density pointed out by Handy was an important measure for intervening physical activity [9]. The results, however, showed that the density was negatively correlated with the traffic walking time, which was contrary to the empirical conclusions of foreign countries. This contradiction likely is due to the fact that urban sprawl is more serious in North America. Urban development that relies too much on automobiles has a significant negative impact on physical activity, and increasing density has a significant impact on promoting walking time. Fuzhou, however, is a dense city in southeastern China, and it has a compact urban center. When the compactness is higher than a certain degree, the high-density agglomeration and the functional mixing will reduce the walking distance necessary for work and life to a very close range. Therefore, more intensive areas will account for less physical activity time.
The accessibilities of the built environmental facilities, catering facilities, commercial shopping facilities, financial outlets, living service facilities, and green park facilities were significantly related to traffic walking times. This relationship showed that convenient commercial service facilities had a positive significance for the promotion of the length of the traffic walking times of residents. The more accessible the built environment facilities were, the more beneficial it was to the promotion of the length of the traffic walking times of residents.
Individual travel patterns were correlated with the length of traffic walking times at a level of 0.1. We generally believed that the residents who used walking, bicycles, and public transportation traveled for a long time, whereas the residents who used private cars and taxis and other forms of motor transportation traveled for a short time.
To explore the impact of the environmental quality and safety factors on the traffic walking times and conduct a regression analysis, model 2 (Table 2) increased the proportion of park green space areas, reflecting the quality of the built environment space, the residents’ perception of the green coverage, and the satisfaction of the walking environment. Among these changes, the green area and walking environment satisfaction had no significant correlation, which was mostly a necessary behavior for traffic walking times, and there was essentially no requirement for environmental beauty. The perception of green coverage, however, was negatively correlated with walking time on weekdays, which was contrary to general thinking on the subject. The reason for this correlation was that most of the communities with a better greening effect were also those of higher quality. The residents of these communities primarily used motorized vehicles, and the traffic walking time was lower. Model 3 (Table 2) added community security and community traffic safety into the regression analysis, both of which were correlated with the length of traffic walking time. The better the community security was, the more conducive it was to promoting the walking times of residents.
On the basis of the regression results, gender, age, degree of higher education, marital status, psychological status, and income level had no significant correlation with the traffic walking time.

3.2. The Impact of the Urban Built Environment on Leisure Walking Time

Of the people surveyed, 58.4% said they would take part in recreational activities, including physical exercise, within 500 m of the community. On the basis of the built environment density (model 4, Table 2), POI density had a significant positive correlation with leisure walking time, which was contrary to POI density and traffic walking time. We analyzed the fact that the high POI density decreased the necessary walking time for transportation. For leisure activities, an increase in the POI density was conducive to promoting leisure walking activities. We did not find a significant correlation, however, between the street population density and the functional mix and walking times on rest days.
On the basis of the accessibility of the built environmental facilities, and according to the characteristics of leisure walking times, the POI proportion of the sports facilities and the degree of love for sports were increased. The results showed that leisure walking time had no significant correlation with catering, business, finance, life services, and other facilities, but it had a significant correlation with the POI proportion of sports facilities. The degree of love for sports had a positive impact on leisure walking time. Compared with traffic walking, leisure walking was more spontaneous, and people who loved sports had intended to walk for greater distances.
On the basis of quality of the built environment (model 5, Table 2), the conditions of public space facilities had a significant positive correlation with leisure walking activities, and the perception of green coverage was still negatively correlated. The reasons for this conclusion were the same as those for the impact on traffic walking behavior mentioned earlier. The impact of satisfaction with the walking environment, however, was not significant. In model 6 (Table 2), we added community security variables. The results showed that community security was positively correlated with leisure walking activities, but not with traffic safety. The reason for this result was that the study used the subjective evaluation of traffic safety by community residents as the analysis data. Because the residents subjectively considered that the community was generally relatively safe, the analysis results showed no significant correlation.
In this study, the control variables of gender, age, marital status, psychological status, and income level had no significant impact, but the degree of higher education had a significant negative correlation. Residents without higher education were more willing to engage in leisure walking activities, whereas residents with higher education had less time to engage in community leisure walking activities. We determined that the residents with higher education had more choices for other leisure activities, so they had less time for leisure walking in the community.

4. Conclusions and Recommendations

In this paper, we discussed the relationship between a built environment and walking times using a structural equation based on data from central Fuzhou. The empirical results showed that the factors of the length of walking time promoted by the built environment were essentially consistent with those of Western industrial countries. However, we identified some differences in the impact mechanism of built environment factors, which were related to the characteristics of urban development in China. The conclusions of this study are as follows:
  • The factors related to the walking times included the density (population density, POI density), function mixing degree, built environment design (greening rate, facility conditions, people’s use feelings), accessibility of purpose (richness of various facilities), and convenience of bus stops. These factors were generally consistent with the 5D elements of the built environment studied abroad.
  • Because of the high population densities and construction densities in the urban centers of China, the conclusions show that the density was negatively correlated with the time of traffic walking. Excessive density brought all kinds of transportation travel more close together, but it reduced the amount of physical activity, which was different from the low-density spread in cities in North America, but was consistent with the research of some domestic scholars in China [26]. However, the increase of POI density was conducive to promoting leisure activities.
  • The individual traffic trip mode had a positive correlation with the length time of traffic walking. The use of non-individual motorized travel (walking, bicycles, and public transport) was conducive to promoting physical activities and health.
  • Greening environment, accessibility of sports facilities, and facilities conditions played a positive role in promoting leisure walking time.
In the field of urban planning, paying attention to the built environment of cities will be conducive to promoting health. Urban functions should be moderately mixed. Urban density should be moderately compact. Facilities should have good accessibility. Good walking and non-motor-vehicle travel facilities should be constructed. Urban public transport should be developed. As many green environments as possible should be built to improve the quality of the space. More sports activities and sports facilities that can be used fairly should be set up. A good community atmosphere should be created. All of these conditions will promote the physical activities of residents and help to enhance the health of the population.
Influenced by data and space, this research has the following shortcomings: (1) The time data for the walking time used in this paper adopted the subjective report value of the respondents, which introduced the problem of credibility. (2) The traffic walking time and leisure walking time had some intersections, and it was difficult to distinguish them clearly. (3) The factors of various elements of the built environment should be further studied and determined. (4) The study should further track the impact of improvements to the community built environment on walking time. This paper discusses an empirical study on the built environment and physical activity in China. Future research will be conducted. It is expected that to promote urban design and to pay more attention to healthy built environments, relevant guidelines will be formed to guide the design of these built environments.

Author Contributions

Conceptualization, L.Z. and Y.M.; Methodology, Y.Z.; Software, L.Z.; Validation, Y.Z.; Formal Analysis, L.Z.; Investigation, L.Z., Y.Z. and Y.M.; Data Curation, L.Z.; Writing-Review & Editing, Z.S.; Supervision, Z.S.

Funding

This research was sponsored by Natural Science Foundation of Fujian Province, No. 2018J01747.

Conflicts of Interest

The authors declare no conflict of interest.

References

  1. Xuan, Z.; Wei, C.; Fu, H. Modern concept of healthy city. Shanghai J. Prev. Med. 2002, 14, 197–199. [Google Scholar]
  2. Wang, L.; Liao, S.; Zhao, X. Exploration of approaches and factors of healthy city planning. Urban Plan. Int. 2016, 31, 4–9. [Google Scholar] [CrossRef]
  3. Jackson, L.E. The relationship of urban design to human health and condition. Landsc. Urban Plan. 2003, 64, 191–200. [Google Scholar] [CrossRef]
  4. Tan, S.; Guo, J.; Jiang, Y. Impact of human settlements on public health: New frontier in urban planning research. Urban Plan. Forum 2010, 4, 66–70. [Google Scholar]
  5. Saelens, B.E.; Handy, S.L. Built environment correlates of walking: A review. Med. Sci. Sports Exerc. 2008, 40, 550–566. [Google Scholar] [CrossRef] [PubMed]
  6. Li, Z.; Xiang, J.; Liu, X.; Zhang, Y.; Wang, J.; Xu, L. New progress in sports for health research. Sports Sci. Res. 2012, 2, 1–15. [Google Scholar]
  7. Handy, S.L.; Boarnet, M.G.; Ewing, R.; Killingsworth, R.E. How the built environment affects physical activity: Views from urban planning. Am. J. Prev. Med. 2002, 23 (Suppl. 1), 64–73. [Google Scholar] [CrossRef]
  8. Cervero, R.; Kockelman, K. Travel demand and the 3Ds: Density, diversity and design. Transp. Res. D 1997, 2, 199–219. [Google Scholar] [CrossRef]
  9. US Department of Health and Human Services. Physical Activity and Health: A Report of the Surgeon General; Department of Health and Human Services & Centers for Disease Control and Prevention: Atlanta, GA, USA, 1996.
  10. Wang, J.; He, Y. Health-Related Physical Fitness; People’s Physical Culture Publishing House: Beijing, China, 2008; pp. 81–97, 206–273. [Google Scholar]
  11. Ewing, R.; Cervero, R. Travel and the built environment: A meta-analysis. J. Am. Plan. Assoc. 2010, 76, 265–294. [Google Scholar] [CrossRef]
  12. He, X.; Chen, Q.; Zhuang, J. Qualitative and quantitative index system of built environment affecting physical activities. Sports Sci. 2014, 35, 52–58. [Google Scholar]
  13. Kelly-Schwartz, A.C.; Stockard, J.; Doyle, S.; Schlossberg, M. Is Sprawl unhealthy? A multilevel analysis of the relationship of Metropolitan sprawl to the health of individuals. J. Plan. Educ. Res. 2004, 184–196. [Google Scholar] [CrossRef]
  14. Yang, J.; French, S. The Travel-obesity connection: Discerning the impacts of commuting trips with the perspective of individual energy expenditure and time use. Environ. Plan. B Plan. Des. 2013, 617–629. [Google Scholar] [CrossRef]
  15. Vojnovic, I. Building communities to promote physical activity: A multi-scale geographical analysis. Geogr. Ann. Ser. B Hum. Geogr. 2006, 88, 67–90. [Google Scholar] [CrossRef]
  16. Frank, L.; Pivo, G. Impacts of mixed use and density on utilization of three modes of travel: Single-occupant vehicle, transit, and walking. Trans. Res. Rec. 1994, 1466, 44–52. [Google Scholar]
  17. Greenwald, M.; Boarnet, M. Built environment as determinant of walking behavior: Analyzing nonwork pedestrian travel in Portland, Oregon. Trans. Res. Rec. J. Trans. Res. Board 2001, 1780, 33–41. [Google Scholar] [CrossRef]
  18. Coogan, P.; White, L.; Adler, T.; Hathaway, K.; Palmer, J.; Rosenberg, L. Prospective study of urban form and physical activity in the black women’s health study. Am. J. Epidemiol. 2009, 170, 1105–1117. [Google Scholar] [CrossRef] [PubMed]
  19. Forsyth, A.; Oakes, J.M.; Schmitz, K.H.; Hearst, M. Does residential density increase walking and other physical activity? Urban Stud. 2007, 44, 679–697. [Google Scholar] [CrossRef]
  20. Frank, L.D.; Engelke, P.O. The built environment and human activity patterns: Exploring the impacts of urban form on public health. J. Plan. Lit. 2001, 16, 202–218. [Google Scholar] [CrossRef]
  21. Learnihan, V.; Van Niel, K.P.; Giles-Corti, B.; Knuiman, M. Effect of scale on the links between walking and urban design. Geogr. Res. 2011, 49, 183–191. [Google Scholar] [CrossRef]
  22. McCormack, G.R.; Rock, M.; Toohey, A.M.; Hignell, D. Characteristics of urban parks associated with park use and physical activity: A review of qualitative research. Health Place 2010, 16, 712–726. [Google Scholar] [CrossRef]
  23. Frank, L.D.; Andresen, M.A.; Schmid, T.L. Obesity relationships with community design, physical activity, and time spent in cars. Am. J. Prev. Med. 2004, 27, 87–96. [Google Scholar] [CrossRef]
  24. Nelson, M.C.; Gordon-Larsen, P.; Song, Y.; Popkin, B.M. Built and social environments associations with adolescent overweight and activity. Am. J. Prev. Med. 2006, 31, 109–117. [Google Scholar] [CrossRef]
  25. Boarnet, M.; Greenwald, M.; McMillan, T. Walking, urban design, and health. J. Plan. Educ. Res. 2008, 27, 341–358. [Google Scholar] [CrossRef]
  26. Handy, S.L.; Cao, X.; Mokhtarian, P. Correlation or causality between the built environment and travel behavior? Evidence from Northern California. Trans. Res. Part D 2005, 10, 427–444. [Google Scholar] [CrossRef] [Green Version]
  27. Wells, N.; Yang, Y. Neighborhood design and walking. A quasi-experimental longitudinal study. Am. J. Prev. Med. 2008, 34, 313–319. [Google Scholar] [CrossRef] [PubMed]
  28. Kristian, L.; Gilliland, J.; Hess, P.; Tucker, P.; Irwin, J.; He, M. The influence of the physical environment and sociodemographic characteristics on children’s mode of travel to and from school. Am. J. Public Health 2009, 99, 520–526. [Google Scholar]
  29. Krizek, K.J.; Johnson, P.J. Proximity to trails and retail: Effects on urban cycling and walking. J. Am. Plan. Assoc. 2006, 72, 33–42. [Google Scholar] [CrossRef]
  30. Borst, H.C.; de Vries, S.I.; Graham, J.M.A.; van Dongen, J.F.E.; Bakker, I.; Miedema, H.M.E. Influence of environmental street characteristics on walking route choice of elderly people. J. Environ. Psychol. 2009, 29, 477–484. [Google Scholar] [CrossRef]
  31. Rhodes, R.E.; Brown, S.G.; McIntyre, C.A. Integrating the perceived neighborhood environment and the theory of planned behavior when predicting walking in a Canadian adult sample. Am. J. Health Promot. 2006, 21, 110–118. [Google Scholar] [CrossRef] [PubMed]
  32. Inoue, S.; Ohya, Y.; Odagiri, Y.; Takamiya, T.; Kitabayashi, M.; Sallis, J.F.; Shimomitsu, T. Association between perceived neighborhood environment and walking among adults in 4 cities in Japan. J. Epidemiol. 2010, 20, 277–286. [Google Scholar] [CrossRef]
  33. Humpel, N.; Owen, N.; Leslie, E.; Marshall, A.L.; Bauman, A.E.; Sallis, J.F. Associations of location and perceived environmental attributes with walking in neighborhoods. Am. J. Health Promot. 2004, 18, 239–242. [Google Scholar] [CrossRef]
  34. Troped, P.J.; Wilson, J.S.; Matthews, C.E.; Cromley, E.K.; Melly, S.J. The built environment and location-based physical activity. Am. J. Prev. Med. 2010, 38, 429–438. [Google Scholar] [CrossRef]
  35. Kwan, M.P. The uncertain geographic context problem. Ann. Assoc. Am. Geogr. 2012, 102, 958–968. [Google Scholar] [CrossRef]
  36. Shanghai Planning and Land Resource Bureau; Shanghai Planning Center; Shanghai Urban Planning and Design Research Institute. Planning Research and Practice of 15 Minutes’ Community Life Circle; Shanghai Renmin Press: Shanghai, China, 2017.
  37. Zhang, Y.; Wang, L. An exploration of health-oriented design guideline: Based on the experience of NYC and LA. S. Archit. 2017, 4, 15–22. [Google Scholar]
  38. Sun, B.; Yan, H.; Zhang, T. Impact of community built environment on residents’ Health: A case study on individual overweight. Acta Geogr. Sin. 2016, 71, 1721–1730. [Google Scholar]
  39. Lu, F.; Tan, S. Built environment’s influence on physical activity: Review and thought. Urban Plan. Int. 2015, 30, 62–70. [Google Scholar]
  40. Weng, X.; He, X.; Wang, X.; Lin, W.; Li, D. Influence of urban architectural environment on resident physical activity and health—A new field of sports and health promotion research. China Sport Sci. 2010, 30, 3–11. [Google Scholar]
Figure 1. Sample residence distribution map.
Sustainability 11 00691 g001
Table 1. Measurement and descriptive statistics of variables.
VariableMeasurement MethodData SourcesMean ValueStandard Deviation
Explained Variable
Traffic Walking TimeUnit: hourSocial Survey0.951.30
Leisure Walking TimeUnit: hourSocial Survey0.360.96
Explanatory Variable
Population DensityDensity of Resident Population in the Subdistricts and Townships Where the Community is Located
Unit: 10,000 people/km2
The Sixth Population Census in Fuzhou City in 20101.271.33
Point of Interest (POI) DensityNumber of POI within a Radius of 500 m from a Residence
Unit: 10,000
A Map Website0.030.04
Land Use MixednessInformation Entropy Formula
H(x) = − Σ p(x) log2p(x)
A Map Website0.290.28
Proportion of POI in Catering FacilitiesProportion of POI in Catering within a 500 m Radius of a Residence to the total POI in this areaA Map Website15.00%16.07%
Proportion of POI in Commercial FacilitiesProportion of POI in Shops within a 500 m Radius of a Residence to the total POI in this areaA Map Website21.61%22.57%
Proportion of POI in Living Service FacilitiesProportion of POI in Living Service Facilities within a 500 m radius of a Residence to the total POI in this areaA Map Website10.19%10.79%
Proportion of POI in Sports FacilitiesProportion of POI in Sports Facilities within a 500 m Radius of a Residence to the total POI in this areaA Map Website0.02%0.02%
Proportion of POI in Park Green SpaceProportion of POI in a Park Green Space within a 500 m Radius of a Residence to the total POI in this areaA Map Website0.01%0.02%
Number of Bus StopsNumber of Bus Stops within a 500 m Radius of a ResidenceA Map Website2.312.83
Traffic Trip ModeNon Individual Motorization = 1
Individual Motorization = 0
Social Survey0.470.50
Park Green Area RatioProportion of Park Green Area within a 500 m Radius of a Residence to Total AreaLand-Use Map of Fuzhou City7.71%11.83%
Perception of Green Coverage RatioGood Sunshade Effect = 4~Poor Sunshade Effect = 1Social Survey2.600.79
Walking Environmental SatisfactionVery Satisfied = 4~Very Dissatisfied = 1Social Survey2.730.72
Facilities Conditionsvery Plentiful = 4~Very Scarce = 1Social Survey2.900.85
Degree of Love For SportsVery Like = 4~Very Dislike = 1Social Survey2.800.73
Community SecurityNot Very Worried = 4~Very Worried = 1Social Survey2.580.82
Community Traffic SecurityNot Very Worried = 4~Very Worried = 1Social Survey2.580.83
Control Variable
GenderFemale = 1, Male = 0Social Survey0.380.48
AgeUnit: yearSocial Survey31.059.34
Whether or not Enrolled in Higher EducationYes = 1, No = 0Social Survey0.410.49
Marital StatusMarried = 1, Unmarried = 0Social Survey0.630.48
Psychological StatusNever Depressed = 4~Depressed = 1Social Survey2.980.58
Income StatusLower Level = 1~Upper Level = 5Social Survey2.480.92
Table 2. Results of the regression analysis (ordinary least squares).
Traffic Walking TimeLeisure Walking Time
Model 1Model 2Model 3Model 4Model 5Model 6
Population Density−0.010−0.012−0.016−0.018−0.017−0.012
POI Density−0.085 *−0.082 *−0.088 *0.083 *0.084 *0.091 *
Land Use Mixedness−0.509 ***−0.502 ***−0.508 ***−0.178−0.153−0.145
Number of Bus Stops0.0440.0350.0470.002−0.004−0.010
Proportion of POI in Catering Facilities0.262 ***0.264 ***0.264 ***0.0360.0280.029
Proportion of POI in Commercial Facilities0.140 **0.142 **0.146 **0.0320.026−0.019
Proportion of POI in Financial facilities0.090 **0.087 **0.086 **0.0160.013−0.013
Proportion of POI in Living Service Facilities0.132 *0.129 *0.133 *−0.038−0.041−0.045
Proportion of POI in Park Green Space0.224 ***0.225 ***0.228 ***−0.032−0.036−0.041
Traffic Trip Mode−0.037 *−0.037 *−0.038 *0.0480.0480.049
Park Green Area Ratio −0.044−0.053 0.4910.525
Perception of Green Coverage Ratio −0.076 **−0.075 ** −0.069 **−0.070 **
Walking Environmental Satisfaction 0.0420.053 −0.033−0.048
Proportion of POI in Sports Facilities 0.182 **0.079 **0.078 **
Degree of Love For Sports 0.130 ***0.135 ***0.136 ***
Facilities Conditions 0.069 **0.067 **
Community Security 0.059 * 0.101 ***
Community Traffic Security 0.054 * 0.025
Whether or not Enrolled in Higher Education−0.052−0.048−0.049−0.134 ***−0.132 ***−0.130 ***
Gender0.003−0.003−0.004−0.014−0.013−0.013
Age−0.012−0.018−0.0090.0050.007−0.005
Marital Status−0.006−0.005−0.0080.1560.0510.156
Psychological Status−0.045−0.040−0.036−0.016−0.002−0.007
Income Status0.0400.0480.046−0.008−0.005−0.003
B363.376447.711343.03749.22951.03431.598
R20.0570.0530.0480.0510.0540.061
Sig0.0000.0000.0000.0000.0000.000
Notes: ***, **, * were significant at 0.01, 0.05 and 0.1 levels, respectively.

