Color Characteristics of Red False Heartwood and Mature Wood of Beech (Fagus sylvatica L.) Determining by Different Chromacity Coordinates

Department of Wood Technology, Faculty of Wood Sciences and Technology, Technical University in Zvolen, T. G. Masaryka 24, 96053 Zvolen, Slovakia
*
Authors to whom correspondence should be addressed.
Sustainability 2019, 11(3), 690; https://doi.org/10.3390/su11030690
Submission received: 19 December 2018
/
Revised: 21 January 2019
/
Accepted: 25 January 2019
/
Published: 28 January 2019
(This article belongs to the Special Issue Sustainability in Wood Science)
Abstract
:Structure of wood can affect intensity of color change in remarkable ways. This article was focused on the analysis of the color changes red false heartwood and mature wood by different methods such as ΔE* (Total color difference), h* (Hue angle), C*ab (Color saturation) and Sab (Saturation). The aim of this study was to evaluate the color properties of red false heartwood and mature wood by using different chromacity coordinates. Our observations suggested that the density in the absolute dry state was equal between the red false heartwood and mature wood. The biggest difference was in the area of the free water domain, thus from an initial MC value to the fiber saturation point (FSP). The shorter drying time of the red false heartwood samples was caused by their lower initial MC. Due to the different MC, the temperature created a different color intensity of the compared samples. Mature wood samples achieved more saturated color in the drying process than did the samples of red false heartwood.
1. Introduction
Beech wood (Fagus sylvatica L.) is the most common wood species in the Slovak Republic. This wood type has a large number of defects such as red heartwood, reaction wood (i.e., tension wood) and dote and so forth [1,2]. Red false heartwood formation, in general, is associated with the breaking down of the water transport system and decreasing vitality of the parenchyma tissues [3,4]. The phenomenon of beech red false heartwood considerably affecting the quality of logs and timbers has been an area of professional and scientific interest for more than 100 years [5,6]. The structure of the red false heartwood noticeably affects the amount of thyloses in cells, which remarkably reduces the kinetics of water movement. Also, it has been found that the content of thyloses in red false heartwood limits the kinetics of drying only above the fiber saturation point (FSP), while below the FSP the drying of both samples is balanced.
Wood color depends on numerous parameters, such as wood species, age, grain direction and drying may affect the original color of wood as well. The surface color change of beech wood, red false heartwood and mature wood during drying is essentially due to the chemical reactions of the accessory compounds and cell wall components [7,8]. Sometimes, the discoloration of wood due to kiln drying occurs as a major problem during the wood processing. The drying conditions can affect the intensity of color change. The color of wood characterizes the appearance of wood and is determined by chemical compounds cellulose, hemicelluloses, lignin and extractives [4,9]. Thus, high temperature drying of wood is a special process of drying characterized by applying the high temperature (temperature above 100 °C). A typical feature of this special process is to obtain in a very short time the drying and property changes of dried wood. Based on the research [4] color changes could be more noticeably detected in sapwood samples than in the red false heartwood samples.
These findings showed that for all measurements, sapwood samples showed a more noticeable value of color difference than red false heartwood samples. It was noticed that the change in the lightness of light wood with heat treatment was much greater than that of not dry wood. Fewer color changes were observed with a low relative humidity.
A chemical explanation of wood color changes [10,11] indicates the influence of drying and steaming on the color of press-extracted wood fluids, regarding extractives in wood fluids as the main wood pigments. Relationships between wood color and phenolic content are discussed in the publication [12]. The surface of the lignocellulosic material changes its color due to external factors and the resulting color shade is the result of the complex chemical changes of extractives, polysaccharides and lignin. Colorimetry is a suitable method for obtaining objective information on the color change of wood [13]. I shall refer to article [14], where unsaturated chemical bonds present in these substances can be easily transferred to a chemically excited state with a minimum amount of energy these groups are named chromophores. The chromophores are functional groups that provide color to the materials because they are able to absorb ultraviolet and/or visible radiation [15]. These compounds can assist in the action of the chromophore groups by means of intensification or absorption of light at longer wavelengths, which correspond to the reddish color characteristic for wood [15]. There are few reports on which color measurement was made on the wide variation of wood species using the CieL*a*b* color system, and relationships among the values of the color system [15,16,17]. This article was focused on the analysis of color changes of red false heartwood and mature wood by different methods like ΔE* (Total color difference), h* (Hue angle), C*ab (Color saturation) and Sab (Saturation). The aim of this study was to evaluate the color properties of red false heartwood and mature wood by using different chromacity coordinates.
2. Material and Methods
Beech wood (Fagus sylvatica L.) was used for the experimental measurements. Samples were chosen from two beech logs with a diameter of 45 cm and length of 100 cm. Beech logs were selected from forests belonging to the University Forest Enterprise of the Technical University in Zvolen, Slovakia. Samples were signed as mature wood (MW) and red false heartwood (FW). The test samples of mature wood and red false heartwood were selected with a thickness of 30 mm, width of 100 mm, and length of 300 mm. Measurements were conducted on all the samples, both before and after the drying process. The process of high temperature drying was conducted in a laboratory kiln Memmert HCP 108 (Memmert GmbH + Co. KG, Schwabach, Germany). The drying schedule was divided into two phases. The first phase was heating, where the drying temperature was raised to 90 °C and the relative humidity was 91 ± 0.5%. The temperature of the dry bulb (td) was set to 90 °C and maintained in the first phase of the drying process until the moisture content in the samples did not decrease below approximately 30% of the FSP. In turn, the relative humidity of surrounding air (φ) was set to 90%. After decreasing the moisture content below the fiber saturation point in both samples, the temperature of the dry bulb increased up to 120 °C and the relative humidity lacked regulation. The last part of the drying schedule was cooling to approximately 20 °C. The average final moisture content was 10% ± 1%. The oven-dry method was used for the moisture content determination. The weighing was performed with an accuracy of 0.01 g. The drying process to an absolute dry condition was performed in a laboratory kiln at 103 °C ± 2 °C. The moisture content (MC) was calculated using Equation (1) according the norm STN EN 49 0103.
where: mw is the weight of the wet sample (g) and m0 is the weight of the absolutely dry sample (g).
Density in an absolute dry state was determined for every sample with the content of red false heartwood and mature wood. The measurement was performed under laboratory conditions. Density in an absolute dry state was calculated by Equation (2) according the norm STN EN 49 0103.
where: m0 is the weight of oven-dried moisture samples (kg) and V0 is the volume of oven-dried moisture samples (m−3).
The temperature was measured using T-type thermocouples that were connected to the control panel (Comet MS6R) and recorded every 60 s in both groups of samples. The locations of thermocouples for measuring the temperatures were located on the radial side.
Based on the cited work [18] color measurements of all samples (30) were recorded on the surface of wood specimens before/after drying and after milling 2 mm from surface with a colorimeter CR-10 Color Reader. All color parameters are described below and were calculated (determined), using the following Equations (3)–(6).
Color difference ΔE
where: L1*, a1*, b1*—the values of color spectra before drying process, L2*, a2*, b2*—the values of color spectra after drying process or milling process.
The scale of ΔE* was classified according to the grading rules reported in Table 1 by reference [19]. All these properties (hue angle, color saturation and saturation) were measured with use [18].
Hue angle h*
Hue angle [18] is one of the main properties of a color, defined technically (in the CIECAM02 model). The transformed L*, a*, b* values are used in calculation of hue angle, chroma and lightness, chroma and hue differences and these quantities are designated by a prime mark in the equations. For determining of the hue angle, Equation (4) was used.
Color saturation C*ab
Intensity of color was measured by Color saturation [18]. For determining color saturation, Equation (5) was used.
Saturation Sab
The saturation [18] of a color is determined by a combination of light intensity. The most saturated color is achieved by using just one wavelength at a high intensity, such as in a laser light (using Equation (6))
3. Results and Discussion
Table 2 shows the values of initial and final moisture contents, density in absolute dry state, and drying times of red false heartwood samples and the comparative samples, which were prepared from the mature wood zones.
From the measured data, there was a remarkable difference in the initial moisture content of the compared groups. Initial moisture of the mature wood was nearly 20% higher than the red false heartwood samples. These differences are in concordance with different microscopic structures of zones.
The density was measured at 0% MC (ρo), which were almost the same for both groups of samples. Thus, the density of the red false heartwood did not differ from the density of mature wood. The present observations were consistent with publications [1,8,20]. The final moisture values of the compared groups can be considered to be almost identical.
The drying time of samples from the red false heartwood was almost 2 h shorter than the mature wood, which was due to the lower initial moisture content (MW). The drying curves of samples are shown in Figure 1.
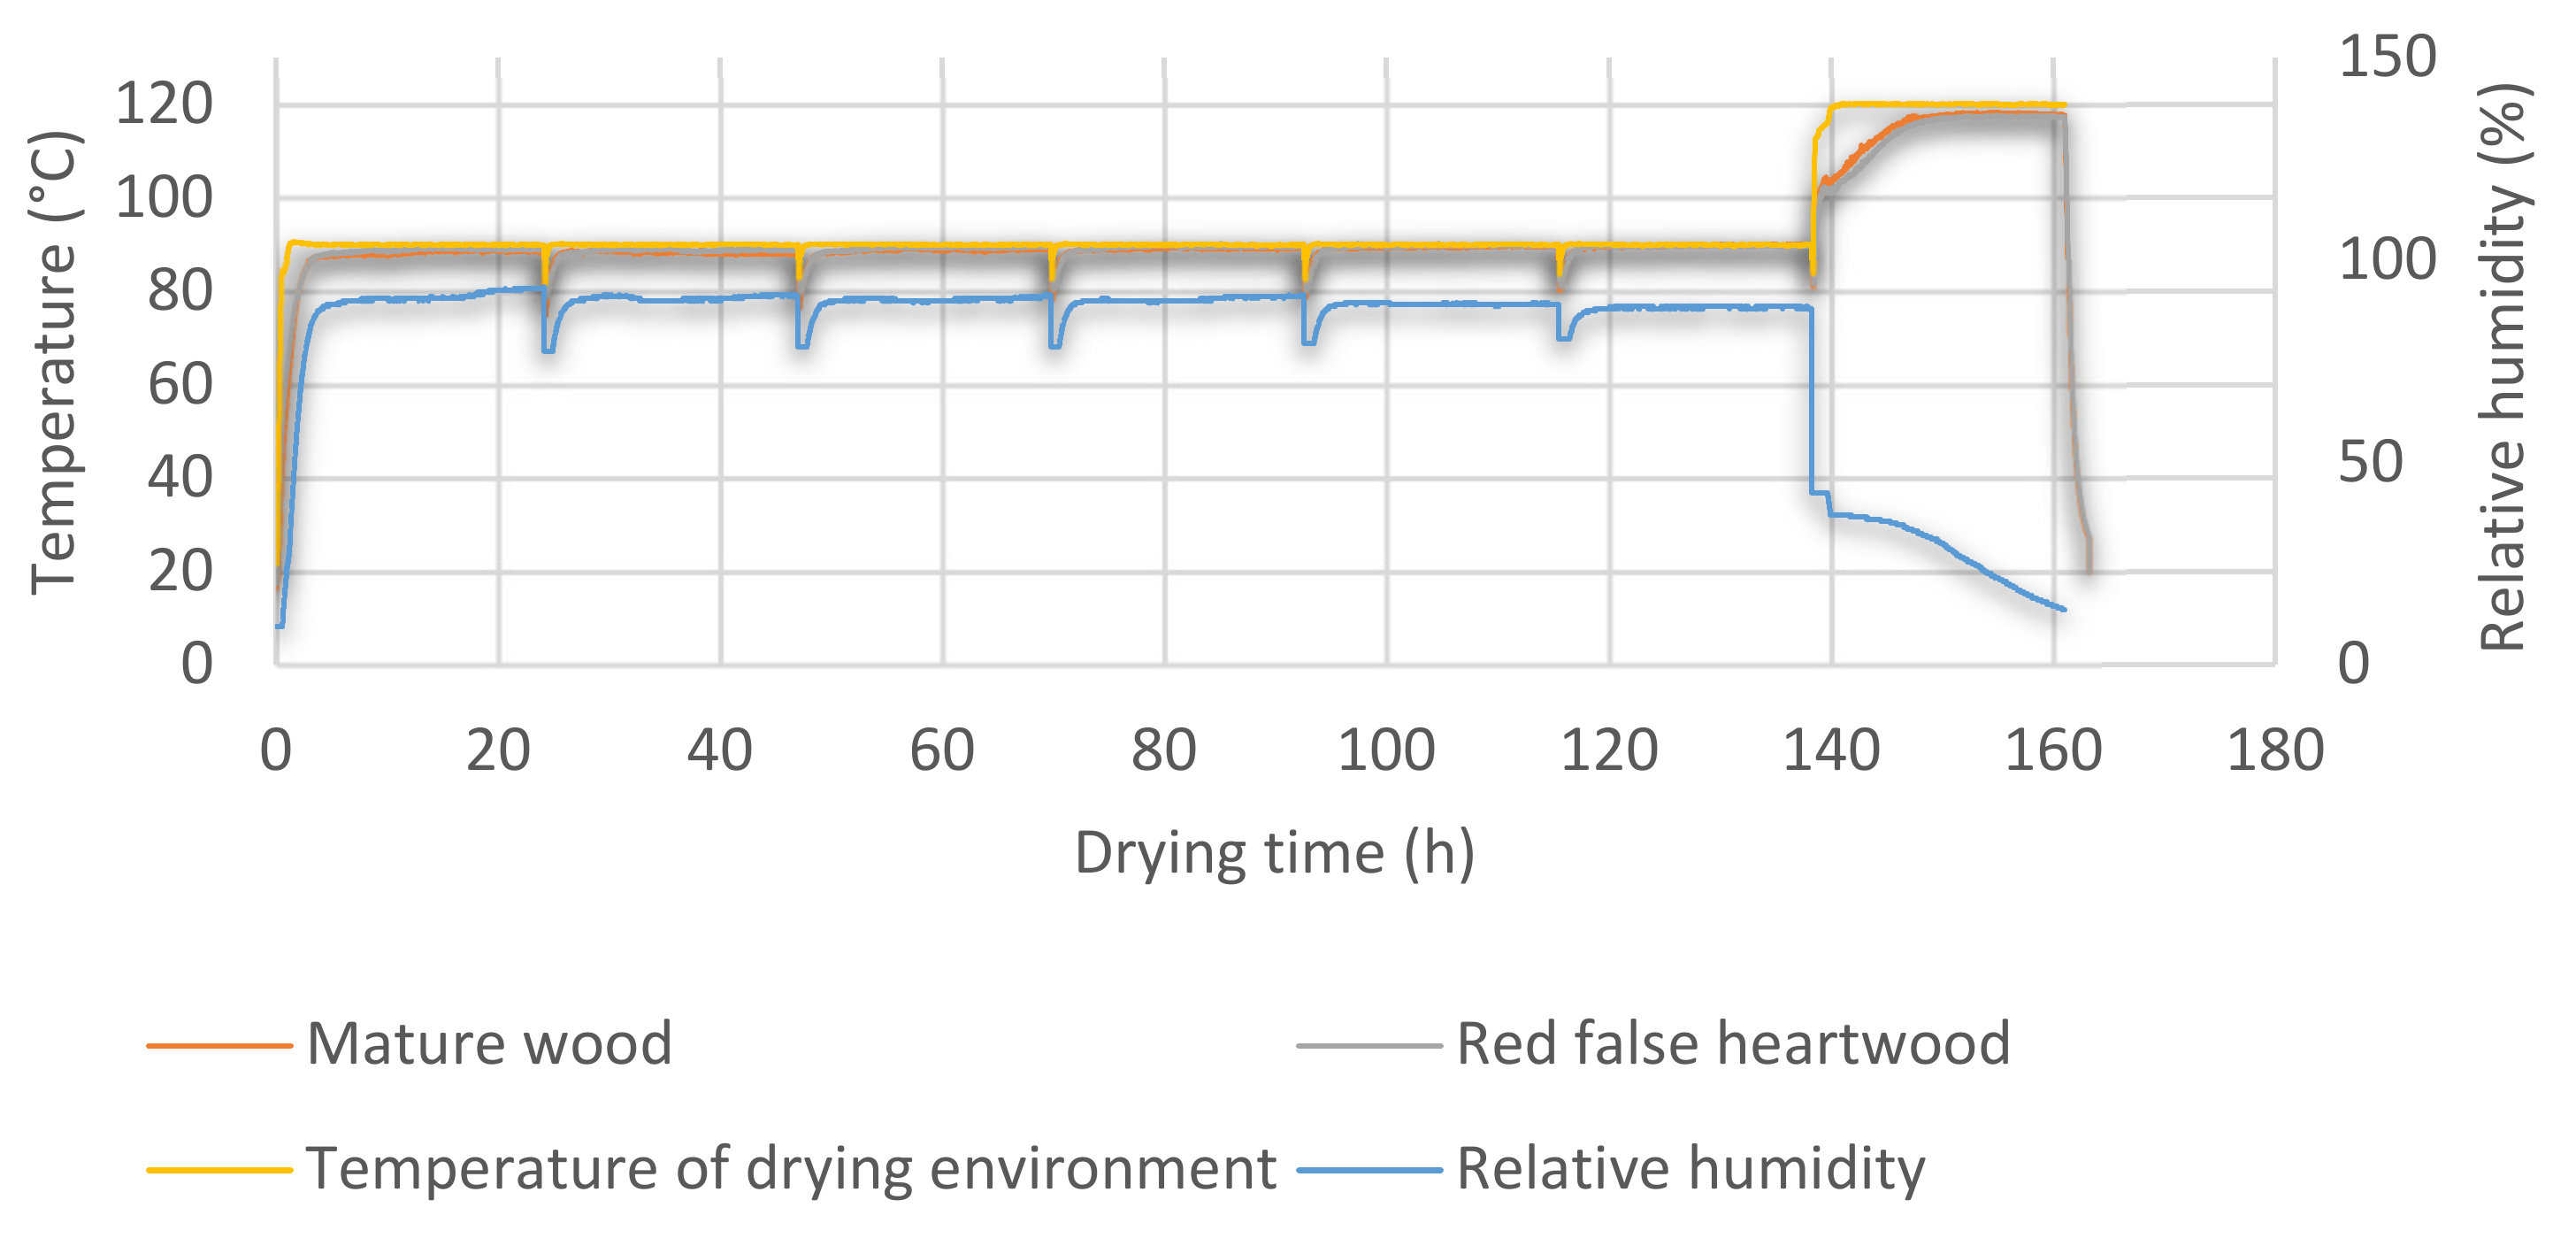
Figure 2 shows the temperature patterns measured in the middle of the samples during the drying process and the temperature of the surrounding air. Based on the comparison of the temperature curves measured in the middle of the dried samples, there was no noticeable difference between the samples with red false heartwood and samples with mature wood.
The paths of both curves were almost identical and the difference between the sample temperatures and temperature of drying environment gradually decreased. The greatest differences were only in the first 60 h of drying. Afterwards, the average difference between the environment temperature and the samples was 1 °C. After the increase of the drying temperature to 120 °C, the temperature increase was more rapid in the mature wood than in the red false heartwood.
The difference could be explained by the different MC during the temperature increase. The moisture contents were 29% and 22% of mature wood and red false heartwood samples, respectively. At the end of the drying process, the temperatures of the compared samples were equal and were approximately 3 °C lower than the temperature of the drying environment.
Table 3 shows average values and basic statistical characteristics of color parameters L*, a*, b* before/after drying and after the milling process.
The highest difference was in the L* coordinate, which reflects the lightness. As also shown, differences between the compared groups of samples are statistically significant. For averaged values before drying, the color difference between the red false heartwood and the mature wood is visible.
Mature wood was lighter than the red false heartwood before drying. After drying the value of the coordinates L* rapidly decreased for mature wood, leading to the mature wood becoming darker than the red false heartwood. After milling the surface layers in both groups of samples, the L* coordinates were almost identical.
Coordinates a* and b* were lower for samples of red false heartwood. All color coordinates in both groups (FW and MW) were increased after the drying process. Values of the color space a* and b* after milling (2 mm) in both groups were almost identical. The color of FW samples changed considerably less than that of the MW by high temperature drying process. After all processes, color differences were minimal and the MW reached the color shade of the samples from the FW.
The present observations were consistent with publications [4,5,9]. The chemical composition of wood noticeably affected the lightness of color. The yellow tones of wood are primarily governed by the photochemistry of wood, particularly in lignin [21,22,23]. The wood color change in the drying process was influenced by the reactions of the degradation products of the wood substance and also by the chemical changes of extractives and lignin.
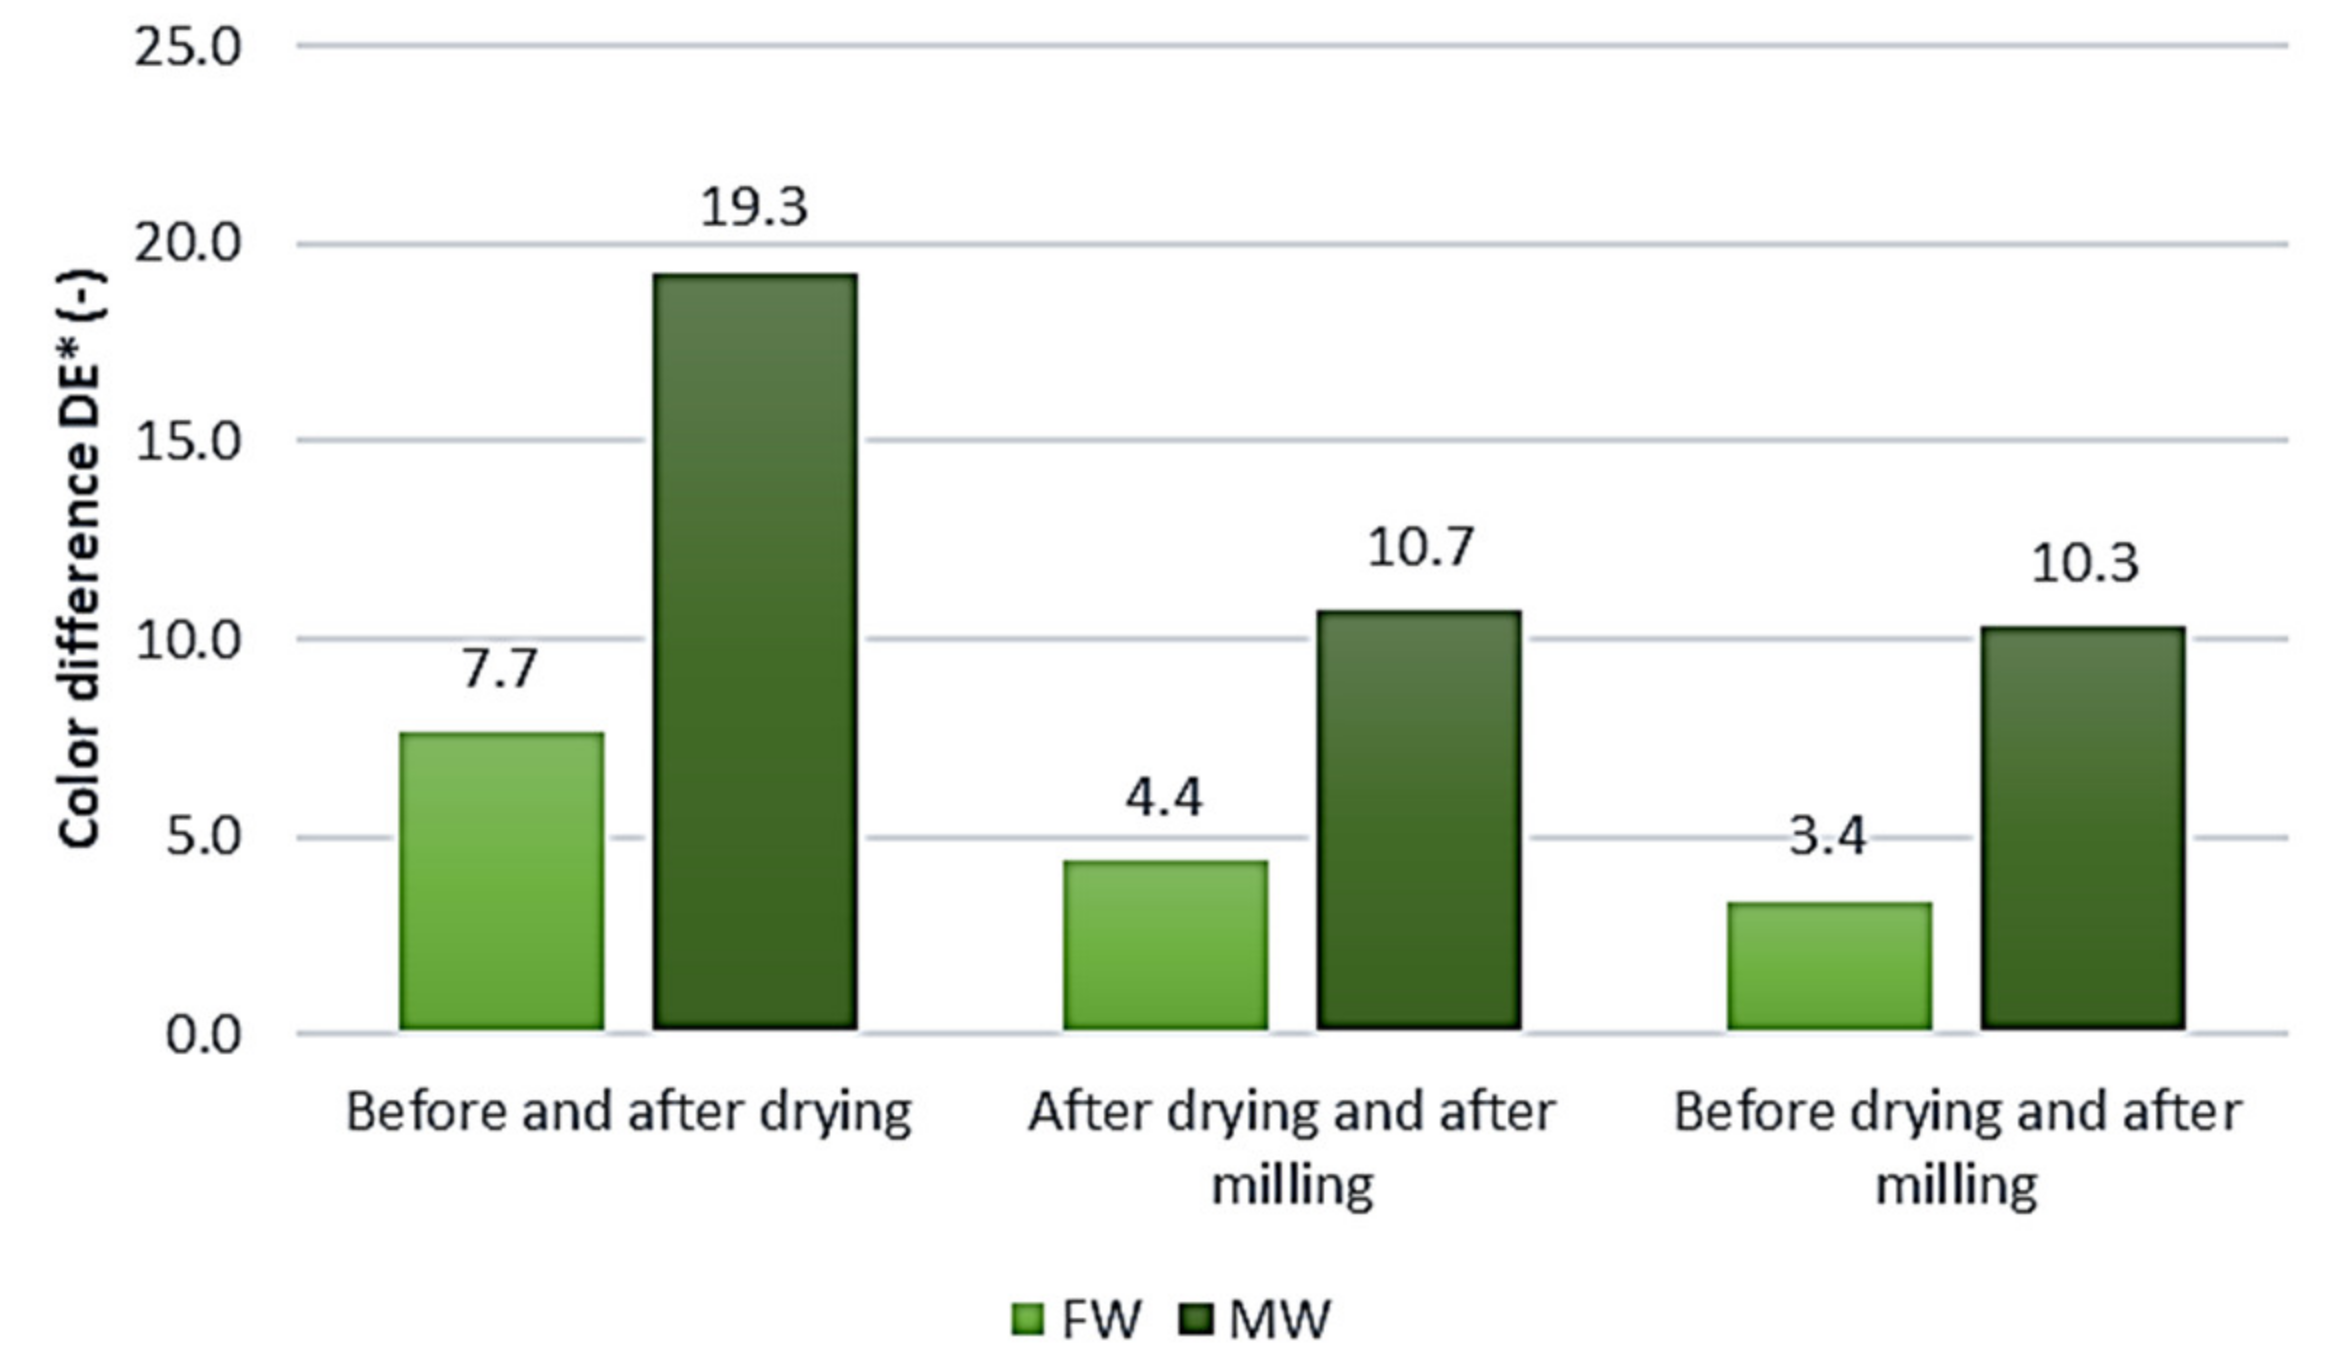
Our findings confirmed color difference values (Figure 3) and show that the color change in mature wood before and after drying was remarkable and was visible to the naked eye (ΔE* > 12). For red false heartwood samples, the color change was not so marked, but the change was measurable in scale (12 > ΔE* > 6). Based on the publication [9], total color difference ΔE* between dried and non-dried samples ranged from 14.4—20.5 depending on the used drying schedule. In all cases there was a clearly noticeable change of color, i.e., different colors originated.
The color differences before drying, after drying and after the milling process of the samples were much lower in the red false heartwood. Mature wood in the drying process achieved more saturated color than the samples of red false heartwood. The results of authors [4] suggested that it is possible to see the problems of the temperature influence on color changes of beech wood during specific conditions of the drying process. According to the knowledge of the authors in reference [20], colorimetric measuring is useful in quality control and for the evaluation of color of the end products after HT drying. Based on the cited works [5,6,14,22], the mechanism of the origin of the color changes is a complicated process and a lot of differences and degradation products participate in this process.
The calculated values of hue angle, color saturation and saturation are shown in Table 4. Graphical representation of hue angle for a sample of the red false heartwood, and mature wood are shown in Figure 4.
In opponent color spaces in which two of the axes are perceptually orthogonal to lightness, such as the CieL*a*b* color spaces, hue may be computed together with chroma by converting these coordinates from rectangular form to polar form. Hue is the angular component of the polar representation, while chroma is the radial component [18,19].
The hue angle value was lower on the red false heartwood than on the mature wood samples as seen in Figure 4.
A noticeable decrease of hue angle value towards russet color occurs during the drying process. The russet coloration is caused by chromophores, mainly involving lignin chromophores. Double bonds and carboxyl groups conjugated with benzene ring belong to these chromophores. Their effect can be increased by auxochromes (-OH, -OCH3) [18].
Hue angle values after the removal of the surface layer were almost equal when comparing the groups of samples (FW – MW). The color under the surface was slightly lighter. Less remarkable color changes occurred in the red false heartwood and these measurements are confirmed by the C*ab and Sab parameters, which are shown in Table 4.
Remarkable color changes of the samples from mature wood in the drying process were due to different MC of samples in the first part of drying from initial moisture to FSP. As shown in Table 2, samples of mature wood had an initial moisture content of more than 20% higher than the red false heartwood samples. During the whole drying process all samples had higher moisture content (Figure 1). Temperatures measured in the middle of samples of mature wood and the red false heartwood were almost the same in all drying process. Due to the different MC, the temperatures created different color intensities for the compared samples. Mature wood samples achieved more saturated color in the drying process than the samples of red false heartwood.
4. Conclusions
- (1)
- Based on the results FW had a noticeably lower (MCi) than the samples with content of mature wood. The difference of MCi was almost 19%. The values of final moisture content were balanced.
- (2)
- Density in a dry state did not differ between the red false heartwood and mature wood.
- (3)
- The red false heartwood samples were dried more slowly in the whole process compared to the mature wood samples. The biggest difference was in the area of the free water domain, thus from a MCi value to the fiber saturation point (FSP). The shorter drying time of the red false heartwood samples was caused by their lower initial MC. Based on measured values, there was no difference in the drying intensity between the mature wood and the red false heartwood samples. This indicates that a reduced permeability of the red false heartwood of the beech is caused by thyloses in cells.
- (4)
- Temperatures of both groups were measured by thermocouples in the middle of samples. Final values of temperatures were identical in FW and MW.
- (5)
- The changes in coordinates of the color space (L*, a*, b*) were higher after the drying process in mature wood. The biggest change was measured in the lightness coordinates (L*). Red false heartwood and mature wood had almost identical lightness at the end of the drying process.
- (6)
- Calculated values of the color difference ΔE* confirmed that the color of MW was almost identical to the red false heartwood samples. Thus, our observations provide that the change in color of mature wood was also visible to the naked eye.
- (7)
- Hue angel, color saturation and saturation in individual measurement segments also confirmed a remarkable color change in MW samples. During the drying of the MW, there was a noticeable decrease in the hue angle towards the red-brown color. The hue angle changed from 72° before drying to 57.4° after drying on MW. After milling the surface layer, the hue angles were almost equal in the comparison between FW and MW samples. The MW had h* 65° and the FW had 66.2°. The color after milling the surface of the samples was closer to a yellow brown.
- (8)
- Due to the different MC, temperature and color intensity of the compared samples were created. Mature wood samples achieved more saturated color than the samples of red false heartwood in the drying process. The values of Sab were in MW samples after drying 45% and 39.4% in red false heartwood samples. After milling the surface, the values of saturation were similar for both groups MW 36.1 and FW 34.3%.
Author Contributions
Conceptualization, I.K., T.V.; Methodology I.K., T.V.; Software, Ivan Klement.; Validation, I.K., T.V.; Formal Analysis, I.K., T.V.; Investigation, I.K., T.V.; Resources, I.K., T.V.; Data Curation, I.K., T.V.; Writing-Original Draft Preparation, I.K., T.V.; Writing-Review & Editing, T.V.; Visualization, I.K., T.V.
Funding
This research was funded by the Slovak Research and Development Agency under the contract no. APVV-17-0583.
Acknowledgments
This work was supported by the Slovak Research and Development Agency under the contract no. APVV-17-0583.
Conflicts of Interest
The authors declare no conflict of interest.
References
- Furst, C.; Seifert, T.; Makeschin, F. Do site factors affect the wood quality of European beech (Fagus sylvatica L.) Results from a pre-study on red heartwood. Forst Und Holz 2006, 61, 464–468. [Google Scholar]
- Čunderlík, I.; Vilkovský, P.; Račko, V. Shear strength and analysis of shear area on wood/bark interface on beech wood (Fagus sylvatica L.). Wood Res. 2017, 62, 691–699. [Google Scholar]
- Kúdela, J.; Čunderlík, I. Bukové D Štruktúra, Vlastnosti, Použitie. In Beech Wood Structure Properties and Use; Technical University in Zvolen: Zvolen, Slovakia, 2012; pp. 152–167. [Google Scholar]
- Barański, J.; Klement, I.; Vilkovská, T.; Konopka, A. High temperature drying process of beech wood (Fagus sylvatica L.) with different zones of sapwood and red false heartwood. BioResources 2017, 12, 1861–1870. [Google Scholar]
- Kudra, V.S.; Vitter, R.M.; Gaida, Y.I. Effect of false heart on the quality of beech wood. Lesn. Khozyaistvo 2003, 5, 23–24. [Google Scholar]
- McDonald, A.G.; Fernandez, M.; Kreber, B.; Laytner, F. The chemical nature of kiln brown stain in Radiata pine. Holzforschung 2010, 54, 12–22. [Google Scholar] [CrossRef]
- McCurdy, M.C.; Pang, S.; Keey, R.B. Measurement of colour development in Pinus radiata sapwood boards during drying at various schedules. Maderas Cienc. Y Technol. 2005, 7, 79–85. [Google Scholar]
- Tarmian, A.; Foroozan, Z.; Gholamiyan, H.; Gérard, J. The quantitative effect of drying on the surface color change of reaction woods: Spruce compression wood (Picea abies L.) and Poplar tension wood (Populus nigra L.). Dry. Technol. 2011, 29, 1814–1819. [Google Scholar] [CrossRef]
- Klement, I.; Marko, P. Colour changes of beech wood (Fagus sylvatica L.) during high temperature drying process. Wood Res. 2009, 54, 45–54. [Google Scholar]
- Chen, P.Y.S.; Workman, E.C. Effect of steaming on some physical and chemical properties of black walnut heartwood. Wood Fiber 1980, 11, 218–227. [Google Scholar]
- Kubinsky, E.; Geza, I. Influence of steaming on the properties of red oak. Part I. Structural and chemical changes. Wood Sci. 1973, 6, 87–94. [Google Scholar]
- Burtin, P.; Jay-Allemand, C.; Charpentier, J.-P.; Janin, G. Modifications of hybrid walnut (Juglans nigra × Juglans regia) wood colour and phenolic composition undervarious steaming conditions. Holzforschung 2000, 54, 33–38. [Google Scholar] [CrossRef]
- Geffert, A.; Výbohová, E.; Geffertová, J. Characterization of the changes of colour and some wood components on the surface of steamed beech wood. Acta Fac. Xylologiae Zvolen 2017, 1, 49–57. [Google Scholar] [CrossRef]
- Torres, S.; Jomma, W.; Marc, F.; Puiggali, J.-R. Couses of color changes in wood during drying. For. Study China 2010, 12, 167–175. [Google Scholar] [CrossRef]
- Loureiro, P.E.G.; Fernandes, A.J.S.; Carvalho, M.G.V.S.; Evtuguin, D.V. The assessment of chromophores in bleached cellulosic pulps employing UV-Raman spectroscopy. Carbohydr. Res. 2010, 345, 1442–1451. [Google Scholar] [CrossRef] [PubMed]
- Nishino, Y.; Janin, G.; Chanson, B.; Detienne, P.; Gril, J.; Thibaut, B. Colorimetry of wood specimens from French Guiana. Wood Sci. 1998, 44, 3–8. [Google Scholar] [CrossRef]
- Sehlstedt-Persson, S.M. Colour responses to heat-treatment of extractives and sap from Pine and Spruce. In Proceedings of the 8th International IUFRO Wood Drying Conference, Brasov, Romania, 24–29 August 2003; pp. 459–464. [Google Scholar]
- CIE. Colorimetry, 2nd ed.; CIE Pub. No. 15.2; Commission Internationale de l’Eclairage: Vienna, Austria, 1986; 74p, ISBN 3-900-734-00-3. [Google Scholar]
- Cividini, R.; Travan, L.; Allegretti, O. White Beech: A Tricky Problem in Drying Process, NARDI Srl, 2007, Italy. Available online: www.ivalsa.cnr.it/ISCHP07/CividiniTravanAllegretti.pdf (accessed on 27 January 2019).
- Klement, I.; Huráková, T. High temperature drying of beech wood with content of red heartwood. In Proceedings of the Selected Processes at the Wood Processing: XI. International Symposium, Hokovce, Slovakia, 9–11 September 2015; pp. 211–219. [Google Scholar]
- Aydin, I.; Colacoglu, G. Effects of surface inactivation, high temperature drying and preservative treatment on surface roughness and color of alder and beech wood. Appl. Surf. Sci. 2005, 252, 430–440. [Google Scholar] [CrossRef]
- Siau, J.F. Aproposed theory for nonisothermalunsteady-state transport of moisture in wood. Wood Sci. Technol. 1983, 17, 75–77. [Google Scholar] [CrossRef]
- Stenudd, S. The influences of log storage and kiln drying climate on the colour of non-steamed beech (Fagus sylvatica L.) wood. Wood Mater. Sci. Eng. 2008, 3, 71–77. [Google Scholar] [CrossRef]
Figure 1.
Drying curves of mature wood and red false heartwood samples.

Figure 2.
Temperature curves of samples and drying environment.

Figure 3.
Average values of color difference in different phases of processing.

Figure 4.
Hue angle for FW and MW samples.


Table 1.
The scale of ΔE* [19].
Table 1.
The scale of ΔE* [19].
| ΔE* < 0.2 | Not visible difference |
| 2 > ΔE* > 0.2 | Small difference |
| 3 > ΔE* > 2 | Color difference visible with high quality screen |
| 6 > ΔE* > 3 | Color difference visible with medium quality screen |
| 12 > ΔE* > 6 | High color difference |
| ΔE* > 12 | Different colors |
Table 2.
Measured different properties of red false heartwood and mature wood samples.
| Samples | Initial Moisture Content MCi (%) | Final Moisture Content MCf (%) | Density in Absolute Dry State (kg·m−3) | Drying Time (h) |
|---|---|---|---|---|
| FW | 51.21 | 9.68 | 624.24 | 158 |
| MW | 70.64 | 9.37 | 625.99 | 160 |
Table 3.
Average values and basic statistical characteristics of color parameters L*, a*, b * for samples of red false heartwood and mature wood.
Table 3.
Average values and basic statistical characteristics of color parameters L*, a*, b * for samples of red false heartwood and mature wood.
| Samples | Coordinates | Before Drying | After Drying | After Milling | ||||||
|---|---|---|---|---|---|---|---|---|---|---|
| Mean | Standard Deviation | Sample Variance | Mean | Standard Deviation | Sample Variance | Mean | Standard Deviation | Sample Variance | ||
| FW | L* | 64.3 | 0.905 | 0.819 | 57.2 | 1.137 | 1.293 | 61.0 | 0.526 | 0.276 |
| a* | 8.2 | 0.524 | 0.274 | 10.0 | 0.651 | 0.424 | 9.0 | 0.188 | 0.036 | |
| b* | 20.1 | 0.548 | 0.300 | 22.4 | 1.162 | 1.349 | 20.4 | 0.471 | 0.221 | |
| MW | L* | 69.4 | 0.765 | 0.585 | 51.9 | 0.981 | 0.963 | 61.9 | 0.435 | 0.189 |
| a* | 9.4 | 0.689 | 0.475 | 14.1 | 1.599 | 2.556 | 10.1 | 0.136 | 0.018 | |
| b* | 28.8 | 1.248 | 1.557 | 22.0 | 2.817 | 7.935 | 21.7 | 0.178 | 0.032 | |
Table 4.
Hue angle, color saturation and saturation in different phases of process.
| Samples | Process | Hue Angle h* (°) | Color Saturation C*ab | Saturation Sab (%) |
|---|---|---|---|---|
| FW | Before drying | 67.8 | 21.7 | 31.9 |
| After drying | 65.9 | 24.5 | 39.4 | |
| After milling | 66.2 | 22.3 | 34.3 | |
| MW | Before drying | 72.0 | 30.3 | 40.0 |
| After drying | 57.4 | 26.1 | 45.0 | |
| After milling | 65.0 | 23.9 | 36.1 |
© 2019 by the authors. Licensee MDPI, Basel, Switzerland. This article is an open access article distributed under the terms and conditions of the Creative Commons Attribution (CC BY) license (http://creativecommons.org/licenses/by/4.0/).
Share and Cite
MDPI and ACS Style
Klement, I.; Vilkovská, T. Color Characteristics of Red False Heartwood and Mature Wood of Beech (Fagus sylvatica L.) Determining by Different Chromacity Coordinates. Sustainability 2019, 11, 690. https://doi.org/10.3390/su11030690
AMA Style
Klement I, Vilkovská T. Color Characteristics of Red False Heartwood and Mature Wood of Beech (Fagus sylvatica L.) Determining by Different Chromacity Coordinates. Sustainability. 2019; 11(3):690. https://doi.org/10.3390/su11030690
Chicago/Turabian StyleKlement, Ivan, and Tatiana Vilkovská. 2019. "Color Characteristics of Red False Heartwood and Mature Wood of Beech (Fagus sylvatica L.) Determining by Different Chromacity Coordinates" Sustainability 11, no. 3: 690. https://doi.org/10.3390/su11030690
Note that from the first issue of 2016, this journal uses article numbers instead of page numbers. See further details here.