Experimental Study on the Indoor Thermo-Hygrometric Conditionsof the Mongolian Yurt


Key Laboratory of Cold Region Urban and Rural Human Settlement Environment Science and Technology, School of Architecture, Harbin Institute of Technology, Harbin 150001, China
*
Author to whom correspondence should be addressed.
Sustainability 2019, 11(3), 687; https://doi.org/10.3390/su11030687
Submission received: 6 December 2018
/
Revised: 14 January 2019
/
Accepted: 18 January 2019
/
Published: 28 January 2019
Abstract
:The Mongolian yurt is a circular dwelling with a wooden frame enclosed by a lightweight felt envelope. In this study, field experiments were conducted to understand the patterns of temperature changes of the yurt’s indoor thermal environment. The study found that the felt’s low thermal inertia affected the indoor temperature stability, resulting in a large difference between day and night temperatures inside the yurt. The felts adjusted the indoor humidity in the case of large outdoor humidity fluctuations, but when the outdoor humidity was very low, the indoor air was drier. Indoor temperatures were generally lower in the centre and higher in the surrounding peripheral areas, and the main influencing factors included felt seams, gaps between the door and Khana, the ground, and solar radiation. The main factor influencing the temperature of the felt wall’s inner surface was solar radiation. The effects on temperature and humidity when opening the component felt pieces were obvious: humidity adjustment was best with the top felt piece opened; indoor temperature adjustment was best with the gaps between the floor and felt wall pieces closed; and the door curtain was most effective for insulation when the outdoor temperature was low.
1. Introduction
The most typical dwelling of the nomadic tribes on the Mongolian plateau, the Mongolian yurt, appeared in the 15th century BC. Today, many herdsmen still choose to live in yurts. In addition to its function as a residence, the yurt has also become a symbol of Mongolian culture [1]. The Mongolian yurt was created to meet the needs of nomadic tribes who roamed the Mongolian steppe in search of pastures for their animals. As the Mongolian plateau has a harsh climate with cold winters, windy springs and autumns (transitional season), and dry summers, the architectural form, building materials, and construction methods of the yurt reflect the climate adaptability characteristics of this dwelling type. The process of construction, use, and ability to be fully dismantled complies with the ecological laws of the grassland and the production modes and lifestyles of the grassland’s inhabitants [2].
As society has evolved, the herdsmen’s living style has changed from nomadic to settled, and the yurt has gradually been replaced by fixed residences. As a symbol of Mongolian national culture, yurts have been used less and less on the grassland. Maintaining the yurt’s vitality has become a crucial issue.
Previous research on the yurt mainly focused on its history, culture, structure, and spatial form [3,4]. Its circular shape has formed the cultural characteristics of the yurt’s space rituals and place identification [5]. The circular plan and conical roof create favourable conditions for resisting random wind pressure and snow load in all directions. The yurt’s frame structure is made of wooden poles, which is convenient for dismantling, transportation, and installation. After installation, its reticulated shell structure enhances structural stability. As the frame structure only occupies 1/10 of the area occupied by the structural components of brick and concrete structures, the largest possible building space is constructed with the least amount of wood [6].
The shape of the yurt is favourable for reducing energy consumption. Field measurements made by the research team show that, when the heights are the same, if an existing residential space with a rectangular plan was converted into one with a circular plan, the shape coefficient would drop by 0.05–0.1 m−1, which effectively reduces energy consumption as the smaller volume shape coefficient means less energy consumption. Research on the thermal performance of the Mongolian yurt’s envelope structure has mainly been focused on the envelope felt, which has an irregular layered structure. A few researchers have established mathematical models to explain the heat transfer mechanism of the felt [7]. Some researchers have tested the heat conductivity coefficient and heat transfer coefficient of the felt with different thicknesses. The results showed that the average heat conductivity coefficient and the average heat transfer coefficient of the felt 18mm in thickness is 0.0766 W/m·K and 1.39 W/m2·K, respectively [8].
The main factors affecting indoor thermal environments are external climate conditions, envelope structure, building shape, internal heat gains, equipment, and installations. Some scholars focused on urban structures, conducting research on the indoor thermal environments of urban residences [9,10,11,12], public buildings [13], or building spaces [14], by monitoring the changes of indoor temperature and humidity in various types of houses in different areas, and then analysing the influencing factors. Many of their studies combined actual tests, computer simulations, and questionnaire surveys [15,16] to analyse the thermal comfort areas of the different places. Through the perspective of thermal engineering, some research proposed architectural optimization design strategies, such as computer simulation and genetic algorithms, to establish multi-variable optimization models [17,18]. Other researchers focused on regional residential houses, finding that houses in different regions have different advantages in the creation of thermal environments [19,20,21]. For example, cave dwellings in western China [22] have good thermal insulation and heat storage capacity, which enable the indoor temperature to be relatively stable. The residential dwellings of hot and humid climates [23,24] generally have good heat protection by making effective use of patios, narrow alleyways, doors, and windows to achieve passive cooling. In cold regions, brick beds with underlying fire flues can be built in residential dwellings for indoor temperature regulation [25].
The comfort of the thermal environment is closely related to the behaviour of the occupants. Over the past few decades, a large number of experiments and field studies on thermal comfort have been carried out around the world [26,27], and according to the basic principles of ergonomics, many assessment models [28,29,30] and standards [31,32,33,34,35] have been established. Scholars have determined the thermal comfort data of various global climatic conditions [36,37]. All of the studies make use of field measurements, simulations, questionnaires, mathematical modelling, and other methods to measure and analyse the indoor thermal environments of buildings from different regions representing a variety of shapes and functions. These studies have made important contributions to research on the indoor thermal environment and thermal comfort of these regional residences.
In summary, although much work has been carried out concerning the thermal comfort of various dwellings, it is interesting to examine the indoor thermal environment and its influencing factors of the Mongolian yurt, as a very basic and original dwelling form. Therefore, after testing and measuring the indoor thermal environment of a yurt to reveal the patterns of temperature distribution in its indoor thermal environment, this study investigated: how the indoor temperature and humidity change with the outdoor temperature and humidity; the distribution of the indoor thermal field; the temperature characteristics of the inner wall surface; the influence of thermal weak points on indoor temperature; and the effect of adjustment of structural members on indoor temperature and humidity. The advantages of yurts in creating the indoor thermal environment were investigated and the disadvantages were outlined, which provided a scientific basis for the further improvement of Mongolian yurts as contemporary dwellings.
2. Methods
2.1. Experiment Objects
The traditional Mongolian yurt has a cylindrical wall and conical roof, and consists of a frame structure and envelope. The framework has three main components: the crown wheel (Toono), the poles (Uni), and the lattice wall pieces (Khana). The three types of structural members are made of wood, which join to form a reticulated shell structure that supports the envelope structure. The crown (Toono) is a circular wooden wheel at the top of the yurt; its main function is for ventilation and lighting. The Uni poles connect the Toono crown and the Khana lattice pieces. They are usually long and slim wooden poles that are round or elliptical in shape. Supported by the Khana, the Uni, and Toono are connected by woollen ropes or mortise and tenon joints to form the yurt’s conical roof frame. The Khana lattice pieces are made by cross-bonding long slim wooden poles into the wall frame lattices with diamond-shaped mesh, the intersection points being perforated and fixed with leather nails. The Khana piece is a flexible expandable structure, able to be collapsed for transportation. When expanded, it forms a rectangular lattice wall piece. The number of Khana pieces determines the yurt’s size [38,39]. The Khana pieces are curved, rounded, and connected with one another to form a cylindrical shape. The use of Khanas makes the yurt a changeable structure. In winter, the yurt becomes thin and high with the narrowing of the Khanas, creating a structure that can reduce wind pressure and roof snow. Details of the framework components and their connection methods are shown in Table 1.
The envelope of the Mongolian yurt is made up of felt pieces, or sheets, which are made from wool by herdsmen households, and are generally fixed with horsehair ropes. The felt sheets are divided into three types: the Toono top felt, roof felt, and wall felt (Table 2). The top felt covers the Toono crown and is generally square-shaped. There are ropes at each corner, which are tied to the surrounding wall ropes. The top felt covering the Toono crown can be easily controlled by the ropes to adjust the top opening for ventilation and lighting of the yurt. The roof felt pieces, generally fan-shaped, are covered over the Uni poles, one piece in the front and another piece in the back, one large and one small. In winter, two layers of roof felt sheets are usually laid. The two roof felt sheets, large and small, overlap to prevent cold air intrusion through the gaps. The outer layer felt cover is fixed with a horsehair rope. The wall felt envelope connects the Khana lattice pieces. In winter, the yurt is further insulated by increasing the layers of felt, or cotton curtains, or the like. In summer, by opening the wall felt, top felt, and the door, the yurt is ventilated. The bottom of the wall felt can be rolled up to form an opening, the position of which is determined according to wind direction. The top felt is opened using the ropes tied at the four corners. The flexible opening method fully utilizes the passive ventilation principle of wind pressure and hot pressure, creating a comfortable thermal environment in summer. The ropes are divided into surrounding wall ropes, grounding ropes, holding ropes, and leather nail bonding ropes, which are used for connecting the framework construction and fixing felt sheets, respectively.
Traditional Mongolian yurts still dominate those currently occupied by herdsmen households. Each yurt generally has four to six pieces of Khana lattice, with a plane radius of 2–3 m. A yurt of this size can be easily transported on an ox cart and can be pitched within three hours and dismantled within one hour by two adults. The internal space can meet the daily living and production needs of a herder family. One wood stove provides the herder family with an adequate source for cooking and winter heating. At present, the traditional wooden frame structure is still the most commonly used yurt frame. However, rainproof canvas is often used as an outer covering layer in addition to the felt sheet envelope to prevent deterioration caused by water absorption and subsequent consumption by moths.
In this study, the yurt was the experiment object, built according to the current traditional form favoured by herdsmen. The experiment object was located on a large site in Hohhot, Inner Mongolia, with the surrounding environment close to that of actual yurts. The experimental yurt consisted of five Khana lattice pieces with a radius of 2.5 m, area of 19.6 m2, Khana height of 1.5 m, and Toono height of 2.4 m above ground. Two layers of felt pieces formed the envelope structure; the outer layer of felt was covered with rainproof canvas. The wooden door faced south. The heat source was an oil-filled radiator, with nominal voltage of 220 V, rated power of 1600 W, and rated frequency of 50 Hz. The construction process of the experimental yurt is shown in Figure 1. During the test period, two people were inside the yurt, with a 15 W LED energy-saving bulb as the lighting source, which was turned on from 5:00–8:00 p.m. everyday. There was no other heat source within the yurt.
In order to compare the indoor thermal environment of the yurt with that of other residential structures, the research team selected a yurt, an adobe house, and three brick-concrete houses on the Xilin Gol grassland for measurement and testing. The yurt was in a normal living state, with the same scale and structure as the experimental yurt. The adobe house was built in 1974 (“Adobe House”). The three brick-concrete houses were built in 1998 (Brick House 1, or “BH1”), 2004 (BrickHouse2, or “BH2”), and 2015 (Brick House 3, or “BH3”), respectively. The adobe and brick-concrete houses were all approximately 60 m2 in area. The distances between these residences were within 500 m.
2.2. Experiment Contents
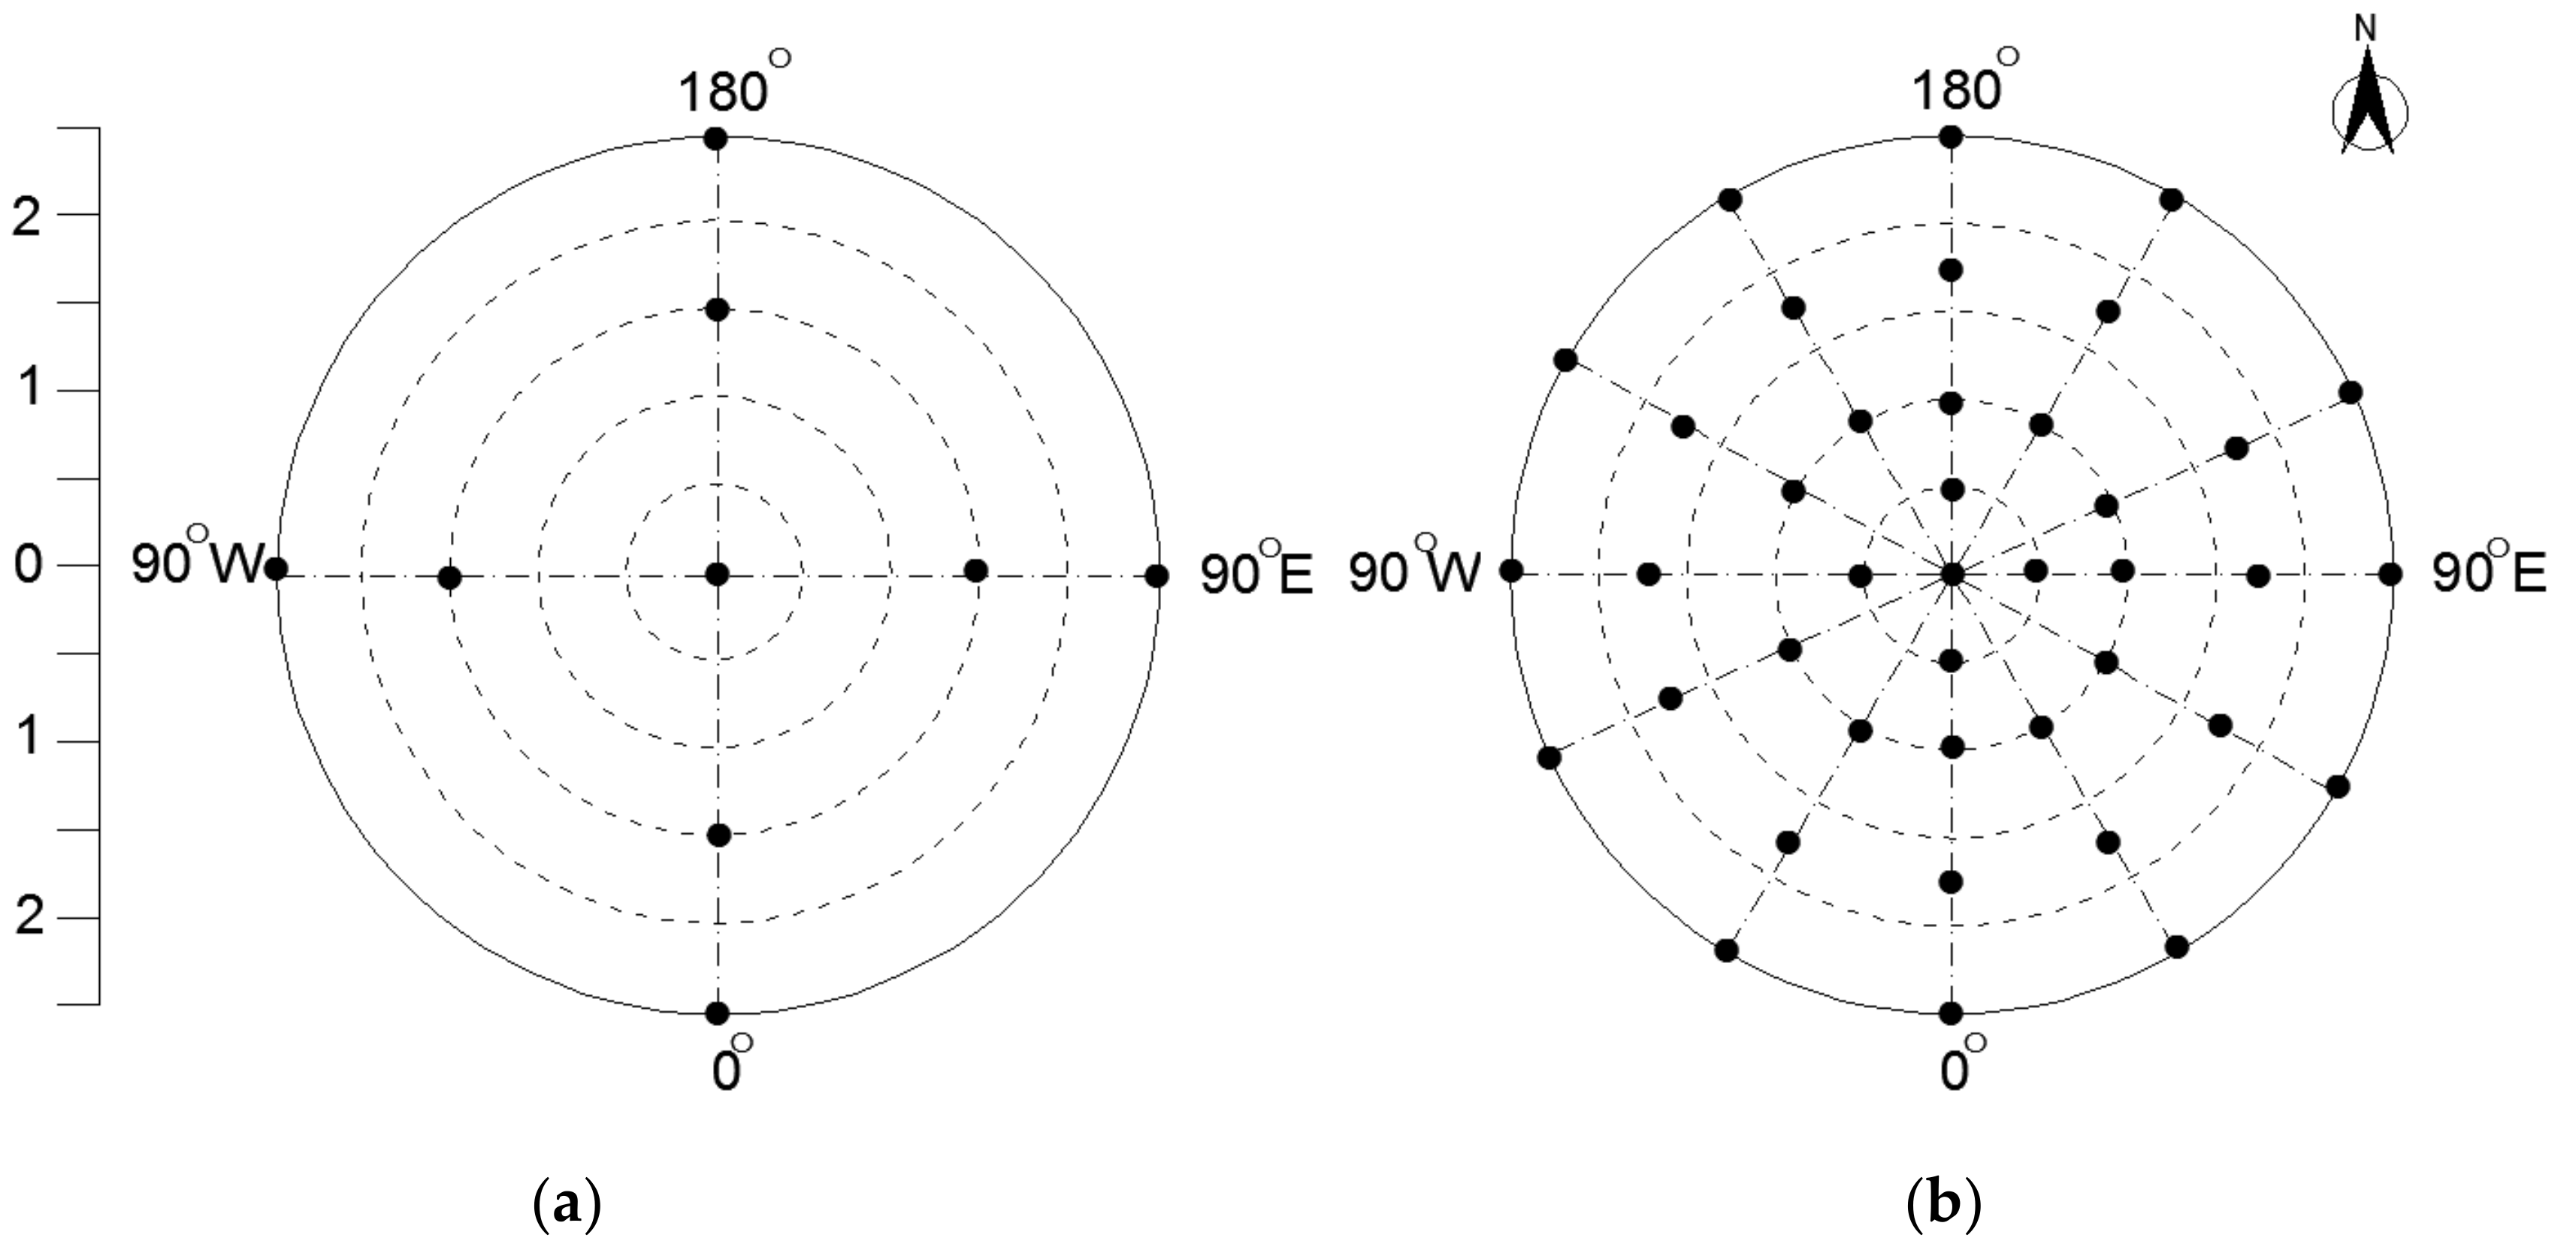
The test instruments used in the experiment included temperature and humidity recorders and infrared thermal imaging cameras. The time step of temperature and relative humidity for long- and short-term measurements was 10 minutes, the temperature and relative humidity values of the results were the data measured by the instrument at the selected measuring point in Figure 2. The models and parameters of the test instruments are shown in Table 3. The measurement range and accuracy of these instruments met the requirements of the international standard ISO7726. The measurements were carried out in all seasons, and for around 30 days during each. The major problem affecting Mongolian yurts occurs during the cold period; therefore, this paper only analyses the data from the transitional seasons (spring and autumn) and the winter.
2.2.1. Continuous Temperature and Humidity Measurement
The experiment site was located in Hohhot, Inner Mongolia, where the region exhibits a typical continental climate and has four distinct seasons. January is the coldest month and July the hottest. The temperature measurement of the experimental yurt lasted from January 2017 until May 2018 and was conducted over about 30 days during each season. During the test periods, the yurt was in a state of steady use according to the living habits of the herders, with some of the enclosures being open or heat sources being used. The test contents included changes in indoor and outdoor temperature and humidity over time, changes in indoor temperature and humidity at joints between felt pieces and the door, and temperature changes on the inner wall surface and the ground. The indoor and outdoor temperature and humidity changes over time are shown in Figure 2a. The measuring point was 1.2 m above ground. Other testing points were located on the felt wall, ground, and gaps.
The test period for the other types of residential structures was from 27–30 January 2018. During the test period, the yurt, the adobe house, BH2, and BH3 were in normal living conditions, and BH1 was unoccupied from 28 to 30 January 2018. The measuring point was located at the centre of one bedroom with a height of 1.2 m. Changes in the indoor and outdoor temperature and humidity, along with time, were tested.
2.2.2. Temperature Spatial Distribution Measurement
The temperature distribution of the indoor space of the yurt was measured. To ensure the validity of the measurement data, two trial measurements were carried out in the early stages of measurement and testing, in September 2017 and January 2018, respectively. The main purposes were to verify the arrangements of the measuring points and the accuracy of the test instruments. The final measurement and testing plan were determined by these trial measurements. The instruments were calibrated before the formal measurement. The instrument error was adjusted to ±0.1 °C. Forty-one measuring points were arranged, and the measuring heights were either 0.1 m or 1.2 m above ground. The distribution of the measurement points is shown in Figure 2b. Two states were measured—one with a heat source and one without—between 8 and 24 March 2018. The data were collected over four continuously sunny days, at 05:00 a.m.to determine the minimum outdoor temperature, at 3:00 p.m. to determine the maximum outdoor temperature, and at 10:00 p.m. when the heat source was extinguished.
2.2.3. Thermal Bridge Experiment
The thermal bridge of the yurt was captured by an infrared camera test. This test measured the temperatures of the top felt; roof felt; inner surface of the wall felt (at the center); joint of the top felt and roof felt; joint of the roof felt and surrounding wall felt; junction between the felt and ground; and upper, middle, and lower areas between door curtains and Khanas.
3. Results
3.1. Indoor Temperature and Humidity Changes over Time
3.1.1. Indoor and Outdoor Temperature and Humidity Changes During the Transitional Season
From the continuous testing data, three time periods were selected. The three periods were: sunny days (22–24 September 2017), cloudy and rainy days (25–27 September 2017), and cloudy days (28–30 September 2017). Figure 3 shows the indoor and outdoor temperature and humidity curves of the yurt for the transitional season.
It can be seen from Figure 3 that the overall trends of indoor and outdoor temperature and humidity changes were similar for all time periods. When the outdoor temperature changes were relatively large, the indoor temperature curve was relatively smooth, because of the yurt’s envelope. As the felt and the ground have certain heat insulation and storage capacities, the outdoor short-term temperature fluctuations did not affect the indoor temperature much. During the sunny days, the indoor temperature peak was usually approximately three hours later than the outdoor one, while during the rainy days, the delay was usually fewer than two hours. This is because, when the outdoor temperature rises fast on sunny days, the thermal performance of the yurt’s enclosure structure delayed the rapid rise of the indoor temperature. As the outdoor temperature rose slowly on rainy days, the buffering effect of the walling structure was less obvious; the indoor temperature decreased more slowly than the outdoor temperature in the temperature-descending phase.
The indoor temperature difference between day and night was large. For example, on the sunny days, when the outdoor temperature difference between day and night was 28.8 °C, the indoor temperature difference was 15.7 °C. On the rainy days, the temperature difference between day and night was 20 °C, and the indoor temperature difference between day and night was 10.9 °C, which was due to the effect of the envelope structure’s heat storage capacity. According to the references [8], the coefficient of thermal conductivity of the felt, which comprises a majority of the yurt’s envelope material, is less than 0.0766 W/m·K; equivalent to the expanded polystyrene panel, it has a good capacity for heat insulation. According to the references [6], the comprehensive thermal inertia index of the yurt’s envelope is less than 1.6, which is inferior to the solid wall. According to Figure 3, the Mongolian Yurt has a certain thermo stability; however, in the following research, the data showed that the yurt’s thermo stability is low due to an inferior thermal inertia. The main reason for its inferior thermal inertia is that 70% of the material of the envelope is felt, 30% is the ground, and the structure is formed by wooden poles. The coefficient of thermal storage of wood and felt is less than a solid wall [40], which is negative for the thermal environment of Mongolian yurts.
The timing of the indoor humidity peaks and troughs were exactly opposite to those of the indoor temperature peaks and troughs, which resulted from the influence in temperature on the partial pressure of water vapour. The indoor and outdoor humidity changes were generally coincident, and the indoor humidity difference on the sunny days was smaller than the outdoor humidity difference. When the outdoor humidity difference was 47.8%, the indoor difference was 36.3%. The indoor maximum humidity was lower than the outdoor maximum, and the indoor minimum humidity was higher than the outdoor minimum. When the outdoor humidity was high on the rainy days, such as on 25 September 2017, the average indoor humidity level was 20.4% lower than the outdoor humidity. These changes in humidity were attributed to the envelope. The outer surface of the envelope is made of rainproof cloth to prevent rain from wetting the felt. The inner surface is felt, which has a certain moisture absorption capacity. When the indoor humidity is high, the felt absorbs moisture. When the indoor humidity is reduced, the moisture in the felt evaporates into the indoor air, thus regulating the indoor humidity.
3.1.2. Indoor and Outdoor Temperature and Humidity Changes in Winter
Three time periods were selected from the data of the continuous testing. Period 1, 22–24 January 2018, included sunny and cloudy days; Period 2, 25–27 January 2018, included cloudy and snowy days; and Period 3, 28–30 January 2018, included only sunny days. Figure 4 shows the indoor and outdoor temperature and humidity curves of the yurt in winter.
It can be seen from Figure 4 that, during the non-heating period, the indoor and outdoor temperature peaks appeared essentially at the same time, which was different from the transitional season. The main reason is that the overall outdoor temperature was lower in winter, the daytime temperature rose slowly, and the buffering effect of the felt wall was reduced. The indoor temperature decreased, although the trend was delayed compared with the decrease in outdoor temperature and it was less obvious than in the transitional season. This is due to the relatively small difference between indoor and outdoor temperatures. The trough appearance time had a delay of about 2 hours, which was mainly due to the enclosure structure’s heat storage effect. The outdoor winter temperature difference was 10.5 °C on 28 January, which was much smaller than in the transitional season. Under the influence of the outdoor temperature, the indoor temperature difference between day and night was 8.5 °C on 28 January, and the indoor average temperature of that day was 8.7 °C higher than the outdoor average. The insulation effect of the envelope structure was obvious even without any heating; however, with an average indoor temperature of 8.3 °C, the unheated yurt was not suitable for winter residence. During the heating period, on 24 January, the average indoor temperature was 9.2 °C. After heating, the temperature was greatly improved, but the indoor and outdoor temperature difference still reached 12.3 °C, and the lowest temperature was only 4.2 °C. The temperature dropped by 12.1 °C within 1.5 hours after the heating went out on 25 January. It could be seen that the thermal inertia of the enveloping structure was a key factor affecting the indoor temperature of the Mongolian yurt.
The indoor and outdoor humidity changes in winter were essentially synchronized on cloudy days. The average indoor humidity level was 2.9% lower than the outdoor humidity and, the lower the outdoor humidity, the greater the indoor and outdoor humidity difference, which was due to the water absorption of the felt. In the winter testing area, the outdoor humidity was about 35% for most of the time. The lower the outdoor humidity was, the lower the indoor humidity. This demonstrated an unfavorable aspect of felt as an envelope structure.
3.1.3. Comparative Analysis of the Yurt and Other Local Dwellings
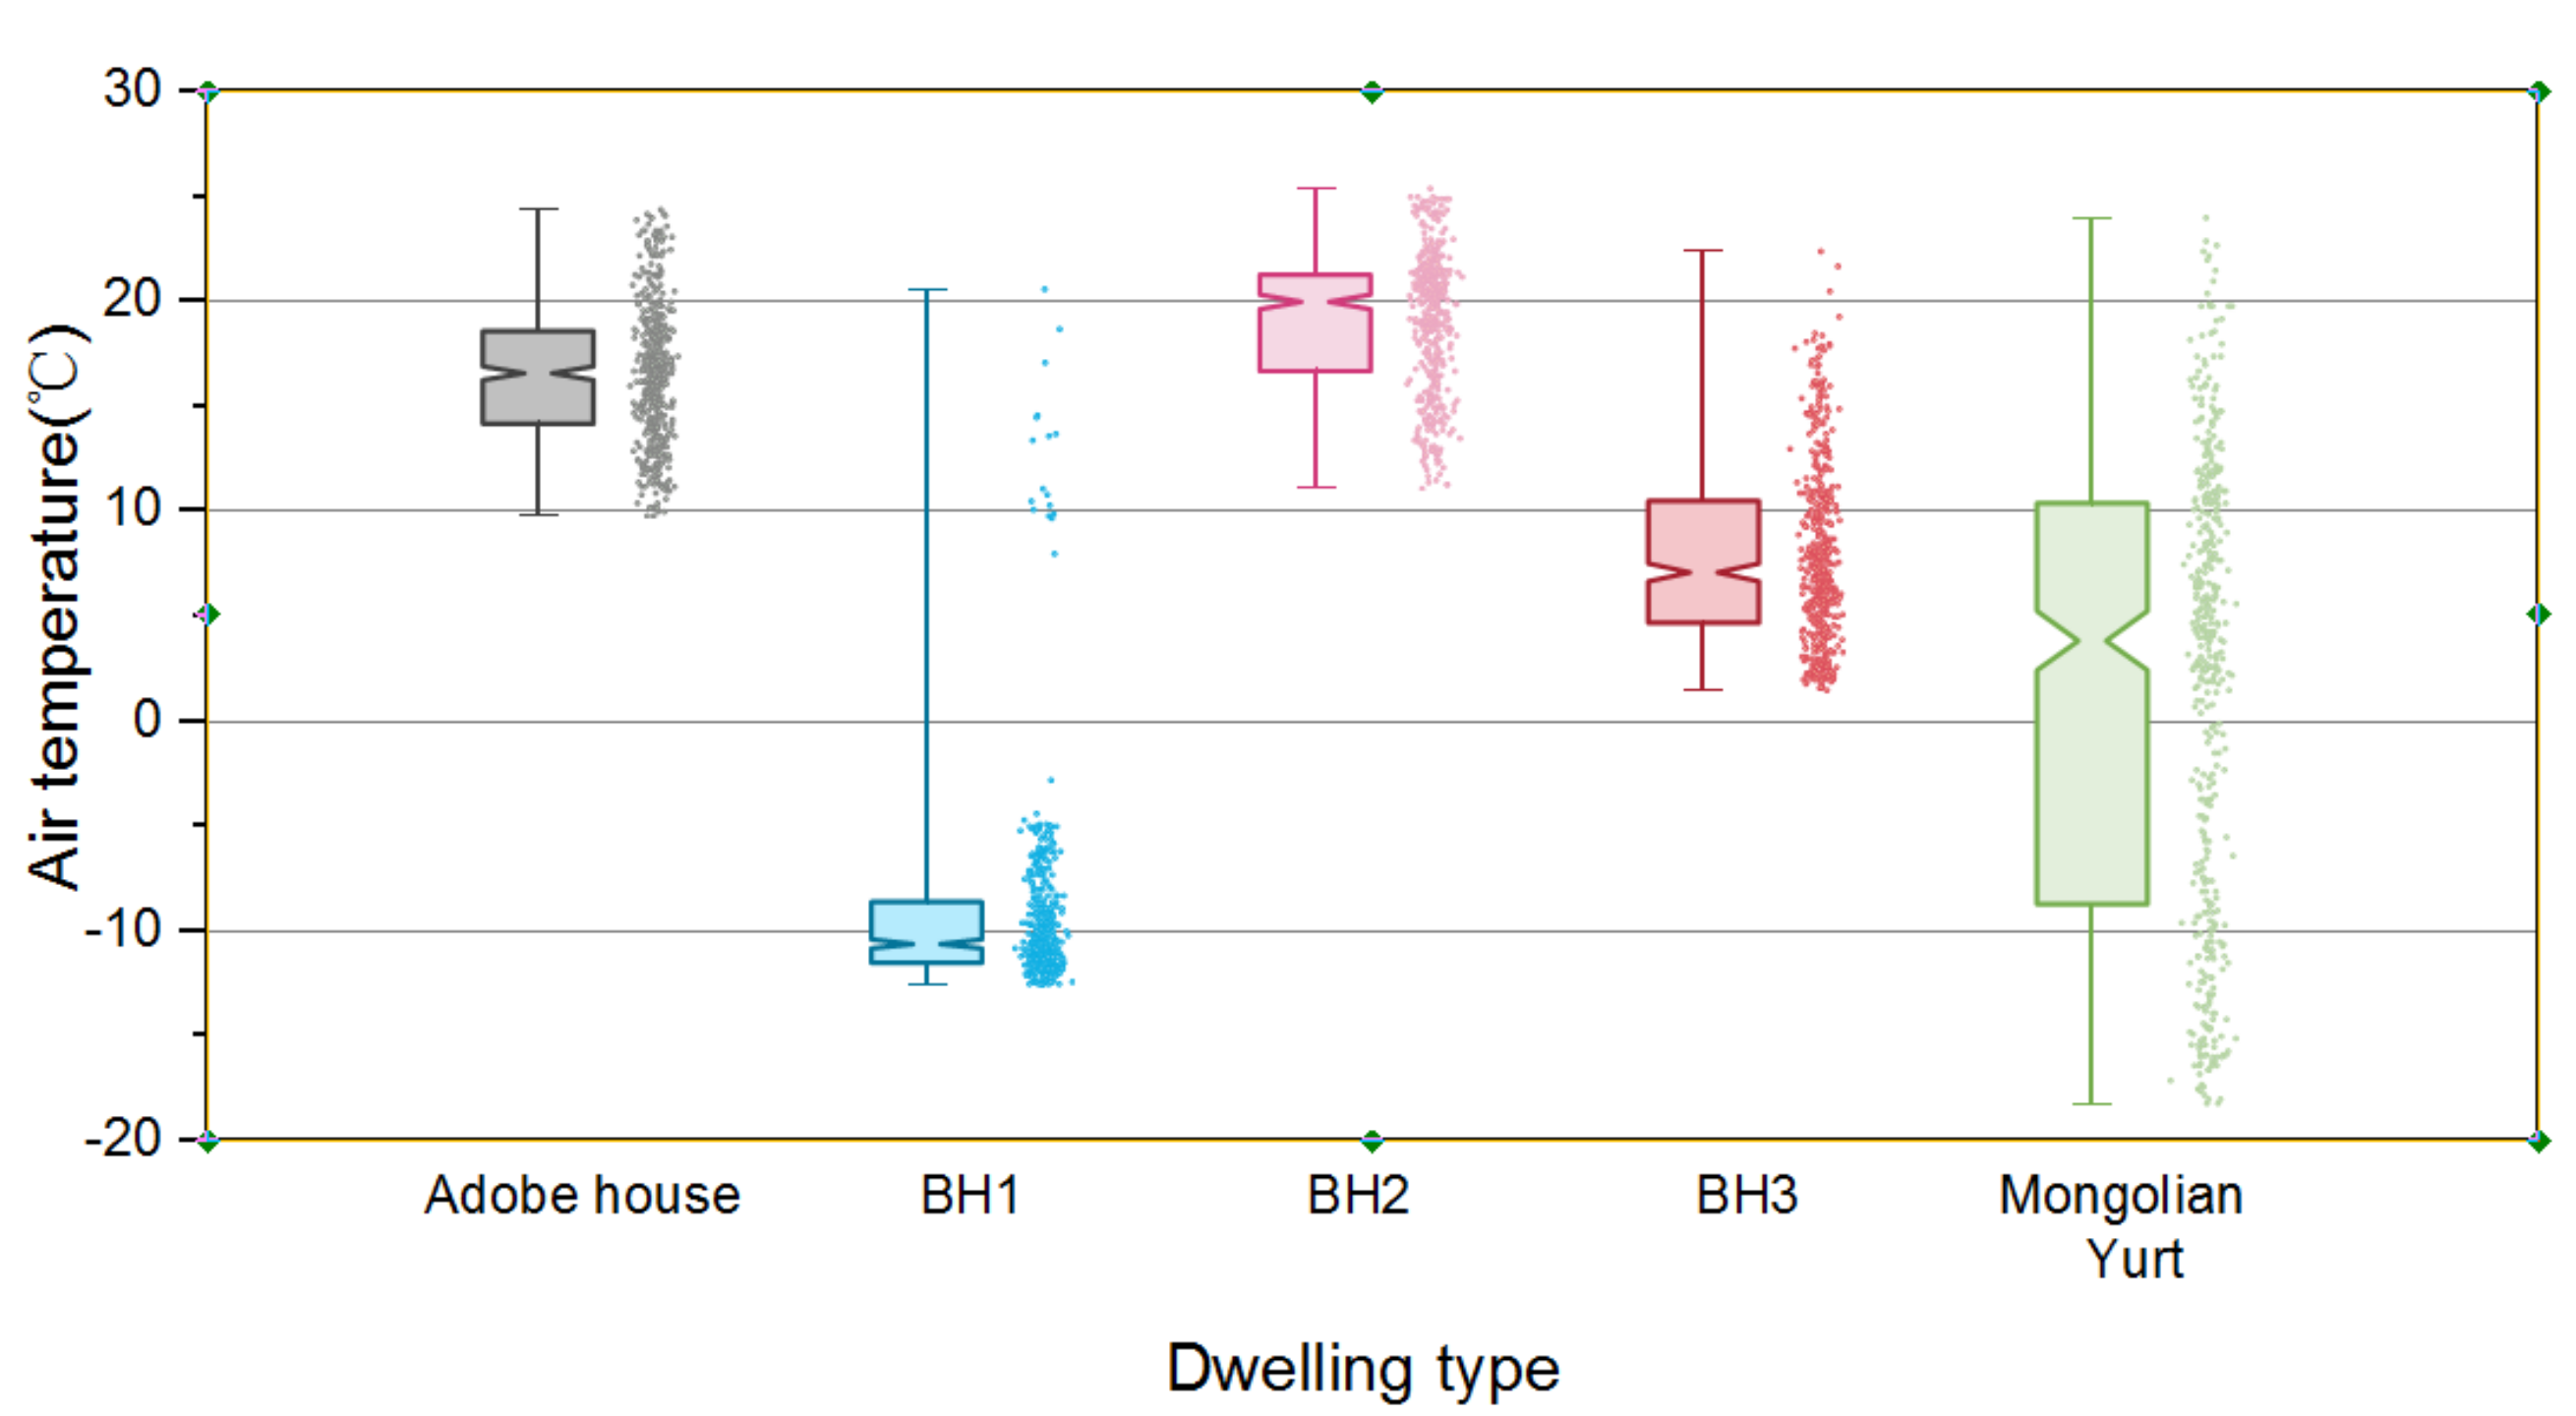
In order to compare the differences of the indoor thermal environment of the yurt with that of other types of local residences, testing and analysis were performed on the yurt and three other local dwellings on the Xilin Gol grassland. The indoor temperature boxplot is shown in Figure 5.
It can be seen from Figure 5 that, except for the yurt, the indoor temperatures of other residential houses were relatively stable, and the indoor temperature of the adobe house, BH2, and BH3, all of which have been continuously inhabited, could all reach approximately 10 °C. In fact, the average temperatures of the adobe house and BH2 could reach above 15 °C due to the better thermal performance of the enclosure structures and heating equipment. During the test period, the average temperature of BH1, which has seldom been inhabited, was −10 °C. However, although the yurt has always been inhabited, the average temperature of the yurt was lower than 10 °C and the temperature fluctuation range was larger than that of the other dwelling types. From the indoor temperature boxplot of the yurt, it can be seen that the temperature at the upper 3/4 position is about 10 °C, and that at the lower 3/4 position is −8 °C. The pixels at the right of every boxplot represent the discrete points of the air temperature measured every 10 minutes during the testing period; all of the data indicates the yurt’s poor thermal stability. The main reason for this result is the poor heat storage capacity of the enclosure structure, which is a key problem to be solved when improving the Mongolian yurt.
3.2. Spatial Distribution of Indoor Temperature in the Mongolian Yurt
3.2.1. The Yurt without a Heat Source
The data from 12 and 18 March were analyzed with no heat source in the yurt. On 12 March, the height of the measurement point was 0.1 m. The major wind direction was 20°0′ N, and the daily average wind speed was 1.38 m/s. On 18 March, the height of the measurement point was 1.2 m. The major wind direction was 20°0′ N, and the daily average wind speed was 1.68 m/s. Table 4 shows the wind rose and the scatter diagram of the day of measurement.
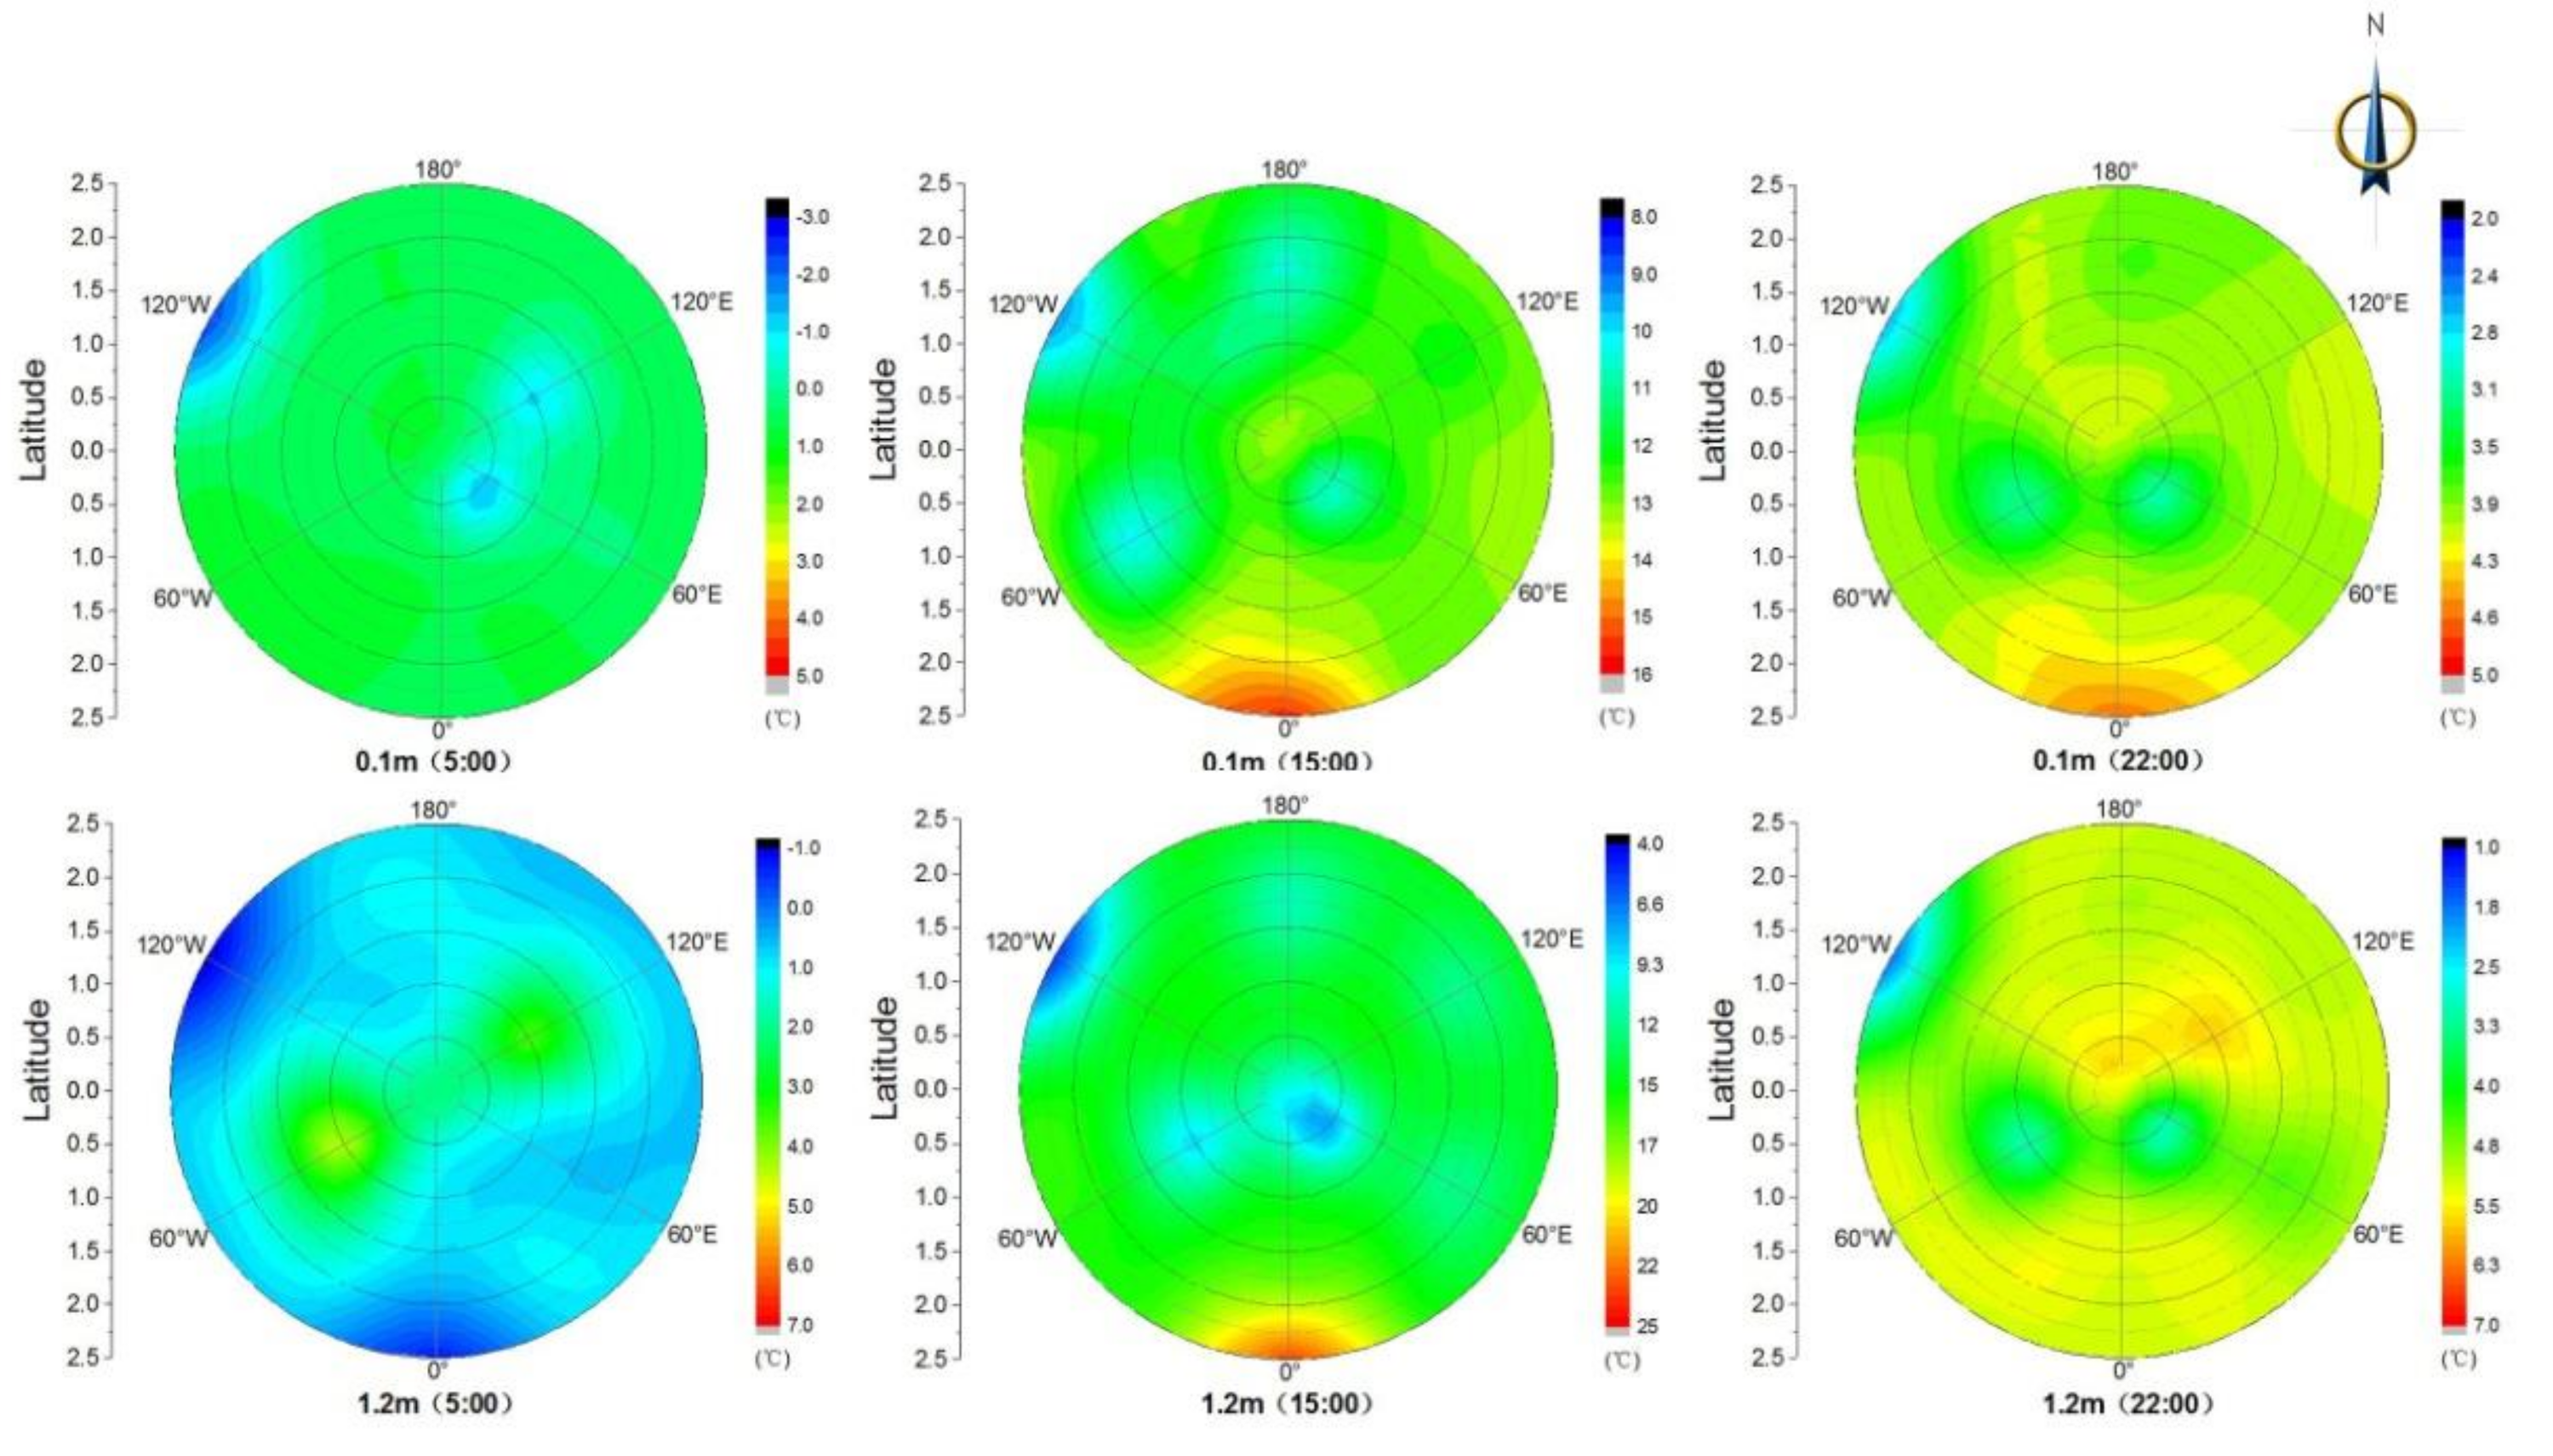
The indoor temperature distribution is shown in Figure 6. It can be seen from Figure 6 that the temperature distribution at the height of 0.1 m was relatively uniform, with the lowest temperature at 5:00 a.m. and the highest at 3:00 p.m. Lower temperatures were obtained at the northwest side of the yurt (120°0′ W, 2.5 m). The main reason was the obvious cold wind intrusion from the small gaps between the wall felt and the ground, which is a common phenomenon for yurts. The location and size of the gaps affected the nearby temperatures. The temperatures on the south side (00°0′ S, 2.5 m), where the wooden door of the yurt was located, were the highest at 3:00 p.m. and 10:00 p.m. The upper section of the wooden door was made of glass, which received more heat from the sun. Although the sun had been set for nearly four hours by 10:00 p.m., the temperature was still high, indicating that the ground’s heat storage capacity contributed to the indoor temperature’s stability.
At a height of 1.2 m, the temperatures at the coordinate points of (120°0′ W, 2.5 m) and (00°0′ W, 2.5 m) were the lowest at 05:00 a.m., which was caused by cold air intrusions at these locations. At the position of coordinates (00°0′ W, 2.5 m), the daytime temperature was the highest when there was solar radiation and the night-time temperature was the lowest, which indicated that the impact of the door on the indoor temperature varied greatly between day and night. Some areas in the middle of the yurt were lower in temperature at 3:00 p.m., such as at coordinates (50°0′ E, 0.5 m) and (60°0′ W, 1 m). These coordinates were located directly below the Toono, which was covered by the top felt. There could have been certain gaps between the overlapping felts, which made cold air intrusion possible. The temperatures at other times were also lower than those at the same positions, indicating the same cause. The temperature distributions at different times at a height of 1.2 m showed great variation: at around 05:00 a.m., the peripheral temperature of the yurt was lower and the central temperature was relatively higher; at 3:00 p.m., the temperature distribution was more uniform, with the temperature higher on the south side; at 10:00 p.m., due to outdoor temperature changes and solar radiation, the central temperature was relatively lower. However, the temperature distribution at a height of 1.2 m was quite different from the temperature distribution at 0.1 m, which was mainly caused by two factors: the good thermal stability of the ground and poor thermal inertia of the lightweight felt wall.
3.2.2. The Yurt with a Heat Source
The data for 14–15 March was analysed when there was a heat source in the yurt. The heat source was an oil-filled radiator, with nominal voltage of 220 V, rated power of 1600 W, and rated frequency of 50 Hz. The radiator was located at the centre of the yurt, at a height of 0.6 m. On 14 March, the height of the measurement point was 0.1 m. The major wind direction was north, and the daily average wind speed was 3.15 m/s. On 15 March, the height of the measurement point was 1.2 m, the major wind direction was 20°0′ N, and the daily average wind speed was 3.49 m/s. Table 5 shows the wind rose and the scatter diagram of the day of measurement.
The spatial distribution of the indoor temperature is shown in Figure 7. At a height of 0.1 m, the overall trend of temperature distribution shows that the temperature was high on the periphery, low in the centre, and lowest on the northwest side (120°0′ W, 2.5 m). The gaps between the wall felt and the ground greatly influenced the indoor temperature field. At 3:00 p.m. and 10:00 p.m., the temperatures of the areas to the east and northwest of that projected by the Toono on the horizontal plane were lower, which was due to the cold wind intrusions from gaps between the top felt and roof felt and gaps between the northeast side of the wall felts and the ground. The temperature in the southwest was the highest at 05:00 a.m., but the temperature at the position of the door was significantly lower, which was due to the outdoor temperature drop. As the heat stored in the ground during the day had been almost fully emitted, gaps in the door caused the temperature at that position to drop sharply.
At a height of 1.2 m, the phenomenon of low central and high peripheral temperatures was more obvious. The central temperatures at 3:00 p.m. and 10:00 p.m. were significantly lower than the peripheral temperatures. This was mainly due to the existence of gaps between the top felt and roof felts. At all times, the position on the south side with coordinates (00°0′ S, 2.5 m) had a lower ambient temperature as this was the position of the wooden door. Therefore, when there was a heat source, even when the solar radiation was strongest during the day, the temperature at the door was still low. This indicates that, even with a continuous heat source, the heat loss through the door was still greater than the heat gain.
Figure 6 and Figure 7 show that the temperature differences in the horizontal direction of the yurt were large whether there was a heat source or not, but there were obvious variances for different states and at different times. The maximum temperature differences in each horizontal direction in different states are shown in Table 6. These differences were related to gaps between the wall felt and top felt, gaps between the wall felt and ground, the heat storage capacities of the door and ground, and solar radiation. Among them, the gaps between the felt and the ground and door greatly influenced the peripheral temperature in the yurt, and the gap between the wall felt and top felt greatly influenced the central temperature of the yurt. Even when there was a heat source, the horizontal temperature generally showed a low central temperature and a high peripheral temperature. The distribution of temperature at 0.1 m was more uniform than at 1.2 m, indicating that the heat storage capacity of the ground contributed to the stability of the indoor temperature. When solar radiation was the strongest, there was no obvious increase in the temperature of the inner surface of the felt being radiated, which was mainly due to the better thermal insulation ability and lower thermal inertia of felt. The thermal radiation of the inner side had little effect on the indoor temperature. Therefore, rational consideration of these factors when improving the yurt would be conducive to improving the indoor thermal environment.
3.3. InnerWall Surface and Ground Temperature Changes
Through continuous testing of the yurt’s inner surface of the wall felt and the ground, after preliminary analysis, it was found that the temperature change on rainy days was similar to that at night, so the sunny time period was selected for analysis. The data for 12–15 January 2017 was selected for the winter period, and 18–19 September 2017 was analysed for the transitional season period.
3.3.1. Temperature Changes of the Inner Wall Surface
Figure 8 shows the temperature curve of the indoor surface of the felt wall of the yurt. The inner surface temperature change trend in each direction was essentially consistent with the outdoor temperature change trend. The temperature variation of the inner wall surface of the yurt was not very different from the outdoor temperature. The temperature peaks and troughs of the inner wall surface were slightly delayed compared with the outdoor temperature peaks and troughs, but the delay time was short. The main reason for this is the poor thermal stability of the roof and the wall felt envelope.
The inner wall surface temperature in each direction had obvious characteristics. The winter day was divided into two phases. The first phase was from 12:00–4:40 p.m., when the wall surface temperatures in each direction decreased from high to low in the following order: ‘top > west side > east side > north side’. In this phase, the temperature difference of inner wall surface in each direction was large, and the maximum value appeared at around 2:00 p.m. At this time, the temperatures of the roof and the west side wall surface were almost equal, and the temperature difference between the top and the north side wall surface was the largest, with the maximum value being 4 °C. The second phase was the time period outside the first phase, when there was either no solar radiation or the solar radiation intensity was rising or falling. The inner wall surface temperature in each direction decreased from top to bottom in the following order: ‘roof > east side > north side > west side’, where in the roof’s inner surface temperature was significantly higher than that of the felt wall, with the maximum temperature difference being 3.6 °C; the temperature differences of the inner surface of the felt wall in all directions were small, more or less in the range of 1 °C.
The transitional season day was divided into two phases: the first phase was from 6:00 p.m. to around 06:00 a.m. the next day. As there was no solar radiation during this period, the temperature of the inner surface of the wall was almost the same in all directions, with the maximum temperature difference being 0.5 °C. The second phase was from 06:00 a.m. to 6:00 p.m.; the temperature rose rapidly during this time period and dropped rapidly after reaching the peak. In the rising period, the temperatures at the same time show the following values: ‘east side = south side > west side = north side’. The temperature on the east side reached a maximum of 27 °C at 11:00 a.m., and the temperature on the south side reached a maximum of 30.1 °C at 1:00 p.m.; the temperature on the north side reached a maximum at 3:00 p.m., and the temperature on the north side reached a maximum of 32.1 °C at 3:40 p.m. In the descending period, the temperatures at the same time showed the following values: ‘west side > south side > east side > north side’, and the temperature difference in each direction gradually decreased with the temperature drop and tended to stabilize around 6:00 p.m.
From the above test data and characteristics of inner wall surface temperature in all directions, it can be found that the temperature change of the inner wall surface was mainly related to solar radiation. With the change in the azimuth of the sun, the temperature of the inner surface of the felt wall in each direction would change, but the temperature difference of the inner surface of the felt wall in each direction was not large. When the solar radiation was the strongest, the temperature difference was also within the range of 4 °C; the temperature difference after sunset was basically within 1 °C. The thermal insulation ability of felt thus played an important role. The temperature of the inner surface of the roof was higher than that of the inner surface of the felt wall in all directions. The main reason is that the slope of the roof was more conducive to receiving solar radiation heat; the accumulation of indoor hot air rising to the roof was also an important factor.
3.3.2. Ground Temperature Changes
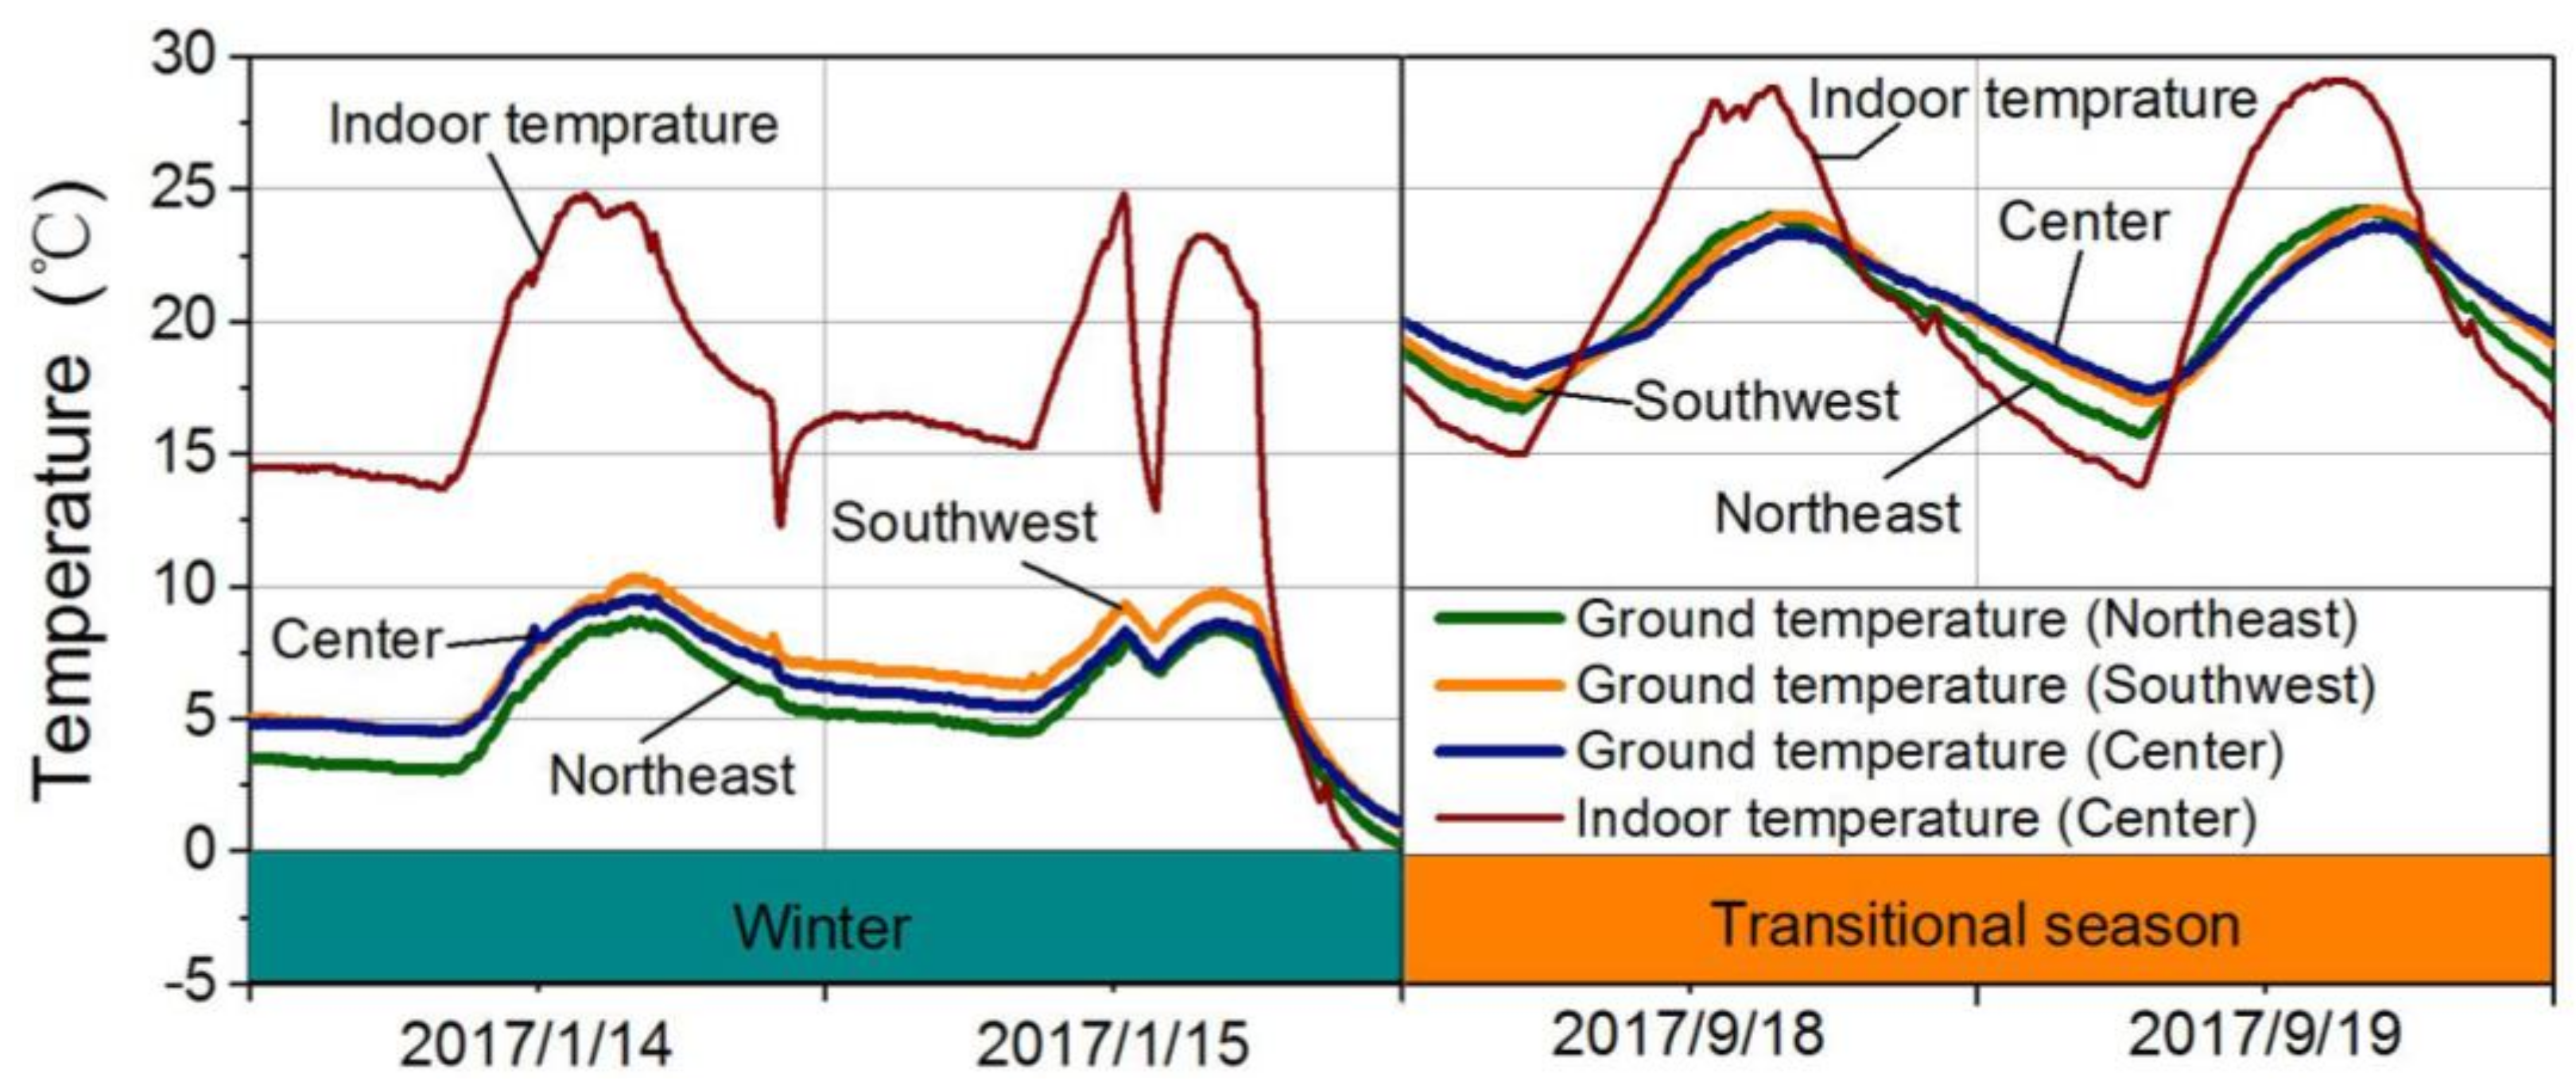
Figure 9 shows the temperature variation curve of the ground beneath the yurt. The ground temperature change trend was consistent with the indoor temperature change trend, but the range of ground temperature change was smaller than that of the indoor temperature change. The ground temperature changes in winter and transitional seasons were 5 °C and 6.5 °C, respectively. As for the temperature distribution at the same time, the ground temperature in winter showed the following decreasing order: ‘southwest > centre > northeast’. The temperature of the central ground in the transitional season was relatively stable, and those in the northeast and southwest directions fluctuated greatly with the solar azimuth. From Figure 8 and Figure 9, it can be seen that the thermal stability of the ground was better than that of the felt wall and the roof. As a result, the herders often take such measures as pit fires and underground flues to provide stable heating for the yurt. These measures not only provide heat, but also make full use of the ground’s heat storage capacity to improve the stability of the yurt’s indoor temperature.
3.4. Analysis of Temperature and Thermal Bridge at the Joints and Seams of the Enclosure Structure
The enclosure structure of the Mongolian yurt consists of the top felt piece, roof felt pieces, wall felt pieces, door, and the floor. The inner wall surface and joints of the enclosure were measured and photographed by an infrared camera. The infrared thermal images and temperature boxplot of each location are shown in Figure 10, and the discrete points of the air temperature were measured every 10 minutes during the testing period. The temperature of the inner wall felt was relatively stable, the temperature difference was relatively small, and the temperature at the bottom of the wall felt was relatively low (which was mainly affected by the bottom gaps). The temperature differences at the joints of the top felt and roof felt were the largest, while there were little temperature differences between the inner wall felt and the joints of the roof felt and the wall felt; the temperature of the joint between the wall felt and ground was the lowest. The level of cold air penetration at the seams was in the following order: ‘joint between the felt and ground > joint between the felt and top felt > joint between the top felt and roof felt’. The temperature change of the joint between the door curtain and the Khana wall was the largest, which was due to cold air penetration and solar radiation. Therefore, the heat bridges were most obvious at the joints and lower parts of the curtain, although they also existed at other joints. These places are the weak points of the enclosure structure of the Mongolian yurt, which should be protected by further measures.
3.5. Influence of Yurt Component Changes on Indoor Temperature and Humidity
The herdsmen can control the temperature and humidity of the yurt by adjusting the yurt components. The main components and equipment that can be adjusted are the top felt piece, wall felt piece, door, curtain, and stove. The effects of adjusting different components were measured and analyzed, with sunny days being selected for testing and analysis, as shown in Figure 11. As the top felt was covered by the Toono crown, the herdsmen could change the natural ventilation and lighting, by opening the top felt cover to adjust a portion of the opening of the Toono crown. Figure 11a shows the temperature and humidity change curve after only the top felt was opened. The opening time was from 2:00 p.m.to 4:10 p.m. on 19 March 2018 and the area opened was half of the Toono area. The indoor temperature was reduced after the top felt was opened but the change was small; whereas, the humidity decline trend was more obvious.
The temperature and humidity can also be controlled by opening the seams of the side wall felts. Figure 11b shows the temperature and humidity curve after opening only the side wall felts. The opening time was from 2:03 p.m. to 4:09 p.m. on 20 March 2018; the opening position was the junction of the ground and (120°0′ W, 2.5 m) and the size of the opening was about 0.0004 m2. The temperature change was obvious after the seam was opened. The temperature change was large during the opening period, as was the humidity change. The temperature and humidity curve soon stabilised after the seam was closed.
Figure 11c shows the temperature and humidity curve when both the top felt and seam between the northwest side of the wall felt and the ground were opened at the same time. The opening positions were the same as in Figure 11a,b. The opening time was from 1:00 p.m.to 4:20 p.m. on 23 March 2018. The temperature changed significantly during the open period, but the amplitudes of changes were between those in Figure 11a,b; the trend of humidity changes was similar to that in Figure 11a.
Figure 11d,e show the temperature change curve when the door and curtain were used to adjust the indoor temperature. During the test period, the prevailing wind was from the northwest. Opening the door had some effect on the temperature changes, though the effect was not great; however, it did result in a significant drop in humidity. The curtain significantly influenced the indoor temperature. The curtain was open from 12:03 p.m.to 9:04 p.m. From Figure 11e, it can be seen that the lower the outdoor temperature, the greater the influence of the door curtain on the indoor temperature; the effects of the curtain on humidity were not obvious. In winter, the herdsmen mainly rely on the stove for adjusting the indoor temperature in the yurt. Figure 11f shows the indoor temperature changes after adding a heat source. The heat source had an obvious effect on regulating the indoor temperature of the yurt.
As observed in the above analysis, the yurt’s indoor temperature and humidity were effectively regulated through changing its components. The opening of the seams between the top felt and wall felt greatly affected the indoor temperature and humidity. The opening of the seams of the wall felt had an obvious influence on the indoor temperature, which was, of course, directly related to the position and size of the opening. The adjustment of the opening of the top felt had a more obvious effect on humidity than opening the wall felt or door. The door curtain had an obvious effect of heat conservation when the outdoor temperature was low. The heat source quickly raised the indoor temperature, but the temperature dropped rapidly after it went out, which was mainly due to the low thermal inertia of the envelope structure and its relatively poor thermal stability.
4. Conclusions
In order to gain a better understanding of the characteristics of the indoor thermal environment of the yurt, a traditional Mongolian yurt was selected for a one-year experiment. From the perspectives of indoor temperature change over time, spatial temperature distribution, temperature change of the inner wall surface, temperature change at the joints, and influence on the indoor temperature of changing the component forms, the indoor thermal environment of the yurt during winter and transitional seasons was analyzed. The following conclusions were drawn.
- 1)
- The indoor temperature of the yurt varied greatly between day and night. The temperature difference between day and night could reach 15 °C in the transitional season and 10 °C in the winter season, and the indoor temperature change was almost synchronous with the outdoor temperature change. The low thermal inertia of the felt was the main factor that affected the indoor temperature stability. Since felt is a hygroscopic material, it can adjust the indoor humidity when the outdoor humidity fluctuates greatly. When the outdoor humidity was low, felt would make the room drier.
- 2)
- The indoor temperature distribution of the yurt was affected by the felt seams, the gaps between the door and wall felt, ground conditions, and solar radiation. Even when there was a central heat source, the horizontal temperature distribution generally showed a low central temperature and high peripheral temperature.
- 3)
- The main influencing factor of the temperature of the yurt’s inner wall surface was solar radiation, and the temperature of the inner wall surface in each direction changed when the direction of solar radiation changed. However, the temperature differences of the inner wall surfaces in each direction were not large. The temperature difference was less than 4 °C when solar radiation was the strongest and less than 1 °C when there was no solar radiation. The insulating capacity of felt was the main influencing factor for this.
- 4)
- The seams between different components of the yurt and the joint between the door and felt enclosures surrounding the Khana greatly influenced the indoor temperature. The levels of cold air penetration at the joints were in the following order: ‘joint between the wall felt and ground > joint between the top felt and roof felt > joint between the wall felt and roof felt’. The levels of cold air penetration at the joints between the door and the Khana were: ‘lower part > upper part > middle part’.
- 5)
- Adjusting the yurt components could effectively regulate the indoor temperature and humidity. The top felt opening had the greatest influence on the indoor humidity. Opening the surrounding wall felt had the most obvious influence on the temperature. The lower the outdoor temperature, the more obvious the heat insulation effect. A heat source could quickly raise the indoor temperature, but the temperature dropped rapidly after the heat source stopped working.
This study revealed the characteristics of the indoor thermal environment and its influencing factors in the Mongolian yurt, which could be useful for improving the thermal environment in Mongolian yurts and similar structures. Methods for improvement should be considered from the following aspects: improving the thermal inertia of the envelope, combining the felt with materials possessing good heat storage capacity, enhancing the thermal stability of the yurt; improving the air tightness of the envelope and reducing the penetration of cold air; taking advantage that the envelope can be opened, and applying modern technology to further optimize the natural ventilation and lighting effects. The limitation of this research is that only the influence of indoor thermal environment by the structure and construction mode of the envelope of the Mongolian yurt is summarized through the test of temperature and humidity. While the thermal comfort within the structure is closely related to the behaviour of the occupants, it is necessary to carry out further research on the indoor thermal comfort and heat stress within the yurt. Future research may include quantitative studies on the effects of indoor thermal environments by improving thermal performance of lightweight materials. Moreover, as occupant heal this related to indoor air quality [41], the sampling of the yurt’s indoor air quality could be useful for further research, along with the examination of other physical comfort such as acoustics and lighting, for which the shape of space has significant influences [42,43,44].
Author Contributions
The present paper is the result of the free, full, and equal cooperation among all the authors, who had the following roles: G.X. was responsible for the experiment, data analysis, and writing-original draft; H.J. supervised the scientific aspects of the whole paper’s contents; J.K. conceived the paper, verified the methods, data, and conclusions. All authors approved the final manuscript.
Funding
This research was funded by the National Natural Science Foundation of China (grant number 51768049), the Natural Science Foundation of Inner Mongolia autonomous region (grant number 2018MS05057), the significant science and technology subject of Inner Mongolia “The green building system integration optimization and engineering demonstration of grassland based on the cultural inheritance”.
Acknowledgments
We gratefully acknowledge professor Wang Wenxin and his team, from the Inner Mongolia University of Technology, who provided their support for the experiment.
Conflicts of Interest
The authors declare no conflict of interest.
References
- Ke, M.A.N. Mongolian yurt: A mixture of the sacred and the secular along with science. J. South-Cent. Univ. Natl. (Philos. Soc. Sci.) 2003, 4, 29–31. [Google Scholar]
- Li, H.; Huiqin, H.; Jianbowen, B. Research on actuality of Mongolian herdsman’s housing and living space on Inner Mongolia Hurunui Grassland. Arch. J. 2009, 2, 42–48. [Google Scholar]
- Mauvieux, B.; Reinberg, A.; Touitou, Y. The yurt: A mobile home of nomadic populations dwelling in the Mongolian steppe is still used both as a sun clock and a calendar. Chronobiol. Int. 2014, 31, 151–156. [Google Scholar] [CrossRef] [PubMed]
- Liu, Q.; Liu, B.-T. Research on Mongolian yurts from the perspective of regionalism. In 2015 International Conference on Energy, Environmental & Sustainable Ecosystem Development (EESED 2015); World Scientific: Singapore, 2015. [Google Scholar]
- Bai, Y.; Mei, H. The modern translation of the Mongolian yurt culture from the perspective of originality. J Arch. 2017, 4, 87–90. [Google Scholar]
- Liu, Z.; Batar, B. The ecological wisdom of the traditional grassland dwellings in Inner Mongolia. In Proceedings of the 15th Conference on Traditional Dwellings, Xian, China, 22–23 July 2007; pp. 395–398. [Google Scholar]
- Liu, H.-Y.; Li, Z.-M.; Ko, F.K. A fractional model for heat transfer in Mongolian yurt. Therm. Sci. 2017, 21, 1861–1866. [Google Scholar] [CrossRef]
- Wang, W.; Xiao, A. A study of the whole lifecycle energy consumption of the enclosure structure of the Mongolian yurt. Build. Energy Effic. 2018, 5, 139–145. [Google Scholar]
- Ren, G.; Zhao, X.D.; Zhan, C.H.; Jin, H.; Zhou, A. Investigation of the Energy Performance of a Novel Modular Solar Building Envelope. Energies 2017, 10, 880. [Google Scholar] [CrossRef]
- Quinn, A.; Shaman, J. Indoor temperature and humidity in New York City apartments during winter. Sci. Total Environ. 2017, 583, 29–35. [Google Scholar] [CrossRef] [Green Version]
- Lin, B.; Wang, Z.; Liu, Y.C.; Zhu, Y.X.; Ouyang, Q. Investigation of winter indoor thermal environment and heating demand of urban residential buildings in China’s hot summer—Cold winter climate region. Build. Environ. 2016, 101, 9–18. [Google Scholar] [CrossRef]
- Li, B.; Du, C.; Yao, R.; Yu, W.; Costanzo, V. Indoor thermal environments in Chinese residential buildings responding to the diversity of climates. Appl. Therm. Eng. 2018, 129, 693–708. [Google Scholar] [CrossRef]
- Han, J.; Kwon, S.-B.; Chun, C. Indoor environment and passengers’ comfort in subway stations in Seoul. Build. Environ. 2016, 104, 221–231. [Google Scholar] [CrossRef]
- Hocine, B. The courtyard house: Can a sustainable future learn from a context relevant past. Int. J. Environ. Sci. Sustain. Dev. 2016, 1, 83–95. [Google Scholar]
- Mao, N.; Zhang, B.; Song, M.; Deng, S. A simplified numerical study on the energy performance and thermal environment of a bedroom TAC system. Energy Build. 2018, 166, 305–316. [Google Scholar] [CrossRef]
- Rodler, A.; Guernouti, S.; Musy, M.; Bouyer, J. Thermal behavior of a building in its environment: Modeling, experimentation, and comparison. Energy Build. 2018, 168, 19–34. [Google Scholar] [CrossRef]
- Ferdyn-Grygierek, J.; Grygierek, K. Multi-variable optimization of building thermal design using genetic algorithms. Energies 2017, 10, 1570. [Google Scholar] [CrossRef]
- Hong, J.; Shao, T. Study on optimal design of energy saving for rural housing in severe cold regions. Arch. J. 2015, 1, 218–220. [Google Scholar]
- Rubio-Bellido, C.; Pulido Arcas, J.A.; Cabeza-Lainez, J.M. Adaptation strategies and resilience to climate change of historic dwellings. Sustainability 2015, 7, 3695–3713. [Google Scholar] [CrossRef]
- Palme, M.; Guerra, J.; Alfaro, S. Thermal performance of traditional and new concept houses in the ancient village of San Pedro De Atacama and surroundings. Sustainability 2014, 6, 3321–3337. [Google Scholar] [CrossRef]
- Gambino, V.; Micangeli, A.; Naso, V.; Michelangeli, E.; di Mario, L. A Sustainable and resilient housing model for indigenous populations of the Mosquitia Region(Honduras). Sustainability 2014, 6, 4931–4948. [Google Scholar] [CrossRef]
- Wang, F.; Liu, Y. Thermal environment of the courtyard style cave dwelling in winter. Energy Build. 2002, 34, 985–1001. [Google Scholar] [CrossRef]
- Huang, Z.; Yu, M.; Zheng, L.; Gong, C.; Wu, Z. One-year field study on indoor environment of Huizhou traditional vernacular dwellings in China. In Proceedings of the 10th International Symposium on Heating, Ventilation and Air Conditioning (2017), Jinan, China, 19–22 October 2017; pp. 1316–1322. [Google Scholar]
- Iba, C.; Hokoi, S.; Ogura, D.; Ito, S. Thermal environment tin detached houses with atrium: Towards proper utilization of atrium space in traditional dwellings ‘Kyo-machiya’. In Proceedings of the 2nd Central Europe an Symposium on Building Physics, Vienna, Austria, 9–11 September 2013. [Google Scholar]
- Shao, T.; Hong, J. Test and analysis of the winter indoor thermal environment of rural dwellings in the cold regions. Build. Technol. 2016, 47, 883–886. [Google Scholar]
- Fanger, P.O. Thermal Comfort: Analysis and Applications in Environmental Engineering; Danish Technical Press: Copenhagen, Denmark, 1970. [Google Scholar]
- Parsons, K.C. Human Thermal Environments: The Effects of Hot, Moderate, and Cold Environments on Human Health, Comfort and Performance, 3rd ed.; CRC Press: London, UK, 2014. [Google Scholar]
- Alfano, F.R.D.; Palella, B.I.; Riccio, G. Notes on the calculation of the PMV index by means of apps. Energy Procedia 2016, 101, 249–256. [Google Scholar] [CrossRef]
- Alfano, F.R.D.; Palella, B.I.; Riccio, G. Notes on the implementation of the IREQ model for the assessment of extreme cold environments. Ergonomics 2013, 56, 707–724. [Google Scholar] [CrossRef] [PubMed]
- Holmér, I. Required clothing insulation (IREQ) as an analytical index of the cold stress. ASHRAE Trans. 1984, 90, 1116–1128. [Google Scholar]
- ASHRAE. Thermal environmental conditions for human occupancy. In ANSI/ASHRAE Standard 55; American Society of Heating, Refrigerating and Air Conditioning Engineers: Atlanta, GA, USA, 2017. [Google Scholar]
- ISO7243. Hot Environments—Estimation of the Heat Stress on Working Man, Based on the WBGT-Index (Wet Bulb Globe Temperature); International Standardization Organization: Geneva, Switzerland, 2017. [Google Scholar]
- ISO7730. Ergonomics of the Thermal Environment—Analytical Determination and Interpretation of Thermal Comfort Using Calculation of the PMV and PPD Indices and Local Thermal Comfort; International Standardization Organization: Geneva, Switzerland, 2005. [Google Scholar]
- ISO11079. Ergonomics of the Thermal Environment: Determination and Interpretation of Cold Stress when Using Required Clothing Insulation (IREQ) and Local Cooling; International Standardization Organization: Geneva, Switzerland, 2007. [Google Scholar]
- ISO9920. Ergonomics of the Thermal Environment—Estimation of the Thermal Insulation and Evaporative Resistance of a Clothing Ensemble; International Standardization Organization: Geneva, Switzerland, 2009. [Google Scholar]
- De Dear, R.J.; Brager, G.S. Thermal comfort in naturally ventilated buildings: Revisions to ASHRAE Standard55. Energy Build. 2002, 34, 549–561. [Google Scholar] [CrossRef]
- Nicol, F. Adaptive thermal comfort standards in the hot-humid tropics. Energy Build. 2004, 36, 628–637. [Google Scholar] [CrossRef]
- Kuehn, D.F. Mongolian Cloud Houses: How to Make a Yurt and Live Comfortably; Shelter Publications: Bolinas, CA, USA, 2006. [Google Scholar]
- Nikiforov, B.S.; Baldorzhieva, V.B.; Nikiforov, S.O.; Markhadaev, B.E. The design of Mongolian yurts(gér): Genesis, typology, frame and modular technologies and their transformations. Sci. Eur. 2017, 1, 56–69. [Google Scholar]
- GB/T50176-2016. Code for Thermal Design of Civil Building. Ministry of Housing and Urban-Rural Development of the People’s Republic of China; China Architecture &Building Press: Beijing, China, 2016.
- De Gennaro, G.; Dambruoso, P.R.; Loiotile, A.D.; Di Gilio, A.; Giungato, P.; Tutino, M.; Marzocca, A.; Mazzone, A.; Palmisani, J.; Porcelli, F. Indoor air quality in schools. Environ. Chem. Lett. 2014, 12, 467–482. [Google Scholar] [CrossRef]
- Kang, J. A method for predicting acoustic indices in long enclosures. Appl. Acoust. 1997, 51, 169–180. [Google Scholar] [CrossRef]
- Kang, J. The unsuitability of the classic room acoustical theory in long enclosures. Archit. Sci. Rev. 1996, 39, 89–94. [Google Scholar] [CrossRef]
- Zhao, W.; Kang, J.; Jin, H. Effects of geometry on the sound field in atria. Build. Simul. 2017, 10, 25–39. [Google Scholar] [CrossRef]
Figure 1.
Yurt and its construction process.

Figure 2.
The measuring points in the yurt. (a) Continuous measuring points (b) Measuring points for temperature distribution.
Figure 2.
The measuring points in the yurt. (a) Continuous measuring points (b) Measuring points for temperature distribution.

Figure 3.
Changes in indoor and outdoor temperature and humidity during the transitional season.

Figure 4.
Indoor and outdoor temperature and humidity curves of the yurt in winter.

Figure 5.
Temperature boxplot of dwellings.

Figure 6.
Indoor temperature distribution of the yurt (with no heat source).

Figure 7.
Distribution of the yurt’s indoor temperature (with a heat source).

Figure 8.
Inner surface temperature curve of the yurt.

Figure 9.
The ground temperature curve of the yurt.

Figure 10.
Thermal images of various components of the yurt and temperature boxplot at the joints.

Figure 11.
Indoor temperature and humidity curve on different components of the yurt.


Table 1.
Components and their connection methods.
| Framework | Toono | Uni | Khana | |
|---|---|---|---|---|
 |  |  |  | |
| Toono and Uni connection | Uni and Khana connection | |||
 |  | |||
Table 2.
The envelope components of the yurt.
| Building Envelope | Wall Felt | Roof Felt | Top Felt |
|---|---|---|---|
 |  |  |  |
Table 3.
Test instruments and parameters
| Test Instrument | Test Parameters | Measurement Accuracy | Measurement Range | Commercial Name |
|---|---|---|---|---|
| RC—4HA/C Temperature and humidity recorder | Air temperature relative humidity (RH) | ±0.5 °C ±3% RH | −30 °C to 60 °C 0% to 99% RH | Hangzhou Sinomeasure Automation Technology Co. Ltd. (Hangzhou, China) |
| FLIR T200 Thermal imaging camera | Wall inner surface temperature | ±2 °C | −20 °C to 120 °C | FLIR Systems, Inc. (Portland, USA) |
Table 4.
Wind roses and wind speed scatter during the sampling period.
| Date | 12 March | 18 March |
|---|---|---|
| Wind Roses(Direction) |  |  |
| Wind Roses(Speed) |  |  |
| Wind Speed Scatter (Color line was the sampling data point) |  |  |
| AverageWind Speed(m/s) | 1.38 | 1.68 |
Table 5.
Wind roses and wind speed scatter during the sampling time.
| Date | 14 March | 15 March |
|---|---|---|
| Wind Roses (Direction) |  |  |
| Wind Roses (Speed) |  |  |
| Wind Speed Scatter (Colour line was the sampling data point) |  |  |
| Average Wind Speed (m/s) | 3.15 | 3.49 |
Table 6.
Temperature difference in the horizontal direction of the yurt
| Yurt State | Measuring Height | Maximum Temperature Difference at 05:00 a.m. | Maximum Temperature Difference at 3:00 p.m. | Maximum Temperature Difference at 10:00 p.m. |
|---|---|---|---|---|
| Without a heat source | 0.1 m | 3.6 °C | 7.1 °C | 2.3 °C |
| 1.2 m | 8 °C | 21 °C | 4.8 °C | |
| With a heat source | 0.1 m | 10 °C | 12.2 °C | 14.4 °C |
| 1.2 m | 15 °C | 6.6 °C | 15.5 °C |
© 2019 by the authors. Licensee MDPI, Basel, Switzerland. This article is an open access article distributed under the terms and conditions of the Creative Commons Attribution (CC BY) license (http://creativecommons.org/licenses/by/4.0/).
Share and Cite
MDPI and ACS Style
Xu, G.; Jin, H.; Kang, J. Experimental Study on the Indoor Thermo-Hygrometric Conditionsof the Mongolian Yurt. Sustainability 2019, 11, 687. https://doi.org/10.3390/su11030687
AMA Style
Xu G, Jin H, Kang J. Experimental Study on the Indoor Thermo-Hygrometric Conditionsof the Mongolian Yurt. Sustainability. 2019; 11(3):687. https://doi.org/10.3390/su11030687
Chicago/Turabian StyleXu, Guoqiang, Hong Jin, and Jian Kang. 2019. "Experimental Study on the Indoor Thermo-Hygrometric Conditionsof the Mongolian Yurt" Sustainability 11, no. 3: 687. https://doi.org/10.3390/su11030687
Note that from the first issue of 2016, this journal uses article numbers instead of page numbers. See further details here.