Article

Agricultural Transformations in the Southern Cone of Latin America: Agricultural Intensification and Decrease of the Aboveground Net Primary Production, Uruguay’s Case

1
Departamento de Sistemas Ambientales. Facultad de Agronomía. Universidad de la República, Montevideo 11200, Uruguay
2
Laboratorio de Desarrollo Sustentable y Gestión Ambiental del Territorio. Instituto de Ecología y Ciencias Ambientales. Facultad de Ciencias. Universidad de la República, Montevideo 11200, Uruguay
*
Author to whom correspondence should be addressed.
Sustainability 2019, 11(24), 7011; https://doi.org/10.3390/su11247011
Submission received: 31 October 2019 / Revised: 3 December 2019 / Accepted: 4 December 2019 / Published: 8 December 2019

Abstract

:
The agri-exporting enclaves of the current corporate food regime intensively exploit natural assets in global strategies that govern the local processes. Their multidimensional impacts contribute to the environmental and civilizational crisis. Linked to the agrarian metabolism in its appropriation phase, land use has impacts on local systems. To understand this process, it is necessary to identify the systemic and spatial expression of environmental transformation. The objective of this work was to analyze the dynamic adjustment of aboveground net primary production (ANPP) to agricultural intensification between the years 2000 and 2017, using a land use intensity index and the soils’ productive potential. Agricultural expansion and consolidation are observed, as well as the significant intensification throughout the period in 65% of the country’s area—with differences between regions—associated with soil types. ANPP is higher in areas of low land use intensity and lower in high intensity areas, varying from high to low in soils with low to high productive potential, respectively, and growing throughout the period—depending on the area, with less growth in areas of greater intensity. The appropriation of edaphic wealth puts the systemic functionality at risk and challenges these transforming dynamics, with a strong impact on southern systems.

1. Introduction

The characteristics of the agri-food system in the production, distribution, and consumption phases work based on a complex network aimed at promoting the global interests of an increasingly small group of large transnational corporations that drive and govern the different links of the globalized agri-food chain [1]. Thus, the system intends to act as a “Food Empire” or “Corporate Empire” [2,3], aiming at unlimited capital expansion and accumulation instead of satisfying the population’s food needs. According to Delgado Cabeza [4], in order to achieve such expansion, large corporations need to direct their efforts to erasing social and ecological limits to drive growth and accumulation, by developing strategies with four components: Financialization of the food system, controlling the rules of the food game, using new technologies, and using time-space.
Financialization refers to the increasing importance of financial capital within the operation of the food system, with the control, appropriation, speculation, and commercialization of nature’s assets and components within the food sector. Financialization creates the conditions for appropriation by dispossession [5], where the traditional components of the food sector (farmers, families, and small businesses) are subjected to the logic behind the financial sector, which ultimately benefits capital.
Controlling the rules of the food game refers to the globalization of the food supply chain. The growing importance of the obligations assumed within the framework of World Trade Organization (WTO) agreements by nation states strengthens the food control infrastructure according to international standards adjusting to the operation requirements of large corporations. In turn, the use of new technologies—proposed as a technological panacea to increase food production through biotechnology, transgenics, and their associated technology package—presents the biggest structural paradox of these times, given the overproduction of food and, at the same time, hunger and poor nutrition worldwide. New technologies also claim to be the solution to severe problems and environmental conflicts (pollution, loss and appropriation of biodiversity, soil and water degradation, and climate change, among others), systematically denying their contribution to exacerbating the problems, which are already framed as a civilizational crisis.
Finally, using time-space refers to a strategy to suppress the specific and singular of each time and space, preventing expansion through mechanisms of financial control and access, and the power to achieve subordination thereto, which predisposes territories to a functional assembly subjected to the strategic project designed and controlled by food empires. The convergence of these elements allows the formation of agri-exporting platforms or enclaves involving local wealth extraction and appropriation systems, where intensive exploitation of local resources and specificities takes place based on strategies which, from a global point of view, govern the dynamics conditioning local production systems [1]. In addition, these systems are “flexible”—that is, functional to the needs of the groups they serve—making their location subject to a permanent search for the best conditions for the use of material and human resources, implying the reconfiguration and transfer of such activities and enclaves, frequently leaving all negative social and environmental impacts in the “area”.
Rural metabolism, based on the concept of social metabolism, understood as mutual determination or the co-evolutive and integrated process between society and non-human nature, is characterized by five phenomena or processes: Appropriation, transformation, consumption, circulation, and excretion [6]. Additionally, it is formed by two large dimensions: A quantifiable tangible dimension consisting of the flow of materials and energy between the five metabolic phenomena, and a non-material dimension, given by the cognitive, symbolic, or technological spheres built into society and acting interdependently with material processes [6]. The notion and, therefore, how environmental systems work, has generally been approached in a reductionist, simple, and isolated manner. However, how human beings are organized in society determines how they transform “nature”, which, in turn, conditions how societies are shaped and conducted [6]. Interdefinability, interdependence, and self-organized totality features link culture and “nature and allow one to address and understand the specific territorial and temporal expression of transformations” [7]. The environmental crisis emerges as a manifestation of the exclusion of nature, culture, and subjectivity from the hard core of modernity’s rationality [8]. In metabolism, appropriation is the phenomenon involved in the access and management of natural assets and any intangible elements associated with them, and occurs in a particular socio-historical context. Any appropriation that is made over the limits of ecosystems’/landscapes’ recovery ends up showing in the decrease of the return flow in the short, medium, or long term, or in the direct or indirect effects of the mechanisms used. Gazzano and Achkar [7] state that “it is the accumulation of wrong decisions, in space and time, which leads to the collapse of the material basis of rural metabolism”. In this sense, this subject may represent greater problems than the ecological-economic exploitation theory, which allows one to understand both the deterioration and collapse of the appropriation process, as well as the different types of conflicts in rural areas [9].
Within this framework, the course of the global agri-food system becomes a global, structural, economic, environmental, and social crisis, within a broader framework of civilizational crises [10,11,12,13]. One symptom of this crisis is the increase in number of overweight and obese people worldwide, which is now 2.2 billion people [14], and the 821 million undernourished, attributable to the dominant global agri-food system [15]. The direction of these agri-exporting commodity farmers carries the displacement of the use of resources at local and regional levels. These resources are no longer the support of the local food supply, as they now nourish the needs of the global food business. This reality is faced in South America, and it is seen mainly regionally in the continent’s warmer areas. The Pampa biome is the group of environmental grasslands in the southern part of the Río de la Plata basin. This biome is one of the most extensive warm grassland regions on the planet. It covers an area of 750,000 km2 in the territories of Uruguay, Paraguay, Brazil, and Argentina (Soriano et al., 1992), where approximately 35 million people live. Globally, this biome comprises 2.5% of the world’s agricultural land, with 0.45% of the world’s population. It is a strategic area of the Río de la Plata basin, since it comprises territories of the lower basin occupying 40% of the basin’s agricultural land and 35% of the population.
The territories of the basin of the Río de la Plata and, in particular, the Pampa biome, were geopolitically valued by the Spanish and Lusitanian crowns for the first time in the mid-16th century, as a living border territory and gateway into the continent which had to be closed tightly. After years of exhaustive geographical exploration, they decided to create port cities on the basin’s main navigable river courses: Buenos Aires, Concepción de Buena Esperanza, and mainly, Asunción del Paraguay, all of them with a privileged geo-strategic position in South America [16]. Thus, given the biome’s geographic importance, it was considered by colonizing nations as the final geographic hub in the Río de la Plata basin and South America’s warm region during the last decades of the 16th century. Continuing this process, in recent decades, the biome’s agricultural area has been used as a specialized production area, with a reduced number of primary production items destined for export. These are a minority sector of very high productivity, which is articulated with an extensive sector maintaining income levels due to the accumulation of land. The logic of the model driven by these sectors is based on the market’s hegemony, the predominance of financial capital, and the promotion of transnational agribusiness companies [17]. So far in the 21st century, the agricultural area grew significantly in the Pampa biome, mainly due to the expansion of soybean crops. Argentina went from 27 to 36 million hectares (soybeans 43%), Brazil from 50 to 75 million hectares (soybeans 42%), Paraguay from 1.5 to 4 million hectares (soybeans 70%), and Uruguay from 0.800 to 1.6 million hectares (soybeans 63%) [17].
In this process, soybean crops expanded on natural ecosystems, exerting multidimensional impacts. In Brazil, cultivated and livestock fields replaced the savanna, pushing for a deforestation process which has affected a wide variety of unique ecosystems, from which 43 million hectares have disappeared in the last 30 years [18]. In Argentina, spaces such as the Yungas jungle, a very fragile ecological system which has been deforested by more than 70%, have been affected [19]. In Uruguay, soybeans expanded on natural grasslands, reducing their area and increasing pressure due to overgrazing. Several works report the degradation and loss of soils and/or fertility due to the “export” of natural nutrients in grains which leave from agri-exporting platforms. Regarding Argentina, Pengue estimates that, in 2002/2003, there were 4.5 million tons of nitrogen and phosphorus [20]. Soybean crops are also highly demanding of water: Approximately 1500 liters of water are used per kilogram of soybeans [21]. One of the most important aspects of placing soybean platforms is to have large water sources in the region [4]. In addition, the effects of the intensive use of agrochemicals must be considered, including glyphosate, a broad-spectrum and high-toxicity herbicide associated with the use of resistant transgenic seeds, the use of which has increased in a much greater proportion than soybeans crops [4].
Also, some social impacts are generally seen in the displacement of the population from the rural environment, the progressive impoverishment of the local population, the intensification of migratory movements towards large metropolitan areas or abroad, and the extension of poverty, malnutrition, and hunger [4]. The synergy between social and biophysical impacts compromises the system’s functionality regarding the possibility of satisfying social demands in terms of the ability to export biomass. Paradoxically, this occurs in territories and countries specialized in agri-food production [4]. Such production is presented as an agricultural intensification process (AI) leading to the development of national economies [22]. AI should be considered as the process of (self) transformation of environmental systems through greater pressure on their structural and/or functional attributes in the biophysical dimension. This process generates a simpler configuration of production systems, more and more homogeneous and specialized, in which flow speeds increase, the biogeochemical cycles are modified, and the operation of the system is opened to the contribution of increasing numbers of inputs with greater dependence on external sources and a decrease in the overall capacity for internal regulation. As an operational concept, AI has been partially defined, strictly referring to the expansion of agriculture. However, this includes a set of interconnected actions: Increase in the number of crops and yields per area, inputs used, reduction of planned and unplanned components of biodiversity, dependence on the market economy, use of technology and capital, and a set of related negative environmental external factors. Therefore, AI integrates elements related to the management and use of the land and of related ecosystems, affecting the operation of environmental systems which still need to be known. This path has been difficult due to the lack of an operational methodology for space-time measurement and assessment. In addition, because AI affects a set of components of the environmental system, modeling and interpreting all the variables involved in the transformation is complex.
Within this framework, the intention is to contribute to understanding AI through a calculation methodology comprising an index of land use intensity based on the assessment of the main agricultural uses in the territory, and the linking of this index with the behavior of aboveground net primary production (ANPP), depending on the land’s productive potential. Since the ANPP is a variable of the behavior of the environmental system comprising structural and/or functional attributes [23,24,25,26] and AI is a process of (self) transformation of these attributes, the analysis of this variable allows us to approach the operation of environmental systems [25].
We aim at contributing to a greater discussion about the impacts of the hegemonic model as a corporate food regime or food empire. Contributing to the debate where the questions of “what”, “how”, “who”, “where”, and “for whom” in terms of production are related to an environmental transformation strategy whose impacts become local (soils-ANPP), but are articulated in their social, economic, and environmental dimensions with modifications that, on a global scale, contribute to an unprecedented crisis. This paper proposes as its hypothesis that an emerging attribute of systems such as the ANPP is sensitive to the impact of transformation and responds with an inherent dynamic of productivity adjustment. The aim is to contribute to this analysis by answering five key questions on the spatio-temporal behavior of Uruguayan agricultural systems: What has been the spatial distribution of agricultural use intensity in Uruguayan soils during the first two decades of the 21st century? What has been the temporal evolution of land use intensity in Uruguay during this period? On what types of soils is the agricultural intensification process carried out in the country? How does this intensification process affect the systemic functionality visualized through the ANPP attribute? Is the effect different according to productive potential?

2. Materials and Methods

The methodological strategy comprised the spatio-temporal analysis of the ANPP using the Normalized Difference Vegetation Index (NDVI) based on the intensity of land use and its agricultural suitability. The enumeration area (EA) was used as a spatial scale, a unit of greater detail in the systematization of the official information collected in the agricultural censuses, which divide the Uruguayan territory into 637 areas (average surface area of 27,000 hectares).

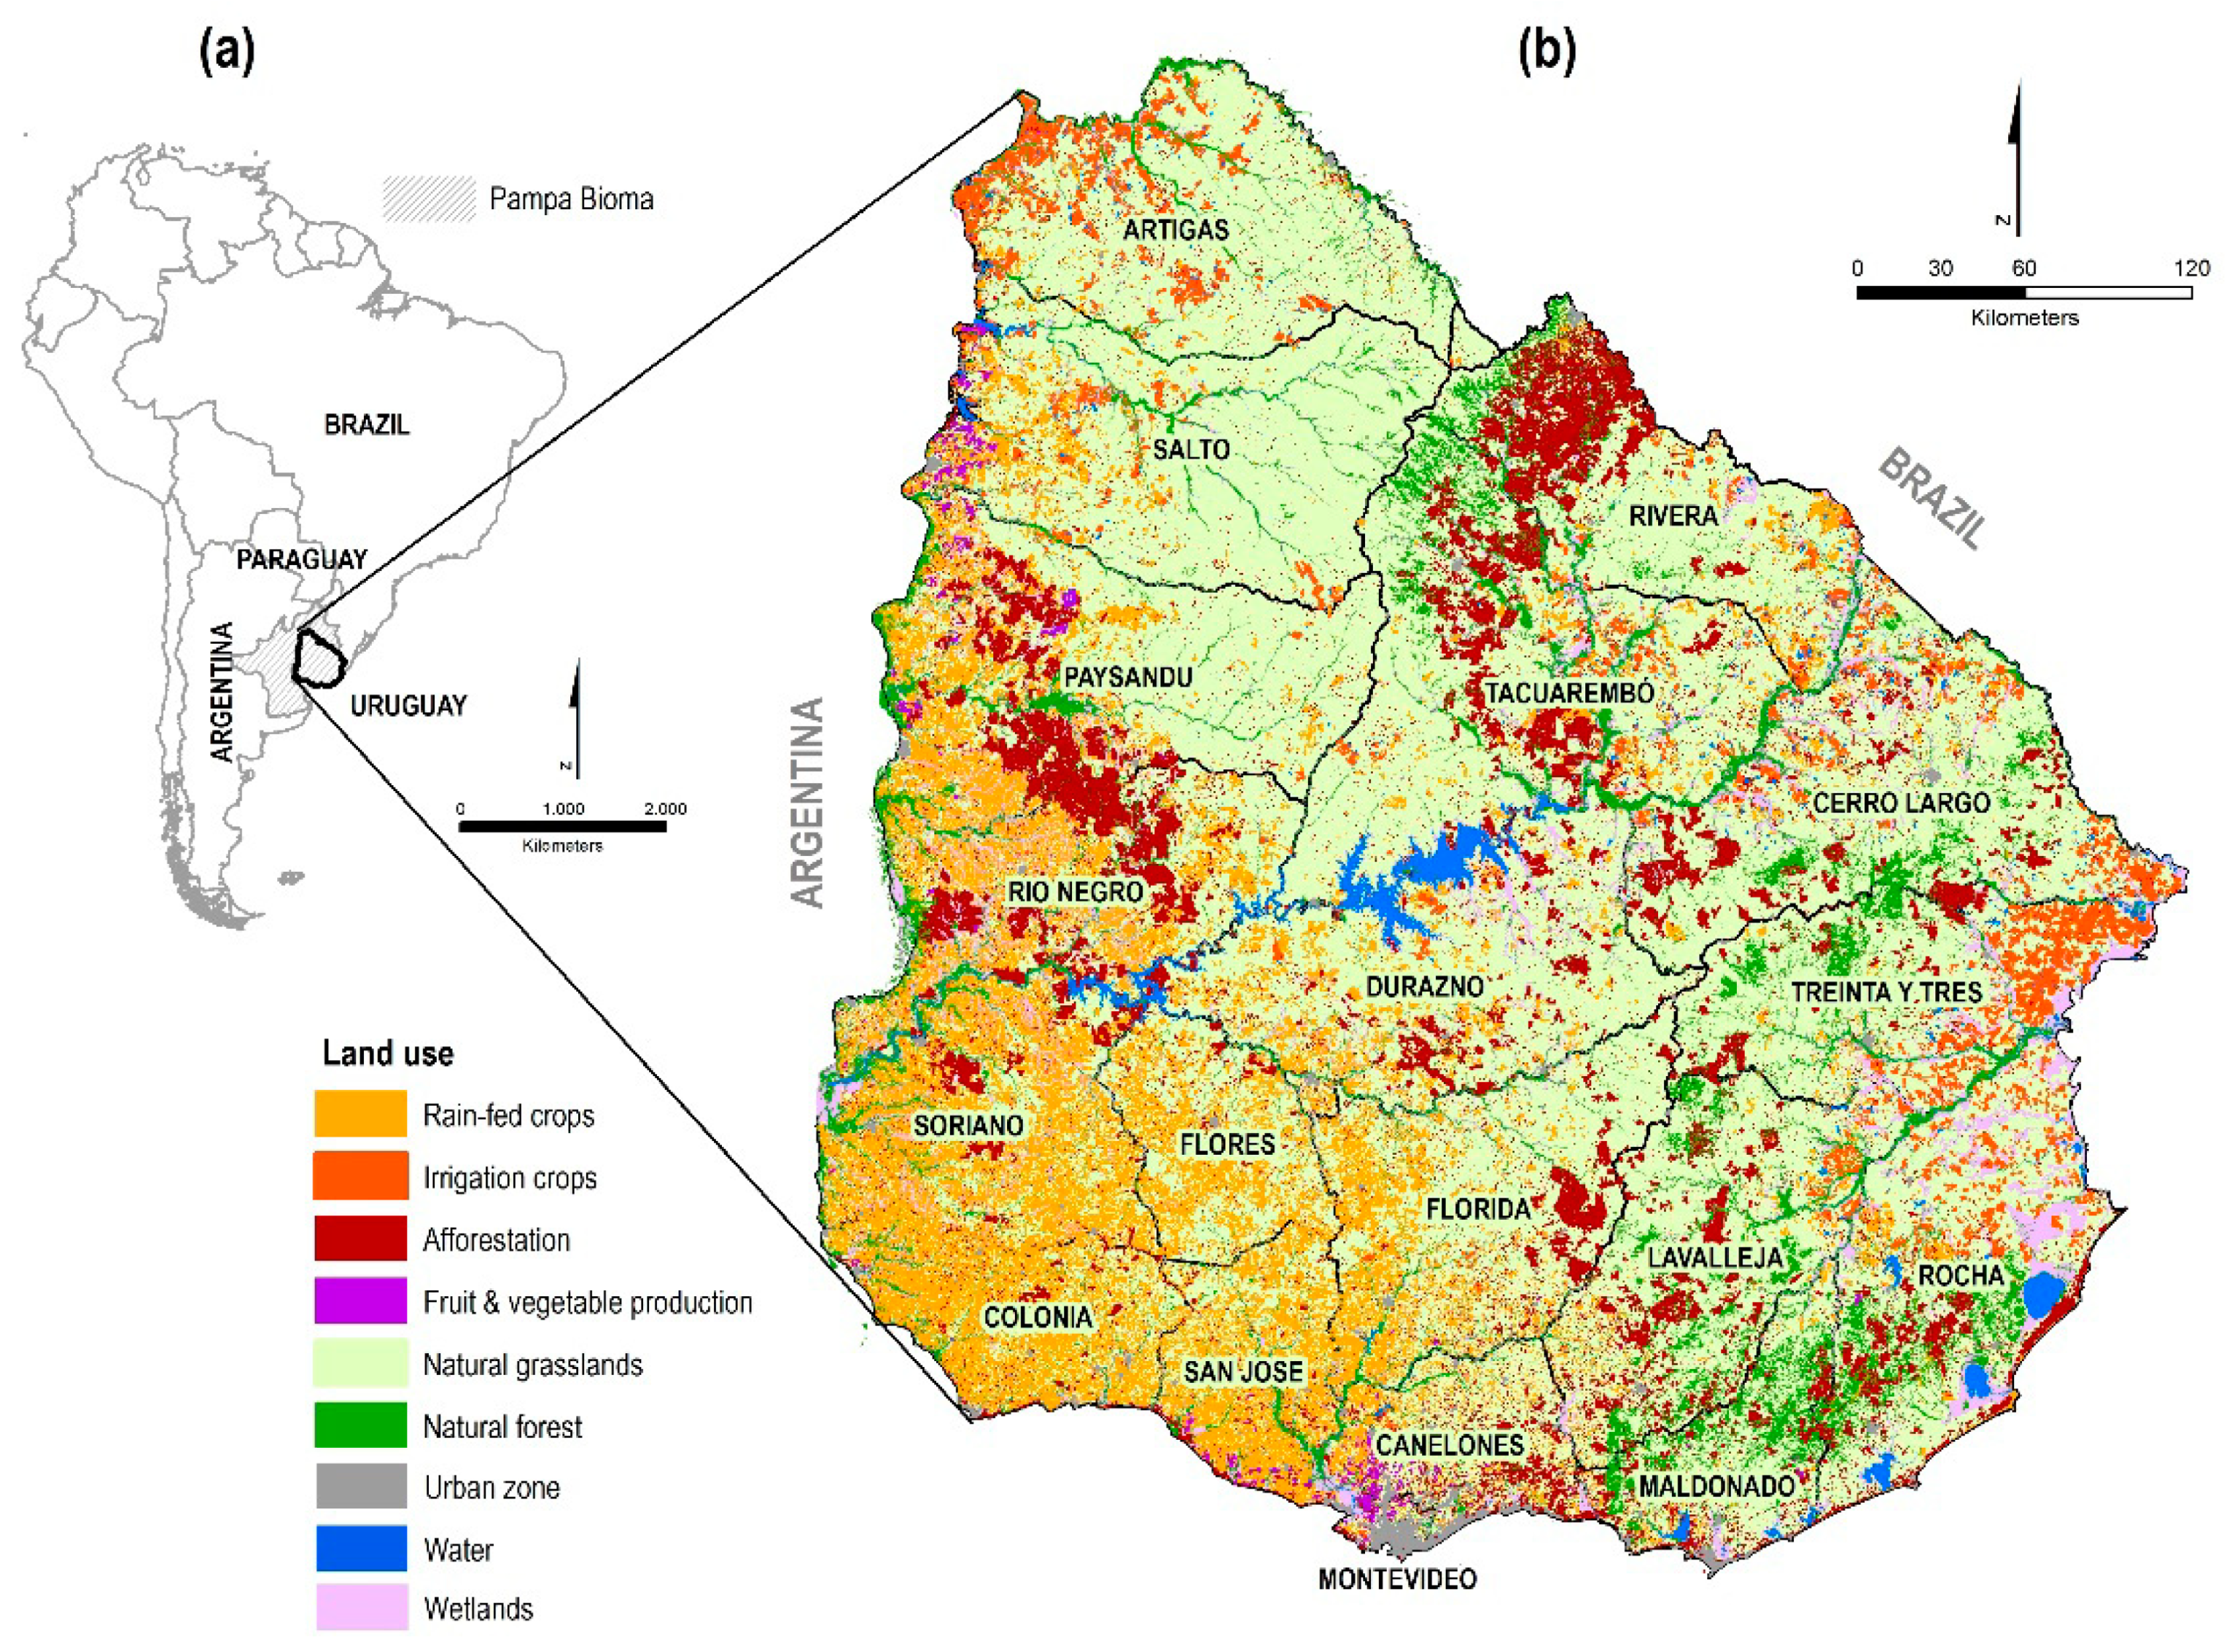
2.1. Uruguay: Territorial Transformation

Uruguay’s land territory is located in the warm area of South America, its latitude is between 30°05′ and 34°58′ south, and its longitude is between 53°11′ and 58°26′ west (Figure 1). The country’s total area is over 17 million hectares (176,000 km2); the climate is mild and humid, with annual accumulated rainfall ranging from 900 mm to 1500 mm between east and west, and average temperatures ranging between 17 °C and 20 °C. Most of the agricultural area is covered by natural grasslands and extensive livestock use (over 12 million hectares) [27]. Next, rain-fed crops—cereal and oilseed crops—located in the western region of the country (mainly soybeans, with approximately 1 million hectares), and irrigated crops in the eastern region of the country (mainly rice, with approximately 200,000 hectares) stand out. In addition, an important area is destined for afforestation of exotic species (approximately 1 million hectares), located mostly in four main regions [28].
In recent decades, the intensification process in Uruguay has sped up with the expansion of soybeans and afforestation affecting 2.1 million hectares (12.8% of the national territory) [30]. Regarding soybeans, in the last decade, the cultivated area grew steadily; it is currently over one million hectares, and is becoming the main agricultural sector [30]. The growth of agriculture was driven by the profitability linked to a cycle of high prices of commodities. This process has been promoted, defined, and led by new Uruguayan agricultural stakeholders. The articulation between progress, science, development, and capitalism spreads and self-accelerates [31] in the process of the ongoing modernization of the Uruguayan agricultural space [32]. Together with these transformations, new stakeholders have emerged, thus pressuring the different agrarian development models [33].
Agriculture reached its maximum area in the 1950s with 1.5 million hectares, decreasing its importance from then on [34]. In the year 2000, a minimum of 0.4 million hectares was reached. At that time, the discussion focused on the possibility of continuing agricultural production in Uruguay [35]. The expansion of soybean crops, which went from 12,000 hectares in 2000/2001 to over 1 million hectares in the 2012/2013 harvest, led to the significant increase of the area destined for agricultural activity. The cultivated area of other crops such as sorghum, corn, and wheat also increased during this period, delving into the country’s agri-exporting nature. In the case of soybeans, Uruguay exports approximately 95% of the country’s production as grain [36].
Expanding the area also carried significant technological changes with the use of direct sowing in virtually all crops, characterized by the use of transgenic seeds (soybean and corn) and the increase in the use of inputs. Between 2003 and 2013, herbicides and agrochemicals in general increased fourfold [37]. The traditional rotation systems changed, reducing the importance of combined agricultural cycles with pastures and livestock, to move on to cycles of continuous agriculture. This also determines a process of agricultural “summering.”
The agricultural intensification process in Uruguay has created a link between agricultural production and soil deterioration processes, which decreases the potential for agricultural production. In particular, physical processes of soil erosion are identified as well as, mainly, the decrease of the organic carbon content in soils [28,38,39,40,41].

2.2. NDVI–MODIS Time Series Data

The NDVI is one of the most used indexes for the assessment, tracking, and monitoring of numerous vegetation coverings and, mainly, for ANPP estimates due to its time and cost efficiency. This index combines the electromagnetic bands of red (R) and infrared (IR) (NDVI = (IR–R)/(IR+R)) [42], and has a positive relationship with the fraction of the photosynthetically active radiation absorbed by vegetation and, therefore, with primary productivity [43,44]. For this reason, it has been an indicator widely used worldwide for monitoring vegetation and, in general, changes in land cover.
The Moderate Resolution Imaging Spectroradiometer (MODIS) on board the Aqua and Terra satellites provides a 16 day composition of the NDVI at a moderate spatial resolution (250 meter pixel), generating 23 compositions per year. This product has been used in numerous investigations (e.g., [45,46,47,48]) due to its high quality, scale, and spatial and temporal cover, and the availability of updated and free data. In this study, 414 images of the MYD13Q1 product, provided free of charge by NASA EOSDIS, were used to cover the 2000–2017 period. Thus, a stack was built integrating pixels from the MODIS database from the entire Uruguayan territory during the 2000–2017 period.
NDVI values were averaged for each EA and 16 day period. Only pixels of the NDVI–MODIS images located fully inside the EA were used.

2.3. Land Use Suitability

A soil suitability index for agricultural (SSIA) rain-fed use was created. Numerical values were assigned to the conceptual categories defined by the MGAP [49], where 0 corresponds to unsuitable soils and 1 to soils with very high aptitude for agriculture. The MGAP’s proposal involved determining crop suitability from the following variables: Erosion resistance, water storage capacity, pH, sodicity, rockiness and drainage; these were georeferenced in the soil charter with a scale of 1:20,000 [50]. This information was processed, systematized, and standardized at the EA scale. Categories defined by MGAP [49] were weighted using the following criteria: 0 for unsuitable, 0.25 for marginally suitable, 0.5 for moderately suitable, 0.75 for suitable, and 1 for very suitable. The SSIA value was the result of the weighted sum of each category of EA’s relative area (Equation (1)), with theoretical values between 0 (100% of EA area with zero agricultural suitability) and 1 (100% of the EA area very suitable for agriculture). Finally, values were reclassified into four suitability categories according to SSIA values—low (<0.2), medium (0.2 ≤ x < 0.3), high (0.3 ≤ x < 0.5) and very high (≥0.5)—using the natural breaks classification method, as this method allows the grouping of previously arranged data and defines cuts where differences in values between groups are maximized regarding intragroup differences [51].
SSIA-EA i = Σ (Sni/SEAi) × Wn
where SSIA-EA = soil suitability for agricultural use in EA i; Sni = area of land use suitability category n in EA i; SEAi = total area in EA i; Wn = land use weighting n.

2.4. Land Use Intensity

The land use intensity index (LUII) developed by Diaz et al. (2018) [52]—the most accurate land use information available—was used to evaluate land use intensity changes. For the first two temporary cuts, years 2000 and 2011, we worked with information collected in the general agricultural censuses [27,52]; in 2017, this information was updated using satellite images. Land use categories developed by Diaz et al. (2018) [52] were used, grouping land use categories surveyed in the 2000 and 2011 censuses.
The LUII was created to analyze land use intensity as a pressure indicator on natural assets based on official census data. It was carried out through the consultation of specialists on geography, agronomy, natural resources management, and ecology, through the weighting technique Analytical Hierarchical Process (AHP), developed by Saaty (1980) [53], which allowed the weighting of each land use and cover. After verifying the consistency of evaluations by decision makers using the consistency ratio and according to Saaty (1980) [53]—who states that if the ratio is less than 0.1, the evaluation is acceptable—20 evaluations were considered by Diaz et al. (2018) [54]. With this background as a basis, the weights suggest that, according to their decreasing intensity, land uses were as follows: Orchards (0.29), cereals and oilseeds (0.25), citrus, fruit and vineyards (0.17), afforestation (0.13), planted pastures and fodder (0.07), improved natural fields (0.04), natural fields (0.03), and wetlands and natural forests (0.02). The LUII was constructed on an EA scale and is the result of the weighted sum of each category’s relative area (Equation (2)).
IEAi = Σ (Sni/SEAi) × Wn
where IEA = intensity in EA i; S = area of land use suitability category n in EA i; SEA = total area in EA i; W = land use weighting n.
Based on this proposal, the index was estimated for 2017. In this case, due to the lack of official information on agricultural censuses, the index was calculated with a supervised pixel-based classification of satellite images [55] from LANDSAT 8OLI for the year 2017 regarding the entire country, using the minimum distance method. For the supervision phase, 100 field data distributed throughout the territory were used to define the training areas. Accuracy was estimated with another 100 field data, resulting in 92% of certainty. This approach allowed the updating of the estimated areas of land uses of greater territorial extension (cereals and oilseeds, exotic afforestation, natural field, improved natural field, and wetlands and native forest).
The LUII was standardized between 0 (100% of the area occupied by lower intensity use) and 1 (100% of the area occupied by higher intensity use), and was classified, taking 2017 as base year, at low (<0.2), medium (0.2 ≤ x < 0.4), high (0.4 ≤ x < 0.6), and very high intensity (≥0.6).

2.5. Data Processing and Analysis

All spatial information was systematized and analyzed through the development and use of a geographic information system (GIS). Thus, it was possible to systematize MODIS satellite information, SSIA, and LUII at EA scale.
First, the existence of spatial autocorrelation was measured using the Moran’s I (MI) [56]. After verifying the spatial autocorrelation, a “hot spot analysis” was performed in order to analyze the spatial distribution of land use intensity. This analysis uses the optimized Gi* statistic from Getis–Ord [57] to identify hot spots and cold spots (EA) in the context of neighboring entities (EA). Hot spots are entities with high values surrounded by entities with high values. When these cases are statistically significant, a z value is generated, which, at a higher value, indicates the grouping of entities with greater intensity. The opposite situation occurs when the value of the entity and its neighboring entities are low (cold points), generating negative z values.
Given the absence of normal distribution (Shapiro–Wilk test) and homogeneity of variance (Levene’s test) in the data series, non-parametric statistical analyses were used. To analyze the relationship between SSIA and LUII, Kendall tau rank correlation coefficient (τ) analysis was applied.
The comparison of the NDVI values between the different categories of land use intensity and land use suitability (LUII and SSIA, respectively) was analyzed using the Kruskal–Wallis test (H) and later, as a post hoc test, the Mann Whitney test corrected (U), a non-parametric test for sample comparison. For the purpose of analyzing the temporal behavior of the NDVI in the entire data sample and for each SSIA and LUII category, the Kendall tau rank correlation coefficient (τ) was used, analyzing the correlations between the dates (consecutively numbered) and the NDVI values. This test was used because the data does not meet the normality or independence assumptions.
Data analysis was first carried out for the entire period (2000–2017), and then for the 2000–2010 and 2011–2017 sub-periods, in order to consider the intercensal period and the current period. A significance level of 0.05 (p value) was established in all statistical tests.

3. Results

The lack of normal distribution of NDVI (W = 0.98, p < 0.001), SIIA (W = 0.96, p < 0.001), LUII 2000 (W = 0.86, p < 0.001), LUII 2011 (W = 0.91, p < 0.001), and LUII 2017 (W = 0.90, p < 0.001) was detected. In addition, the lack of homogeneity of variance of NDVI (F = 10.4, p < 0.001) and IPAS (F = 7.59, p < 0.001) was detected.

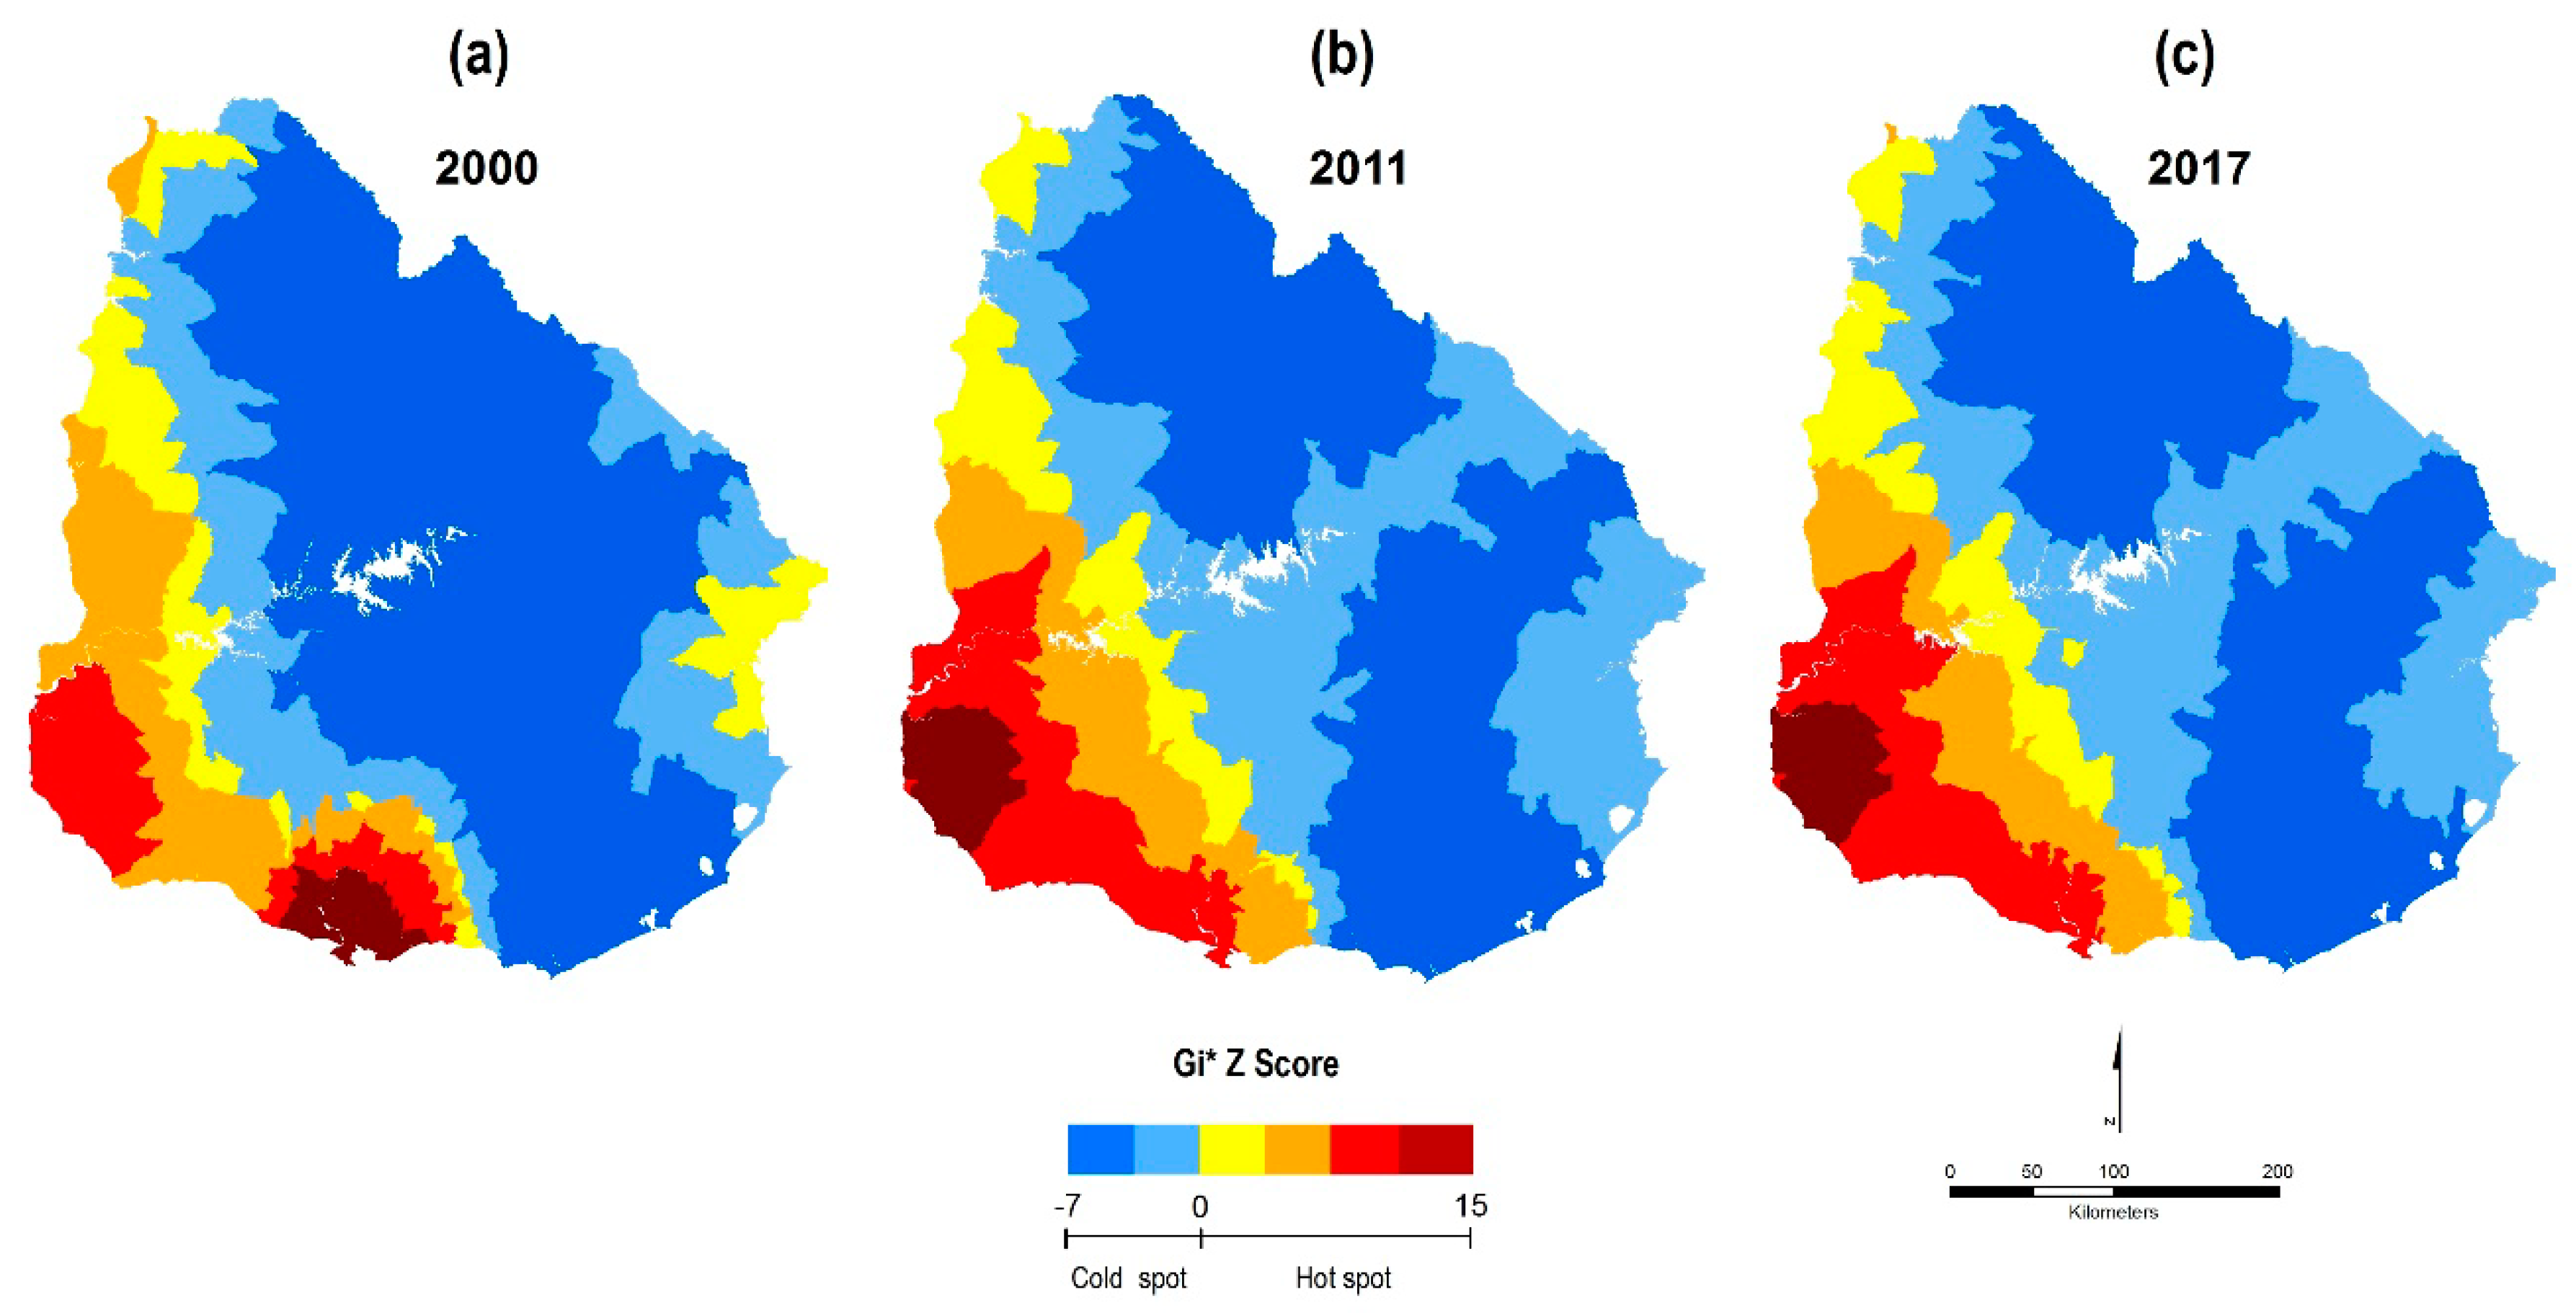
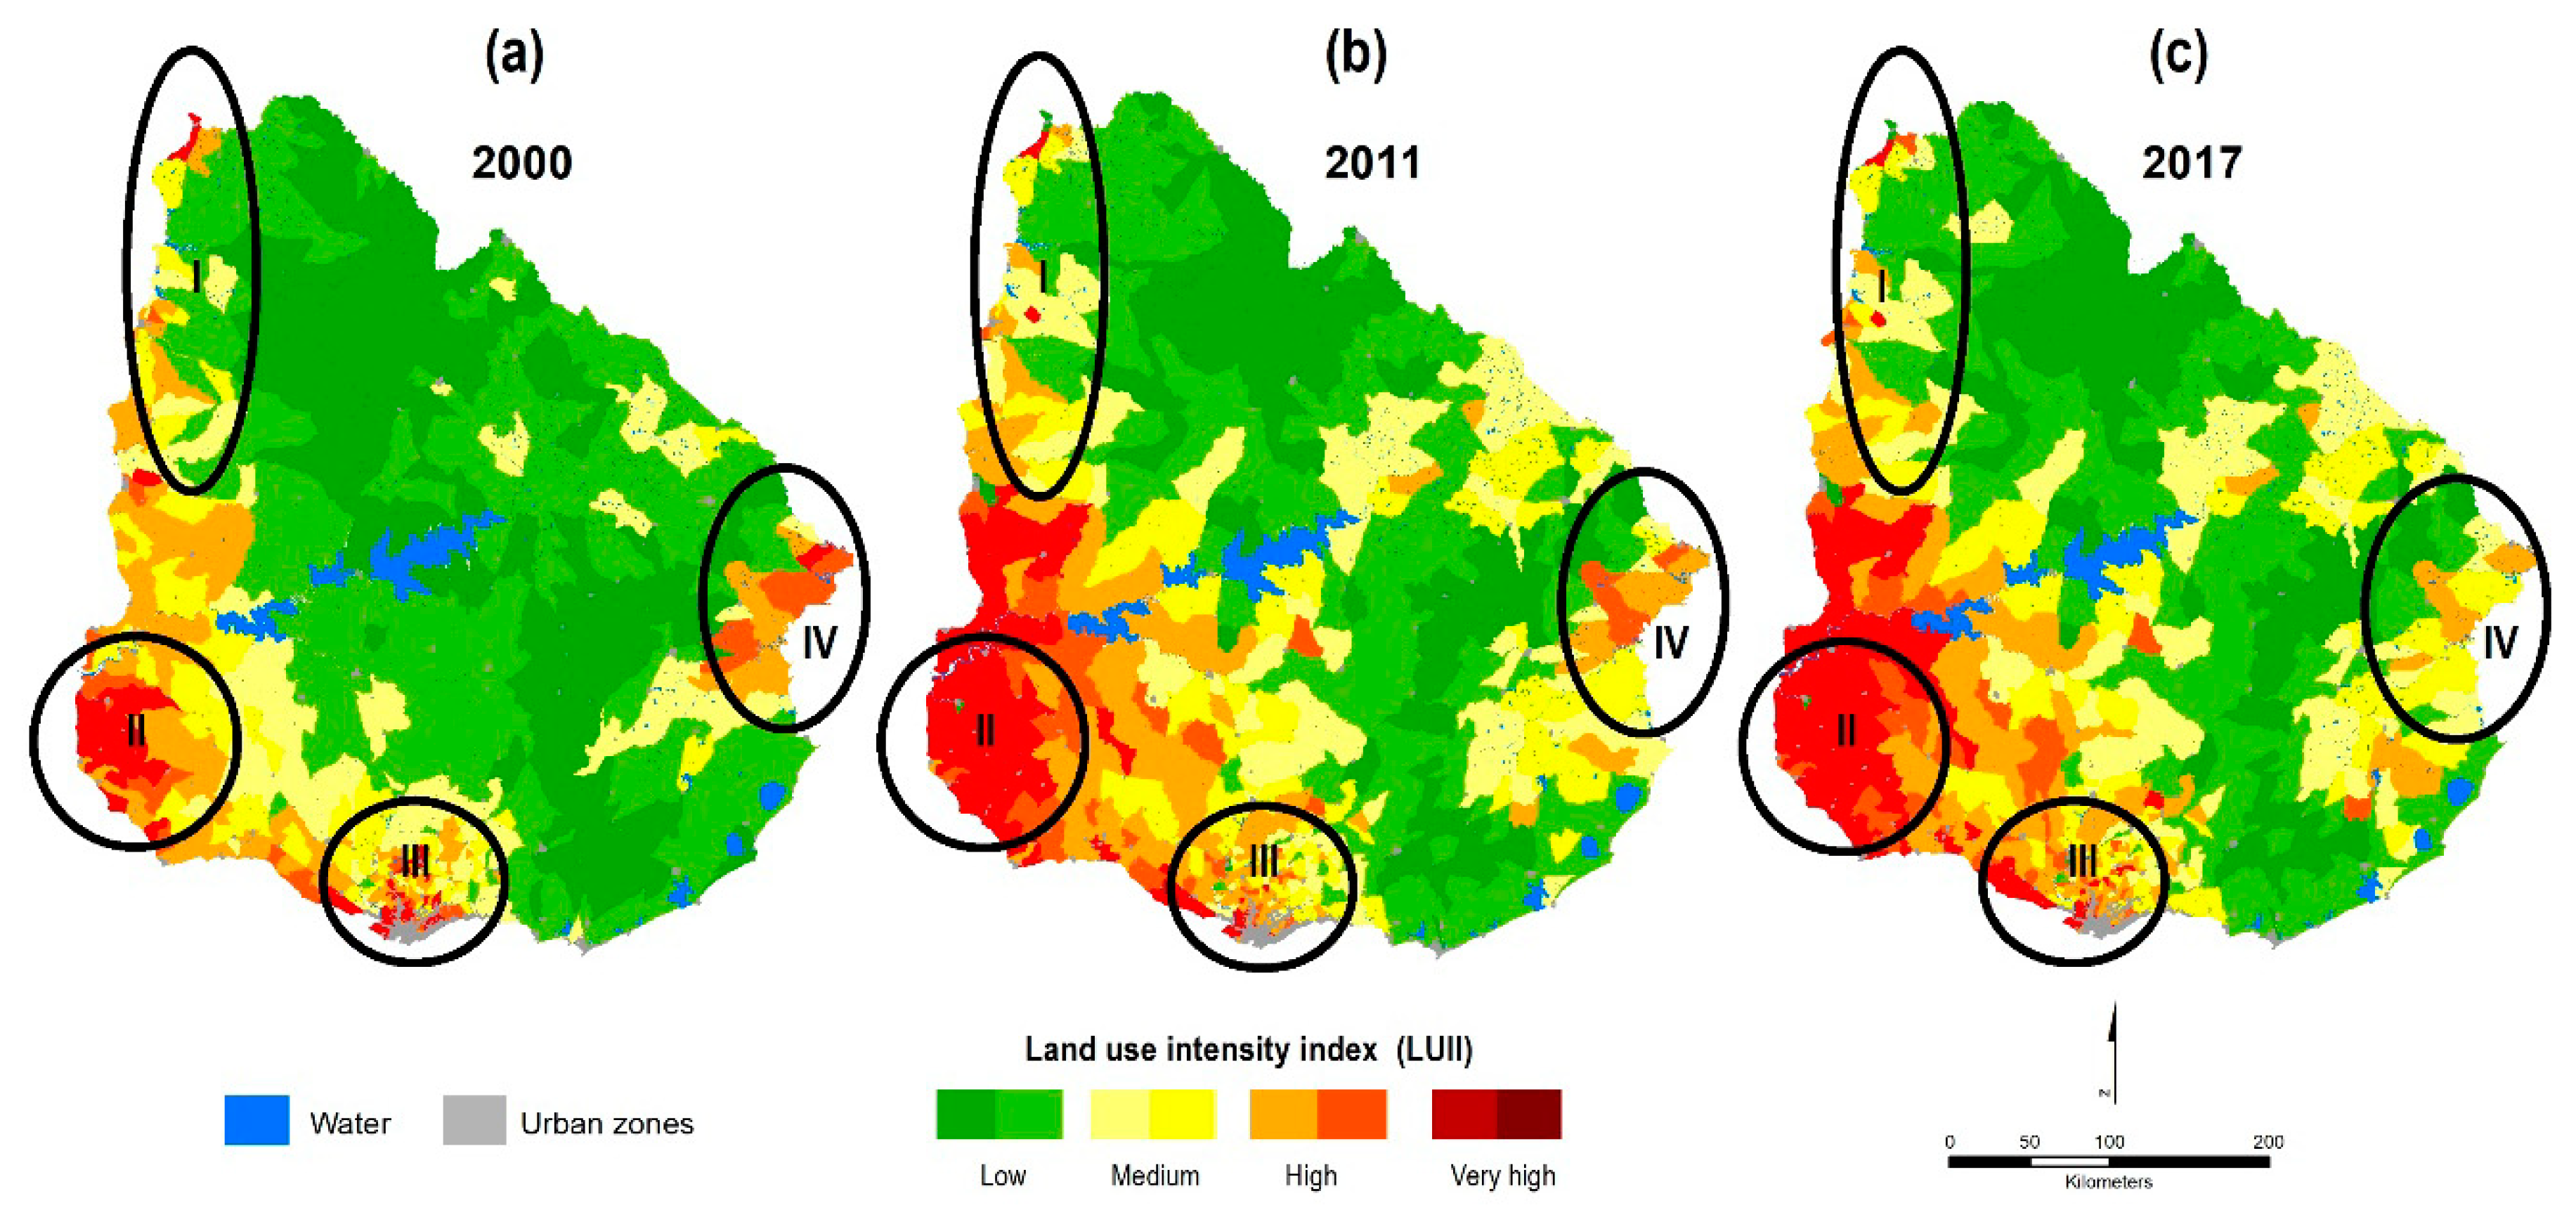
3.1. Land Use Intensity

Changes in intensity show differences at the spatial level. In the southwest area, there is evidence of greater intensity of rural land use (Figure 2). Agricultural production is distributed in four areas: South, southwest coast, northwest coast, and east, as observed in the spatial distribution of LUII for the year 2000 (Figure 2). In 2011 and 2017, these areas remained unchanged, and the expansion of the agricultural frontier from the west coast towards the center of the country was evidenced, along with a very strong consolidation in the southwest coast (Figure 2 and Figure 3), due to the expansion of rain-fed crops. In addition, the decreasing intensity in the east is highlighted due to a loss of relative importance of rice crops. The main spatial change took place in the first decade and was consolidated in the 2011–2017 period.
For 2000–2017, three large territorial processes of agricultural expansion in this period were clearly identified: (a) Consolidation of the west coast region as a key cereal and oilseed crops area, and the decrease in relative importance (at country level) of the southern horticultural area; (b) expansion towards the center of the country; (c) loss of relative importance (stagnation) of the southeast rice area, with an expansion of rain-fed crops in the eastern middle plains.
A presence of spatial autocorrelation for the LIUU values was detected for the years 2000 (MI = 0.85, z = 60.5, p < 0.0001), 2011 (MI = 0.41, z = 28.9, p < 0.0001), and 2017 (MI = 0.40, z = 28.2, p < 0.0001). During this period, the LUII showed an important growth. An increase in land use intensity values in 56% of the enumeration areas stand out, which represents 65% of the country’s area (Figure 3).
When considering the country, the average LUII value for the year 2000 (0.2) showed a 12% growth compared to 2011 (0.22) and a 15% growth compared to 2017 (0.23) (Table 1). These results indicate that, during said period, there were two major stages: (a) 2000–2011, with significant agricultural expansion towards the center of the country, with an increase in land use intensity of 64% of the EA, and (b) 2011–2017, with a consolidation of intensification, where, although intensification was only about 3.5%—three times less than in the previous period—intensification was of 71% of the total enumeration areas, and the rest remained the same. LUII distribution between such dates was positively and significantly correlated, although with significant variations between the two periods, 2000–2011 (τ = 0.64; p < 0.001) and 2011–2017 (τ = 0.95; p < 0.001), as a result of territorial expansion in the first period and consolidation in the second period.

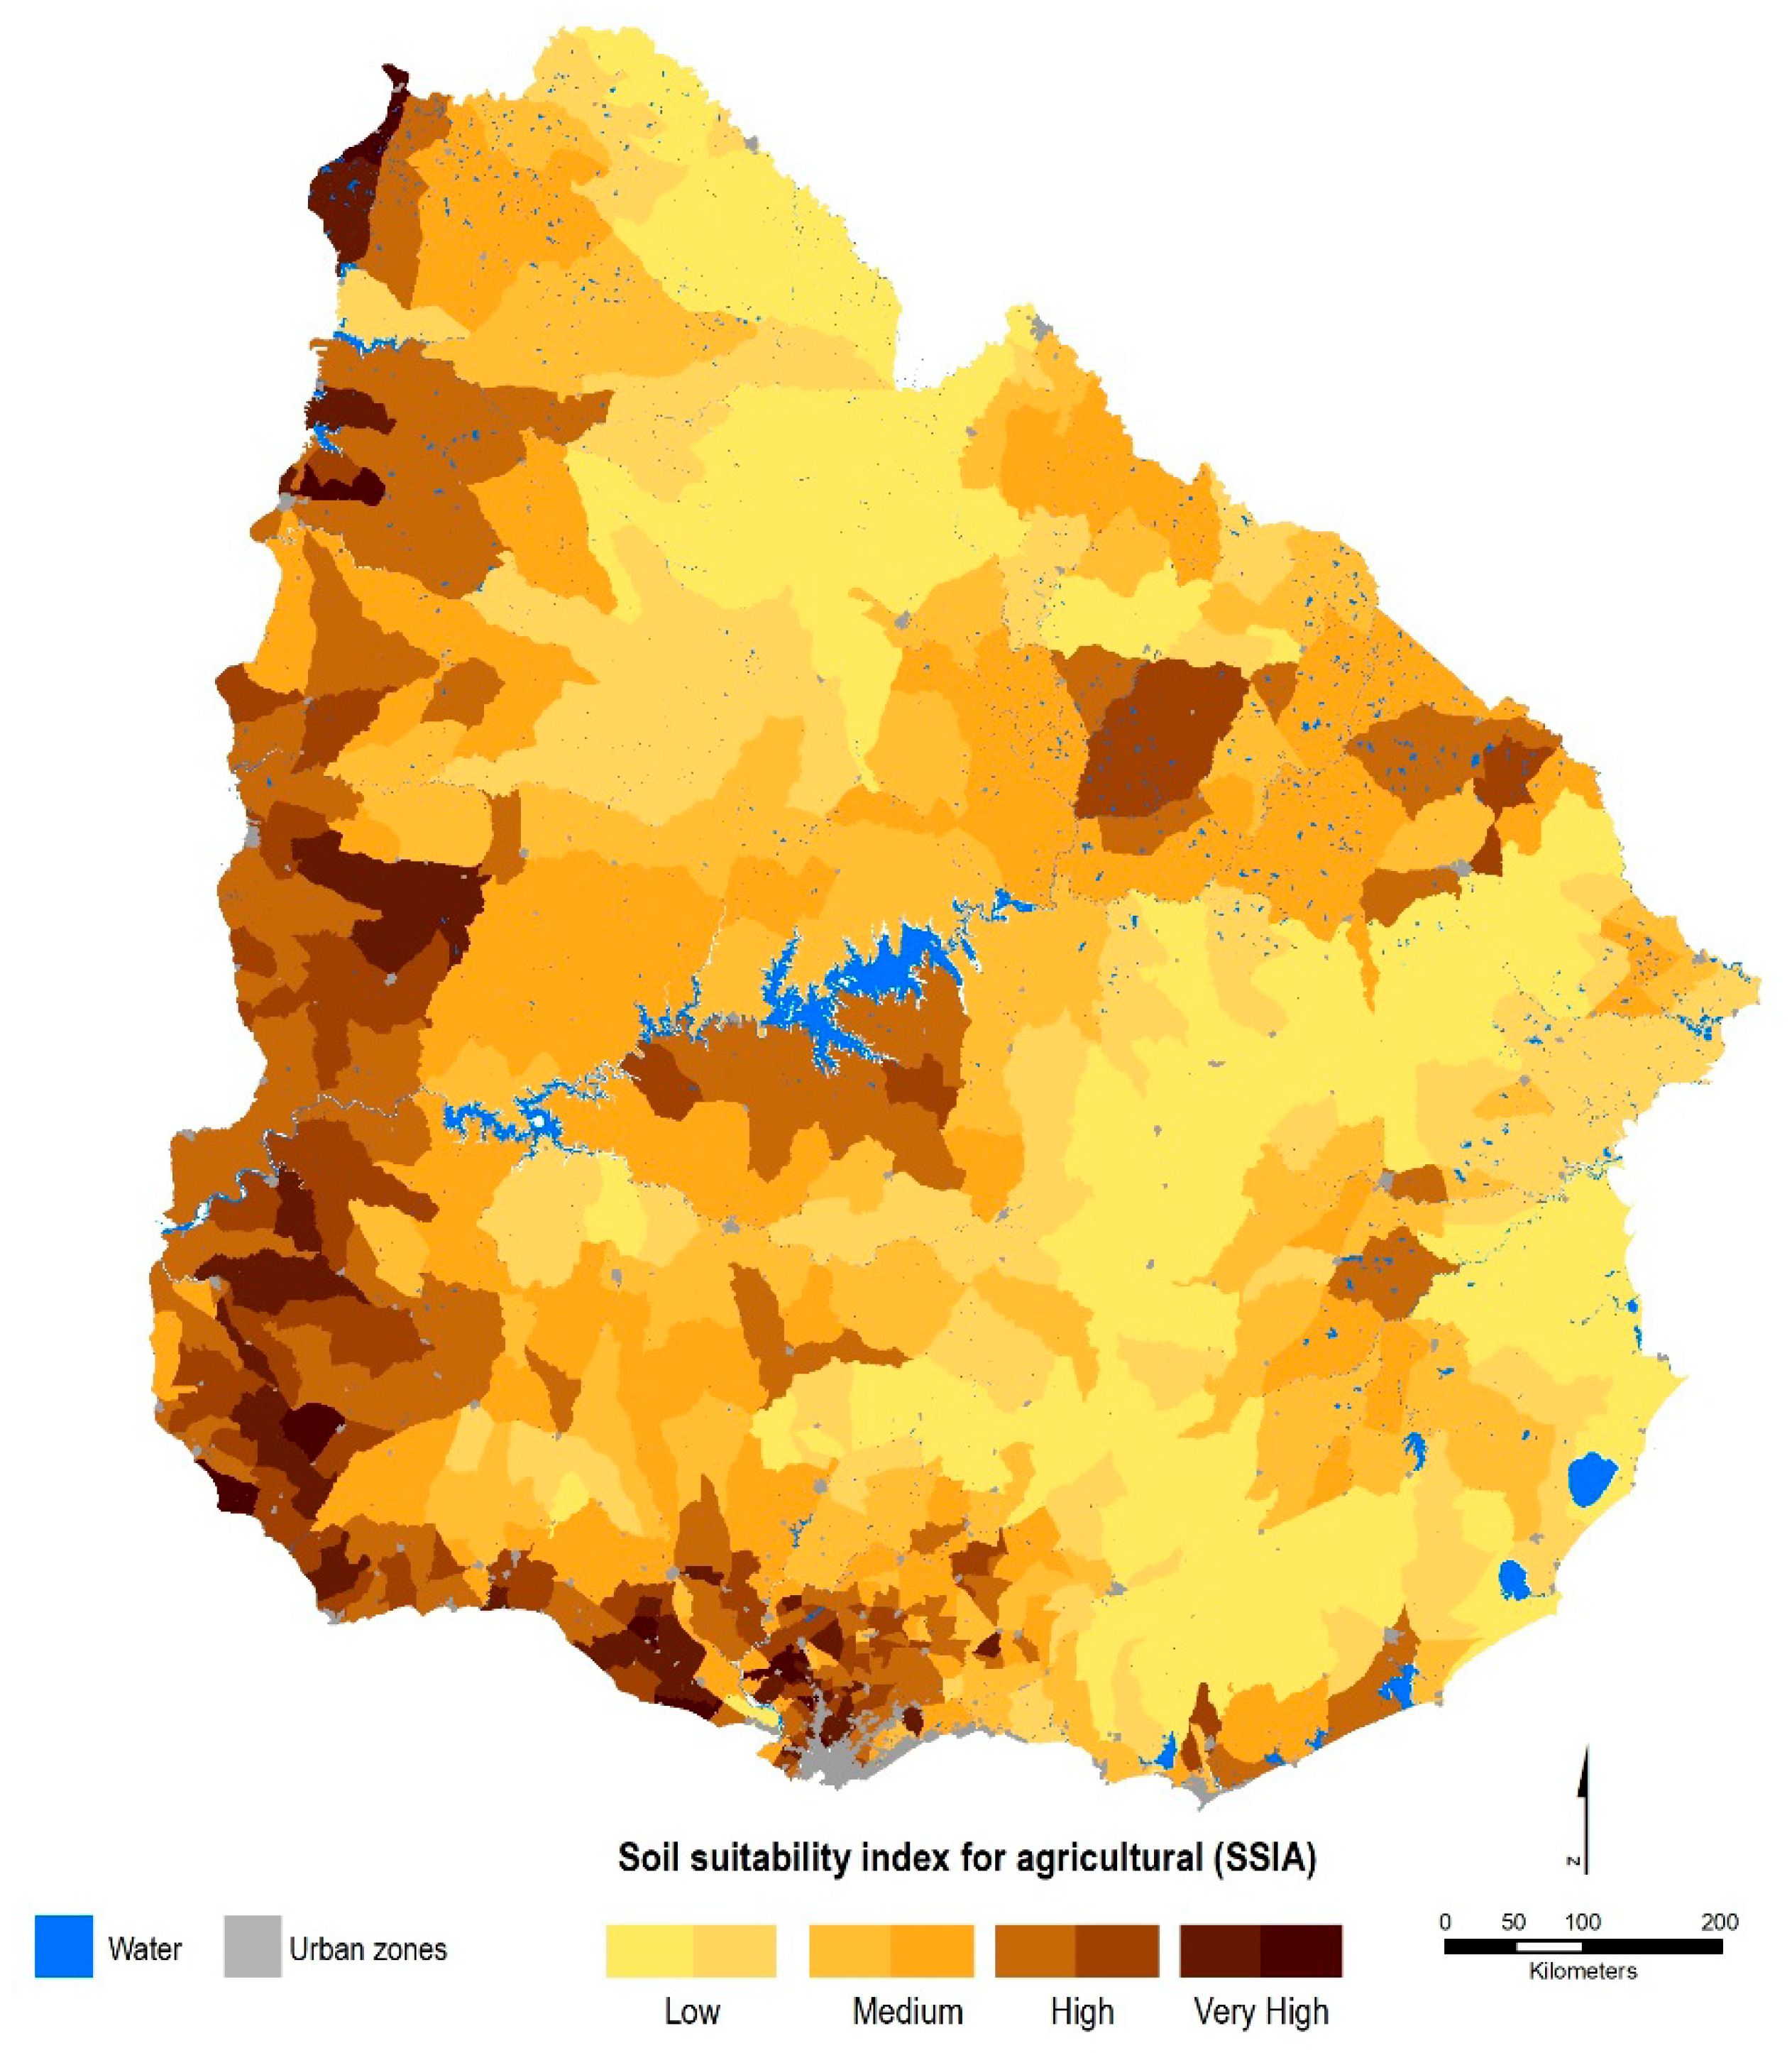
3.2. Agricultural Potential Suitability

Of the EAs, 30% showed low agricultural potential suitability, 32% average suitability, 28% high suitability, and 10% very high suitability. Potential soil suitability was significantly higher in the west coast (SSIA was 50% higher than the country’s average) and in the southern area (SSIA was 41% higher than the country’s average). High potential areas were found in the center of the country and, to a lesser extent, spatially dispersed in the northeast area. Lower potential areas were located to the north and east of the country, and mean potential areas covered the largest area and were dispersed throughout the territory (Figure 4).
EAs of greater land use intensity were located in the areas with the highest SSIA. This link decreased between the year 2000 (τ = 0.56; p < 0.001) and 2011 (τ = 0.50; p < 0.001), and increased slightly in 2017 (τ = 0.51; p < 0.001). High correlations indicate that the most intensive uses are mostly located on soils with greater agricultural suitability. In particular, at the beginning of the analyzed period, agriculture was developed in soils of greater suitability. Subsequently, the expansion towards the center of the country was carried out on soils with less potential, and in 2017, the trend was towards the use of soils with greater agricultural potential.

3.3. ANPP Behavior

The average NDVI was significantly higher in areas of lower land use intensity, followed by those of medium intensity and those of higher intensity with the lower values (H = 117, p < 0.0001). The coefficient of variation was higher in areas of greater intensity (9.7%) than of lower intensity (7.2%). The same variability pattern was found for both sub-periods.
NDVI median analysis for the entire period showed significant differences regarding soils’ productive potentials (H = 313, p < 0.0001). Values ranged from highest to lowest NDVI in soils according to their suitability; in general, soils of lower agricultural suitability show higher NDVI values, and soils of greater suitability show the lowest NDVI values (U = 31877, p < 0.0001). The same pattern was observed for the two sub-periods considered, although in the last period, the differences between marginal and unsuitable soils were not significant (Table 2).
In areas with very highly suitable soils, the NDVI did not show any significant trends throughout the period. A trend was identified in the remaining areas. In these cases, the NDVI’s growth was greater, as the soil showed less agricultural suitability.
The NDVI within the group of agricultural areas showed a growing trend throughout the period (τ = 0.26, p < 0.001), which was explained by the growing trends of low intensity areas (τ = 0.27, p < 0.001) and of medium intensity areas (τ = 0.17, p < 0.001). On the other hand, in high intensity areas, the trend was not significant (p > 0.05).
In the first sub-period, no significant trends were identified for the group of areas. These differences were only identified for high intensity areas showing a decreasing trend in the NDVI (τ = −0.19, p < 0.001). In the second sub-period, a growing trend was seen (τ = 0.22, p < 0.001), which was explained by the growing trend of low intensity areas (τ = 0.22, p < 0.001) and of medium intensity areas (τ = 0.20, p < 0.001). On the other hand, in high intensity areas, the trend was not significant.
The analysis of the three areas according to their level of agricultural intensification showed, for the 2000–2017 period, an increasing trend of the NDVI in the three areas, although it was higher in areas which remained stable in their land use intensity, and showed lower values in areas where intensification was stronger (Table 3).
This variation was different according to each sub-period. In the first sub-period, it was significant in areas of material changes showing a decreasing trend. In the second sub-period, it was increasing in all cases, and growth was greater in the areas where intensification was stable (Table 3).

4. Discussion

Differences, which show greater intensity of rural land use in the southwest, are consistent with the spatial pattern of historical agricultural uses of Uruguayan soils, which expands from Montevideo’s surroundings towards the west [28]. In the first decade of this study, agricultural expansion from the west coast to the center of the country was confirmed. In this process, it is worth noting that the consolidation of cereal crops took place in soils of high agricultural suitability, but the expansion towards the center during the first period was developed on soils with less agricultural potential. The process of intensification and expansion of the agricultural area follows a similar pattern in all countries of Latin America’s Southern Cone [17], and Uruguay does not escape this logic of use and appropriation of the agricultural space’s natural assets. Expansion implies an advance on grasslands, hence modifying the system, since it removes the natural tapestry. The consequences of this transformation are linked to various processes, such as loss of the ability to retain carbon in soils [38], degradation [58], and loss of biodiversity associated with the Pampa biome [59]. In addition, there are changes in the “productive profile” of these soils linked to traditional livestock use, which is replaced by agriculture and new social stakeholders [60].
This transformation also results in a decrease in the relative importance of the southern area of fruit and vegetable production at the country level, which stood out until the year 2000. Its importance is linked to national food security and sovereignty, given that food production in this area is primarily destined for the domestic market [61]. Another aspect associated with this transformation is the loss of relative importance of the southeast rice area and the increase of rain-fed crops, which may be interpreted as part of the agricultural expansion of soybeans, but with a change in land use—mainly from rice crops, linked to “flooding” soils in middle plains and to rain-fed crops [62]. This shows a stagnation and relative impact on one of the most important crops in Uruguay’s exporting scheme [63].
During this 17 year period, the intensification process expanded and consolidated, on the one hand, in existing agricultural areas, and on the other hand, in new agricultural areas, which shows a process of appropriation of natural assets and territorial transformations. Resulting impacts may be associated not only with the decrease of natural grasslands and their systemic use, but also with its linkage to social and economic transformations affecting traditional livestock systems, together with other impacts associated with the technology package, including increased use of biocides and fertilizers [36].
ANPP as a systemic attribute of environmental systems allowed the capture of part of this transformation. Therefore, it is evident that its growth trend is higher in areas with less intensification, and lower in those with greater intensification. The same behavior is observed regarding the suitability of land use: Higher NDVI levels are found in soils with lower agricultural suitability, and lower values are found in soils with higher suitability. These trends coincide with those found when analyzing the country’s general tendency [54].
These systems of greater suitability are also those involving the greatest intensification, which seems to result in a lower ANPP. This behavior can be interpreted as the result of two factors acting simultaneously and reinforcing each other. A first factor, which would be explained by intensive land uses, reduces vegetable soil cover during a large part of the year (e.g., soybeans cover the soil with vegetation only in summer, while natural grasslands do so throughout the year). A second factor, explained by the export of nutrients from insensitive land use areas, is generated mainly in the harvest phase (system outputs) and, therefore, determines a “mobilization” of the productive potential of soils towards the productive results, as identified in local studies [64,65]. The first factor contributes greatly to the explanation of productivity at a specific time, while the second factor contributes to the explanation of the productivity trend over time.
By analyzing this behavior, it may be interpreted that the “mobilization” of the productive potential of soils towards productive results is increasingly lower. Considering this aspect together with the slowdown in cereal productivity [66] implies the understanding that productivity increases must be achieved at the cost of total inputs (fertilizers and biocides), which consequently increases environmental impacts [67].
From this interpretation, maintaining or increasing productivity may only be achieved on the basis of projecting greater expansion and intensification, consolidating a growing spiral in appropriation mechanisms determined by global logics, which are based on deepening the use of technology and capital [68].
The growing NDVI trend throughout the period, in all agricultural areas, is explained by a greater productivity in areas of low and medium use intensity. Although, at the country level, the NDVI may be offset between regions; local productive capacities are different, resulting in more serious consequences to more suitable and more intensively used soils, while expanding on less suitable soils with higher relative productivity, because such soils have undergone less intensification.
Increasing productivity on the basis of expansion, intensification, and greater dependence on inputs is the strategy of agricultural agribusiness, which articulates on a global scale both the input business and the production, marketing, and/or consumption business [69]. This results in local systems of wealth extraction and appropriation, in which the intensive exploitation of resources and local specificities takes place. Thus, the dynamics of local productive systems are governed from a global perspective [70], making evident their impacts which, from the point of view of the Southern Cone, may already be considered as regional [32]. Any appropriation made over the limits of the recovery of ecosystems/landscapes ends up showing in the decrease of the return flow in the short, medium, or long terms, or in the direct or indirect effects of the mechanisms used. The accumulation of decisions and/or actions in space and time for the benefit of maintaining extraction, concentration, and appropriation logics for some, and at the cost of others, may lead to the collapse of the material basis of rural metabolism, causing territorial conflicts in several dimensions.
Results obtained show the expansion of industrial agriculture by increasing the intensive use of inputs (energy, machinery, fertilizers, pesticides) and the greater control of production methods, which coincides with analyses carried out for the region [17].

5. Conclusions

LUII, SSIA, and NDVI are indicators which are complementary and adequate for capturing the spatio-temporal transformations of use intensity and understanding the spatial dynamics of the process based on soils’ productive potentials.
In the period analyzed, agrarian intensification presents a spatial strategy that is structured from the west coast and moves towards the center of the country, which consolidates industrial agriculture and agribusiness in Uruguay. At the beginning, the growth of intensive agriculture is a slow process advancing on soils with greater productive potential. Subsequently, growth accelerates, and prioritizes the territorial consolidation of non-agricultural areas. Finally, when the process slows down, it retracts mainly on less suitable soils.
Lower PPNA values in areas with more suitable soils and greater intensification require further study of nutrient reserves in these soils and their management in the future. This knowledge would contribute to avoiding cycles of decreased productivity, decreased plant waste, changes in soil structure, and therefore, lost productivity.
The space-time pattern of primary productivity found in this work shows that productivity decreases in soils with greater agricultural suitability while remaining stable in other soils (or remains stable while increasing in other soils, or increasing less than in other soils). This pattern questions the strategy for the use and appropriation of nature’s assets. The overexploitation of soils linked to agricultural businesses endangers primary productivity and generates great uncertainty regarding its medium and long term. Therefore, it is worth asking if we are facing a new impulse of colonialism, acting again as a colonized geographical pole in the Río de la Plata basin and the warm region of South America. In this sense, the region is facing the need to define strategies for its agrarian systems: Becoming functional territories of this logic of appropriation, or building options from the counter-hegemonic agrarian territories, the livelihoods of agriculture, and self-determined, resilient, and fair ways of living.

Author Contributions

Conceptualization, I.G. and M.A.; methodology, I.G., M.A., and I.D.; formal analysis, I.G., M.A., and I.D.; investigation, I.G. and I.D.; resources, I.G.; writing—original draft preparation, I.G.; writing—review and editing, M.A. and I.D.; visualization, I.D.; supervision, I.G.; project administration, I.G.

Funding

This research received no external funding.

Acknowledgments

The authors would like to acknowledge the four anonymous reviewers whose input greatly improved the manuscript.

Conflicts of Interest

The authors declare no conflict of interest.

References

  1. González de Molina, M.; Fernández, X. Semimonográfico Crisis del modelo agroalimentario y alternativas: Presentación. Rev. Econ. Crítica 2010, 10, 28–31. [Google Scholar]
  2. Mcmichael, P. Global development and the corporate food regime Philip McMichael Cornell University Prepared for Symposium on New Directions in the Sociology of Global Development. World 2004, 11, 265–299. [Google Scholar]
  3. Van der Ploeg, J. Nuevos campesinos. Campesinos e imperios alimentarios. Sociología 2012, 343, 351. [Google Scholar]
  4. Delgado Cabeza, M. El sistema agroalimentario globalizado:imperios alimentarios y degradación social y ecológica. Econ. Crítica 2010, 10, 32–61. [Google Scholar]
  5. Harvey, D. El “Nuevo” Imperialismo: Acumulación por Desposesión; CLACSO: Buenos Aires, Argentina, 2005. [Google Scholar]
  6. Toledo, V.M. Metabolismos rurales: Hacia una teoría económico-ecológica de la apropiación de la naturaleza. Revibec Rev. Red Iberoam. Econ. Ecológica 2008, 7, 1–26. [Google Scholar]
  7. Gazzano, I.; Achkar, M. Análisis de la Intensificación agraria en la cuenca del área protegida Esteros de Farrapos: La necesidad de articular conservación y producción. In IV Congreso Latinoamericano de Agroecología; SOCLA: Lima, Peru, 2013. [Google Scholar]
  8. Eschenhagen, M. Diversas consideraciones y aproximaciones a la nocion de complejidad ambiental. Gestión Ambient. 2007, 10, 83–94. [Google Scholar]
  9. Martinez-Alier, J. Los indicadores de insustentabilidad urbana como indicadores de conflicto social. Ayer 2002, 43–62. [Google Scholar]
  10. Bartra, A. Tiempos turbulentos. Argumentos 2010, 23, 91–119. [Google Scholar]
  11. Agoglia, O. El marco categorial de la crisis ambiental en un contexto globalizado. Rev. Investig. Esc. Cienc. Soc. Artes Humanid. UNAD 2012, 3, 25–40. [Google Scholar] [CrossRef] [Green Version]
  12. Giraldo, O.F. Ecología Política de la Agricultura. Agroecología y Posdesarrollo; ECOSUR: San Cristóbal de las Casas, Mexico, 2018. [Google Scholar]
  13. Aguirre, P. Alternativas a la crisis global de la alimentación. Nueva Soc. 2016, 262, 1–11. [Google Scholar]
  14. GBD 2015 Obesity Collaborators; Afshin, A.; Forouzanfar, M.H.; Reitsma, M.B.; Sur, P.; Estep, K.; Lee, A.; Marczak, L.; Mokdad, A.H.; Moradi-Lakeh, M.; et al. Health effects of overweight and obesity in 195 countries over 25 years. Engl. J. Med. 2017, 377, 13–27. [Google Scholar]
  15. Fao; Fida; Unicef; Pma; Oms. El Estado de la Seguridad Alimentaria y la Nutrición en el Mundo; Fomentando la Resiliencia Climática en Aras de la Seguridad Alimentaria y la Nutrición: Roma, Italy, 2018. [Google Scholar]
  16. Pesce, F. Lecturas Geopolíticas en la Cuenca del Plata. (Siglos XVI al XX). In Globalización y Territorio. Nueva Ruralidad, Patrimonios Colectivos y Sustentabilidad en la Cuenca del Plata; Linck, T., Schiavo, C., Eds.; Ed. Nordan: Lower Saxony, Germany, 2003; pp. 25–38. [Google Scholar]
  17. Pengue, W. Dinámicas y Perspectivas de la Agricultura Actual en Latinoamérica: Bolivia, Argentina, Paraguay y Brasil; Ed. Böll: Santiago de Chile, Chile, 2015. [Google Scholar]
  18. INPE-INPE. Estima 7.900 km2 de desmatamento por corte raso na Amazônia em 2018 2019. Available online: http://www.produccion-animal.com.ar/suelos_ganaderos/14-efecto_rotaciones_cultivos.pdf (accessed on 5 September 2019).
  19. Pengue, W. Lo que el Norte le debe al Sur. Le Monde Dipl. 2002, 3, 34. [Google Scholar]
  20. Pengue, W. Agua virtual, agronegocio sojero y cuestiones económico ambientales futuras. Fronteras 2006, 5, 14–25. [Google Scholar]
  21. Andriani, J.M.; Bodrero, M. Respuesta de cultivares de soja a la disponibilidad hídrica. In Primer Congreso Nacional de Soja y Segunda Reunión Nacional de Oleaginosos; Pergamino: Buenos Aires, Argentina, 1995; pp. 81–87. [Google Scholar]
  22. Conway, G. Sustainability in agricultural development: Trade-offs between productivity, stability and equitability. J. Farming Syst. Res. 1994, 4, 1–14. [Google Scholar]
  23. Requena-Mullor, J.M.; López, E.; Castro, A.J.; Cabello, J.; Virgós, E.; González-Miras, E.; Castro, H. Modeling spatial distribution of European badger in arid landscapes: An ecosystem functioning approach. Landsc. Ecol. 2014, 29, 843–855. [Google Scholar] [CrossRef]
  24. Reyes-Díez, A.; Alcaraz-Segura, D.; Cabello-Piñar, J. Implicaciones del filtrado de calidad del índice de vegetación EVI para el seguimiento funcional de ecosistemas. Rev. Teledetec. 2015, 2015, 11–29. [Google Scholar] [CrossRef] [Green Version]
  25. Gazzano, I.; Achkar, M. Conflicto de las transformaciones territoriales: Ganaderos frente a la intensificación agraria en Esteros de Farrapos. Rev. Iberoam. Econ. Ecológica 2016, 26, 109–122. [Google Scholar]
  26. Fisher, B.; Turner, R.K.; Morling, P. Defining and classifying ecosystem services for decision making. Ecol. Econ. 2009, 68, 643–653. [Google Scholar] [CrossRef] [Green Version]
  27. DIEA Censo General Agropecuario. Resultados Definitivos; MGAP-DIEA: Montevideo, Uruguay, 2011. [Google Scholar]
  28. Achkar, M.; Díaz, I.; Domínguez, A.; Pesce, F. Uruguay, Naturaleza Sociedad Economía. Una visión desde la Geografía; Editorial Banda Oriental: Montevideo, Uruguay, 2016. [Google Scholar]
  29. DINOT-MVOTMA. Cobertura 2015-LUCC Uruguay. 2018. Available online: http://sit.mvotma.gub.uy/websdatos/cobertura.html (accessed on 12 April 2019).
  30. DIEA. Anuario Estadístico 2016; MGAP-DIEA: Montevideo, Uruguay, 2016. [Google Scholar]
  31. De Souza Silva, J.O. Poder da ciência, a ciência do poder e o futuro da questão alimentar. Rev. Assoc. Bras. Reforma Agrária 2014, 35, 79–101. [Google Scholar]
  32. Achkar, M. El bioma pampa: Un territorio en disputa. In Olhares Sobre o Pampa: Um Território em Disputa; Rejane, C., Foleto, E., Eds.; Evangraf: Porto Alegre, Brazil, 2017; pp. 125–139. [Google Scholar]
  33. Arbeletche, P.; Carballo, C. Sojización y concentración de la agricultura uruguaya. In Congreso de la AAEA; AAEA: Córdoba, Argentina, 2006. [Google Scholar]
  34. Vassallo, M.; Bruno, Y.; Carriquiry, M.; Courdin, V.; Durán, V.; García, F.; Hernández, A.; Rodríguez, N.; Tamosiunas, M. Dinámica y Competencia Intrasectorial en el Agro Uruguay 2000–2010; Vasallo, M., Ed.; UdelaR: Montevideo, Uruguay, 2011. [Google Scholar]
  35. Arbeletche, P.; Gutiérrez, G. Crecimiento de la agricultura en Uruguay: Exclusión social o integración económica en redes. Pampa Rev. Interuniv. Estud. Territ. 2010, 1, 113–138. [Google Scholar] [CrossRef]
  36. Oyhantçabal, G.; Narbondo, I. Valorización del balance de N y P de la soja en Uruguay. Revibec Rev. Iberoam. Econ. Ecológica 2012, 19, 54–65. [Google Scholar]
  37. MGAP Datos Estadísticos de Importaciones de Productos Fitosanitarios. Available online: http://www.mgap.gub.uy/unidad-organizativa/direccion-general-de-servicios-agricolas/tramites-y-servicios/servicios/datos (accessed on 11 September 2019).
  38. Beretta-Blanco, A.; Pérez, O.; Carrasco-Letelier, L. Soil quality decrease over 13 years of agricultural production. Nutr. Cycl. Agroecosyst. 2019, 114, 45–55. [Google Scholar] [CrossRef]
  39. Tan, Z.; Liu, S.; Li, Z.; Loveland, T.R. Simulated responses of soil organic carbon stock to tillage management scenarios in the Northwest Great Plains. Carbon Balance Manag. 2007, 2, 7. [Google Scholar] [CrossRef] [PubMed] [Green Version]
  40. Morón, A. Efecto de las rotaciones Cultivos-Pasturas sobre la fertilidad de los suelos en ensayos de larga duración del INIA La Estanzuela (1963–2003). Inf. Agronómicas 2003, 1–20. Available online: http://www.produccion-animal.com.ar/suelos_ganaderos/14-efecto_rotaciones_cultivos.pdf (accessed on 5 September 2019).
  41. Funes, F. El movimiento cubano de agricultura orgánica. Transformando el campo cubano. Av. Agric. Sosten. 2001, 15–38. [Google Scholar]
  42. Tucker, C.J.; Sellers, P.J. Satellite remote sensing of primary production. Int. J. Remote Sens. 1986, 7, 1395–1416. [Google Scholar] [CrossRef]
  43. Prince, S.D. Satellite remote sensing of primary production: Comparison of results for Sahelian grasslands 1981–1988. Int. J. Remote Sens. 1991, 12, 1301–1311. [Google Scholar] [CrossRef]
  44. Sellers, P.J.; Berry, J.A.; Collatz, G.J.; Field, C.B.; Hall, F.G. Canopy reflectance, photosynthesis, and transpiration. III. A reanalysis using improved leaf models and a new canopy integration scheme. Remote Sens. Environ. 1992, 42, 187–216. [Google Scholar] [CrossRef]
  45. Dong, S.; Li, H.; Sun, D. Fractal feature analysis and information extraction of woodlands based on MODIS NDVI time series. Sustainability 2017, 9, 1215. [Google Scholar] [CrossRef] [Green Version]
  46. Díaz, I.; Achkar, M.; Crisci, C.; Mazzeo, N. Natural and land-use drivers of primary production in a highly vulnerable region of livestock production. J. Agric. Rural Dev. Trop. Subtrop. 2019, 120, 1–14. [Google Scholar]
  47. Chen, C.F.; Son, N.T.; Chang, L.Y.; Chen, C.R. Classification of rice cropping systems by empirical mode decomposition and linear mixture model for time-series MODIS 250 m NDVI data in the Mekong Delta, Vietnam. Int. J. Remote Sens. 2011, 32, 5115–5134. [Google Scholar] [CrossRef]
  48. Li, Y.; Chao, Z.; Long, H.; Liu, Y.; Li, W. Dynamic analysis of ecological environment combined with land cover and NDVI changes and implications for sustainable urban–rural development: The case of Mu Us Sandy Land, China. J. Clean. Prod. 2017, 142, 697–715. [Google Scholar] [CrossRef]
  49. MGAP. Zonificación de Cultivos de Verano de Secano. 2014. Available online: http://web.renare.gub.uy/media/suelos/informes/ZonificacionParaCultivosVeranoSecano.pdf (accessed on 19 September 2019).
  50. MGAP. Unidades de suelos CONEAT; MGAP: Montevideo, Uruguay, 1994. [Google Scholar]
  51. Jenks, G.F. The data model concept in statistical mapping. Int. Yearb. Cart. 1967, 7, 186–190. [Google Scholar]
  52. DIEA. Censo General Agropecuario; MGAP: Montevideo, Uruguay, 2000. [Google Scholar]
  53. Saaty, T. The Analytic Hierarchy Process; McGraw-Hill: New York, NY, USA, 1980; ISBN 0070543712. [Google Scholar]
  54. Díaz, I.; Ceroni, A.; López, G.; Achkar, M. Análisis espacio-temporal de la intensificación agraria y su incidencia en la productividad primaria neta. Rev. Electrón. Medioambiente. UCM 2018, 19, 24–40. [Google Scholar]
  55. Jensen, J.R. Remote Sensing of the Environment: An Earth Resource Perspective, 2nd ed.; Pearson: Upper Saddle River, NJ, USA, 2007; ISBN 978-1-292-02170-6. [Google Scholar]
  56. Moran, P. Notes on Continuous Stochastic Phenomena. Biometrika 1950, 37, 17–23. [Google Scholar] [CrossRef]
  57. Getis, A.; Ord, J.K. The Analysis of Spatial Association. Geogr. Anal. 1992, 24, 189–206. [Google Scholar] [CrossRef]
  58. Clérici, C.; Baethgen, W.; García-Préchac, F.; Hill, M. Estimación del Impacto de la Soja sobre Erosión y C Orgánico en Suelos Agrícolas del Uruguay. XIX Congreso Argentino de la Ciencia del Suelo; Paraná, Brazil, 2004; pp. 17–22. Available online: http://www.inia.uy/Publicaciones/Documentos%20compartidos/112761070612115008.pdf (accessed on 6 September 2019).
  59. de Oliveira, T.E.; de Freitas, D.S.; Gianezini, M.; Ruviaro, C.F.; Zago, D.; Mércio, T.Z.; Dias, E.A.; Lampert, V.; Do, N.; Barcellos, J.O.J. Agricultural land use change in the Brazilian Pampa Biome: The reduction of natural grasslands. Land Use Policy 2017, 63, 394–400. [Google Scholar] [CrossRef]
  60. Arbeletche, P.; Ernst, O.; Hoffman, E. La agricultura en Uruguay y su Evolución. In Intensificación Agraria Oportunidades y Amenazas Para un País Productivo y Natural; UdelaR: Montevideo, Uruguay, 2011; pp. 13–28. [Google Scholar]
  61. Díaz, I.; Achkar, M. Soberanía alimentaria y dimensión espacial: La horticultura en Uruguay, un análisis multiescalar. Pampa Rev. Interuniv. Estud. Territ. 2009, 5, 177–196. [Google Scholar] [CrossRef]
  62. Tommasino, A. Análisis de la Inclusión de Soja en Sistemas de Producción Arroz-Pasturas: Un Enfoque Desde los Servicios Ecosistémicos; Universidad de la República: Montevideo, Uruguay, 2016. [Google Scholar]
  63. Deambrosi, E.; Zorrilla, G.; Lauz, L.; Blanco, P.; Terra, J. Rompiendo el Techo de Rendimiento del Cultivo de Arroz; INIA: Montevideo, Uruguay, 2019. [Google Scholar]
  64. Baethgen, W.; García-Préchac, F.; Clérici, C. Estimación de la Evolución del Contenido de carbono de los Suelos Agrícolas de Uruguay. Boletín IN 2000, 1–12. [Google Scholar]
  65. Siri, G.; Ernst, O. Manejo del suelo y rotación con pasturas: Efecto sobre la calidad del suelo, el rendimiento de los cultivos y el uso de insumos. Inf. Agronómicas Del Cono Sur 2010, 45, 22–26. [Google Scholar]
  66. Prados, M.; Camarillo, J.; García, F. Metodología para la identificación y el análisis de procesos de intensificación agraria mediante la utilización de sistemas de información geográfica e imágenes de satélite. Caso práctico en la cuenca del Guadiamar. In X Congreso de Métodos Cuantitativos, SIG y Teledetección; AGE: Valladolid, Spain, 2002. [Google Scholar]
  67. Perfecto, I.; Vandermeer, J. Separación o integración para la conservación de biodiversidad: La ideología detrás del debate land-sharing frente a land-sparing. Rev. Ecosistemas 2012, 21, 1–2. [Google Scholar]
  68. García Pascual, F. La agricultura latinoamericana en la era de la globalización y de las políticas neoliberales: Un primer balance. Rev. Geogr. 2013, 9–36. [Google Scholar]
  69. Vandermeer, J.; Van Noordwijk, M.; Anderson, J.; Ong, C.; Perfecto, I. Global change and multi-species agroecosystems: Concepts and issues. Agric. Ecosyst. Environ. 1998, 67, 1–22. [Google Scholar] [CrossRef]
  70. Fernandes, B.M. Os usos da terra no Brasil: Debates sobre políticas fundiarias. In Cultura Académica; UNESCO: San Pablo, CA, USA, 2014. [Google Scholar]
Figure 1. (a) South America: Pampa biome and Uruguay highlighted. (b) Study area: Uruguay, land use. Simplified map based on LANDSAT 8 OLI supervised classification, year 2017. The category Fruit and Vegetable Production was obtained from [29].
Sustainability 11 07011 g001
Figure 2. Spatial distribution of the land use intensity index in the years (a) 2000, (b) 2011, and (c) 2017. Four areas stand out: Northeast coast (I), southwest coast (II), south (III), and east (IV) with important changes in the land use intensity index (LUII).
Sustainability 11 07011 g002
Figure 3. Spatial distribution of the G* Z Score index, on the intensity of land use for the years (a) 2000, (b) 2011, and (c) 2017. Red gradient colors show positive G* Z Score values and groups of enumeration areas (EAs) with high land use intensity values, and blue gradient colors show decreasing negative G* Z Score values and groups of EAs with low land use intensity values.
Sustainability 11 07011 g003
Figure 4. Spatial distribution of the agricultural soil suitability index (SSIA).
Sustainability 11 07011 g004
Table 1. Temporal variation of LUII values for the years 2000, 2011, and 2017.
LUII-2000LUII-2011LUII-2017
Mean0.200.220.23
Median0.160.190.20
Min0.090.090.09
Max0.640.770.78
Deviation0.110.120.13
Table 2. Normalized Difference Vegetation Index (NDVI) average values per EA for the 2000–2017 period according to SSIA.
LowMediumHighVery High
N142165200130
Min0.500.510.440.40
Max0.760.770.740.73
Mean0.670.670.640.61
Median0.670.670.650.61
Table 3. Kendall tau correlation coefficient (τ) and significance level (p value) between NDVI values and time for each EA group (classified according LUII), per period.
2000–20102011–20172000–2017
τpτpτp
Strong−0.10<0.050.21<0.0010.15<0.001
Moderate-No sig.0.21<0.0010.21<0.001
Stable-No sig.0.24<0.0010.31<0.001

