Article

Eco-Speed Guidance for the Mixed Traffic of Electric Vehicles and Internal Combustion Engine Vehicles at an Isolated Signalized Intersection

1
School of Transportation and Logistics, Dalian University of Technology, Dalian 116024, China
2
JSTI Group, Smart City Institute, Nanjing 210017, China
3
China Academy of Transportation Sciences, No.240, Huixinli, Chaoyang District, Beijing 100029, China
4
Institute of Materials and Systems for Sustainability, Nagoya University, Nagoya 464-8603, Japan
*
Authors to whom correspondence should be addressed.
Sustainability 2019, 11(20), 5636; https://doi.org/10.3390/su11205636
Submission received: 17 August 2019 / Revised: 29 September 2019 / Accepted: 8 October 2019 / Published: 12 October 2019
(This article belongs to the Special Issue Sustainable and Intelligent Transportation Systems)

Abstract

:
Although electric vehicles (EVs) have been regarded as promising to reduce tailpipe emissions and energy consumption, a mixed traffic flow of EVs and internal combustion engine vehicles (ICEVs) makes the energy/emissions reduction objective more difficult because EVs and ICEVs have various general characteristics. This paper proposes a low-emission-oriented speed guidance model to address the energy/emission reduction issue under a mixed traffic flow at an isolated signalized intersection to achieve the objective of reducing emissions and total energy consumption while reducing vehicle delay and travel time. The total energy/emissions under different market penetration rates of EVs with various traffic volumes are analyzed and compared. Numerical examples demonstrate that the proposed speed guidance model has better performance than those without considering the impact of queues. For a certain traffic volume, the energy/emission reduction effects under speed guidance will increase with an increasing share of EVs. This paper also explores the impact of the time interval for guidance renewal on vehicle emissions in practice.

1. Introduction

Over the past decade, the transportation system has generated increased fuel usage and air emissions [1,2]. Electric vehicles (EVs) have been regarded as a potential solution to significantly reduce transport emissions, thus helping to reduce road traffic pollution, particularly in densely populated urban areas [3]. A demand forecast model was used to measure the effectiveness of energy consumption of EVs and results showed that with the use of electricity in the field of transport, a significant reduction in fuel consumption and emissions is achieved [4]. Canals et al. [5] stated that for most European countries, the increasing share of renewable energy sources in electricity generation will promote EV market penetration, and thus the transfer to EVs will reduce emissions. A case study of a taxi fleet was conducted to evaluate the effects of the replacement of ICEVs by EVs on carbon dioxide (CO2) emission and energy consumption, and the results showed that the energy efficiency of EVs is higher than that of ICEVs, especially considering the regeneration energy owing to road gradient [6]. However, issues remain regarding how to promote smart driving for mixed traffic flows of EVs and internal combustion engine vehicles (ICEVs), where the complicated influence factors and interactive effects of environments and driver habits on the EVs’ energy consumption should be well considered [7,8].
Due to the potential energy savings and environmental benefits of EVs, many governments have developed a series of policies to promote EV adoption. For example, California has adopted some possible solutions to promote EV adoption, such as reducing taxes, fees and other upfront costs for EV ownership. EVs’ market share in China has steadily grown in recent years thanks to the implementation of a series of measures to encourage the purchase and usage of EVs. EVs could reach significant market penetration in the future. Because of the different characteristics of EVs and ICEVs, mixed traffic flow makes the energy/emission reduction objective more difficult, especially at a signalized intersection, which has not received enough attention. Ou et al. [9] developed a two-lane car-following model for ICEVs under vehicle-to-vehicle communication to explore their movement separately in a two-lane traffic system. Tang et al. [10] proposed an EV-following model to examine the impacts of driving range on each vehicle’s speed and headway.
The demand for sustainable driving has inspired the solutions for energy-efficient transportation system. The stop-and-go pattern due to traffic jam or signalized intersections in urban areas result in higher emissions and energy consumption than vehicles travelling under free-flow conditions [11]. Therefore, the velocity profile for a travelling ICEV could be optimized to realize less fuel consumption and emissions for different patterns. With the continuous promotion of a cooperative vehicle infrastructure system, a speed guidance strategy can provide reasonable speed recommendations to drivers for going through an intersection smoothly, taking advantage of the vehicle’s spatial and temporal trajectories and corresponding signal timing parameters. Many studies have developed vehicle speed control or guidance strategies for ICEVs [12]. A traffic efficiency promotion algorithm for eco-speed guidance can reduce the delay when vehicles pass through a signalized intersection. A multi-vehicle guidance strategy was developed by Wu et al. [13] to minimize the number of stops and to reduce travel time when passing through signalized intersections. Ge and Orosz [14] proposed a novel connected cruise control strategy by using the acceleration signals perceived from vehicles ahead to increase roadway mobility. He et al. [15] proposed a low emission-oriented algorithm to optimize the dynamic speed once a queue occurs at signalized intersections. A trajectory-based model was proposed by using historical data in order to estimate fuel consumption and emissions for individual vehicles [16]. A car-following model considering speed guidance under different traffic conditions was proposed to analyze the effects of driving behaviors on vehicle emissions and to investigate the mechanism of speed guidance for both intelligent vehicles and traditional vehicles [17]. Sun et al. [18] developed a dynamic speed guidance strategy to minimize emissions by dividing the road into several small intervals for sliding control. It is believed that an eco-driving strategy can help realize more energy savings in a connected vehicle environment. Moreover, the optimization of energy-efficiency speed profile of an EV should consider its distinctive characteristics. Determining whether this method is suitable for EVs has gradually aroused scholars’ attention; after all, there are many different vehicle characteristics between EVs and ICEVs.
This study seeks to propose an effective eco-speed guidance strategy for a mixed traffic flow of battery EVs and ICEVs at an isolated signalized intersection. The next section provides insights into the causes of the problem, followed by an introduction to the eco-speed guidance strategy in Section 3. Section 4 demonstrates the effectiveness of the model through a numerical analysis. Conclusions are presented in the last section.

2. Problem Statement

In recent years, fossil fuel consumption and air pollution due to transportation have received widespread public concern [19,20,21]. Idling vehicles, frequent acceleration, and travelling in a stop-and-go pattern will emit more pollutant emissions [22]. EV adoption has a significant role in reducing both energy consumption and tailpipe emissions. On the other hand, a speed guidance strategy is considered another effective measure to reduce vehicle emissions. A mixed traffic flow of EVs and ICEVs makes the energy/emission reduction objective more difficult because EVs and ICEVs have various general characteristics.
EVs can be simply characterized as either distributed motor-driven or centralized motor-driven EVs. The powertrain structure of distributed motor-driven EVs is different from that of ICEVs. Vehicles travelling in cities are usually slow and require frequent parking. EVs do not consume electricity when they stop. During the braking process, the electric motor can be automatically converted into a generator to achieve energy reuse [23,24]. Compared with an ICEV, EVs generally improve energy efficiency, with better starting performance and much energy regeneration [25]. EVs not only have different structures but also realize better overall dynamics. For example, the torque response of a motor is much faster than that of an ICEV (usually 10 ~ 100 times) [26,27].
One of the key characteristics of EVs is the regenerative braking system, which effectively converts kinetic energy into electric energy during non-urgent braking procedures. Compared to the conventional technology of friction brake, the regenerative brake has absolutely different mechanism and a large gap in dynamic characteristics. The braking performance of regenerative brake, with relative longer transmission path, is significantly affected by both the traffic conditions and the operating conditions of EVs. There exist many challenges to improve vehicle dynamic performance and energy-saving performance [28].
EVs and ICEVs generally have various acceleration/deceleration behaviors, and consequently, a mixed traffic flow makes the energy/emission reduction objective more difficult. The different characteristics between these two types of vehicles must be considered when executing a speed guidance strategy. EVs are frequently marketed based on their high acceleration, which is determined by the difference in work performance between an electric motor and an internal combustion engine. Knowles, M. et al. [29] investigated how various driving styles influence energy consumption and regeneration through an experimental study. In addition, the specific aspects of driving style that affect energy consumption and regeneration were highlighted. However, there still exists one challenge in speed guidance [30]: how can both transport efficiency and energy efficiency be simultaneously improved for a mixed traffic flow of EVs and ICEVs?
Different types of vehicles have different amax values because of their different vehicle characteristics. According to M. Ehsani et al. [31], the maximum acceleration (amax, Unit: m/s2) values are 3.5 and 2.7 for EVs and ICEVs, respectively.
According to real-world energy consumption data collected in Beijing [32] and Nagoya [33], the energy consumption rate of EVs separately increases with acceleration and instantaneous speed. For ICEVs, a speed guidance strategy can provide reasonable speed recommendations to drivers for going through an intersection. Many studies [34,35,36,37,38,39] have developed vehicle speed control or guidance strategies for ICEVs. Tang et al. [40] proposed a speed guidance model to inspect the influences of drivers’ bounded rationality on energy consumption and emissions. Similarly, the speed profile of an EV can also be optimized by considering both the drivers’ bounded rationality and the distinctive EV performance. Galvin [41] developed algorithms and displayed energy demand and consumption versus acceleration and speed for eight different plug-in EVs. Wu et al. [42] proposed an analytical model that provides an optimized time-dependent speed profile for EVs to minimize energy consumption. Studies in Reference [43] provide a real-world scheme of an eco-approach and departure system for EVs, which combines vehicle connectivity, vehicle automation and vehicle electrification. All these papers focus on only one type of vehicle and ignore mixed flow of two types of vehicles. These speed guidance strategies will lead to a suboptimal solution rather than an optimal solution. The recent innovations in speed advisory for mixed traffic focus mainly on the connected vehicle platoon [44,45], which may be a possible solution but is beyond of the extension of the current research.
Under a series of incentives, the proportion of EVs is steadily growing, but for a long time there is bound to be a mixed flow of EVs and ICEVs. This research aims to address the energy/emission reduction issue under mixed traffic flow conditions by optimizing the EVs’ and ICEVs’ speed patterns with smoother deceleration and acceleration rates, particularly different speed advices are provided to EVs and ICEVs by considering their different characteristics. This study attempts to propose a low emission-oriented speed guidance model to address the energy/emission reduction issue under mixed traffic flow, which considers both vehicle queues and the different characteristics of EVs and ICEVs to optimize vehicle speed and to achieve the objective of reducing emissions and total energy consumption while reducing vehicle delay and travel time. In particular, different market penetration rates of EVs with various traffic volumes are analyzed and compared in this study.

3. Eco-Speed Guidance Model

As previously described, a stop-and-go pattern due to traffic jam at a signalized intersection will results in higher emissions, while idling events at signalized intersection are induced not only by the Signal Phase and Timing (SPaT) information but also by the status of vehicle queues [46]. The existence of intersection queues has great effects on the selection of optimal speed strategy, especially at high traffic volume. This paper attempts to propose a low emission speed guidance model to reduce both ICEV emissions and EV energy consumption. The real-time traffic conditions, SPaT information, as well as intersection queue lengths, should be considered together in the proposed model.
The driving behaviour model used is the Wiedemann car following model, assuming that { K ( x , t ) , v ( x , t ) , q ( x , t ) } represents the traffic density, travel speed and traffic flow, respectively, at location x and time t, respectively. The model assumes that the relationship between density and flow is:
q ( x , t ) = Q · K ( x , t )
Figure 1 shows a general transport fundamental diagram, where the traffic flow is a concave function of the delay. Assume that the flow is q0 when a vehicle arrives at the intersection, if the traffic signal light is green, the vehicle can pass through the intersection without any delay; once the traffic light turns red, all the flowing vehicles must wait at the stop bar for the next green phase; and vehicle queues are generated and propagate backward, within the static queue the traffic flow is at the maximum road density of Kj,. When the traffic light turns green again, queuing vehicles starts to dissipate the intersection at the saturation flow rate, qc. The speed of the vehicle dissipation speed is computed as follows:
v r = q c K j K c
Figure 2 shows the movement trajectories of a group of vehicles approaching and passing through a single intersection. The horizontal axis represents the operation time, the thick solid line represents the red phase, and the fine line represents the green phase. The vertical coordinate represents the distance of a vehicle to the intersection stop bar. Once entering the speed guidance segment, the vehicle will receive speed advice, where the solid line represents the speed guidance without considering the queue. The aim of the speed guidance strategy is to prevent vehicles from coming to a stop; however, the strategy sometimes cannot completely prevent vehicle stops. The speed guidance strategy proposed in this paper is an eco-speed guidance strategy that considers the vehicle queue. The dotted line represents a vehicle’s trajectory after accepting eco-speed guidance.
Once a driver receives speed guidance information, he or she may adjust his/her acceleration/deceleration to the target speed. The process of the adjustment will be determined by three parameters reflecting the driver’s bounded rationality, i.e., the response time, the threshold of acceptance, and the execution level [41]. The eco-speed guidance strategy can be formulated as follows:
d = v s 2 v 0 2 2 a + ( T v s v 0 a ) · v s
where d is the optimal distance to the stop bar at which the speed guidance is accepted and drivers adjust their driving behavior when there is no queue occurring at the stop line; v0 is the current speed; vs is the target speed; a is acceleration/deceleration and is set according to the suggested maximum values [31]; T is the travel time to approach the stop line or the tail of the queue.
{ T = t r t , a > 0 T = t g t + d l v r , a < 0
where t is the current time; l is the queue length; tg and tr are the times at which the traffic light turns to green or turns to red, respectively; and the target speed vs is defined here as follows [41]:
v s = { v 0 + a T a ( a T 2 + 2 v 0 T 2 d ) , a > 0 v 0 + a T + a ( a T 2 + 2 v 0 T 2 d ) , a < 0
s.t.
v m i n < v s < v m a x ,   0 < a < a m a x ,   | v s 2 v 0 2 | 2 a d

4. Numerical Tests

In this section, we choose an isolated signalized intersection in Dalian as a study site to examine the proposed eco-speed guidance model, as shown in Figure 3. This study focuses on exploring each vehicle’s energy consumption and emissions when the vehicle passes through a signalized intersection under different traffic volume scenarios. We analyze the effect of queues for the speed guidance strategy and investigate the impacts of different market penetration rates of EVs on the eco-speed control strategy. This paper also explores the impact of the guidance time interval on vehicle emissions to obtain results with practical guidance.
In the following numerical tests, we select PM2.5, NOx, CO, CO2 for ICEVs and total energy consumption (TEC) of both EVs and ICEVs as the analysis indices. Different driving behaviors have different effects on each type of emission, i.e., the amount of NOx increases with increasing vehicle velocity when the speed is less than 65 km/h. By contrast, a lower the speed results in a higher CO emission rate, while the CO emission rate decreases with increasing vehicle speed. Similarly, an idle ICEV will produce more CO2.
The EV energy consumption estimation model proposed by Wu et al. [3] is used in this paper and listed as follows.
P ( v , a ) = r R 2 K 2 ( m a + K v 2 + f r l m g + m g s i n θ ) 2 + v ( k v 2 + f r l m g + m g s i n θ ) + m a v
where
  • P is the power losses;
  • r is the resistance of the conductor in a motor;
  • K = KaΦd, where Ka is the armature constant and Φd is the magnetic flux;
  • R is the radius of the tire;
  • k = (ρ/2)CDAf; where ρ is air density, CD is coefficient of drag and Af is frontal area of the vehicle;
  • frl is rolling resistance constant;
  • g is gravity acceleration;
  • θ is the roadway grade.
This model analyses the effects of speed, acceleration and road gradient on the instantaneous power of EVs and the electric consumption, together with the electric regeneration during braking. The parameters in Wu et al. [3] are employed in this study. All other emissions are estimated by Multi-scale mOtor Vehicle and equipment Emission System (MOVES) model [47], a new generation regulatory emission model that was developed by U.S. Environmental Protection Agency [48]. In this paper, quantitative analysis is made on different energy consumption and emission models of EVs and traditional ICEVs.

4.1. Energy Efficiency of Considering Vehicle Queues

Preventing vehicles from coming to a complete stop before entering the intersection can reduce energy consumption and emissions. However, without considering the queue impact, the strategy cannot completely avoid vehicle stops. In the following scenarios, a market penetration rate (MPR) of EVs is chosen as 50% in order to reduce the possible reciprocal effect due to imbalance MPR.
Before examining the energy reduction effects, we define an index to quantify the impact, i.e.
δ i = E i o E i Q E i Q
where i is the type of vehicle’s emissions or energy consumption; E i Q is the vehicle’s total energy consumption or emissions under the eco-speed guidance strategy; E i 0 is the vehicle’s total energy consumption or emissions under the eco-speed guidance strategy without considering the queue; and δ i is the reduction rate.
The numerical results for through lane and left-turn lane are shown in Figure 4 and Figure 5, separately. The results are listed as follows:
(1)
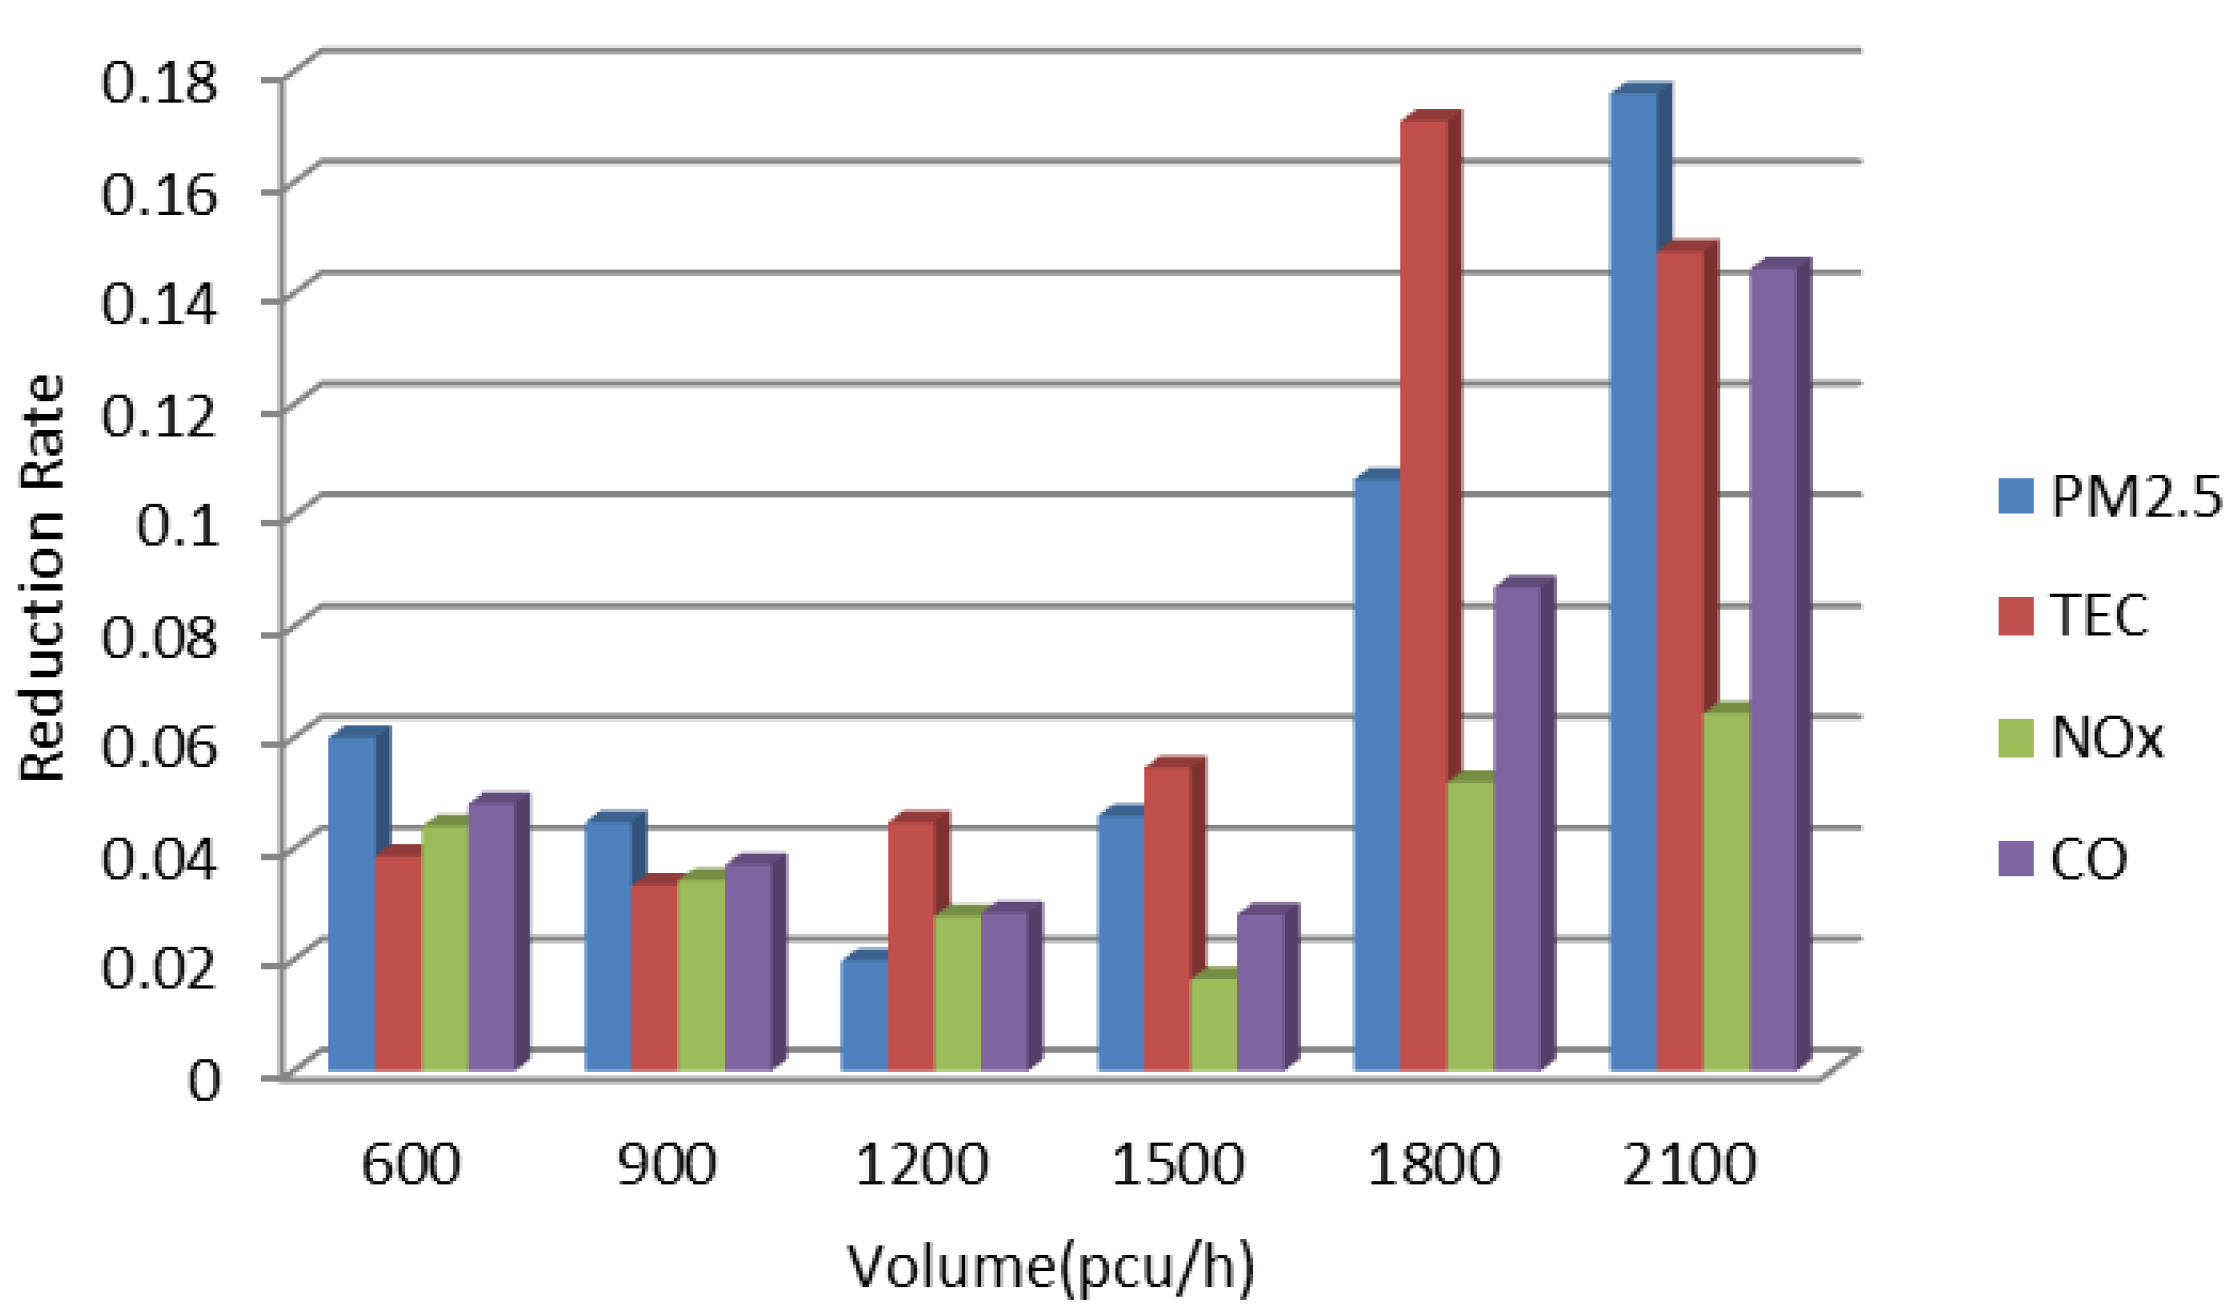
Considering the effects of vehicle queues can optimize vehicle trajectories to reduce emissions and energy consumption for both EVs and ICEVs.
(2)
When the traffic volume was relatively low (e.g., 600 pcu/h and 900 pcu/h), the effect of the queue was relatively low. Because of the low volume, the traffic conditions were free flow, and vehicle operation is basically unaffected by other vehicles. Additionally, the queue lengths are short. When the traffic light turns green, the queue will dissipate quickly, and stopped vehicles will not affect the following vehicles, especially EVs with high acceleration rates that can quickly reach the desired speed.
(3)
In the medium-volume (e.g., 1200 pcu/h and 1500 pcu/h) scenarios, optimized effects are more obvious. The traffic flow is in the middle of the steady flow range, and there is a certain effect between vehicles. When the queue lengths are longer, there will be some vehicles that still have to wait while stopped after taking the strategy, and the eco-speed guidance strategy will provide low-speed advice to make vehicles pass through the intersection without stops.
(4)
In the high-volume (e.g., 1800 pcu/h and 2100 pcu/h) scenarios, the optimization effect is most obvious. At this point, traffic stability is poor, vehicles will usually be affected by the vehicles in front, and there is often a longer queue length at the signalized intersection. Most vehicles must slow down or stop while waiting to pass through the intersection. The eco-speed guidance strategy has a significant impact on reducing the lengths of stops, so it has an obvious optimization effect on emissions and total energy consumption.
(5)
The straight lane has better optimization effects than the left-turn lane because of the influence of the signal, and the turn-left lane has a long red phase duration. After optimization, more vehicles can pass through the intersection by deceleration rather than stopping.

4.2. Sensitivity of Energy Efficiency to Various MPR of EVs

This section discusses the simulation results with various MPR situation of EVs (ranging from 10% to 90%), where ten simulations were conducted for each MPR situation in each volume scenario, the average emission and TEC from each of the ten simulations are calculated and provide a sensitivity analysis. It should be noted that only a straight lane is selected as the study site to examine the effect of reduction rates under different MPRs of EVs in three volume scenarios.
The numerical results for three various traffic volume conditions are shown in Figure 6, Figure 7 and Figure 8. The results are listed as follows:
(1)
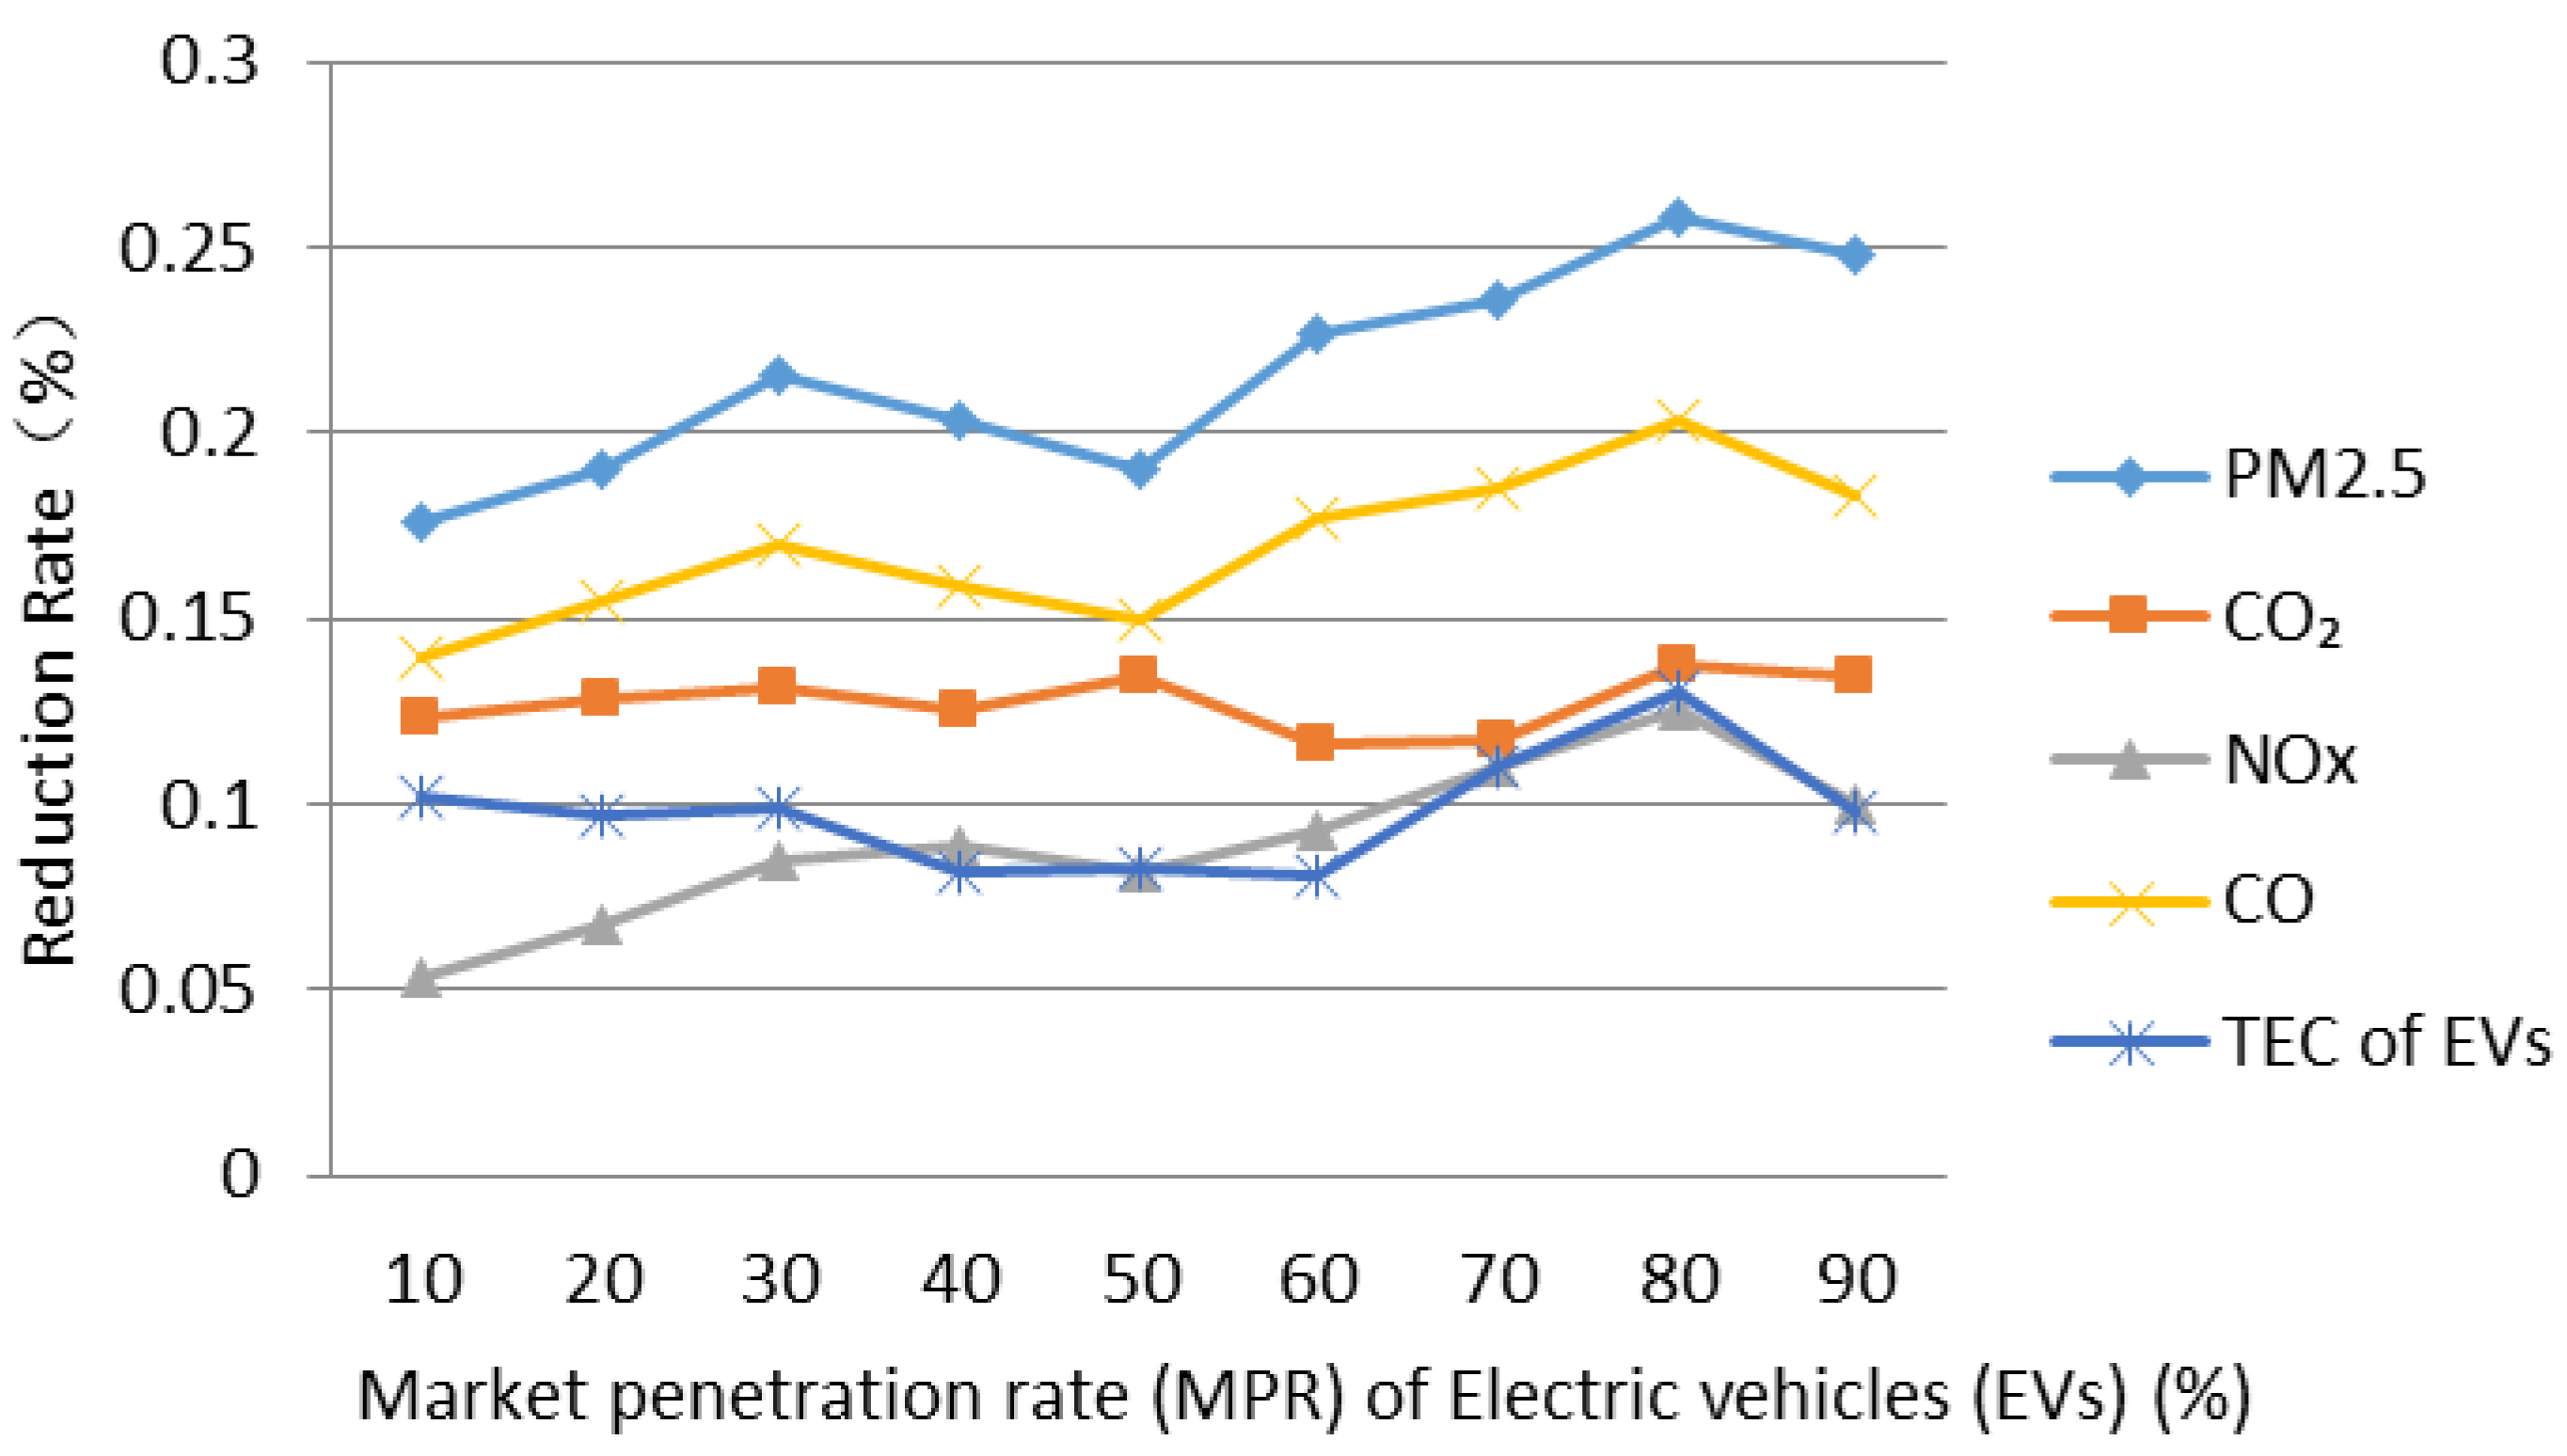
This model has a good impact on vehicle energy consumption and emissions under three different volume scenarios for both gasoline vehicles and EVs. This guidance strategy can lead to fewer stops and optimize the vehicle’s trajectory.
(2)
For the low-volume scenario, this model has a great influence on reducing NOx and CO2 and a positive effect on other emissions and energy consumption of EVs; however, the model has only a small impact on PM2.5 because in low-volume traffic conditions, most cars may pass through an intersection with an acceleration or constant speed pattern. When the share of EVs reaches 50% to 60%, the strategy can achieve a better guidance effect.
(3)
For medium volume, more vehicles after guidance will adopt a deceleration pattern, and the reduction effect of optimization on PM2.5 becomes significant. When the share of EVs reaches 80%, a better guidance effect will occur.
(4)
For high volume, this model still has a good impact on PM2.5, but for others, especially the energy consumption of EVs, the strategy has a limited influence because EV braking or deceleration will recover some energy. With increasing MPR of EVs, the guidance effects increase.
(5)
Compared to the scenario of lower traffic volume, the MPR of EVs have much more influence on the emission reduction rate under the high traffic volume scenario. The reduction rates for all three traffic volume scenarios are not monotone increasing, which prove the complexity in the stability and broad applicability of speed guidance strategy and thus future studies are required.

4.3. Sensitivity of Energy Efficiency to Time Interval

In the implementation of the speed guidance strategy, although second-by-second guidance can make the vehicle pass through the intersection more smoothly, considering the rationality of the driver, the release of speed guidance information should consider timing. Reducing the frequency at which drivers receive information can help to reduce the impact of speed guidance strategies on driving safety, and this approach can also make the simulation study closer to actual conditions.
Table 1, Table 2 and Table 3 show the emissions and energy consumption results obtained with different guidance time intervals. The results are listed as follows:
(1)
As the guidance time interval increases, the emissions show a trend of decreasing first and then increasing or growing rapidly after gradual growth.
(2)
Under a low flow rate, as the guidance time interval increases, the emissions will change gently first, followed by rapid growth. The best guidance intervals are 5~7 s because when the volume is low, the number of vehicles ahead is short, the queues at the intersection are short, and the expected speed under the fuzzy guidance strategy does not change frequently.
(3)
At medium or high flow rates, as the guidance time interval increases, the emissions decrease first and then increase. The best guidance time interval is usually no longer than 5 s because when the volume is large, there are more vehicles ahead, the acceleration behaviour of a vehicle is affected by the preceding vehicle, and the long queues at the intersection change at any time, so the expected speed given by the fuzzy guidance strategy will change at any time. Compared with the second-by-second guidance, the expected changes in speed for 3~5 s intervals are smaller.

5. Conclusions

In this paper, we propose an eco-speed guidance model that considers queue effects to address the energy/emission reduction issue, and this model considers the different characteristics of EVs and ICEVs. The methodology is applied to simulate 54 different scenarios, combining three different traffic volumes with nine different MPRs of EVs and two guidance strategies. Compared with previous studies, this work contributes to considering mixed traffic flow of EVs and ICEVs under a speed guidance strategy. Numerical examples demonstrate that the proposed eco-speed guidance model has better performance than that without considering the impact of the queue under certain MPRs of EVs, especially at high traffic volume. Compared to without using a guidance strategy, this model has a good impact on energy/emission reduction under different scenarios. When the MPR of EVs reaches 50%, a better guidance result will be obtained. When the total traffic volume is relatively high, the energy/emissions reduction effects under eco-speed guidance increase with an increasing share of EVs. It seems that setting 5 s as the guidance renewal time interval is more appropriate in the sample. Therefore, it would be interesting for future research directions to expand the model under higher traffic volumes and to further improve energy efficiency by providing different guidance strategies for EVs and ICEVs separately.

Author Contributions

Conceptualization, K.L. and T.Y.; Data curation, D.L.; Formal analysis, D.L. and C.L.; Investigation, K.L.; Methodology, K.L. and D.L.; Software, D.L.; Supervision, K.L., C.L. and T.Y.; Validation, K.L. and D.L.; Visualization, T.Y.; Writing–original draft, D.L.; Writing–review & editing, K.L., C.L. and T.Y.

Funding

This research was funded by National Natural Science Foundation of China (Grant Nos. 51378091 and 71871043), National Natural Science Foundation of Liaoning Province, China (Grant No. 20170540187), and the open project of the Key Laboratory of Advanced Urban Public Transportation Science, Ministry of Transport, PRC.

Acknowledgments

This work was carried out by the joint research program of the Institute of Materials and Systems for Sustainability, Nagoya University.

Conflicts of Interest

The authors declare no conflicts of interest. The funders had no role in the design of the study; in the collection, analyses, or interpretation of data; in the writing of the manuscript, or in the decision to publish the results.

References

  1. Qian, J.; Eglese, R. Fuel emissions optimization in vehicle routing problems with time-varying speeds. Eur. J. Oper. Res. 2016, 248, 840–848. [Google Scholar] [CrossRef]
  2. Kermani, S.; Delprat, S.; Trigui, R.; Guerra, T.M. Predictive energy management of hybrid vehicle. Control Eng. Pract. 2016, 20, 1–6. [Google Scholar]
  3. Wu, X.K.; Freese, D.; Cabrera, A.; Kitch, W.A. Electric vehicles’ energy consumption measurement and estimation. Transp. Res. Part D 2015, 34, 52–67. [Google Scholar] [CrossRef]
  4. Baran, R.; Legey, L. The introduction of electric vehicles in Brazil: Impacts on oil and electricity consumption. Technol. Forecast. Soc. Chang. 2013, 80, 907–917. [Google Scholar] [CrossRef]
  5. Canals, C.L.; Martinez-Laserna, E.; García, B.A. Sustainability analysis of the electric vehicle use in Europe for CO2 emissions reduction. J. Clean. Product. 2016, 127, 425–437. [Google Scholar] [CrossRef]
  6. Liu, K.; Yamamoto, T.; Morikawa, T. Impact of Road Gradient on Energy Consumption of Electric Vehicles. Transp. Res. Part D Transp. Environ. 2017, 54, 74–81. [Google Scholar] [CrossRef]
  7. Liu, K.; Wang, J.B.; Yamamoto, T.; Morikawa, T. Modelling the multilevel structure and mixed effects of the factors influencing the energy consumption of electric vehicles. Appl. Energy 2016, 183, 1351–1360. [Google Scholar] [CrossRef]
  8. Liu, K.; Wang, J.B.; Yamamoto, T.; Morikawa, T. Exploring the interactive effects of ambient temperature and vehicle auxiliary loads on electric vehicle energy consumption. Appl. Energy 2018, 227, 324–331. [Google Scholar] [CrossRef]
  9. Ou, H.; Tang, T.Q. An extended two-lane car-following model accounting for inter-vehicle communication. Phys. A Stat. Mech. Appl. 2018, 495, 260–268. [Google Scholar] [CrossRef]
  10. Tang, T.Q.; Chen, L.; Yang, S.C.; Shang, H.Y. An extended car-following model with consideration of the electric vehicle’s driving range. Phys. A Stat. Mech. Appl. 2015, 430, 148–155. [Google Scholar] [CrossRef]
  11. Barth, M.; Member, S.; Mandava1, S.; Boriboonsomsin, K.; Xia, H. Dynamic ECO-driving for arterial corridors. In Proceedings of the 2011 IEEE Forum on Integrated and Sustainable Transportation Systems, Vienna, Austria, 29 June–1 July 2011; 2011; pp. 182–188. [Google Scholar] [CrossRef]
  12. Tang, T.Q.; Luo, X.F.; Liu, K. Impacts of the driver’s bounded rationality on the traffic running cost under the car-following model. Phys. A Stat. Mech. Appl. 2016, 457, 316–321. [Google Scholar] [CrossRef]
  13. Wu, W.; Li, P.K.; Zhang, Y. Modelling and Simulation of Vehicle Speed Guidance in Connected Vehicle. Environ. Int. J. Simul. Modell. 2015, 14, 145–157. [Google Scholar] [CrossRef]
  14. Ge, J.I.; Orosz, G. Dynamics of connected vehicle systems with delayed acceleration feedback. Transp. Res. Part C 2014, 46, 46–64. [Google Scholar] [CrossRef]
  15. He, X.; Liu, H.X.; Liu, X. Optimal vehicle speed trajectory on a signalized arterial with consideration of queue. Transp. Res. Part C 2015, 61, 106–120. [Google Scholar] [CrossRef]
  16. Sun, Z.; Hao, P.; Ban, X.J.; Yang, D. Trajectory-based vehicle energy/emissions estimation for signalized arterials using mobile sensing data. Transp. Res. Part D 2015, 34, 27–40. [Google Scholar] [CrossRef]
  17. Zhao, J.; Li, P. An extended car-following model with consideration of speed guidance at intersections. Phys. A Stat. Mech. Appl. 2016, 461, 1–8. [Google Scholar] [CrossRef]
  18. Sun, J.; Niu, D.; Chen, S.; Li, K. Development and Investigation of a Dynamic Eco-Driving Speed Guidance Strategy for Signalized Highway Traffic. In Proceedings of the Transportation Research Board 92nd Annual Meeting, Washington, DC, USA, 13–17 January 2013. [Google Scholar]
  19. Pandian, S.; Gokhale, S.; Ghoshal, A.K. Evaluating effects of traffic and vehicle characteristics on vehicular emissions near traffic intersections. Transp. Res. Part D 2009, 14, 180–196. [Google Scholar] [CrossRef]
  20. Luo, X.; Dong, L.; Dou, Y.; Li, Y.; Liu, K.; Ren, J.Z.; Liang, H.W.; Mai, X.M. Factor Decomposition Analysis and Causal Mechanism Investigation on Urban Transport CO2 Emission: Comparative Study on Shanghai and Tokyo. Energy Policy 2017, 107, 658–668. [Google Scholar] [CrossRef]
  21. Li, D.; Li, C.; Miwa, T.; Morikawa, T. An Exploration of Factors Affecting Drivers’ Daily Fuel Consumption Efficiencies Considering Multi-Level Random Effects. Sustainability 2019, 11, 393. [Google Scholar]
  22. Tang, T.Q.; Yi, Z.Y.; Zhang, J.; Wang, T.; Leng, J.Q. A speed guidance strategy for multiple signalized intersections based on car-following model. Phys. A Stat. Mech. Appl. 2018, 496, 399–409. [Google Scholar] [CrossRef]
  23. Ma, J.; Cheng, L.; Li, D.; Tu, Q. Stochastic Electric Vehicle Network Considering Environmental Costs. Sustainability 2018, 10, 2888. [Google Scholar] [CrossRef]
  24. Wang, R.; Chen, Y.; Feng, D. Development and performance characterization of an electric ground vehicle with independently actuated in-wheel motors. J. Power Sources 2011, 196, 3962–3971. [Google Scholar] [CrossRef]
  25. Zhu, X.; Meng, F. Transmission Design and Control of EVs. Modeling Dynamics & Control of Electrified Vehicles. In Modeling Dynamics & Control of Electrified Vehicles; Zhang, H., Cao, D., Du, H., Eds.; Woodhead Publishing: New Delhi, India, 2018; Chapter 7; pp. 245–274. [Google Scholar]
  26. Wang, Y.; Fujimoto, H. Dynamics Control for EVs. In Modeling Dynamics & Control of Electrified Vehicles; Zhang, H., Cao, D., Du, H., Eds.; Woodhead Publishing: New Delhi, India, 2018; Chapter 9; pp. 309–337. [Google Scholar]
  27. Wu, W.; Ma, W.; Long, K.; Zhou, H.; Zhang, Y. Designing Sustainable Public Transportation: Integrated Optimization of Bus Speed and Holding Time in a Connected Vehicle Environment. Sustainability 2016, 8, 1170. [Google Scholar] [CrossRef]
  28. Lv, C.; Wang, H.; Cao, D. Brake-Blending Control of EVs, In Modeling Dynamics & Control of Electrified Vehicles; Zhang, H., Cao, D., Du, H., Eds.; Woodhead Publishing: New Delhi, India, 2018; Chapter 8; pp. 275–308. [Google Scholar]
  29. Knowles, M.; Scott, H.; Baglee, D. The effect of driving style on electric vehicle performance, economy and perception. Int. J. Electr. Hybrid Veh. 2012, 4, 228–247. [Google Scholar] [CrossRef]
  30. Liu, K.; Jia, J.; Zuo, Z.; Ando, R. Heterogeneity in the effectiveness of cooperative crossing collision prevention systems. Transp. Res. Part C 2018, 87, 1–10. [Google Scholar] [CrossRef]
  31. Ehsani, M.; Gao, Y.; Longo, S.; Ebrahimi, K. Modern Electric, Hybrid Electric, and Fuel Cell Vehicles, 3rd ed.; CRC Press: Boca Raton, FL, USA, 2018. [Google Scholar]
  32. Zhang, R.; Yao, E. Electric vehicles’ energy consumption estimation with real driving condition data. Transp. Res. Part D 2015, 41, 177–187. [Google Scholar] [CrossRef]
  33. Wang, J.B.; Liu, K.; Yamamoto, T. Improving Electricity Consumption Estimation for Electric Vehicles Based on Sparse GPS Observations. Energies 2017, 10, 129. [Google Scholar] [CrossRef]
  34. Ala, M.V.; Yang, H.; Rakha, H. Modeling Evaluation of Eco-Cooperative Adaptive Cruise Control in the Vicinity of Signalized Intersection. Transp. Res. Rec. 2016, 2559, 108–119. [Google Scholar] [CrossRef]
  35. Castro, A.G.; Monzon, A.C.; Valdes, M.R. Modeling different penetration rates of eco-driving in urban areas: Impacts on traffic flow and emissions. Int. J. Sustain. Transp. 2017, 11, 282–294. [Google Scholar] [CrossRef]
  36. Kamalanathsharma, R.K.; Rakha, H. Agent-Based Simulation of Eco-Speed Controlled Vehicles at Signalized Intersections. Transp. Res. Rec. 2014, 2427, 1–12. [Google Scholar] [CrossRef]
  37. Yao, H.D.; Cui, J.X.; Li, X.P.; Wang, Y.; An, S. A trajectory smoothing method at signalized intersection based on individualized variable speed limits with location optimization. Transp. Res. Part D 2018, 62, 456–473. [Google Scholar] [CrossRef]
  38. Sun, Y.; Ge, H.X.; Cheng, R.J. An extended car-following model under V2V communication environment and its delayed-feedback control. Phys. A Stat. Mech. Appl. 2018, 508, 349–358. [Google Scholar] [CrossRef]
  39. Mensing, F.; Bideaux, E.; Trigui, R.; Ribet, J.; Jeanneret, B. Eco-driving: An economic or ecologic driving style? Transp. Res. Part C 2014, 38, 110–121. [Google Scholar] [CrossRef]
  40. Tang, T.Q.; Zhang, J.; Liu, K. A speed guidance model accounting for the driver’s bounded rationality at a signalized intersection. Phys. A Stat. Mech. Appl. 2017, 473, 45–52. [Google Scholar] [CrossRef]
  41. Galvin, R. Energy consumption effects of speed and acceleration in electric vehicles: Laboratory case studies and implications for drivers and policymakers. Transp. Res. Part D 2017, 53, 234–248. [Google Scholar] [CrossRef]
  42. Wu, X.K.; He, X.Z.; Yu, G.Z.; Harmandayan, Y.A.; Wang, P. Energy-Optimal Speed Control for Electric Vehicles on Signalized Arterials. IEEE Trans. Intel. Transp. Syst. 2015, 16, 2786–2796. [Google Scholar]
  43. Qi, X.W.; Barth, M.J.; Wu, G.Y.; Boriboonsomsin, K.; Wang, P. Energy Impact of Connected Eco-driving on Electric Vehicles. Road Veh. Autom. 2018, 4, 97–111. [Google Scholar]
  44. He, X.Z.; Wu, X.K. Eco-driving advisory strategies for a platoon of mixed gasoline and electric vehicles in a connected vehicle system. Transp. Res. Part D 2018, 63, 907–922. [Google Scholar] [CrossRef]
  45. Yu, S.W.; Fu, R.; Guo, Y.S.; Xin, Q.; Shi, Z.K. Consensus and optimal speed advisory model for mixed traffic at an isolated signalized intersection. Phys. A Stat. Mech. Appl. 2019, 531, 121789. [Google Scholar] [CrossRef]
  46. Xin, Q.; Fu, R.; Yuan, W.; Liu, Q.L.; Yu, S.W. Predictive intelligent driver model for eco-driving using upcoming traffic signal information. Phys. A Stat. Mech. Appl. 2018, 508, 806–823. [Google Scholar] [CrossRef]
  47. Wu, Y.Z.; Song, G.H.; Yu, L. Sensitive analysis of emission rates in MOVES for developing site-specific emission database. Transp. Res. Part D 2014, 32, 193–206. [Google Scholar] [CrossRef]
  48. Koupal, J.; Cumberworth, M.; Michaels, H.; Beardsley, M.; Brzezinski, D. Design and Implementation of MOVES: EPA’s New Generation Mobile Source Emission Model. Ann Arbor 2003, 1001, 105. [Google Scholar]
Figure 1. Fundamental Diagram.
Sustainability 11 05636 g001
Figure 2. Vehicle Trajectories.
Sustainability 11 05636 g002
Figure 3. Lane Function of Study Site.
Sustainability 11 05636 g003
Figure 4. Emissions/Total energy consumption (TEC) on Through Lane.
Sustainability 11 05636 g004
Figure 5. Emissions/Total energy consumption (TEC) on Left-Turn Lane.
Sustainability 11 05636 g005
Figure 6. Low Traffic Volume.
Sustainability 11 05636 g006
Figure 7. Medium Traffic Volume.
Sustainability 11 05636 g007
Figure 8. High Traffic Volume.
Sustainability 11 05636 g008
Table 1. Emissions at Low Volume.
1 s2 s3 s4 s5 s6 s7 s8 s
Straight lanePM2.5 (g)0.09320.09320.09300.09270.09280.09320.09350.0940
TEC (kJ)87,573.4387,513.887,524.4987,405.6487,047.1487,181.4787,393.6789,662.52
CO2 (g)5742.035836.766002.626138.636183.916310.226359.216515.61
NOx (g)4.57694.524.50084.51484.51034.50164.50214.6069
CO (g)51.529251.64551.833152.096852.056152.345652.394952.8811
Left-turn
lane
PM2.5 (g)0.02130.02120.02120.02090.02210.02240.02270.0233
TEC (kJ)19,854.2819,886.6319,820.0619,898.4119,916.0319,909.520,183.9720,276.78
CO2 (g)1316.901357.841402.851413.121439.921470.141508.951536.70
NOx (g)0.98011.02071.04331.06121.09531.10021.12601.1648
CO (g)11.832511.688011.985011.970412.097011.885312.765013.0979
Table 2. Emissions at Medium Volume.
1 s2 s3 s4 s5 s6 s7 s8 s
Straight lanePM2.5 (g)0.25500.27240.29270.29600.29920.28390.27450.2618
TEC (kJ)189,910.2187,453189,235190,280.7195,696195,524.5196,590.2196,087.2
CO2 (g)13,145.1313,259.6613,815.7413,962.3114,998.2914,257.2414,128.314,413.53
NOx (g)10.420611.372511.80611.813113.074912.323912.361212.3819
CO (g)120.0596131.4939134.7215136.4452151.4867147.2736147.5452147.9185
Left-turn
lane
PM2.5 (g)0.05370.05500.05420.05510.05560.05540.05540.0553
TEC (kJ)47,621.9247,622.447,434.4747,869.0348,595.7648,953.949,924.7250,879.12
CO2 (g)3321.813522.143448.373476.123521.163661.883659.793656.51
NOx (g)3.28213.28793.24933.21253.22963.29283.28783.2825
CO (g)29.627929.727729.544729.207029.485730.005530.365230.3283
Table 3. Emissions at High Volume.
1 s2 s3 s4 s5 s6 s7 s8 s
Straight lanePM2.5 (g)0.41640.43210.39420.40010.39080.38250.37400.3686
TEC (kJ)461,336.3470,190.1459,433454,654.8466,362.6479,816.8519,229.8514,366
CO2 (g)33,154.735,228.3330,143.2530,518.5629,491.429,368.4627,724.6827,623.10
NOx (g)21.319721.301721.367321.421421.455721.504421.628921.6352
CO (g)241.7943240.5921235.9937238.6056239.0073239.1202240.59241.3298
Left-turn
lane
PM2.5 (g)0.11970.12010.11430.11960.12350.10920.11040.1138
TEC (kJ)161,633.5154,825145,921.2151,356.6163,552.4161,866.7164,260.3178,955.4
CO2 (g)11,616.0511,126.7410,268.1710,877.4811,753.989879.810,066.9110,704.94
NOx (g)5.82895.61365.41225.60015.75875.35035.39915.5731
CO (g)77.597474.451969.651873.241577.950277.599678.666077.3319

