Exploring and Visualizing the Patent Collaboration Network: A Case Study of Smart Grid Field in China


1
School of Economics and Management, Harbin Engineering University, Harbin 150001, China
2
Management School, Queen’s University Belfast, Belfast BT9 5EE, UK
3
Shenzhen Institute of Advanced Technology, Chinese Academy of Sciences, Shenzhen 518055, China
4
School of Management, Harbin University of Science and Technology, Harbin 150080, China
*
Author to whom correspondence should be addressed.
Sustainability 2019, 11(2), 465; https://doi.org/10.3390/su11020465
Submission received: 18 December 2018
/
Revised: 4 January 2019
/
Accepted: 14 January 2019
/
Published: 17 January 2019
(This article belongs to the Section Economic and Business Aspects of Sustainability)
Abstract
:Smart grids (SGs) have been widely recognized as an enabling technology for delivering sustainable energy transitions. SGs have a positive effect on the development of the world economy and society. SG construction plays an important role in responding to global climate change and promoting the sustainable development of the world economy and society. Under such a background, this paper attempts to investigate patent collaborations of the SG field in China. Based on the application data of collaborative patents from State Intellectual Property Office (SIPO) in China, this study employs complex network theory and social network analysis (SNA) method and conducts in-depth research on the patent collaboration network of SG field in China. The trend of patent collaboration was examined, the collaboration network of SG-related patents was investigated, the network characteristics, and the network structure were also explored. The results show that the proportion of enterprises participating in patent collaboration is relatively large for SG field in China, the percentage of collaboration relationships formed by different patent applicants varies greatly, and that the State Grid Corporation of China (SGCC) plays an important role in patent collaboration in SG field currently. It can also be found that patent collaboration is an effective form of cooperative innovation among different entities. Finally, three suggestions are provided in response to the existing problems.
1. Introduction
With the rapid development of the global economy, the pressures on resources, environment, and the ecological environment are increasing. As the most common form of energy in the world, electric power is driven by the awareness of green energy conservation, and the smart grid, the modern formulation of electric power system, has become a key area of development all over the world [1,2]. The major countries have set up ambitious goals relating to constructing an economical, efficient, safe, and reliable green power grid [3]. Hence, a hatching thought about the grid is needed and a SG conception is on the way [4,5,6].
SG technology is an emerging field in next-generation energy delivery and measurement [7,8,9]. In 2006, the green paper “A European Strategy for Sustainable, Competitive and Secure Energy” issued by the European council emphasized that smart grid technology is a key technology and development direction to ensure the power quality of the European grid [10]. In 2008, the U.S. Department of Energy indicated that a smart grid uses digital technology to improve reliability, security, and efficiency of the electric system [11]. In 2009, the State Grid Corporation of China (SGCC) announced a three-stage SG plan (2009–2020) for the construction of a “strong smart grid” [12]. Subsequently, in the “Twelfth Five-Year Plan” and “Thirteenth Five-Year Plan”, the National Development and Reform Commission announced the “Guidance catalogue of key products and services for strategic emerging industries”, in which SGs are listed as a key development area in the new energy industry [13]. In the “Made in China 2025” strategic plan, SG construction is once again being emphasized, and SGs are being developed as a key target. On the other hand, China’s SG industry exports have shown rapid growth trend in the markets of developed countries, and the export competitiveness of the SG industry has gradually increased. Therefore, the construction of SGs is a guarantee to promote the development of China’s “One Belt and One Road” strategy. It can be seen that developing SGs is of certain importance and inevitability, and it is of strategic significance for promoting social and economic development.
The vigorous development of SGs can reasonably regulate the distribution of electricity, improve the efficiency of energy use, optimize the energy structure, promote energy conservation and emission reduction, effectively respond to the challenges from the transformation of energy strategies, and boost the building of a resource-conserving and environment-friendly society in China [14,15,16]. The role, at the same time, is of great significance to global energy structure adjustment and sustainable development. Given this situation, it is an emerging task to detect the development trend of SG industry. However, few studies focus on SGs industry’s technological innovation and patent collaboration. This research attempts to investigate the patent collaboration network of SG field in China, analyze the trend of patent collaboration, explore the network characteristics and the network structure, and aims to discover the potential of the SGs industry’s technological innovation and patent-pool construction in China.
The remainder of the paper is organized as follows. Section 2 provides an overview of previous studies on smart grid, patent collaboration network, and social network analysis. Section 3 introduces the methodology and data. Section 4 presents the numerical results and discussions. Section 5 concludes with the major findings and their policy implications.
2. Literature Review
2.1. Smart Grid
SGs aim to deliver and monitor electricity consumption using multidirectional technologies that allocate and measure power flows dynamically to ensure efficiency, savings, and reliability [17]. Due to global warming and the high cost of traditional electricity production, it is necessary to improve energy production, transmission, and distribution management by building SGs with integrated systems [18,19]. SGs have the potential to support a broad range of advanced energy technologies on both the supply-side and demand-side of energy management [20,21,22]. SGs have been increasingly developed worldwide since the mid-2000s, most observably in the US, the UK, Italy, Japan, and South Korea [23,24]. Studies have pointed out that Europe and the U.S. lead the development of SGs systems, while Brazil and India strongly depend on foreign technology and investment for development in their countries [25,26]. Meanwhile, an increasing number of studies is paying attention to the development of China’s SG field [13,14,15,16].
Obviously, the SG industry has become the current research hotspot, and many scholars have carried out a large number of related researches. In this context, it is necessary to investigate the development trend and potential of SG technology.
2.2. Patent Collaboration Network
Technological innovation has extensively been studied to promote the sustainability and upgrading of industries [27,28,29]. The most important recent issue has been the dynamics of collaborative innovation among industries [30,31]. Moreover, a lot of countries are promoting industrial cluster policies that facilitate collaborative innovation among industries in specific regions, and emphasizing that the key is creating networks among industries [32,33,34,35]. Patent data is an open and available data source. In actuality, patent application information provides data concerning the inventors and assignees of technology collaborations and inventive processes [36]. Numerous studies evaluated patents with joint university–industry ownership, or collaborative patents, to measure the development trends of university–industry collaborative (UIC) technologies worldwide [37,38,39]. Evaluating collaborative patents facilitates researchers in gaining a better understanding of the expansion of knowledge [40] and the collaboration networks within innovation systems [41]. Plenty of studies employed a patent network analysis method to observe the distribution of UIC patents over time, thereby determining technology development trends [42,43,44,45]. In recent years, abundant studies have employed network analysis methods to investigate the patent collaboration and patent collaboration network in specific industries, especially in nano-related industries [46,47].
In summary, patent collaboration network is an important form of collaborative innovation, and cooperative innovation is becoming increasingly frequent. Many scholars have been concerned on related research from various perspectives, including collaboration types, collaboration characteristics, collaboration motivations, etc. However, there are few studies focusing on the patent collaboration network of the SG industry. In this paper, we attempt to explore the patent collaboration network for SG industry.
2.3. Social Network Analysis
Social network analysis (SNA) is an interdisciplinary academic method used in social psychology, sociology, statistics, and graph theory [48]. Regarding collaborative innovation research, SNA is a major method because of its interdisciplinary nature [49]. In recent years, developments of SNA brought up several software tools that facilitate visualization [50], analysis, and interpretation of collaborative creativity [51]; examining technological evolution [52]; explaining the relationship between technology fields (IPC classes); patent applicants; inventors; patent documents; etc. [53,54]. Moreover, SNA is extensively used in examining the trend of cross-border and international patent collaboration network [48,55,56], illustrating collaboration networks between inventors and applicants [57,58]. Also, there are many scholars employed SNA to analyze citation networks [59,60,61,62].
Therefore, it is obvious that SNA can help identify local and global patterns, locate influential entities, and examine network dynamics, and that such analysis can serve as a very feasible and effective method in investigating patent collaboration networks and citation networks.
Summarizing the above, in this paper we employ an SNA method to explore and investigate the patent collaboration network for China’s SGs.
3. Methodology and Data
3.1. Data Sources
The patent data used in this paper are derived from the patent retrieval and analysis system built by the State Intellectual Property Office of China (SIPO), the official department in charge of all the intellectual property of the country. The keywords search strategy is combined to adopt the method proposed by Alan L. Porter in 2008 [63], which extracts keywords from the literature, and seeks advice and suggestions from experts and scholars in SG field, then amends keywords and determines the search method, and continuously optimizes and adjusts this search method afterwards according to the test of the search results. In this study, first of all, an advanced search method is employed by combining inputting keywords and filtering by selection to obtain all patent data related to key technologies in SG field, totaling 9380 patents were registered. Then, the manual retrieval method was used to filter the patent data with collaborative characteristics in the SG field, and showed that a total number of 2955 collaborative patents were registered, a total of 2175 patent collaboration relationships were formed among different applicants, and a total of 7037 patent collaboration times were formed. Finally, Gephi software was adopted to visualize patent data and patent collaboration relationships.
3.2. Methodology
A social network is a social structure made up of a set of social actors (such as individuals or organizations), sets of dyadic ties, and other social interactions between actors. Most of the contemporary innovation activity involves the interaction of multitudinous innovation entities (individuals, firms, universities, research institutes, etc.) and hence the complexity of this social network has increased in an unprecedented way. The application of the social network analysis, which originates in anthropology and sociology, in the economic and management analysis is expected to give further input besides the other parametric techniques such as econometrics, statistics, and so on [64]. Social network analysis serves to identify local and global patterns, locate influential entities, and examine network dynamics. The value of social network analysis lies in its ability to map landscapes and illuminate linkages, interactions, and behavioral patterns [65,66]. It is an interdisciplinary academic method used in psychology, sociology, statistics [48], etc. So far, the method has been widely used in various perspectives of social sciences. This study employs social network analysis to construct a patent collaboration network for key technologies in SG field and analyzes the characteristics and structure of this network.
3.2.1. Network Density
Network density refers to the ratio of actual connections to all potential connections in a network. A higher network density indicates a higher interaction frequency between nodes in the network, a higher frequency and faster speed of knowledge information transmission. The formula for calculating network density D is shown as follows.
where M is the number of actual connections, n is the number of nodes, and is the potential connections in the network; the range of D is
3.2.2. Average Path Length
Average path length is the average value of the geodesic path length between any pair of nodes in the network. A longer average path length denotes a higher connectivity of the entire network. The formula for calculating average path length L is shown as follows.
where is the distance between node i and node j.
3.2.3. Average Clustering Coefficient
A node’s clustering coefficient is the ratio of the number of actual connections between the node’s neighbors, to the number of the maximum potential connections between those neighbors. The network’s clustering coefficient is the average of the clustering coefficients for all the nodes. The formula for calculating average clustering coefficient C is shown as follows.
where the clustering coefficient of node i is , is the number of neighbor nodes for node i, and is the number of connections between neighbor nodes.
3.2.4. Node Centrality
Centrality reflects the importance of one node within the entire network. Node centrality is mainly reflected by the measurement of indicators such as degree centrality, closeness centrality, betweenness centrality, eigenvector centrality, etc.
3.2.5. Network Coherency
Network coherency is mainly measured by network density, the average distance between nodes, and cohesion. Network diagrams are classified into four types based on network connectivity, including fully connected graphs, maximal connected subgraphs, weakly connected graphs, and strongly connected graphs.
4. Results and Discussions
4.1. Patent Collaboration Network Construction
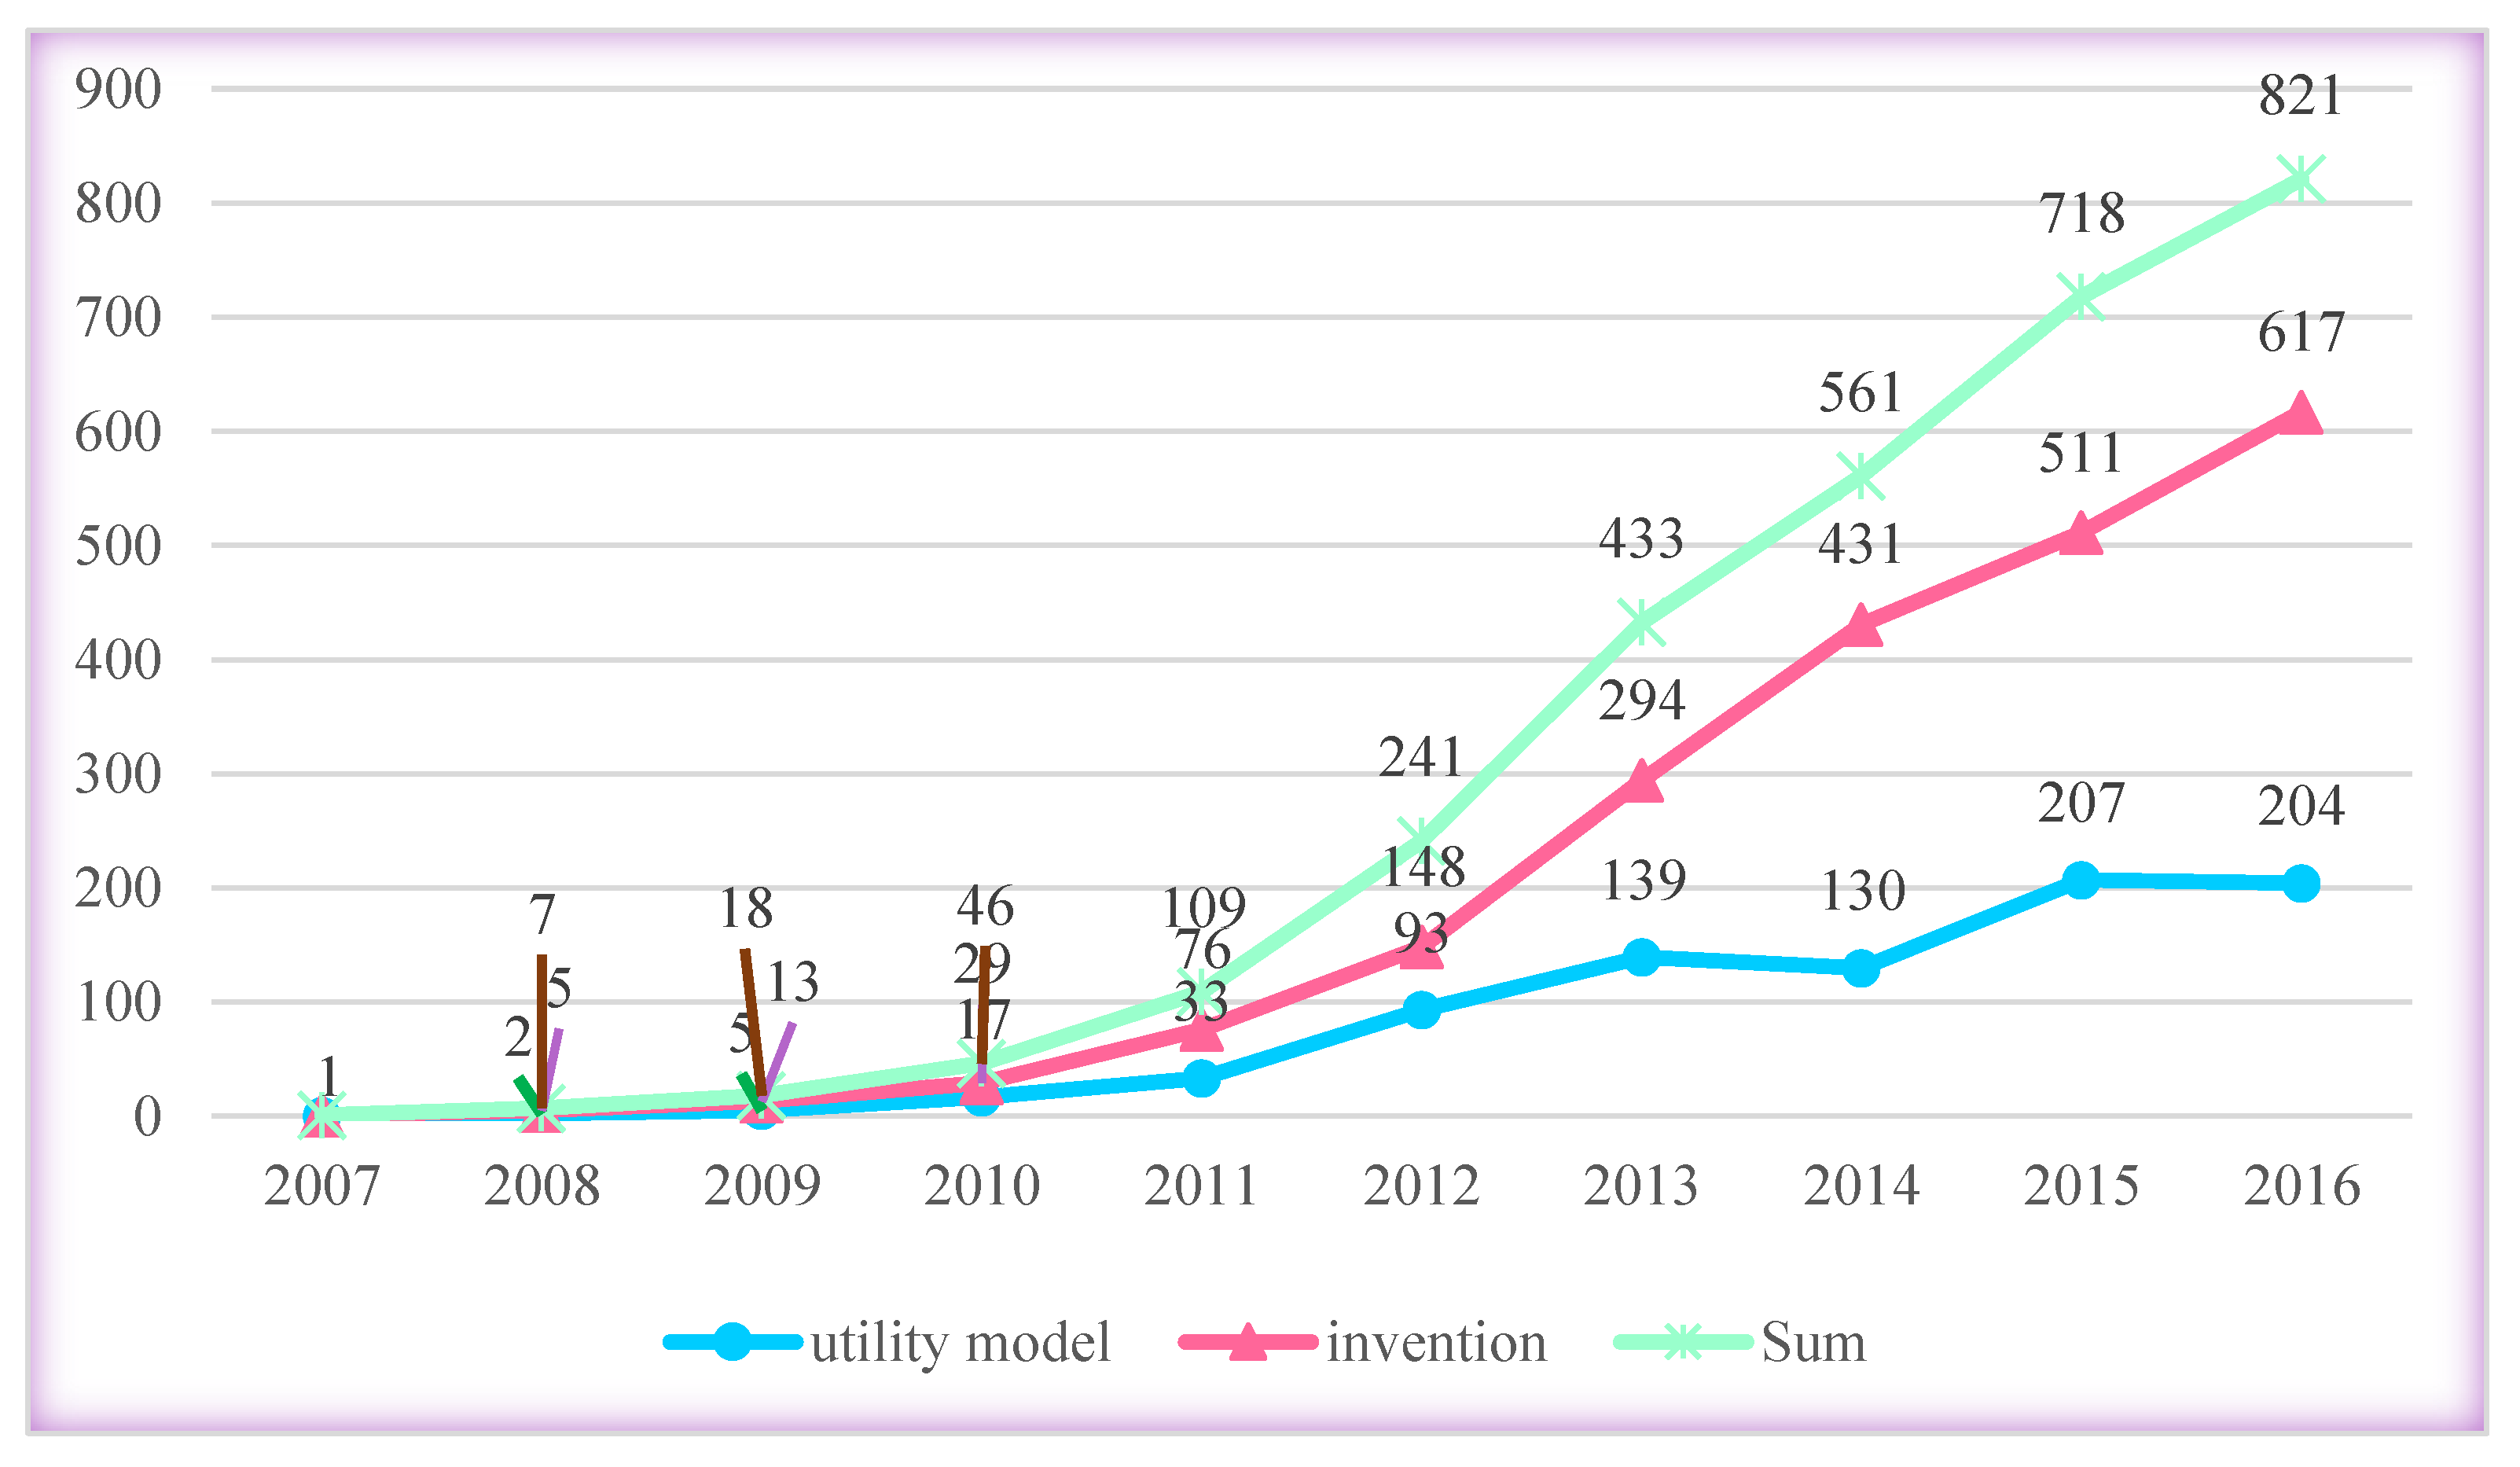
In this paper, 2955 registered collaborative patents are statistically analyzed in chronological order, as shown in Figure 1. It can be found that from 2007 to 2016, the number of cooperative patents in SG field has shown a gradual upward trend, indicating that the innovation cooperation in this field is continuously strengthening, and the number of invention patents exceeds utility model patents to a large extent.
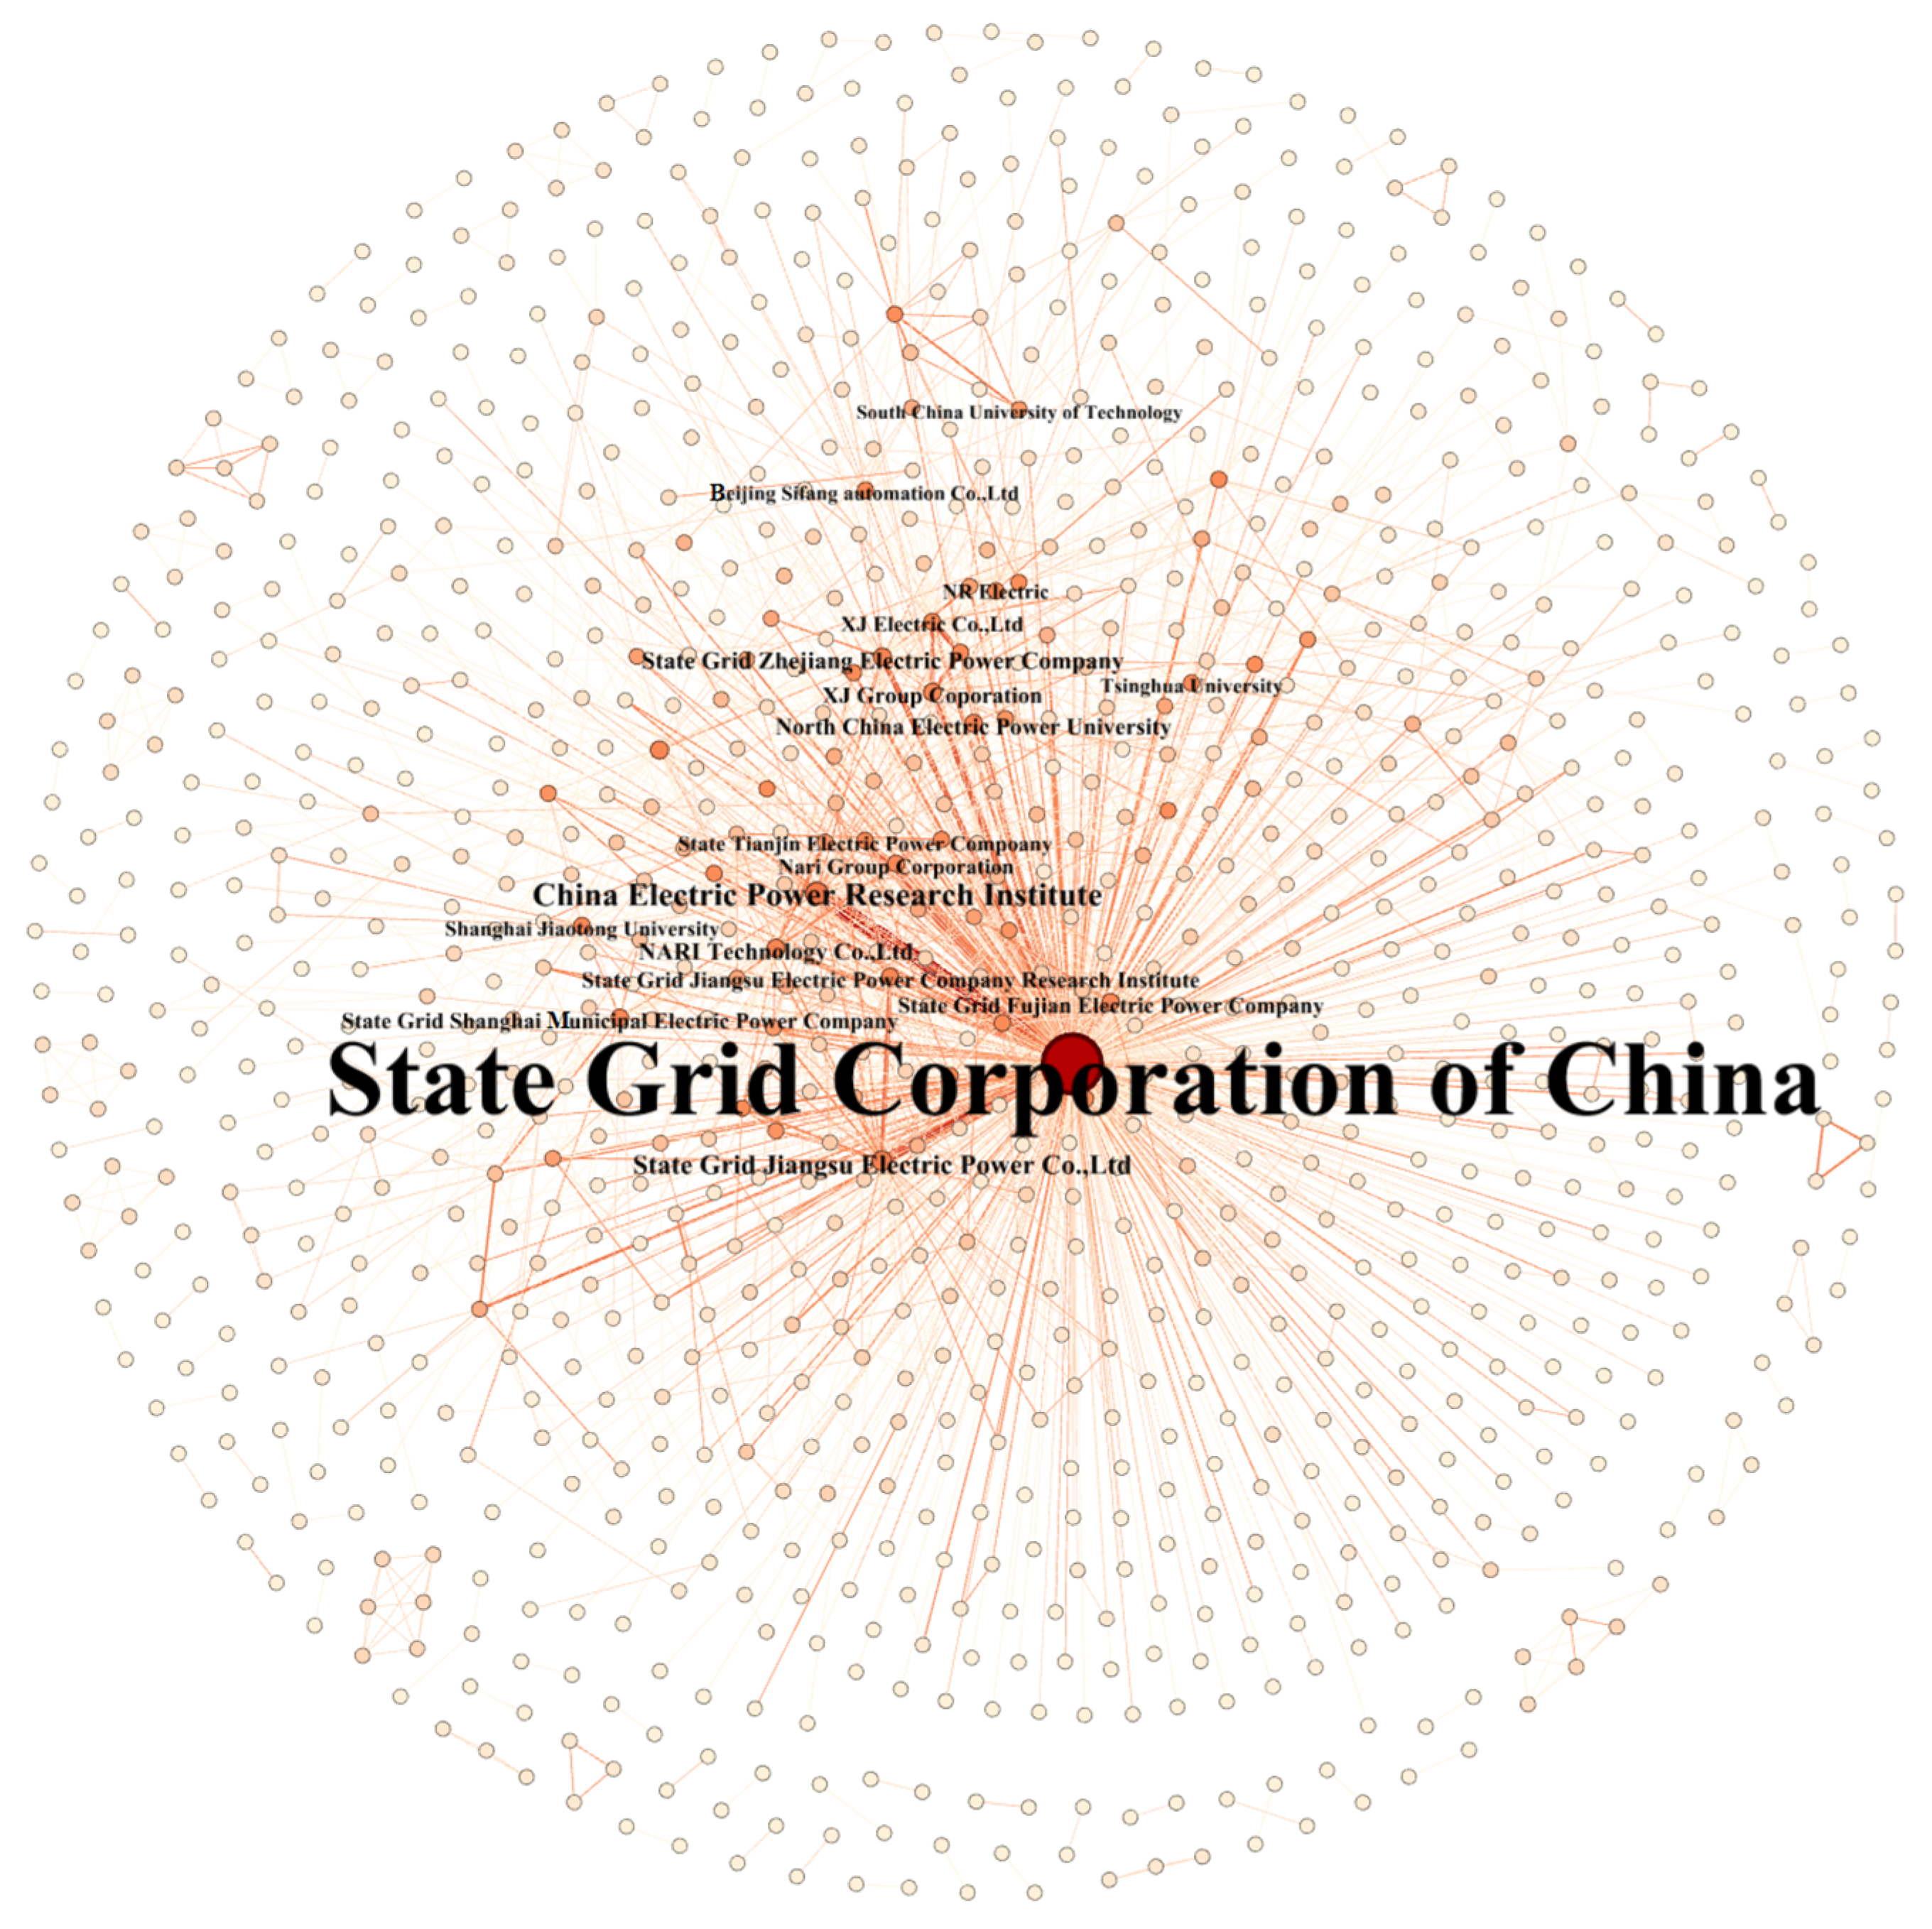
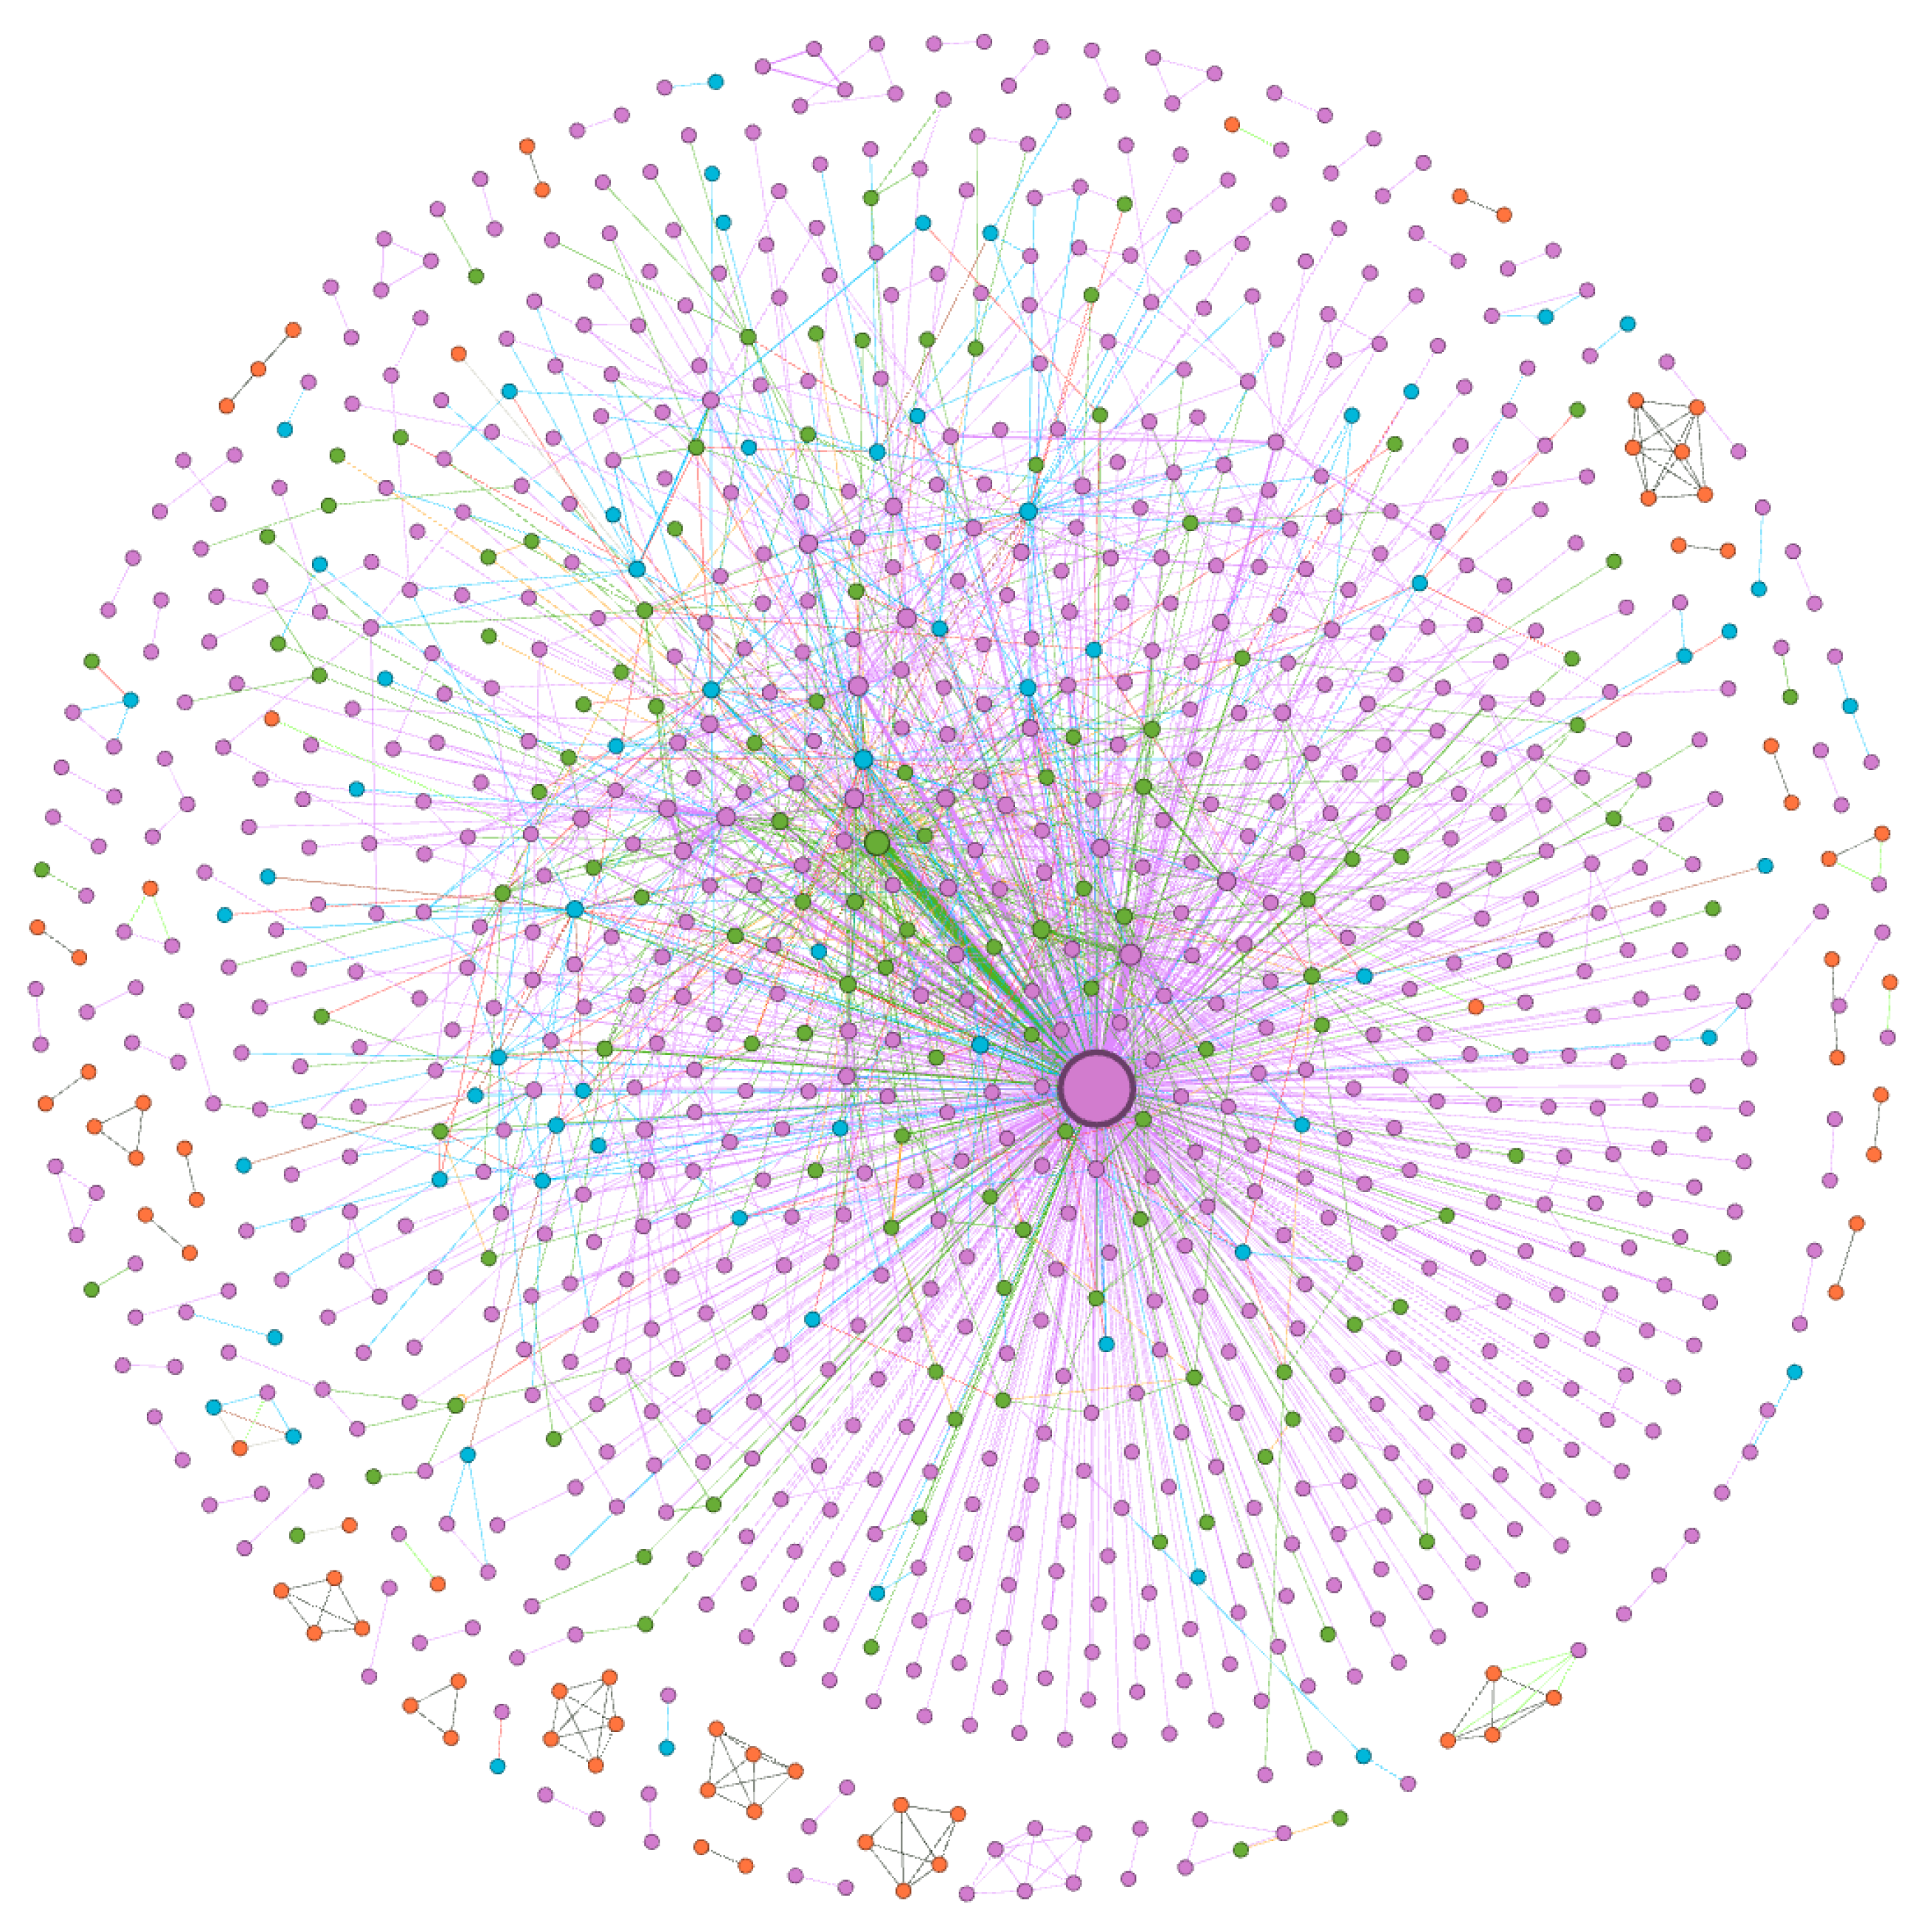
In this paper, each patent applicant is regarded as a network node, the depth of the node color and the size of the node indicate the number of other nodes connected to this node, that is, the degree to which the importance of the network node and nodes of different colors represent different types of patent applicants. If there are two or more patent applicants in one patent, it is considered to be a collaborative relationship. In the patent collaboration network, the connection between two nodes indicates the collaboration between different patent applicants, the depth of the connection color and the thickness of the connection indicate the frequency of collaborations between the two patent applicants, e.g., the weight of the connection reflecting the intensity of collaboration; the connections of different colors represent patent collaboration relationships between patent applicants of different types. Then, Gephi software is used to illustrate the patent collaboration network in the SG field, the network model is shown in Figure 2. One-thousand-and-forty-three nodes represent 1043 patent applicants; the largest node is the State Grid Corporation of China (SGCC), with the deepest color. The SGCC is located at the core of the network, the colors of other nodes gradually become shallower from the inside to the outside, and the size of the nodes gradually decreases from the inside to the outside. SGCC is the node with the largest number of connected nodes, indicating that SGCC is the most important node in the network. The China Electric Power Research Institute, State Grid Jiangsu Electric Power Co., Ltd., State Grid Zhejiang Electric Power Co., Ltd., and other nodes shown in the figure are relatively important nodes. Two-thousand-one-hundred-and-seventy-five connections represent 2175 patent collaborative relationships between different patent applicants, the connection between SGCC and China Electric Power Research Institute is the thickest, with the deepest color, and the collaboration between the two patent applicants is the most frequent. The connections between SGCC and the State Grid Jiangsu Electric Power Co., Ltd.; SGCC and State Grid Tianjin Electric Power Company, SGCC and the XJ Group Corporation; and SGCC and the State Grid Zhejiang Electric Power Co., Ltd. are relatively thicker, with a deeper color, indicating that they have a relatively higher intensity of collaboration.
4.2. Patent Collaboration Network Characteristics
4.2.1. Types of Applicants
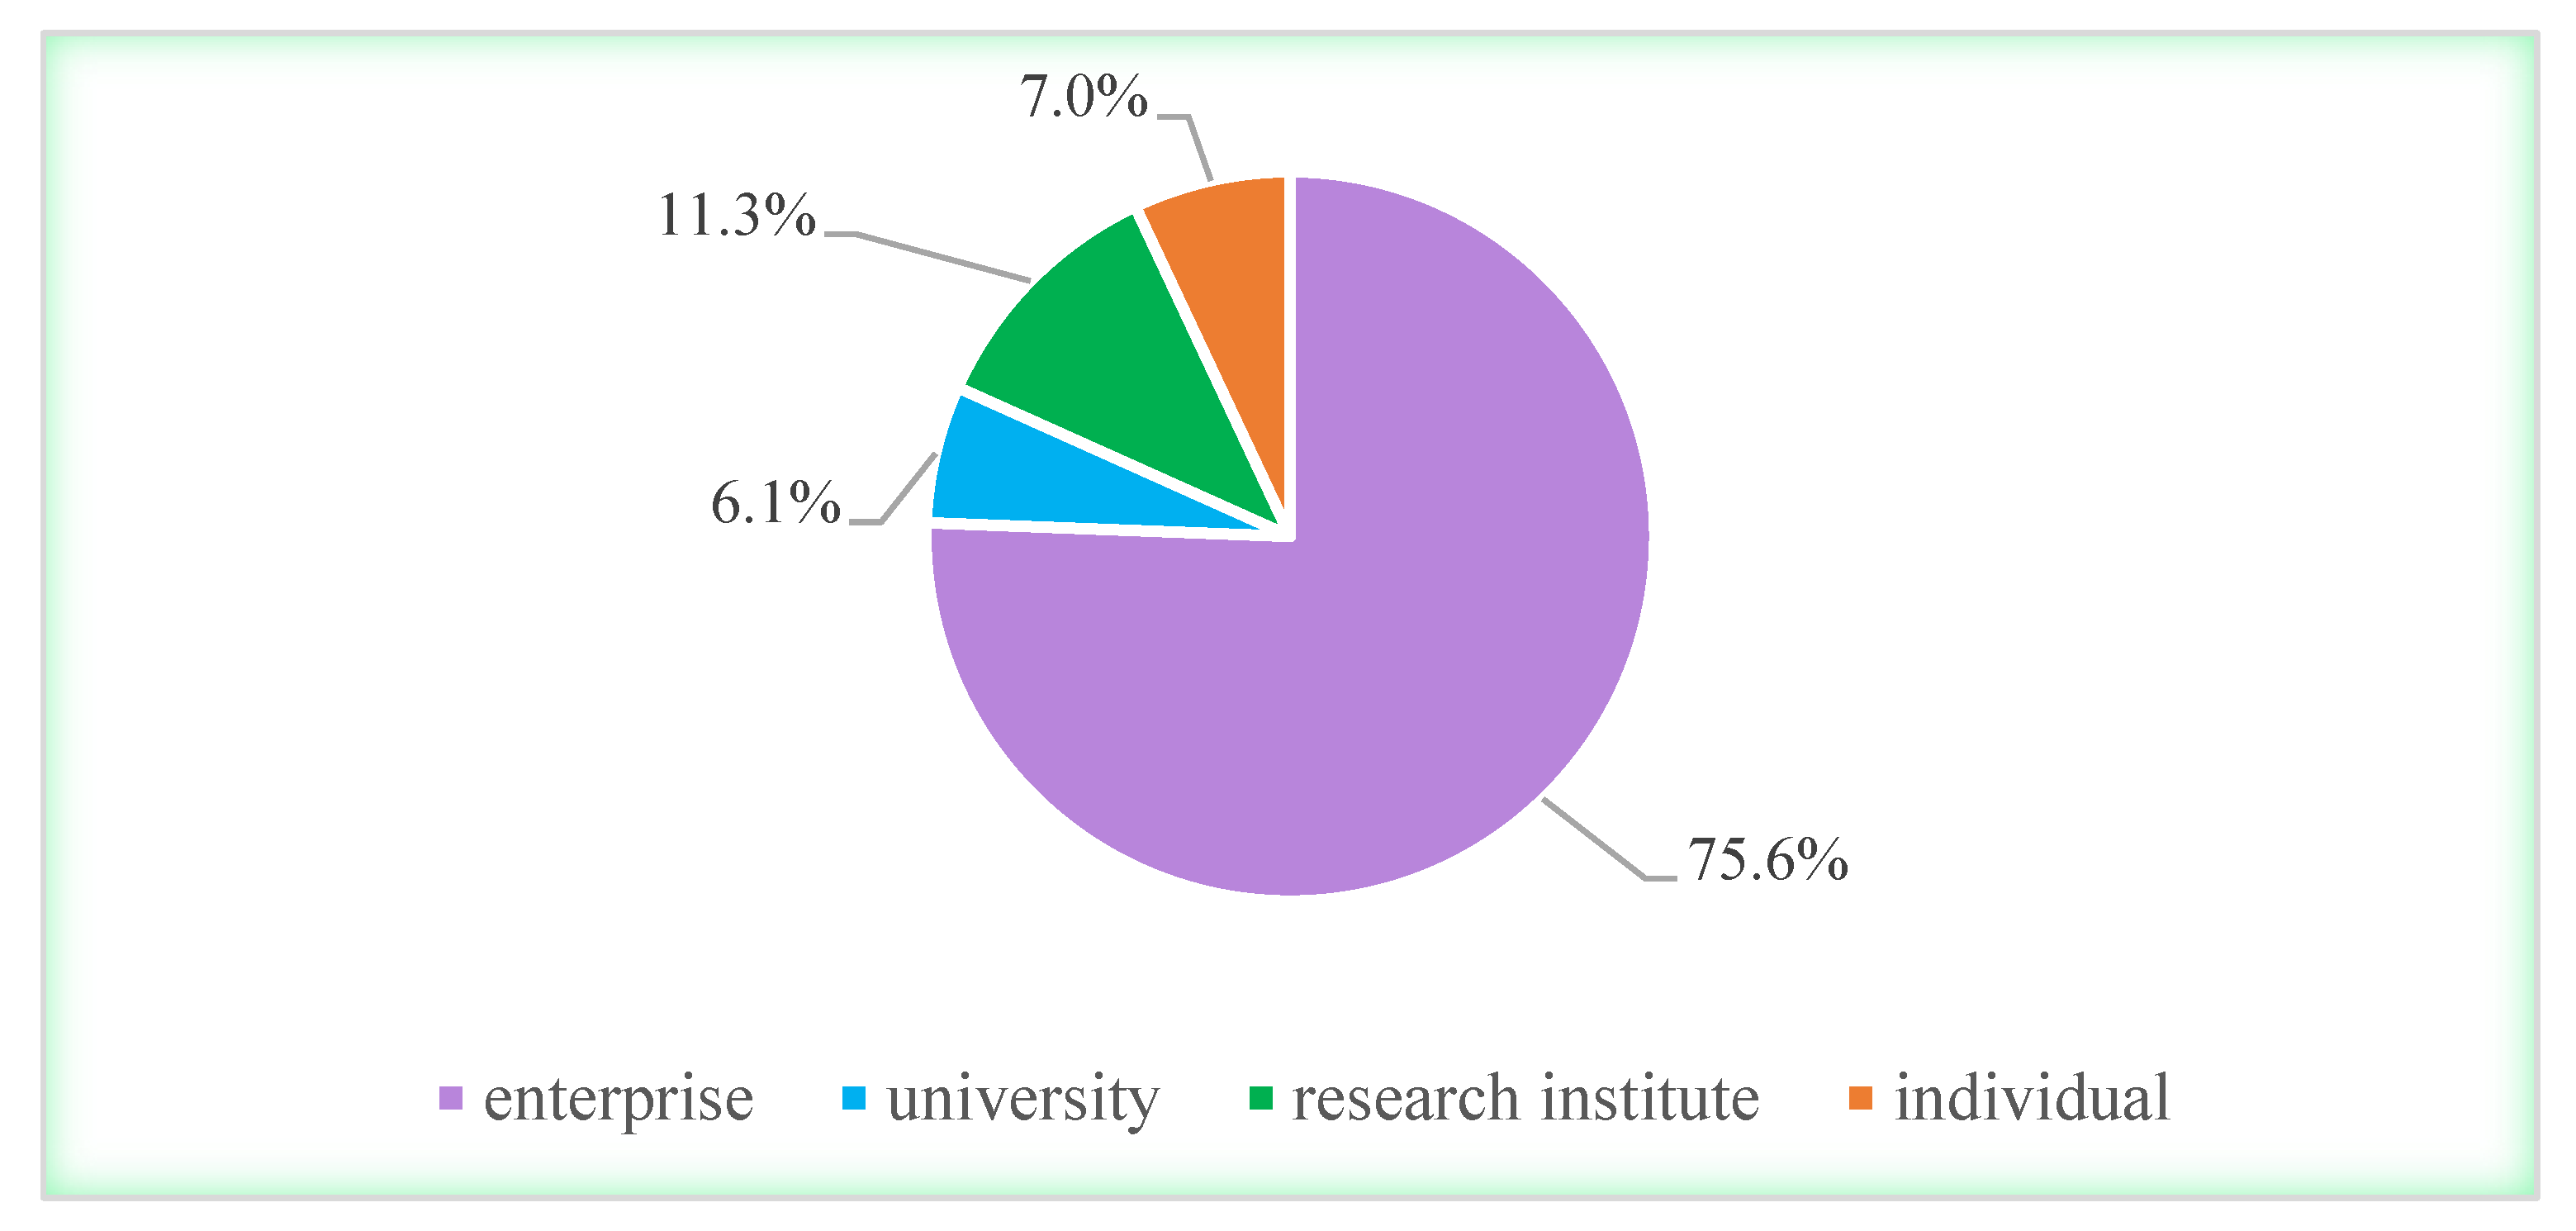
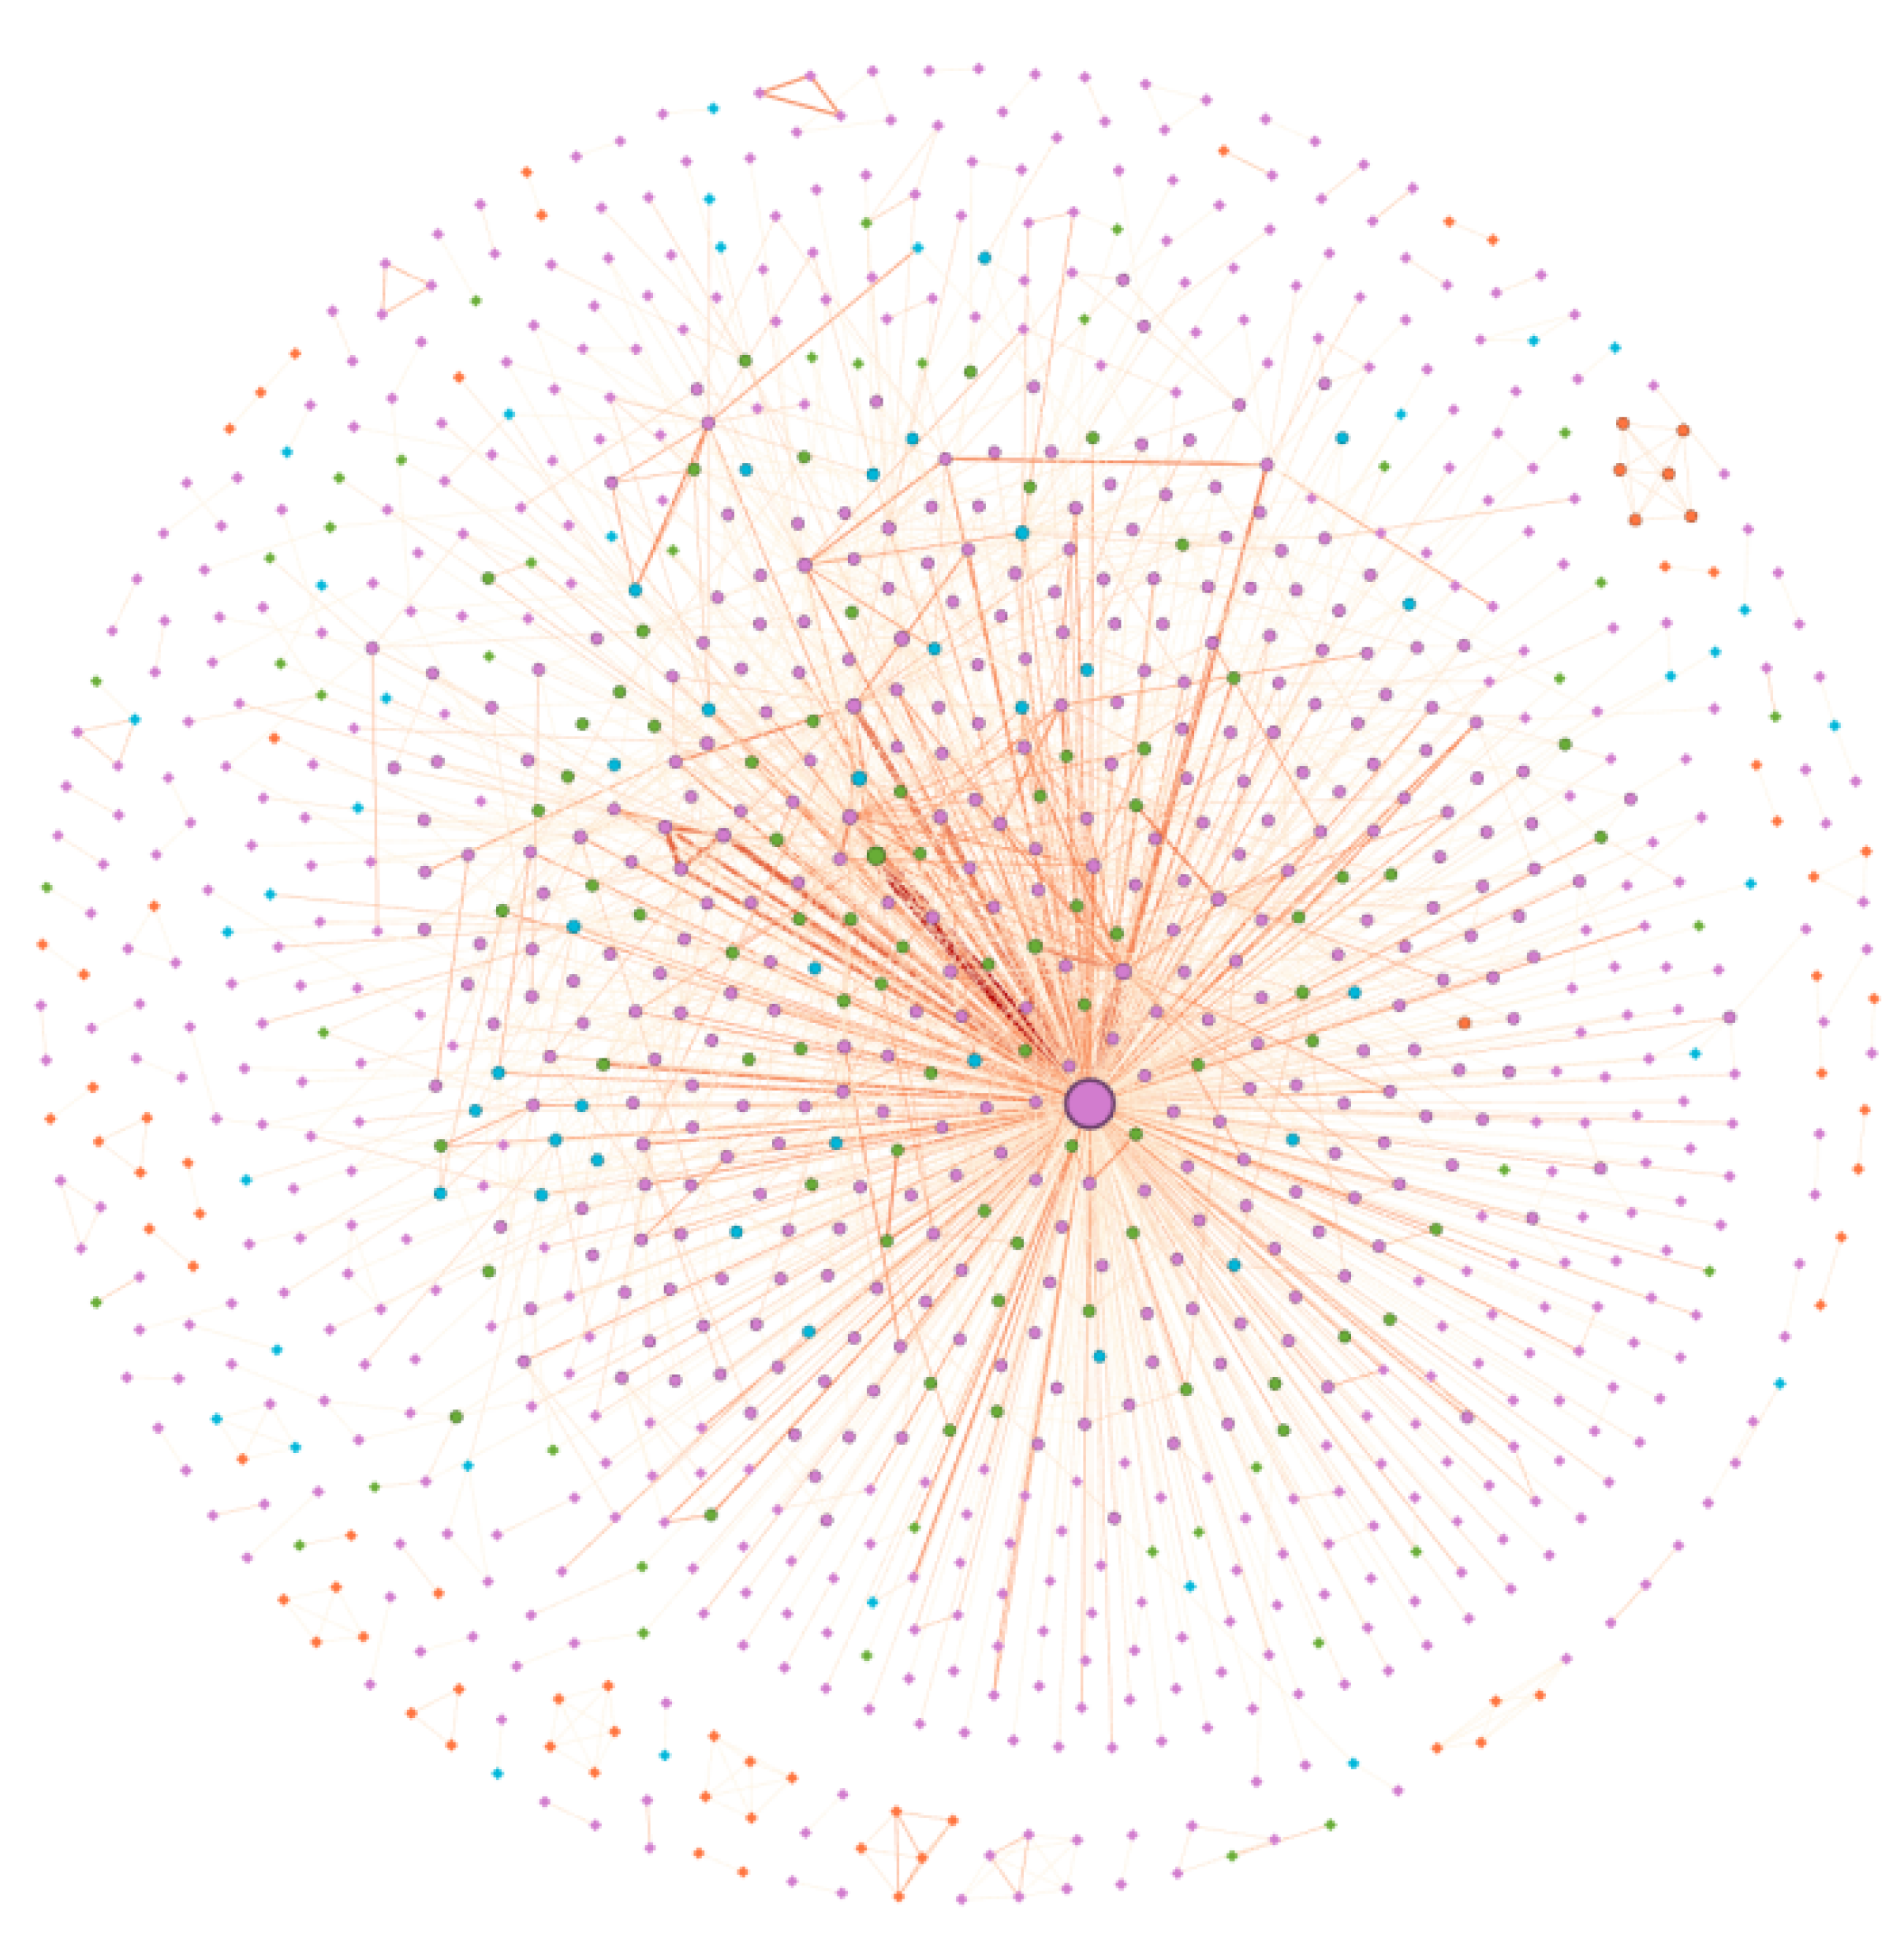
According to the relevant patent data selected in this paper, patent applicants are divided into four types: enterprise, university, research institute, and individual. It can be seen from Figure 3 that the number of patent collaboration in the form of enterprise accounts for 75.6% of the total collaborative patents, and the proportion of research institute, individual, and university individuals participating in patent collaboration is 11.3%, 7%, and 6.1% respectively. This shows that in the smart grid field, the enterprise is the dominated part for participating in collaborative patents, while individual, university, and research institutes contribute relatively less. The main reason for this distribution may be due to that enterprises are more inclined to convert technological innovations and other scientific and technological achievements into patents and other forms, thereby forming the competitiveness of enterprises in the industry. Therefore, the enterprise type accounts for a large proportion of patent collaboration applications. Most of the patent applicants applying in their personal form belong to enterprises, universities, or research institutes. In other words, most of the individual patents are applying in the name of enterprises, universities, or research institutes, meaning that the ownership of patents belonging to platform and individual types accounts for a relatively small percentage of patent collaboration applications. Moreover, universities and research institutes have strong scientific research capabilities. They can independently research and develop related technologies in SG field, and rarely apply for patents in collaboration with other types of entities. Therefore, the proportion of patent collaboration applications between university and research institute types is relatively less. In this paper, Gephi software is used to visualize the applicant composition of the constructed patent collaboration network in SG field, as shown in Figure 4. The purple, blue, green, and orange modules represent enterprise, university, research institute, and individual respectively. Figure 4 shows the number and distribution of different types of nodes in the patent collaboration network. In this network, the numbers of nodes for enterprises, universities, research institutes and individuals are 788, 64, 118, and 73 respectively. The largest core node is the enterprise type, apart from the core node, other nodes of enterprise type are evenly distributed in the semiperiphery and periphery [67,68] of the network. Most nodes for university and research institute type are concentrated in the semiperiphery of the network, and a few nodes for university and research institute type are located in the periphery of the network. The nodes for individual type are mainly concentrated in the periphery of the network, and only two nodes for individual type are located in the semiperiphery of the network.
4.2.2. Types of Collaboration Relationships
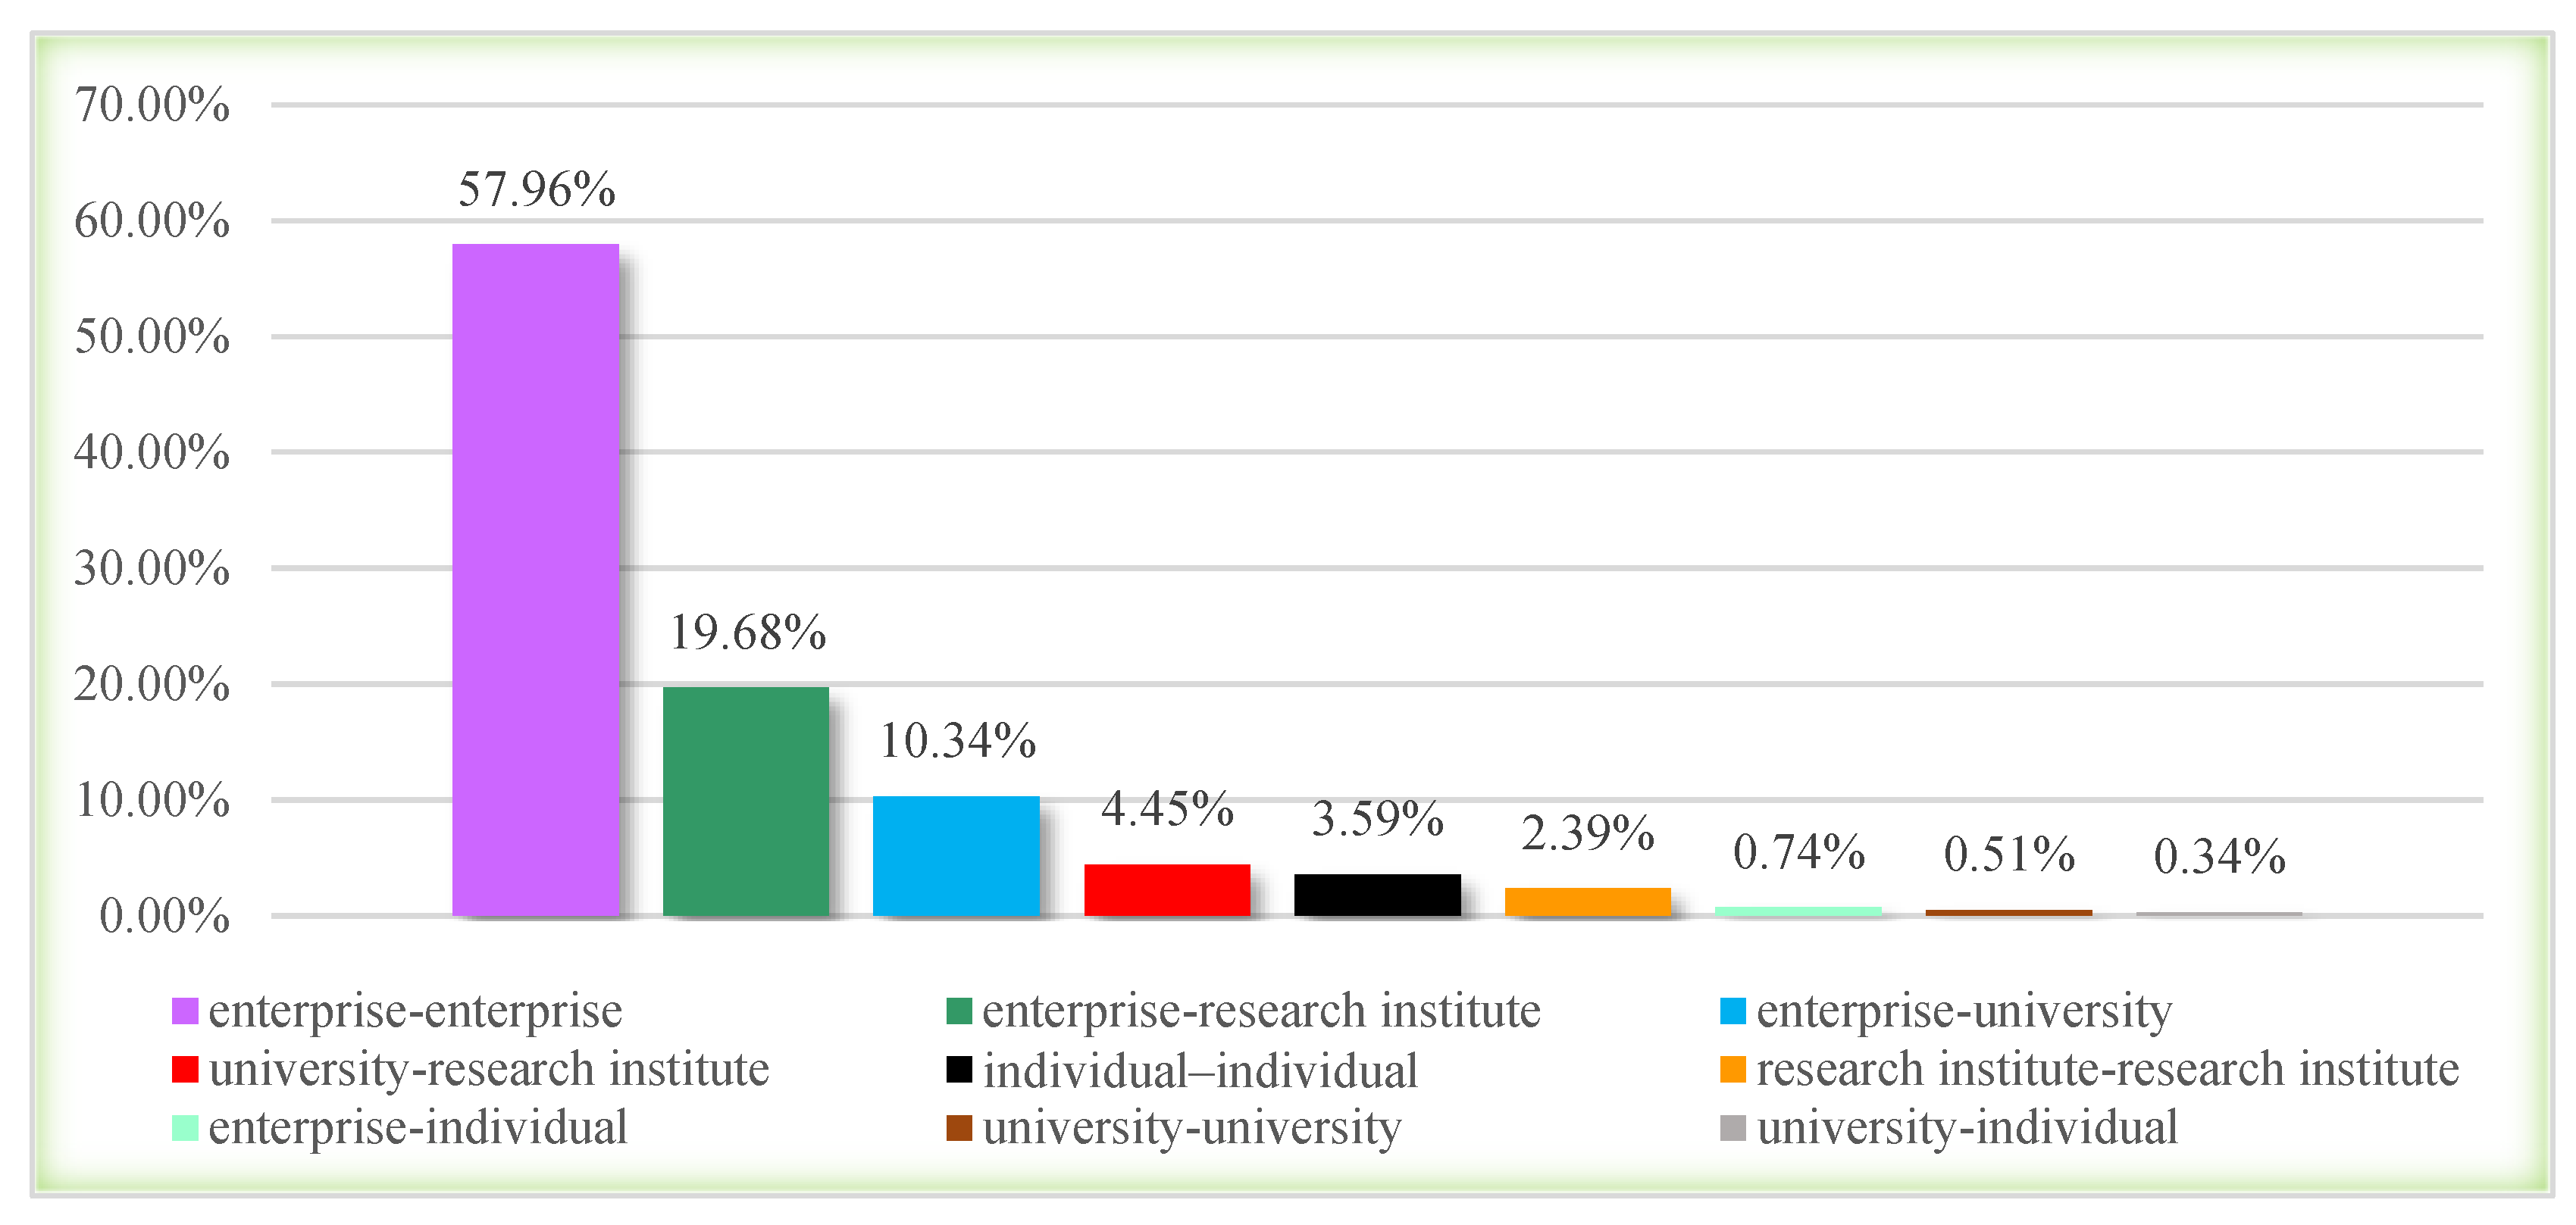
According to different types of patent applicants, the patent collaboration relationships are divided into ten types, namely, enterprise–enterprise, enterprise–individual, enterprise–university, enterprise–research institute, university–university, university–individual, university–research institute, research institute–individual, research institute–research institute, and individual–individual. The patent collaboration situation of different collaborative types in SG field from 2007 to 2016 is shown in Figure 5. It can be found that the type of enterprise–enterprise accounts for the highest proportion, up to 57.96%, and the type of enterprise–research institute and enterprise–university also have higher proportions, being 19.68% and 10.34%, respectively. It also can be seen that the number of three types, namely, enterprise–individual, university–university, and university–individual, is very small, and no collaborative patents have been found of research institute-individual type. Then, Gephi software is used to visualize the collaborative relationship network, as shown in Figure 6, nine colors of connections (purple, dark green, blue, red, black, orange, light green, brown, and gray) represent nine types of patent collaboration relationships, namely, enterprise–enterprise, enterprise–research institute, enterprise–university, university–research institute, individual–individual, research institute–research institute, enterprise–individual, university–university, and university–individual. It can be found that the patent collaboration relationships between the same color nodes occupy the major accounts, while the relationships between different color nodes are relatively small, as well as that the main collaboration relationship is patent collaboration between enterprises and enterprises. There are relatively more patent collaborations between research institutes, universities, and enterprises, and other types of patent collaboration are relatively fewer. The thickness of the connections between different color nodes indicates the degree of patent collaboration. From Figure 6, it can be seen that the degree of patent collaboration between different color nodes is relatively weak, reflecting that the collaboration relationship between different types of applicants is not very close in SG field.
4.2.3. Number of Applicants Involved
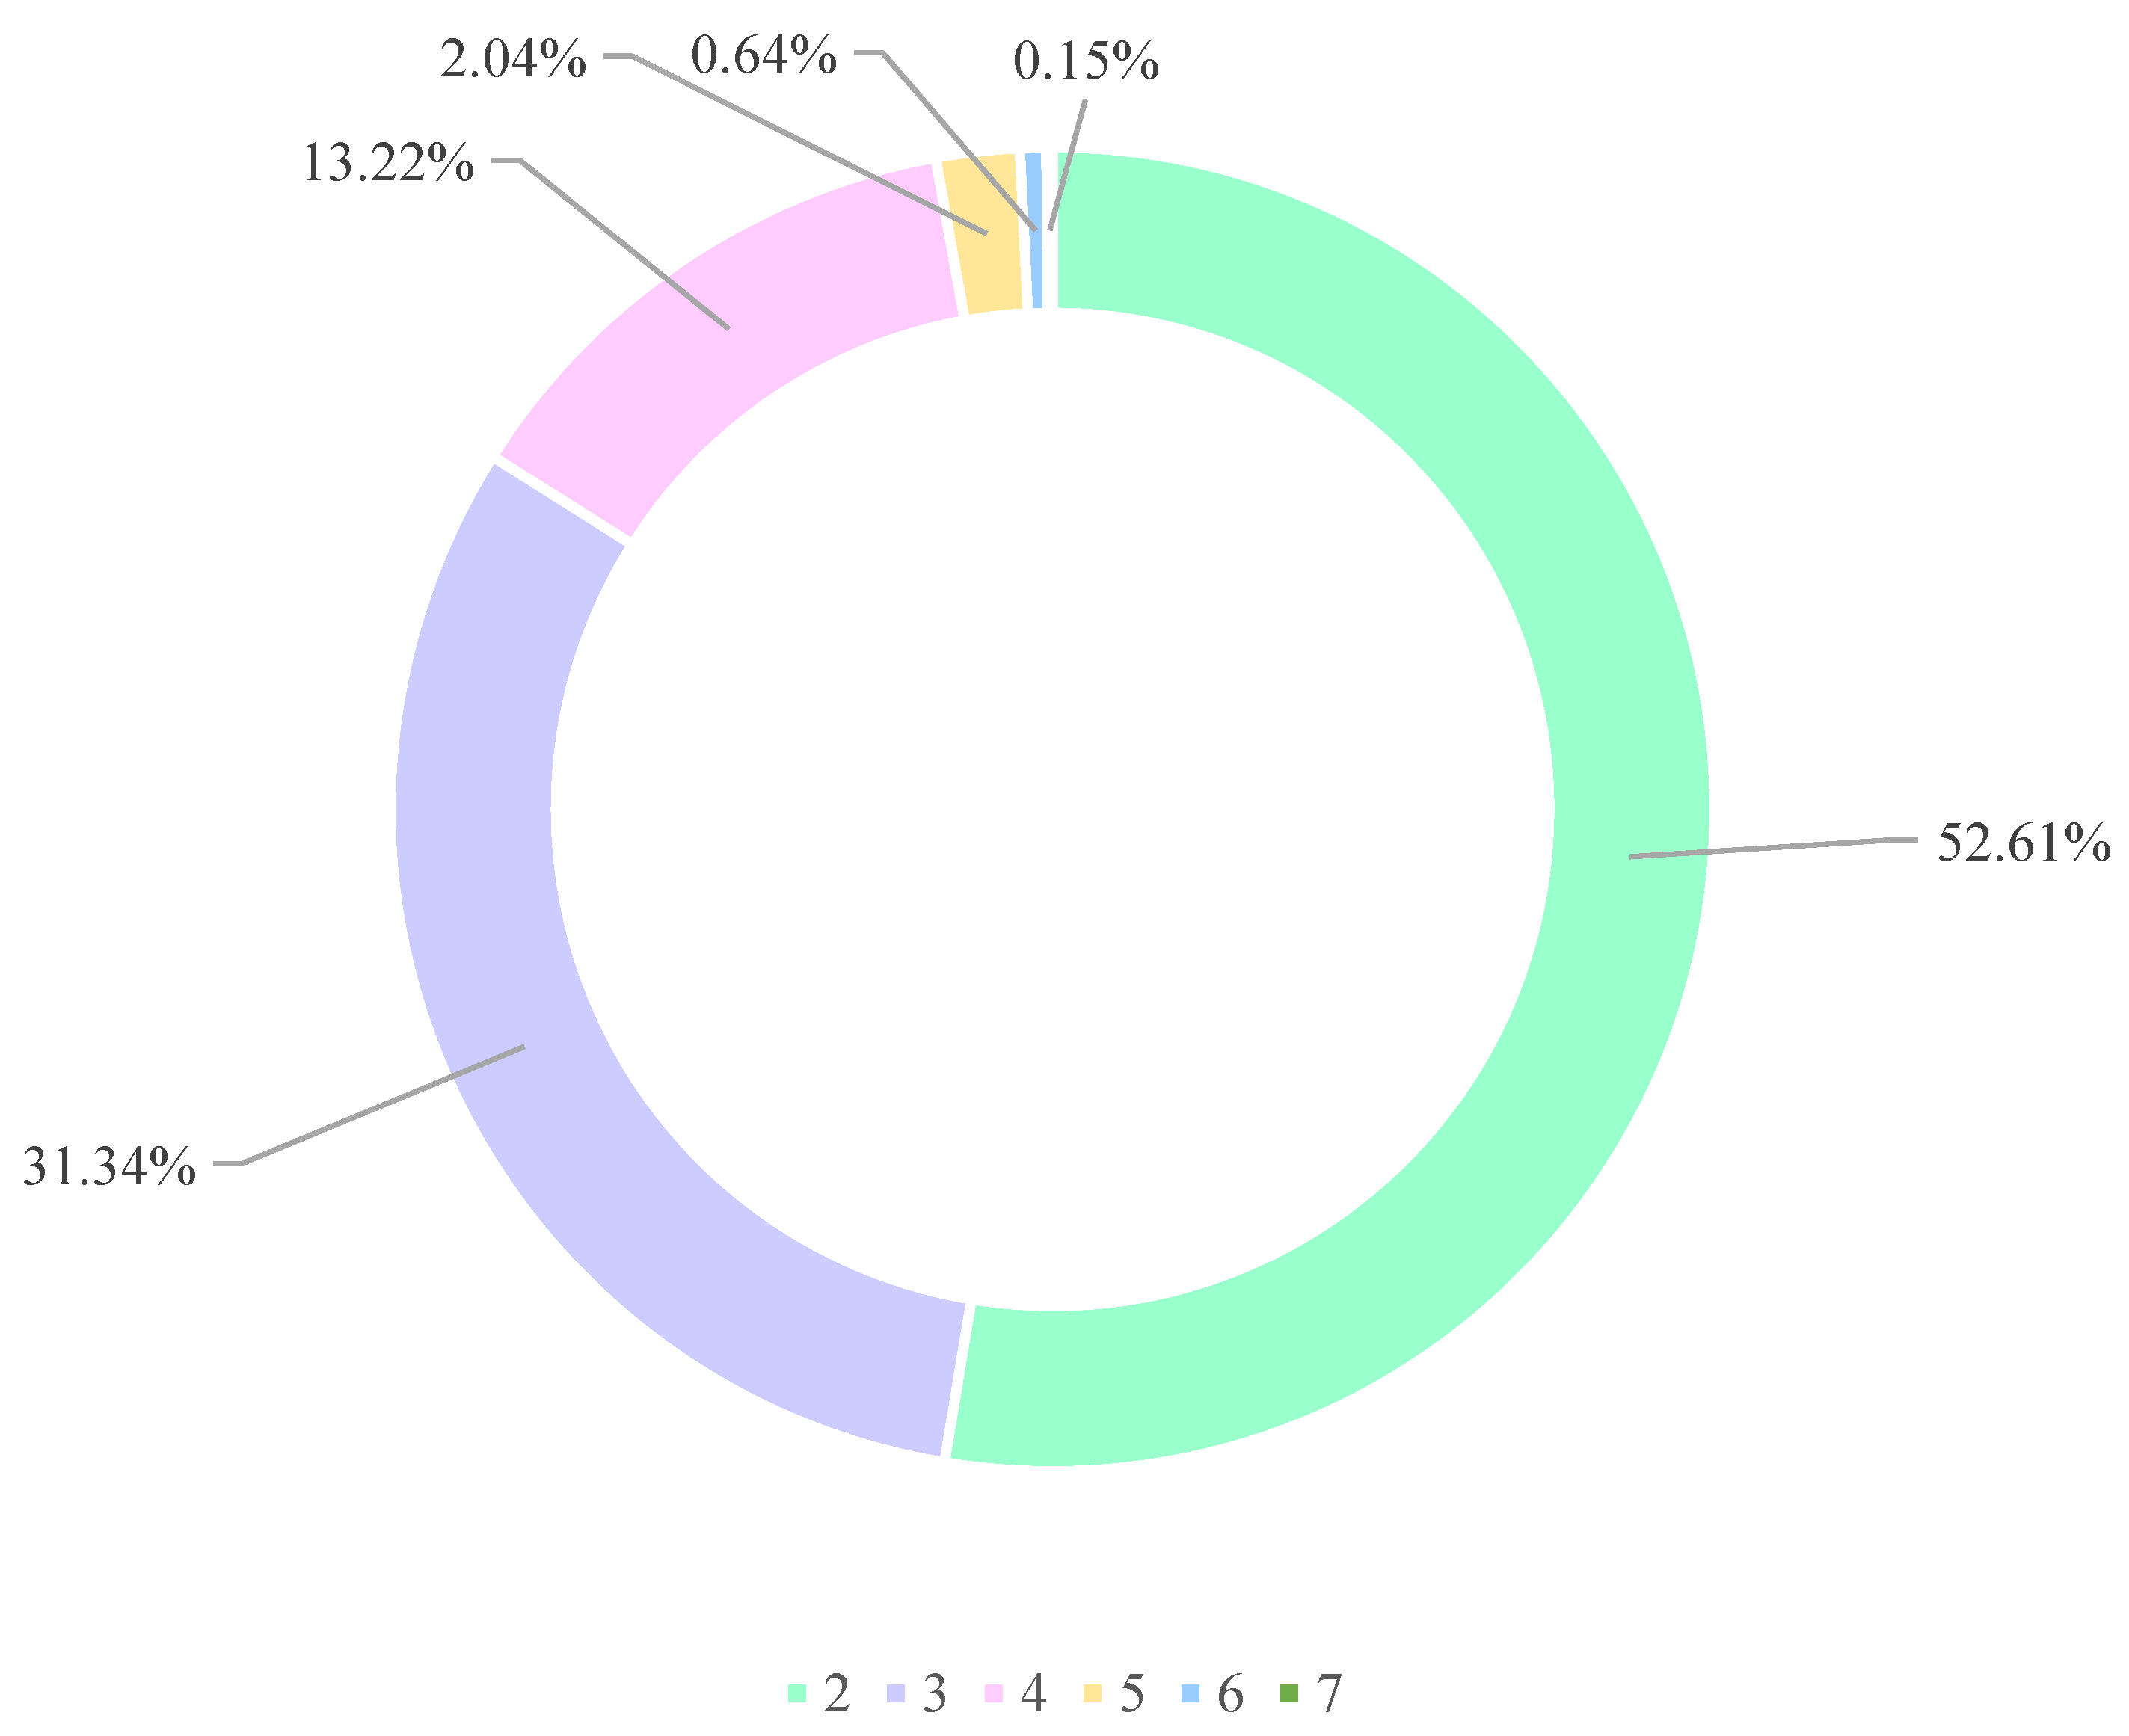
A statistical analysis is made on the number of applicants involved in collaborative patents, as shown in Figure 7. It can be found that among collaborative invention patents, collaborative utility model patents, and total collaborative patents, the most patents are completed by two applicants, the proportion of two applicants involved in collaborative patents accounts for 52.61%, followed by three applicants and four applicants, and the number of five, six, and seven applicants involved in collaborative patents is small. It is obvious that in the SG field, collaborative patents are more inclined to be applied by two applicants and three applicants. This may be because the excessive number of participants will make the coordination between the applicants more difficult and not conducive to patent collaboration.
4.3. Patent Collaboration Network Structure
4.3.1. Basic Characteristics of Patent Cooperation Network Structure
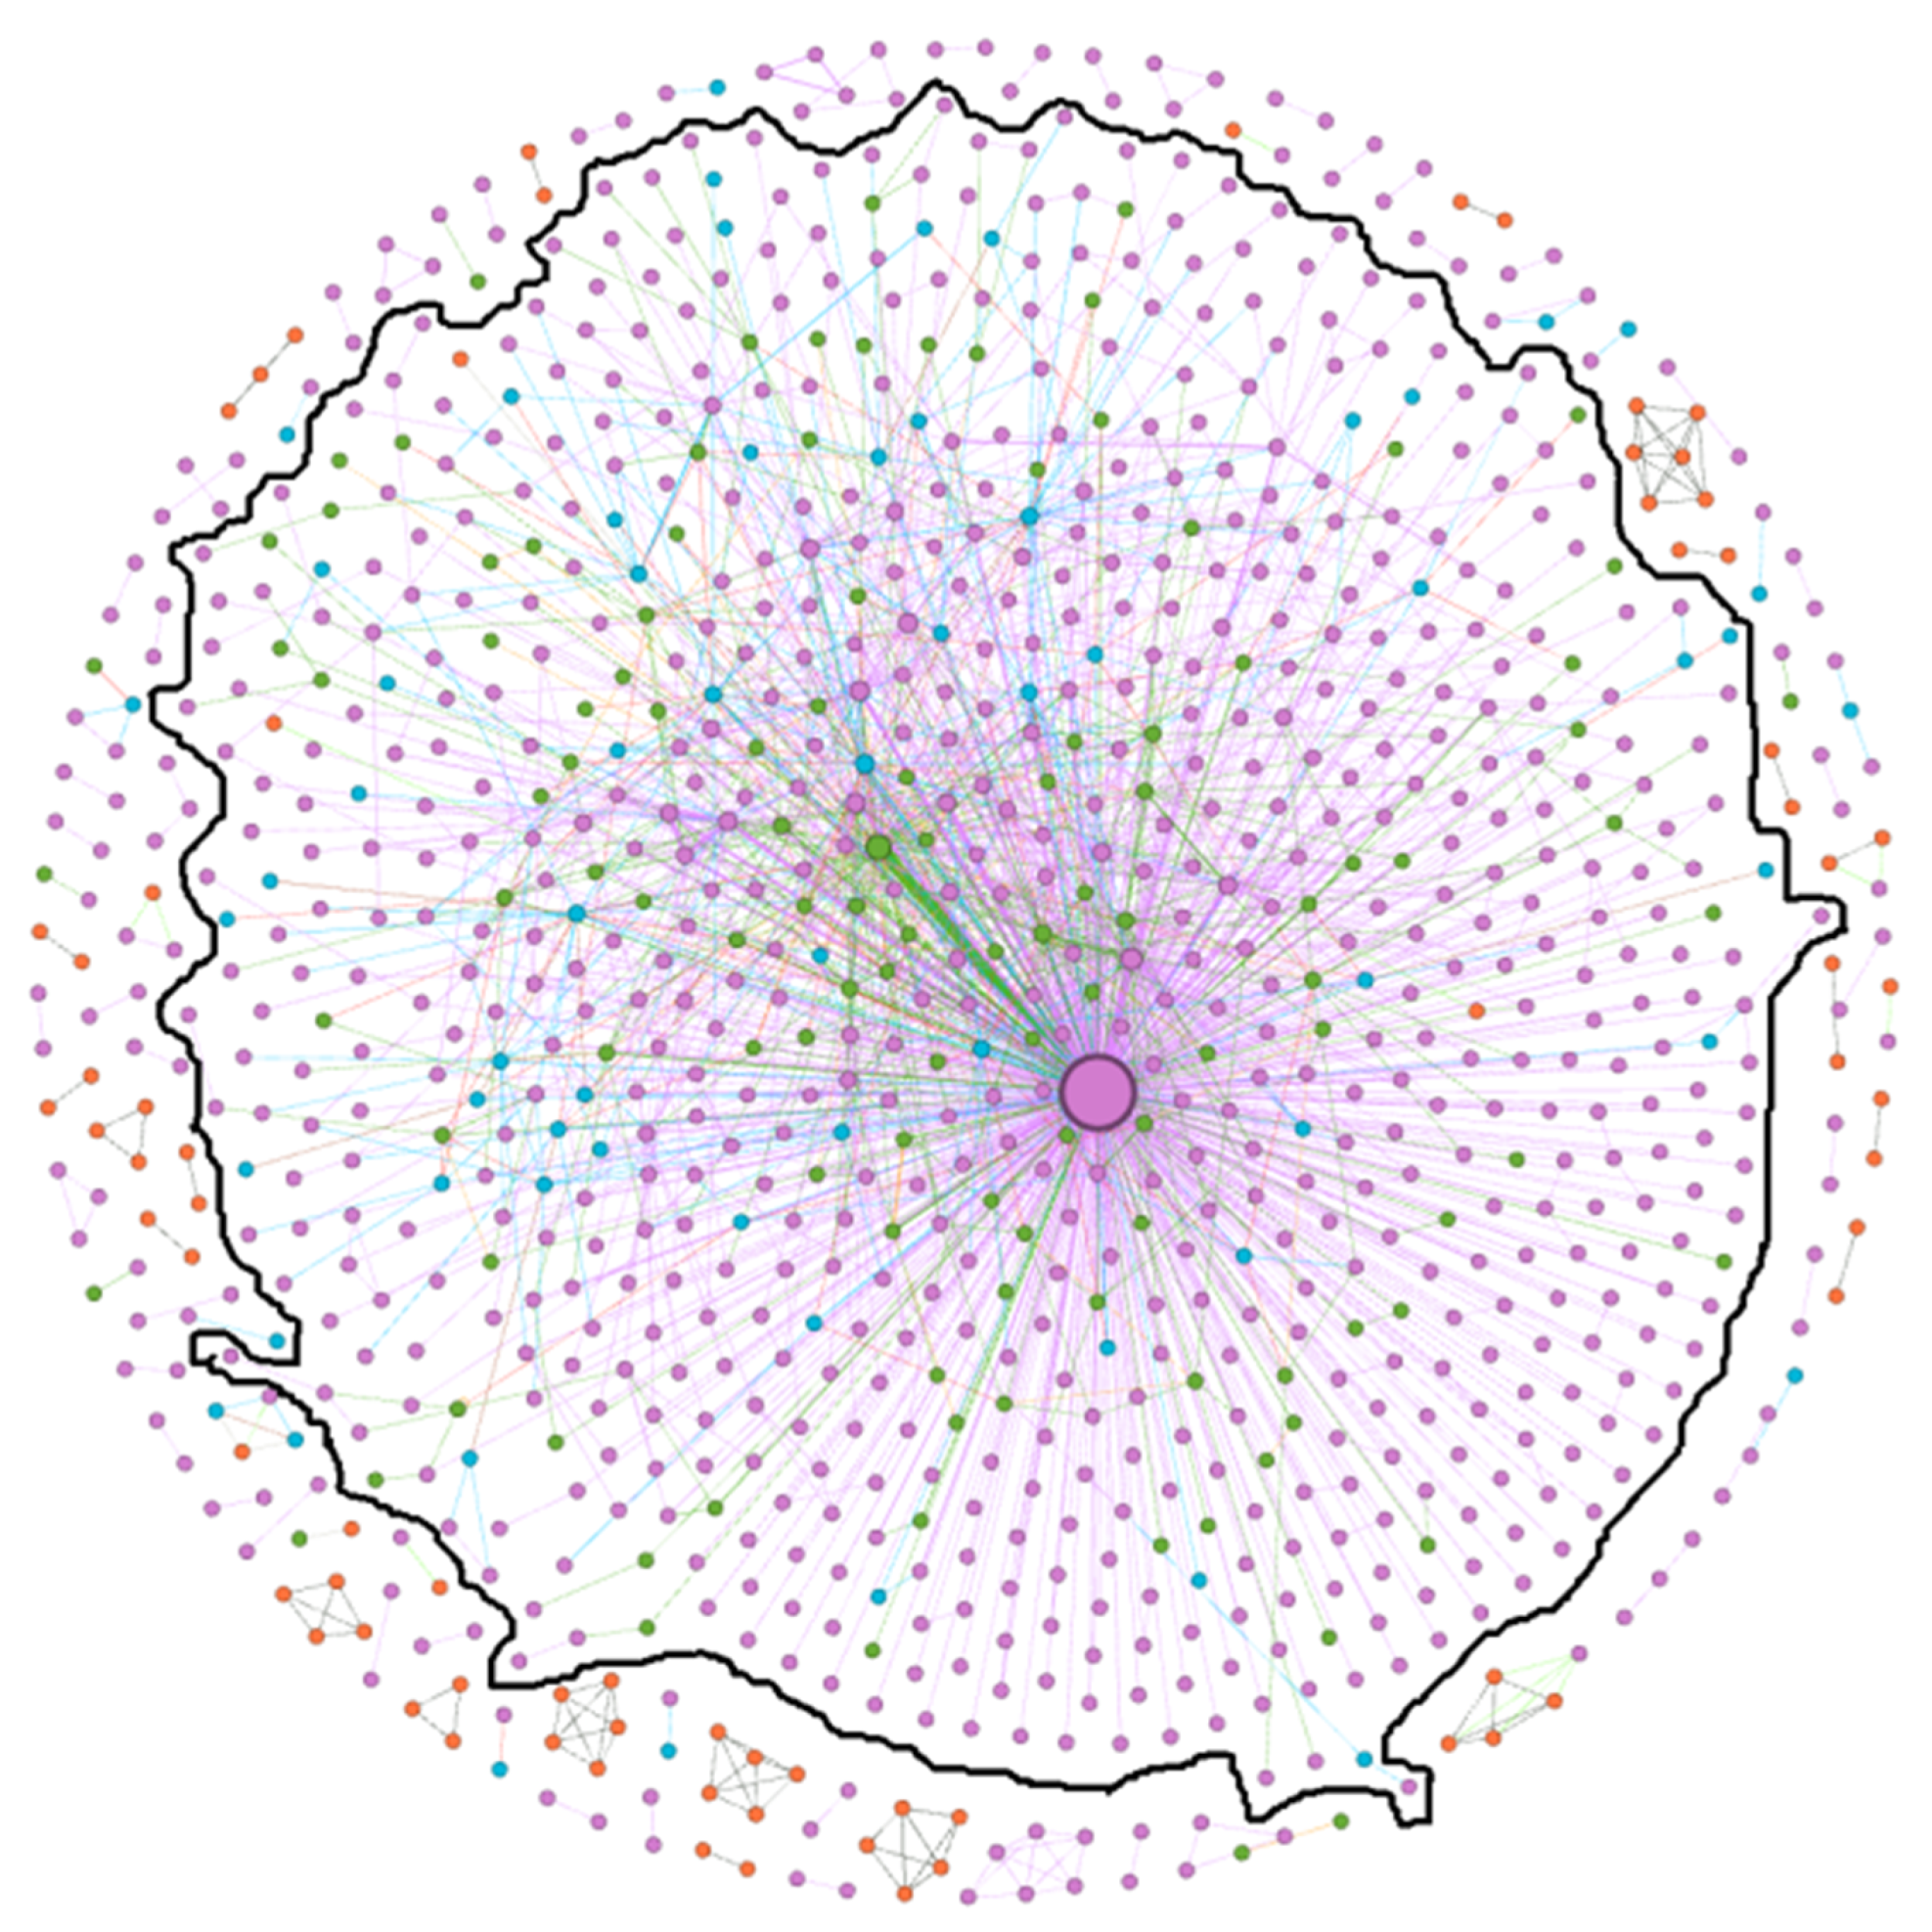
The patent collaboration network in the SG field is explored and analyzed based on the basic structural characteristics of the network, as shown in Table 1. It can be seen that the density of the patent collaboration network is 0.004, indicating that this network is not dense enough, the average path length of this network is 2.635, this value is significantly smaller than the average path length of a random network of the same size, indicating that the knowledge exchange and information transmission capability in this network is strong, while the average clustering coefficient of this network is 0.745, this value is significantly larger than the average clustering coefficient of a random network of the same size, and the degree of aggregation is high. Overall, the patent collaboration network in SG field has a shorter average path length and a higher clustering coefficient, indicating that this network presents the characteristics of a small world network. There are 2175 connections and 7307 connecting times in the network, the number of connecting times is significantly larger than that of the same-sized random network, denoting that there is more frequent communication and higher collaboration intensity within SG field. Moreover, as shown in Figure 8, the number of nodes, connections, and connecting times for maximal connected subgraphs in the network are 818, 1982, and 6901, respectively, accounting for 78.43%, 91.13%, and 94.44% of the total. It shows that the network has good connectivity, there are good communication channels between different applicants, and that the communication is relatively close.
4.3.2. Important Nodes of Patent Cooperation Network
The top ranked important nodes in the patent collaboration network of SG field are sorted based on four indicators—degree centrality, closeness centrality, betweenness centrality, and eigenvector centrality—as shown in Table 2. It is obvious that the State Grid Corporation of China (SGCC) has always been in the first place for the four indicators, and its role is extremely prominent. It is the hub node in the network and is at the core position in the network, reflecting the core position of SGCC in the patent collaboration network and the great influence on cooperative innovation and R&D in SG field, with strong influence and control. The nodes of the China Electric Power Research Institute, State Grid Jiangsu Electric Power Co., Ltd., NARI Technology Co., Ltd., and North China Electric Power University are among the top ten for the four indicators, which play important roles in promoting the technological innovation in SG field.
From the indicator of degree centrality, it can be seen that the top ten nodes have higher degree centrality, indicating that they have wider collaboration relationships with other nodes and occupy relatively important positions in the network. The top ten nodes are composed of seven enterprises, two research institutes, and one university, indicating that enterprises have made greater contributions to the development of SG field. From the indicator of closeness centrality, it can be seen that the top ten nodes are composed of seven enterprises, two universities, and one research institute; they are close to other nodes and are located in the central area of the whole network, which has a far-reaching influence on other nodes. From the indicator of betweenness centrality, it can be seen that the top ten nodes are composed of six enterprises, three universities, and one research institute. They occupy the key positions of the interconnection between nodes, and these nodes have more channel advantages in knowledge exchange, information transmission and technical cooperation, with strong capabilities to schedule resources. From the indicator of eigenvector centrality, it can be seen that the top ten nodes are composed of seven enterprises, two research institutes, and one university, these nodes have good collaborative relationships with their neighbor nodes, and their neighbor nodes are also in a relatively important position in the network, thus they often achieve innovative collaboration through a strong alliance. In addition, there are relatively close cooperative relationships between a small number of enterprises, which are mainly engaged in R&D for SG field in the form of a parent–subsidiary corporation, such as XJ Group Corporation, Far East Cable Co., Ltd., etc. It can also be seen from Table 2 that in the patent collaboration network of SG field, the SGCC is a hub point connected to many nodes, which plays a leading role in the operation of the entire network. At the same time, there is a seriously uneven distribution for the degree centrality of the nodes in the entire network, and most nodes in the network have only a small number of connections. Therefore, the patent collaboration network of SG field has the characteristics of a scale-free network.
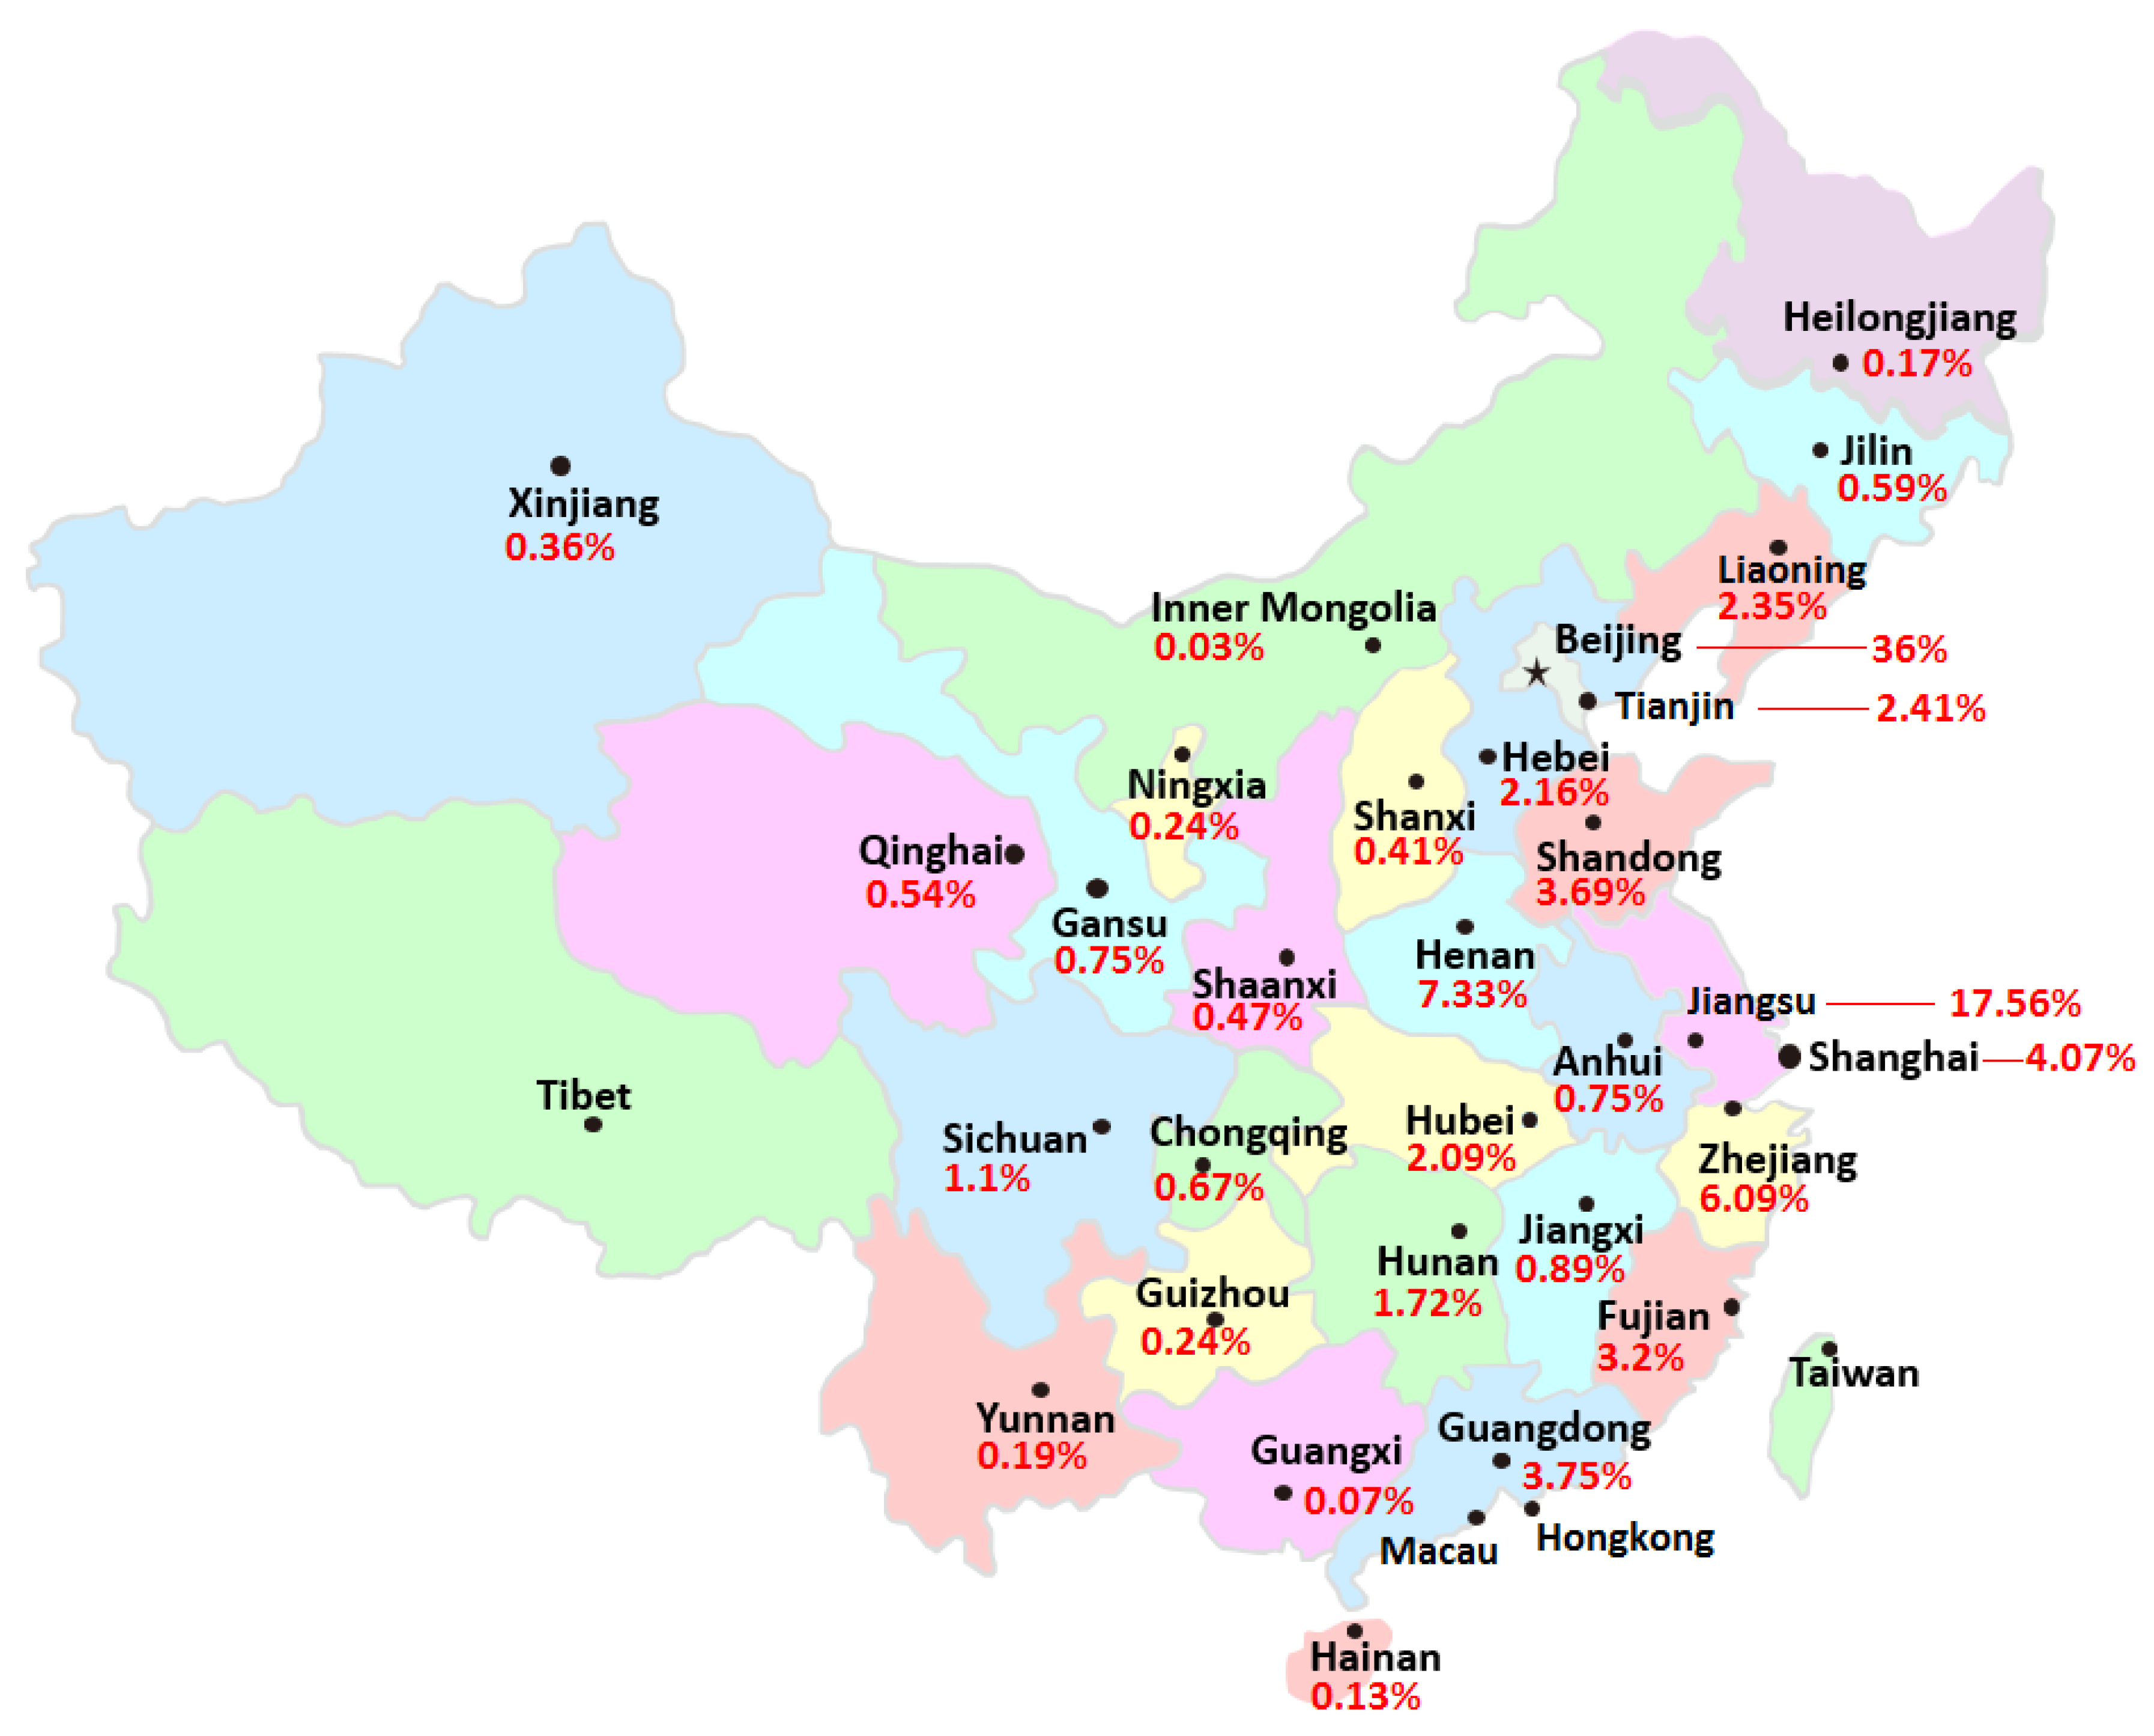
4.3.3. Regional Distribution of Patent Cooperation Network
According to the region where the patent applicant is located, the structural characteristics of the network are analyzed from the perspective of regional distribution. According to the statistics, the regional distribution of patent collaboration in the SG field is shown in Figure 9. It can be found that except for the number of patent collaboration in Tibet is zero, the other 30 regions have patent collaboration. The sum of patent collaboration in the seven regions of Beijing, Jiangsu, Shandong, Shanghai, Henan, Guangdong, and Zhejiang accounted for 79% of the total number, occupying the dominant positions of patent collaboration in SG field. Among them, Beijing has contributed the most to collaborative R&D in the SG field, and the number of patent collaboration accounts for 36%. In general, the level of collaborative R&D in the eastern coastal areas is relatively strong, while the central and western regions are relatively low.
5. Conclusions and Suggestions
5.1. Conclusions
In this paper, we analyzed the construction, characteristics, and structure of patent collaboration network in SG field using patent data from SIPO. The main findings are as follows.
(1) Patent collaboration is an effective form of cooperative innovation among different subjects, and it is one of the effective ways to promote cooperative R&D and technological innovation in SG field. Compared with the development of foreign smart grids, China is still in the early stage of development. The number of patent collaboration applications in this field is small, and the patent collaboration network is small and not dense enough. Through the analysis of the patent collaboration in SG field, it can be found that the proportion of enterprises participating in patent collaboration is relatively large, while universities, research institutes, and individuals only occupy smaller parts.
(2) The patent collaboration relationships of enterprise–enterprise, enterprise–university, and enterprise–research institute occupy a large proportion of patent collaborations in SG field, the patent collaboration relationships of individual–individual, research institute–research institute, and university–research institute account for a certain proportion of patent collaborations, while the patent collaboration relationships of enterprise–individual, university–university, university–individual account for a relatively small proportion. However, there is no patent collaboration between research institutes and individuals. It can be concluded that in SG field, the proportions of collaborative relationship types formed by different patent applicants are quite different.
(3) At present, SGCC has an important position in patent collaboration in SG field. This field has formed a patent collaboration network with SGCC as its core, and the network has good connectivity. However, there are still some marginal entities (including individuals and small companies/group company subsidiaries) in the network, and a patent collaboration network dominated by multiple cores has not yet been formed. Moreover, the level of collaborative R&D and technological innovation in the eastern coastal areas is relatively strong, while the central and western regions are relatively low.
5.2. Suggestions
(1) It is necessary for the government to rationally allocate resources for cooperative innovation of different types of entities. It is also essential to fully encourage universities, research institutes, and individuals to actively participate in collaborative innovation, especially mobilize the collaboration enthusiasm of universities and research institutes, give full play to their scientific research capabilities, and advocate individuals’ innovation according to the government’s policy “mass entrepreneurship, innovation”, and then promote the collaborative innovation in SG field.
(2) It would be rational to adjust the proportional structure of different types of patent collaborative relationships in SG field. It is a necessary attempt to promote patent collaboration between research institutes and individuals. At the same time, it is crucial to vigorously encourage patent collaboration between universities and universities, enterprises and individuals, and universities and individuals, remembering not to ignore the important role of individuals in patent collaboration. It is worth noting that research institutes and universities have strong independent R&D capabilities, thus they can achieve their strong alliances through cooperation. Moreover, it is necessary to strengthen the intensity and frequency of collaboration between enterprises and universities, research institutes and research institutes, and universities and research institutes, and realize the optimization and integration of resources such as manpower, technology, knowledge, and information in order to accomplish collaborative patents of higher quality.
(3) The government needs to support some important innovation entities (such as China Electric Power Research Institute, State Grid Jiangsu Electric Power Co., Ltd. etc.) to form a number of large-scale collaborative innovation associations, as well as a patent collaboration network dominated by multiple cores, and realize the balanced development of different types of innovation subjects. It is necessary for important innovation entities to radiate different regions of the country geographically, and developed regions should assist underdeveloped regions to achieve common development. In addition, it is significant to encourage marginal entities to actively participate in large-scale innovation communities, broadly establish cooperative relationships, strengthen the exchange of knowledge and information, promote technological innovation, form a fully connected network, and eventually enhance overall level of technological innovation for the patent collaboration network in SG field.
Author Contributions
Conceptualization, Y.T. and W.L.; Methodology, Y.T.; Software, Y.T.; Validation, Y.T. and W.L.; Formal Analysis, Y.T.; Investigation, Y.T. and W.L.; Resources, W.L. and Y.T.; Data Curation, Y.T.; Writing-Original Draft Preparation, Y.T.; Writing-Review & Editing, W.L. and Z.Y.; Visualization, Y.T.; Supervision, W.L. and K.B.; Project Administration, W.L.; Funding Acquisition, W.L., Z.Y. and K.B.
Funding
This research was funded by the National Natural Science Foundation of China (grant numbers 71872056, 71302028, 71472057, and 71774037), Heilongjiang Province Science Foundation (grant number LC2017031), Fundamental Scientific Research Funds for the Central Universities (grant numbers HEUCFW180905, HEUCFW170908, and HEUCFW170904), the China Postdoctoral Science Foundation (grant number 2018M631005), the Natural Science Foundation of Guangdong Province (grant number 2018A030310671), and the Heilongjiang Province Philosophy and Social Science Planning Project (grant number 16YJB03).
Conflicts of Interest
The authors declare no conflict of interest.
References
- Morais, H.; Sousa, T.; Vale, Z.; Faria, P. Evaluation of the electric vehicle impact in the power demand curve in a smart grid environment. Energy Convers. Manag. 2014, 82, 268–282. [Google Scholar] [CrossRef] [Green Version]
- Clastres, C. Smart grids: Another step towards competition, energy security and climate change objectives. Energy Policy 2011, 71, 5399–5408. [Google Scholar] [CrossRef]
- Lin, C.C.; Yang, C.H.; Shyua, J.Z. A comparison of innovation policy in the smart grid industry across the pacific: China and the USA. Energy Policy 2013, 57, 119–132. [Google Scholar] [CrossRef]
- Li, J.C.; Li, T.Z.; Han, L. Research on the Evaluation Model of a Smart Grid Development Level Based on Differentiation of Development Demand. Sustainability 2018, 10, 4047. [Google Scholar] [CrossRef]
- Chai, D.S.; Wen, J.Z.; Nathwani, J. Simulation of cogeneration within the concept of smart energy networks. Energy Convers. Manag. 2013, 75, 453–465. [Google Scholar] [CrossRef]
- Erlinghagen, S.; Markard, J. Smart grids and the transformation of the electricity sector: ICT firms as potential catalysts for sectoral change. Energy Policy 2012, 51, 895–906. [Google Scholar] [CrossRef]
- Lucian, M.P.; Sergio, S. Toward Green Vehicles Digitalization for the Next Generation of Connected and Electrified Transport Systems. Energies 2018, 11, 3124. [Google Scholar]
- Batista, N.C.; Melício, R.; Mendes, V.M.F. Layered Smart Grid architecture approach and field tests by ZigBee technology. Energy Convers. Manag. 2014, 88, 49–59. [Google Scholar] [CrossRef]
- Christine, M.; Geerten, V.E.K.; Neelke, D.; Künneke, R. Moral Values as Factors for Social Acceptance of Smart Grid Technologies. Sustainability 2018, 10, 2703. [Google Scholar]
- A European Strategy for Sustainable, Competitive and Secure Energy—EC Green Paper. OGEL, 4. 2006. Available online: http://www.ogel.org (accessed on 2 January 2019).
- U.S. Department of Energy. Smart Grid: Enabler of the New Energy Economy. 2008. Available online: http://www.oe.energy.gov/eac.htm (accessed on 18 December 2018).
- Xu, Z.; Xue, Y.; Wong, K.P. Recent Advancements on Smart Grids in China. Electr. Power Compon. Syst. 2004, 42, 251–261. [Google Scholar] [CrossRef]
- Yuan, Y.H.; Shen, J.K.; Pan, L.; Zhao, C.; Kang, J. Smart grids in China. Renew. Sustain. Energy Rev. 2014, 37, 896–906. [Google Scholar] [CrossRef]
- Mah, D.N.; Wu, Y.Y.; Hills, P.R. Explaining the role of incumbent utilities in sustainable energy transitions: A case study of the smart grid development in China. Energy Policy 2017, 109, 794–806. [Google Scholar]
- Fu, L.W.; Zhao, H.R.; Guo, S. An Analysis on the Low-carbon Benefits of Smart Grid of China. Phys. Procedia 2012, 24, 328–336. [Google Scholar] [Green Version]
- Stephenson, J.; Ford, R.; Nair, N.K.; Watson, N.; Wood, A.; Miller, A. Smart grid research in New Zealand—A review from the GREEN Grid research programme. Renew. Sustain. Energy Rev. 2018, 82, 1636–1645. [Google Scholar] [CrossRef]
- Chen, S.H.; Huang, M.H.; Chen, D.Z.; Lin, S.Z. Detecting the temporal gaps of technology fronts: A case study of smart grid field. Technol. Forecast. Soc. Chang. 2012, 79, 1705–1719. [Google Scholar] [CrossRef]
- Markovic, D.S.; Zivkovic, D.; Branovic, I.; Popovic, R.; Cvetkovic, D. Smart power grid and cloud computing. Renew. Sustain. Energy Rev. 2013, 24, 566–577. [Google Scholar] [CrossRef]
- Lee, A.H.I.; Chen, H.H.; Chen, J. Building smart grid to power the next century in Taiwan. Renew. Sustain. Energy Rev. 2017, 68, 126–135. [Google Scholar] [CrossRef]
- IEA. Technology Roadmap: Smart Grids. International Energy Agency: Paris, France, 2011. Available online: http://www.iea.org/papers/2011/smartgrids_roadmap.pdf (accessed on 31 May 2016).
- Chen, S.H.; Huang, M.H.; Chen, D.Z. Identifying and visualizing technology evolution: A case study of smart grid technology. Technol. Forecast. Soc. Chang. 2012, 79, 1099–1110. [Google Scholar] [CrossRef]
- Muhammad, A.; Nadeem, J.; Khursheed, A. Towards Effective and Efficient Energy Management of Single Home and a Smart Community Exploiting Heuristic Optimization Algorithms with Critical Peak and Real-Time Pricing Tariffs in Smart Grids. Energies 2018, 11, 3125. [Google Scholar]
- Energy and Climate Change Committee, Smart Meters: Progress or Delay? UK Parliament: London, UK, 2015. Available online: http://www.publications.parliament.uk /pa/cm201415/cmselect/cmenergy/665/66502.htm (accessed on 31 May 2016).
- Executive Office. A Policy Framework for the 21st Century Grid: Enabling Our Secure Energy Future; Executive Office of the President of the United States: Washington, DC, USA, 2011.
- Ponce-Jara, M.A.; Ruiz, E.; Gil, R.; Sancristóbal, E.; Pérez-Molina, C.; Castro, M. Smart Grid: Assessment of the past and present in developed and developing countries. Energy Strategy Rev. 2017, 18, 38–52. [Google Scholar] [CrossRef]
- Dantas, G.A.; Castro, N.J.; Dias, L.; Antunes, C.H.; Vardiero, P.; Brandão, R.; Rosental, R.; Zambonid, L. Public policies for smart grids in Brazil. Renew. Sustain. Energy Rev. 2018, 92, 501–512. [Google Scholar] [CrossRef]
- Liu, G.Y.; Gao, P.; Chen, F.; Yu, J.; Zhang, Y. Technological innovation systems and IT industry sustainability in China: A case study of mobile system innovation. Telemat. Inform. 2018, 35, 1144–1165. [Google Scholar] [CrossRef]
- Geldes, C.; Felzensztein, C.; Palacios-Fenech, J. Technological and non-technological innovations, performance and propensity to innovate across industries: The case of an emerging economy. Ind. Mark. Manag. 2017, 61, 55–66. [Google Scholar] [CrossRef]
- Chen, Y.S.; Lin, M.J.; Chang, C.H.; Liu, F.M. Technological innovations and industry clustering in the bicycle industry in Taiwan. Technol. Soc. 2009, 31, 207–217. [Google Scholar] [CrossRef]
- Porter, M.E. On Competition; Harvard Business School Publishing: Boston, MA, USA, 1998. [Google Scholar]
- Inoue, H.; Souma, W.; Tamada, S. Spatial characteristics of joint application networks in Japanese patents. Phys. A Statist. Mech. Appl. 2007, 383, 152–157. [Google Scholar] [CrossRef] [Green Version]
- Lee, M.; Yoon, K. Ecosystem of the medical device industry in South Korea: A Network Analysis Approach. Health Policy Technol. 2018, 7, 397–408. [Google Scholar] [CrossRef]
- Gonzalez, R.; Llopis, J.; Gasco, J. Social networks in cultural industries. J. Bus. Res. 2015, 68, 823–828. [Google Scholar] [CrossRef] [Green Version]
- He, X.J.; Dong, Y.B.; Wu, Y.Y.; Wei, G.; Xing, L.; Yan, J. Structure analysis and core community detection of embodied resources networks among regional industries. Phys. A Stat. Mech. Appl. 2017, 479, 137–150. [Google Scholar] [CrossRef]
- Ma, Z.Z.; Lee, Y.; Chen, C.P. Booming or emerging? China’s technological capability and international collaboration in patent activities. Technol. Forecast. Soc. Chang. 2009, 76, 787–796. [Google Scholar] [CrossRef]
- Markovic, D.; Petkovic, D.; Nikolic, V.; Milovančević, M.; Denić, N. Determination of important parameters for patent applications. Facta Univ. Ser. Mech. Eng. 2017, 15, 307–313. [Google Scholar] [CrossRef]
- Chang, S.H. The technology networks and development trends of university-industry collaborative patents. Technol. Forecast. Soc. Chang. 2017, 118, 107–113. [Google Scholar] [CrossRef]
- Fischer, B.B.; Schaeffer, P.R.; Vonortas, N.S. Evolution of university-industry collaboration in Brazil from a technology upgrading perspective. Technol. Forecast. Soc. Chang. 2018, in press. [Google Scholar] [CrossRef]
- Crescenzi, R.; Nathan, M.; Rodríguez-Pose, A. Do inventors talk to strangers? On proximity and collaborative knowledge creation. Res. Policy 2016, 45, 177–194. [Google Scholar] [CrossRef] [Green Version]
- Guan, J.; Chen, Z. Patent collaboration and international knowledge flow. Inf. Process. Manag. 2012, 48, 170–181. [Google Scholar] [CrossRef]
- Fleming, L.; King, C., III; Juda, A.I. Small worlds and regional innovation. Organ. Sci. 2007, 18, 938–954. [Google Scholar] [CrossRef]
- Motohashi, K.; Muramatsu, S. Examining the university industry collaboration policy in Japan: Patent analysis. Technol. Soc. 2012, 34, 149–162. [Google Scholar] [CrossRef]
- Petruzzelli, A.M. The impact of technological relatedness, prior ties, and geographical distance on university–industry collaborations: A joint-patent analysis. Technovation 2011, 31, 309–319. [Google Scholar] [CrossRef]
- Hong, W.; Su, Y.S. The effect of institutional proximity in non-local university–industry collaborations: An analysis based on Chinese patent data. Res. Policy 2013, 42, 454–464. [Google Scholar] [CrossRef]
- Lacasa, I.D.; Shubbak, M.H. Drifting towards innovation: The co-evolution of patent networks, policy, and institutions in China’s solar photovoltaics industry. Energy Res. Soc. Sci. 2018, 38, 87–101. [Google Scholar] [CrossRef]
- Ozcan, S.; Islam, N. Collaborative networks and technology clusters-The case of nanowire. Technol. Forecast. Soc. Chang. 2014, 82, 115–131. [Google Scholar] [CrossRef]
- Guan, J.C.; Liu, N. Exploitative and exploratory innovations in knowledge network and collaboration network: A patent analysis in the technological field of nano-energy. Res. Policy 2016, 45, 97–112. [Google Scholar] [CrossRef]
- Sun, H.P.; Geng, Y.; Hu, L.X.; Shi, L.; Xu, T. Measuring China’s new energy vehicle patents: A social network analysis approach. Energy 2018, 153, 685–693. [Google Scholar] [CrossRef]
- Blundel, R. Little Ships’: The co-evolution of technological capabilities and industrial dynamics in competing innovation networks. Ind. Innov. 2006, 13, 313–334. [Google Scholar] [CrossRef]
- Crnovrsanin, T.; Muelder, C.W.; Faris, R. Visualization techniques for categorical analysis of social networks with multiple edge sets. Soc. Netw. 2014, 37, 56–64. [Google Scholar] [CrossRef]
- Abrahams, B.; Sitas, N.; Esler, K.J. Exploring the dynamics of research collaborations by mapping social networks in invasion science. J. Environ. Manag. 2019, 229, 27–37. [Google Scholar] [CrossRef] [PubMed]
- Hsu, C.W.; Lin, C.Y. Using social network analysis to examine the technological evolution of fermentative hydrogen production from biomass. Int. J. Hydrog. Energy 2016, 41, 21573–21582. [Google Scholar] [CrossRef]
- Ardito, L.; D’Adda, D.; Petruzzelli, A.M. Mapping innovation dynamics in the Internet of Things domain: Evidence from patent analysis. Technol. Forecast. Soc. Chang. 2018, 136, 317–330. [Google Scholar] [CrossRef]
- Morescalchi, A.; Pammolli, F.; Penner, O.; Petersen, A.M.; Riccaboni, M. The evolution of networks of innovators within and across borders: Evidence from patent data. Res. Policy 2015, 44, 651–668. [Google Scholar] [CrossRef] [Green Version]
- Huang, M.H.; Dong, H.R.; Chen, D.Z. Globalization of collaborative creativity through cross-border patent activities. J. Informetr. 2012, 6, 226–236. [Google Scholar] [CrossRef]
- Moussa, B.; Varsakelis, N.C. International patenting: An application of network analysis. J. Econ. Asymmetries 2017, 15, 48–55. [Google Scholar] [CrossRef]
- Gao, X.; Guan, J.C. Characteristics of the network of scientific journals pertaining to Chinese patents. Phys. A Stat. Mech. Appl. 2009, 388, 4267–4272. [Google Scholar] [CrossRef]
- Sternitzke, C.; Bartkowski, A.; Schramm, R. Visualizing patent statistics by means of social network analysis tools. World Patent Inf. 2008, 30, 115–131. [Google Scholar] [CrossRef]
- Chang, S.B.; Lai, K.K.; Chang, S.-M. Exploring technology diffusion and classification of business methods: Using the patent citation network. Technol. Forecast. Soc. Chang. 2009, 76, 107–117. [Google Scholar] [CrossRef]
- Lee, P.-C.; Su, H.-N.; Wu, F.-S. Quantitative mapping of patented technology-the case of electrical conducting polymer nanocomposite. Technol. Forecast. Soc. Chang. 2010, 77, 466–478. [Google Scholar] [CrossRef]
- Whitley, E.A.; Galliers, R.D. An alternative perspective on citation classics: Evidence from the first 10 years of the European conference on information systems. Inf. Manag. 2007, 44, 441–455. [Google Scholar] [CrossRef]
- Marra, M.; Emrouznejad, A.; Ho, W. The value of indirect ties in citation networks: SNA analysis with OWA operator weights. Inf. Sci. 2015, 314, 135–151. [Google Scholar] [CrossRef] [Green Version]
- Alan, L.P.; Jan, Y.; Philip, S. Refining Search Terms for Nanotechnology. J. Nanopart. Res. 2008, 10, 715–728. [Google Scholar]
- Monaghan, S.; Lavelle, J.; Gunnigle, P. Mapping networks: Exploring the utility of social network analysis in management research and practice. J. Bus. Res. 2017, 76, 136–144. [Google Scholar] [CrossRef]
- Robins, G. Doing Social Network Research: Network-Based Research Design for Social Scientists; Sage: Washington, DC, USA, 2015. [Google Scholar]
- Zhu, X.M.; Woo, S.E.; Porter, C.; Brzezinski, M. Pathways to happiness: From personality to social networks and perceived support. Soc. Netw. 2013, 35, 382–393. [Google Scholar] [CrossRef]
- Johan, N.; Yuan, Z.; Xiao, Z. Innovation core, innovation semi-periphery and technology transfer: The case of wind energy patents. Energy Policy 2018, 120, 213–227. [Google Scholar]
- Yang, J.F.; Zhang, M.; Shen, K.N.; Ju, X.; Guo, X. Structural correlation between communities and core-periphery structures in social networks: Evidence from Twitter data. Expert Syst. Appl. 2018, 111, 91–99. [Google Scholar] [CrossRef]
Figure 1.
Patent collaboration trend from 2007 to 2016.

Figure 2.
Patent collaboration network map in smart grid (SG) field.

Figure 3.
Proportion of different types of applicants.

Figure 4.
Applicant composition of the patent collaboration network.

Figure 5.
Proportional distribution of different collaboration relationships.

Figure 6.
Collaboration relationship network map.

Figure 7.
The distribution of the number of applicants involved.

Figure 8.
Maximal connected subgraphs.

Figure 9.
Regional distribution of the patent cooperation network.


Table 1.
Characteristics of patent collaboration network structure.
| Network | Number of Network Nodes | Number of Network Connections | Network Density | Connecting Times | Average Clustering Coefficient | Average Path Length | Number of Connected Subgraphs | Number of Nodes of Maximal Connected Subgraphs | Number of Connections of Maximal Connected Subgraphs | Connecting Times of Maximal Connected Subgraphs |
|---|---|---|---|---|---|---|---|---|---|---|
| Patent collaboration network | 1043 | 2175 | 0.004 | 7307 | 0.745 | 2.635 | 93 | 818 (78.43%) | 1982 (91.13%) | 6901 (94.44%) |
| Random network | 1043 | 2192 | 0.004 | 2192 | 0.007 | 4.92 | - | - | - | - |
Table 2.
Important nodes of patent collaboration network.
| Degree Centrality | Closeness Centrality | Betweenness Centrality | Eigenvector Centrality |
|---|---|---|---|
| State Grid Corporation of China | State Grid Corporation of China | State Grid Corporation of China | State Grid Corporation of China |
| China Electric Power Research Institute | China Electric Power Research Institute | China Electric Power Research Institute | China Electric Power Research Institute |
| State Grid Jiangsu Electric Power Co., Ltd. | State Grid Jiangsu Electric Power Co., Ltd. | State Grid Shanghai Municipal Electric Power Company | State Grid Jiangsu Electric Power Co., Ltd. |
| State Grid Zhejiang Electric Power Co., Ltd. | State Grid Zhejiang Electric Power Co., Ltd. | Beijing Sifang automation Co., Ltd. | NARI Technology Co., Ltd. |
| NARI Technology Co., Ltd. | North China Electric Power University | South China University of Technology | State Grid Zhejiang Electric Power Co., Ltd. |
| North China Electric Power University | NARI Technology Co., Ltd. | Shanghai Jiaotong University | North China Electric Power University |
| XJ Group Corporation | State Grid Shanghai Municipal Electric Power Company | NR electric | NARI Group Corporation |
| State Grid Fujian Electric Power Company | Shanghai Jiaotong University | NARI Technology Co., Ltd. | State Grid Jiangsu Electric Power Company Research Institute |
| State Grid Shanghai Municipal Electric Power Company | NR Electric | Tsinghua University | XJ Group Corporation |
| State Grid Jiangsu Electric Power Company Research Institute | Beijing Sifang automation Co., Ltd. | XJ Electric Co., Ltd. | State Grid Tianjin Electric Power Company |
© 2019 by the authors. Licensee MDPI, Basel, Switzerland. This article is an open access article distributed under the terms and conditions of the Creative Commons Attribution (CC BY) license (http://creativecommons.org/licenses/by/4.0/).
Share and Cite
MDPI and ACS Style
Liu, W.; Tao, Y.; Yang, Z.; Bi, K. Exploring and Visualizing the Patent Collaboration Network: A Case Study of Smart Grid Field in China. Sustainability 2019, 11, 465. https://doi.org/10.3390/su11020465
AMA Style
Liu W, Tao Y, Yang Z, Bi K. Exploring and Visualizing the Patent Collaboration Network: A Case Study of Smart Grid Field in China. Sustainability. 2019; 11(2):465. https://doi.org/10.3390/su11020465
Chicago/Turabian StyleLiu, Weiwei, Yuan Tao, Zhile Yang, and Kexin Bi. 2019. "Exploring and Visualizing the Patent Collaboration Network: A Case Study of Smart Grid Field in China" Sustainability 11, no. 2: 465. https://doi.org/10.3390/su11020465
Note that from the first issue of 2016, this journal uses article numbers instead of page numbers. See further details here.