Article

Research on Hyperspectral Identification of Altered Minerals in Yemaquan West Gold Field, Xinjiang

1
College of Environment and Planning, Henan University, Kaifeng 475004, China
2
Laboratory of Geospatial Technology for the Middle and Lower Yellow River Regions,Ministry of Education, Henan University; Kaifeng, China
3
School of Business, Guizhou City Vocational College, Guiyang 550000, China
4
Beijing Institute of Geology for Mineral Resources, Beijing 100000, China
5
ChinaRS Geo-informatics Co., Ltd., Beijing 100000, China
*
Author to whom correspondence should be addressed.
Sustainability 2019, 11(2), 428; https://doi.org/10.3390/su11020428
Submission received: 19 November 2018 / Revised: 27 December 2018 / Accepted: 10 January 2019 / Published: 15 January 2019
(This article belongs to the Section Environmental Sustainability and Applications)

Abstract

:
Predictions of prospectivity based on remote sensing were developed using alteration mineral indicative hyperspectral mapping and remote sensing anomaly filtering, combined with geological characteristics and anomalous mineral field verification. Based on the results of the hyperspectral mineral mapping and the actual geological ground conditions, the results of mapping of altered minerals, such as chlorite, muscovite, kaolinite, and iron oxide were validated, and gold, silver, copper, nickel, and other geochemical anomaly areas were identified for verification work. The results of hyperspectral mineral extraction show that the mineral assemblage closely related to gold deposits in shear zones is muscovite + chlorite + epidote + kaolinite. This alteration mineral assemblage can be used as regional search criteria for shear zone gold mineralisation and was the basis for the discovery of mineralised hydrothermal alteration centres and delineation of four prospective targets. Established on a spectral prospectivity model of the study area, prospective ore-bearing areas have been delineated, which indicate the direction for further geological and mineral resource surveys.

1. Introduction

The application of hyperspectral remote sensing technology was originally used for geological mapping by geologists [1,2,3]. With the rapid development of high-tech, hyperspectral geological application technology has also made great progress [4,5]. Tong Qingxi et al. [6] and Li Zhizhong et al. [7] summarized the applications of hyperspectral geology and classified them into: (1) spectral differential techniques, (2) spectral matching techniques, (3) mixed spectral decomposition techniques, (4) spectral classification techniques, (5) spectral feature extraction, and (6) model methods. The visible and near infrared (VNIR) and shortwave infrared (SWIR) wavelengths region are mostly used in geological applications on the basis of previous literature [8,9,10]. Due to the different temperatures and spectral channels of minerals, thermal remote sensing can discriminate these regions efficiently.
Xinjiang is located on the western border of China and is sparsely populated and rich in mineral resources. From the point of view of industrial development in Xinjiang, mining has its own unique advantages and its impact on the environment is also small. It is apparent that rapid exploration and exploitation of mineral resources, such as copper mines in Xinjiang, and the transformation of resource advantages into economic advantages, have a very important social and economic role, while at the same time, promote economic development in the western region. Based on many years of research, the main minerals that can be identified by hyperspectral remote sensing in the VIS-SWIR spectral bands are iron and manganese oxides and hydroxides, hydroxyl-bearing minerals, carbonate minerals, and partially hydrated sulphates [8]. There are up to almost 40 of these minerals, and they include most of the alteration minerals and those related to mineralisation [7,9,10,11,12]. Given its advantages of being macroscopic, real-time, periodic, information-rich, and free, hyperspectral remote sensing technology has assumed a leading role in the rapid delineation and evaluation of favourable prospecting areas in a region. This has changed the traditional geological prospecting method, shortened the work cycle, reduced work costs, and improved the efficiency of prospecting [2,13,14,15,16,17]. In particular, hyperspectral technology combines the traditional two-dimensional imaging technology with spectroscopy technology to obtain both the physiographic information and the spectral information of the constituent features [18]. It is not just a case of resolving formations and lithologies, but can be refined to a specific single mineral or mineral abundance and crystal structure [19]. This represents a qualitative leap in remote sensing technology, to quantitatively or semi-quantitatively estimate relative alteration strength and alteration mineral content, and to predict mineralization [19,20,21,22]. Identification of hydrothermal alteration centres and delineation of mineralized alteration zones (or ore prospecting targets) play an important role in further, more targeted mineral exploration work [23].
In the development of an airborne imaging spectrometer, Australia’s imaging spectrometer HyMap has been recognized by the industry for its excellent SNR performance. Huo et al. used HyMap data to extract Al-rich muscovite and Al-poor muscovite in the copper-mine area of eastern Tien Shan [8]. Rodrigo dos Reis Salles et al. also used HyMap in Queensland to find the occurrences of goethite, kaolinite and montmorillonite and determine their zonal relationship with U-REE mineralization, particularly when combined with other exploration methods [24]. A relatively small amount of research has been carried out in China using HyMap data, especially based on the relationship between spectral absorption characteristics and mineral abundances. A flowchart of the study is presented in Figure 1; the overall workflow is as follows: (1) Data acquisition, (2) data pre-processing, (3) typical mineral spectral characteristics analysis, (4) preliminary extraction of altered mineral information, (5) hyperspectral mineral mapping, (6) abnormal information screening intensity analysis, and (7) field verification, (8) ore-prospecting prediction. The main research areas in this paper include: (1) Using spectral absorption characteristics and prior knowledge of mineral spectra to map altered mineral abundances, (2) analysing mineral abundances (sample spectra collected by field investigation) and spectral absorption characteristics, and (3) predicting potential deposits in the study area.

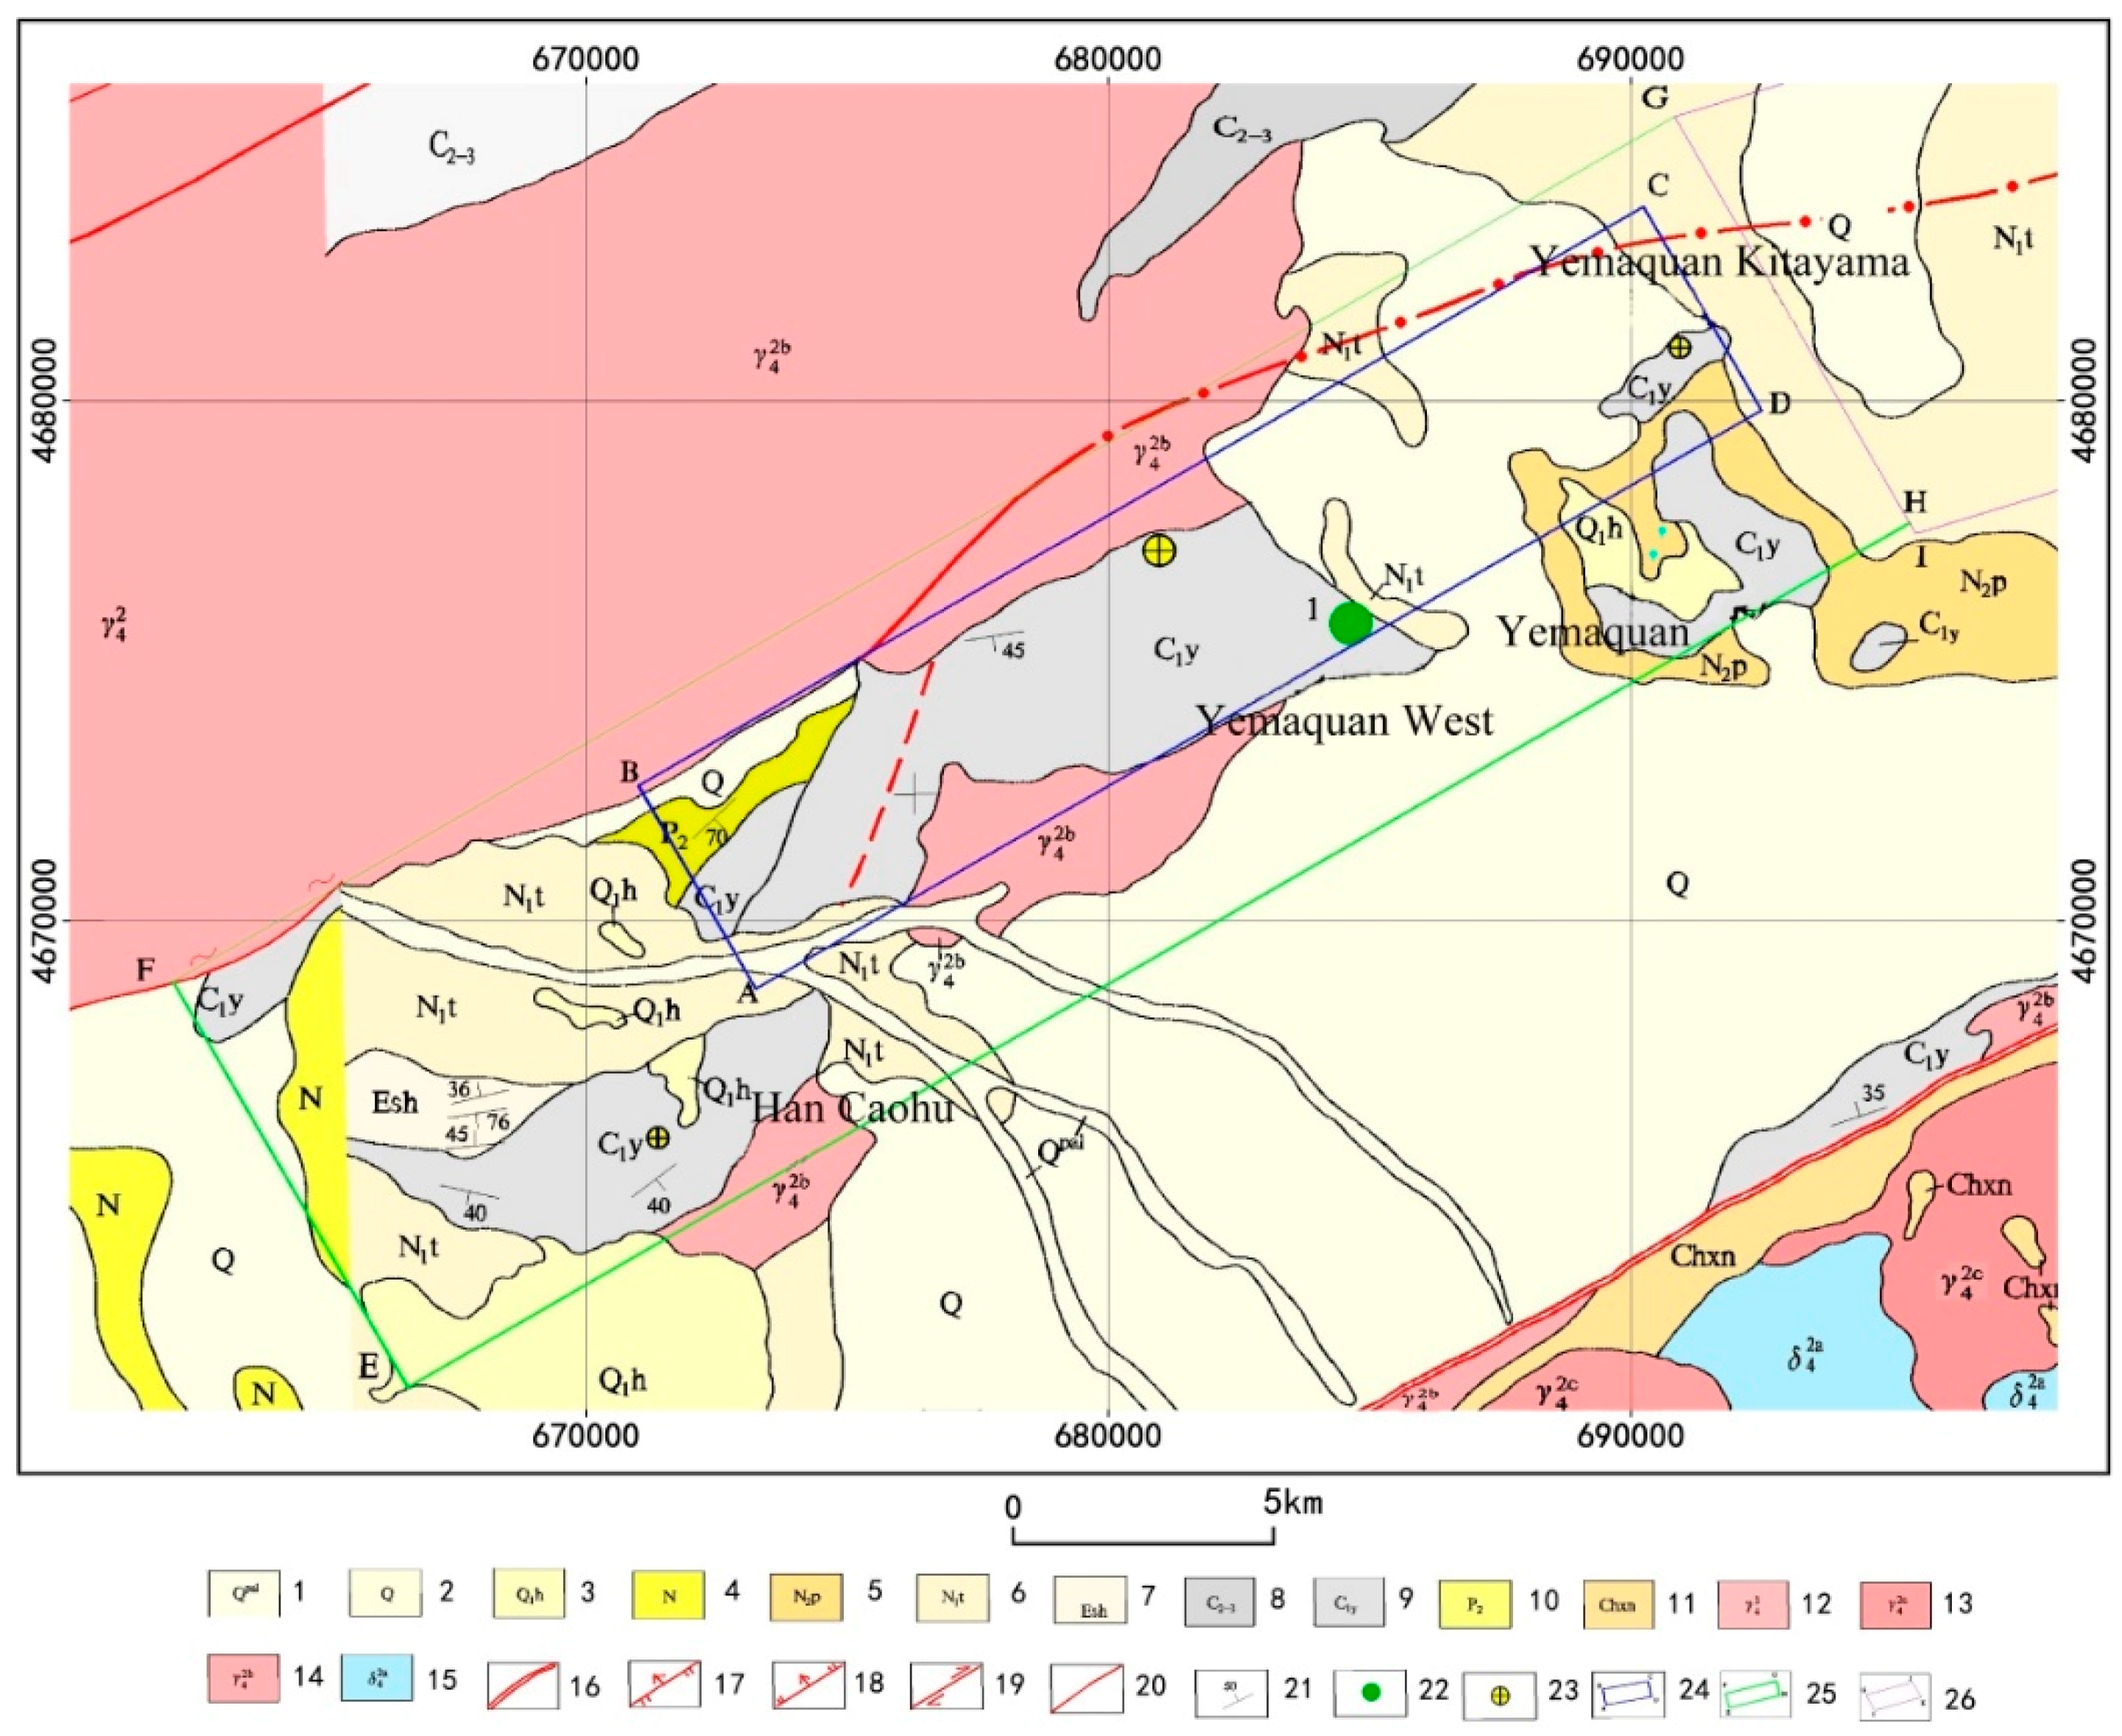
2. Geological Features of Study Area

The study area is located in the eastern Tianshan Gobi Desert in the hinterland of Eurasia, with flat terrain belonging to the Gobi Desert and low hills and wide valleys. According to the tectonic characteristics, volcanic assemblages, and genetic types of deposits, there are three belts from north to south: (1) Tai’an Lake copper-(molybdenum)-gold metallogenic belt; (2) Jueluotage iron-copper-nickel-gold -silver-molybdenum metallogenic belt; and (3) Zhongtian Shan silver-polymetallic- iron-copper-(nickel)-gold metallogenic belt. Amongst these, the study area is located on the Dacanhang subsidiary copper-gold belt of the Tai’an Lake copper-(molybdenum)-gold tertiary metallogenic belt (Figure 2). In addition to the Quaternary surficial sediments, the exposed strata are mainly composed of the lower Carboniferous Mashan Su Formation and the Oligocene-Miocene Taohuanyuan Formation.
  • Gradual—Miocene Peach Tree Group (E3-N1)t
    Mainly exposed in the eastern part of the mine, lithology is orange red, maroon silty mudstone.
  • Lower Carboniferous Masamitsu Upper Member (C1y2) can be divided into four lithologic layers:
    a.
    C1y2(λ’tf+mcg): Upper Silurian, light grey rhyolite, tuff, black-grained metamorphic sandy conglomerate in the lower Carboniferous Yaman Su Formation, located in the transitional zone between the northern rock mass and the central ductile shear zone. Locally, faded alteration of the rock is obvious, and there are common veined zones;
    b.
    C1y2(st+ss): Upper lower Carboniferous Masan Su Formation, maroon, brownish siltstone sandwiched between grey and brown sandstone layers with quartz veins locally and ductile shear zone/alteration zones in this area;
    c.
    C1y2ls: Lower Carboniferous Yaman Sue Group, grey, brown grey limestone layer;
    d.
    C1y2(tf’ss): Upper Silurian, light grey green, brown-grey tuff, sandstone of lower Carboniferous Yaman Su Formation with local grey-green basalt and andesite layers;
    e.
    C1y2(ss’cg): Upper Carboniferous Yaman Su Formation is grey, light grey green, brown grey, greyish white sandstone and conglomerate.
  • Lower Carboniferous Yaman Sue Group Lower (C1y1), less exposed, not a subcrop layer.
C1y1: lower Carboniferous Yaman Su Group Lower, ash, light greyish green, brown sandstone layer, local boulder conglomerate, limestone thin layers or lensoidal bodies.

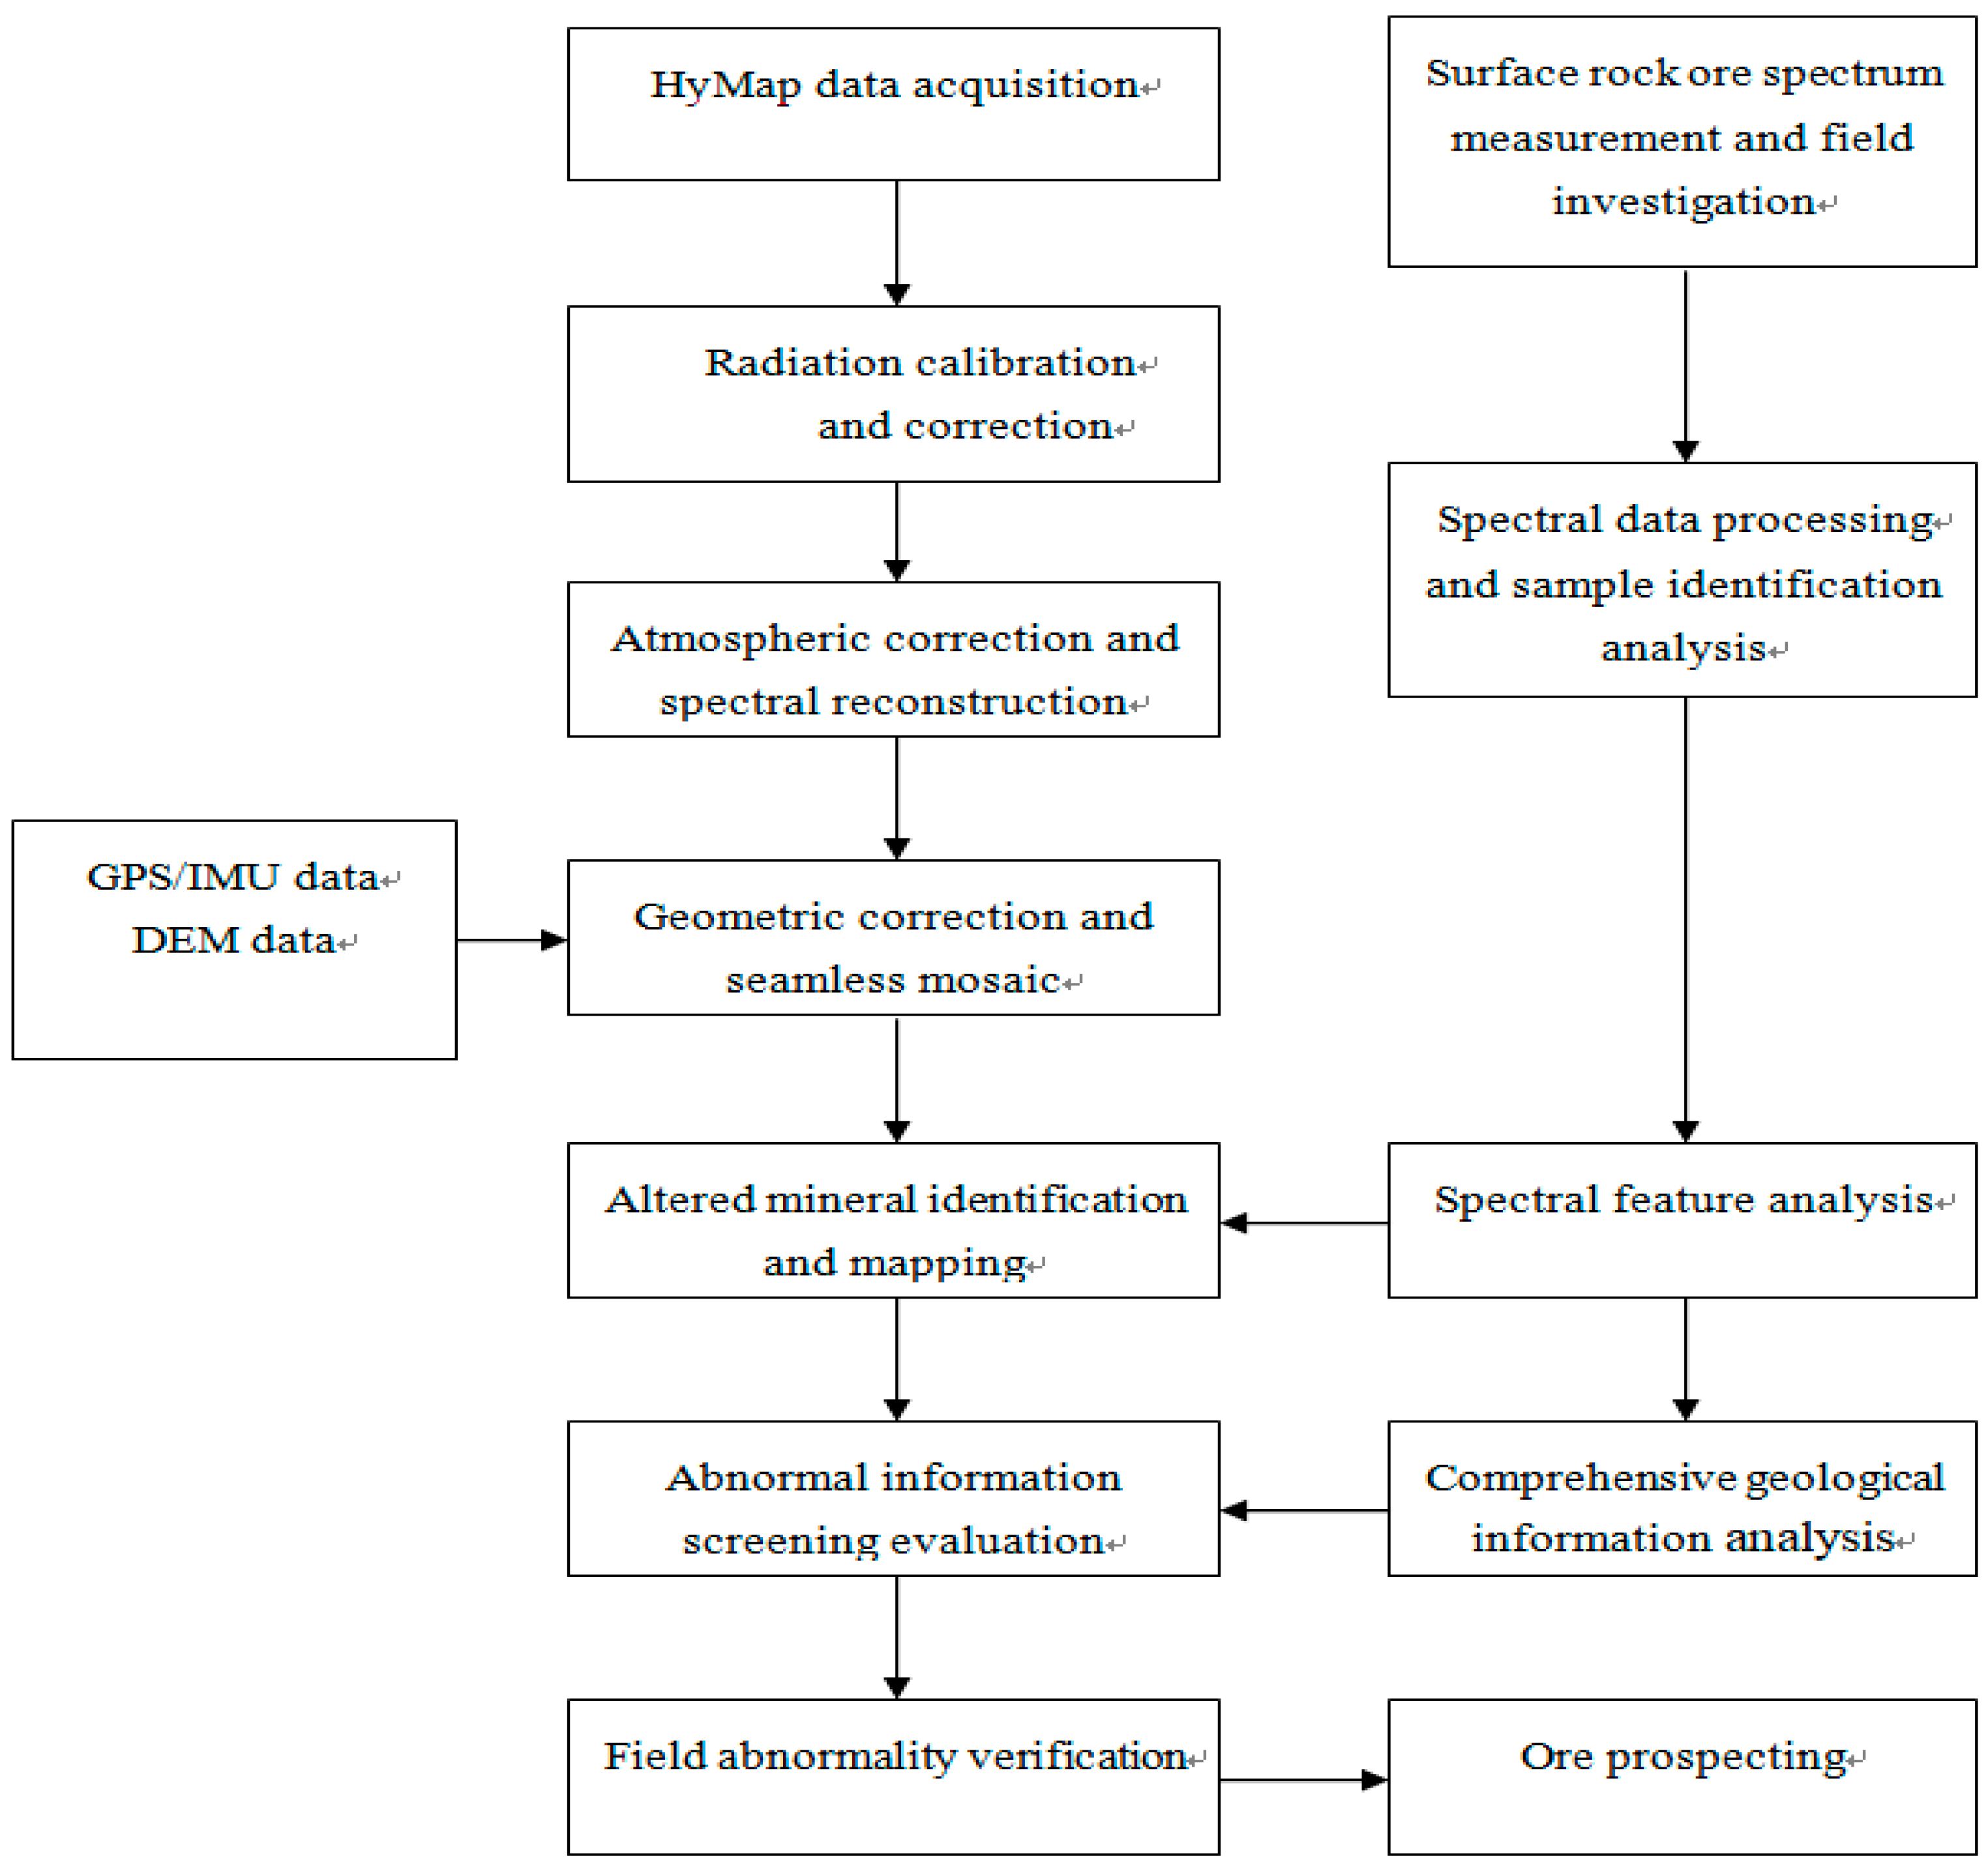
3. Data Acquisition and Processing

3.1. Hyperspectral Data Pre-Processing

The study area covers approximately 280 km2. The main use of the HyMap airborne imaging spectrometer is to carry out 12-B3814 aircraft-operated, airborne hyperspectral data acquisition. The spectral configuration of the Hy Map sensor includes four spectral modules consisting of 32 bands each, totalling 128 spectral bands. The flight obtained original data is composed of DN values for each band. HyMap comes with hyperspectral data processing software HyCorr and ENVI that use a single-band imaging system for radiation calibration and atmospheric correction (spectral reconstruction) processing. This generates single-band radiance data and reflectance data products of each track of the study area. The HyMap datasets used in the study include 125 bands without the three bands influenced by water vapor and aerosol; the detailed technical parameters are listed in Table 1. At the same time, using the GPS data and IMU attitude data, and based on the DEM data of the survey area, a single-band systematic geometric correction file (i.e., glt file) is generated to carry out geometric correction and geocoding work for each navigation track.
Due to the difference of flight direction, the shadow of the terrain, the illumination of the sun, and the bidirectional reflectance distribution function (BRDF), the contrast and brightness change among different tracks of images are caused by the change in flight direction. This obviously impacts post-processing and graphics. In mosaics, the different stitching images need to be seamlessly spliced so that the brightness, contrast, and colour of different tracks are unified, and the transitions are natural (Figure 3).

3.2. Ground Spectral Data Collection

Terrestrial spectral measurement provides certain surface spectral data support for the processing of airborne hyperspectral data [25], and provides guidance for the extraction of alteration mineral information from airborne hyperspectral data. Spectral Evolution’s PSR spectrometer was used to measure and collect the surface spectral data of rocks of different lithologies and different alteration types in favourable geologic units in the study area. The main technical parameters of PSR can be described as follows: the working spectral region ranges from 0.35 μm to 2.50 μm, the spectral resolution is 3.50 nm, the spectrum sampling interval is 1.50 nm, it enables full spectral range data acquisition of 100 milliseconds, up to 10 acquisitions per second. The test samples primarily include rock, and different crystal forms of the same type of mineral can be distinguished. The favourable geologic units for prospecting work in the study area include the lower Carboniferous Mansou Su Group (C1y) quartz porphyry (λπ) or diabase bodies, sillimanite bodies (βμ), and so on. In addition, many Au and Cu geochemical anomalies are distributed in the area, which are mainly clustered in known deposits and near ore mineral occurrences or along ductile shear zones and fault structures. Therefore, this survey considers ductile shear zones and faults, structural belts, and other structural development sites.

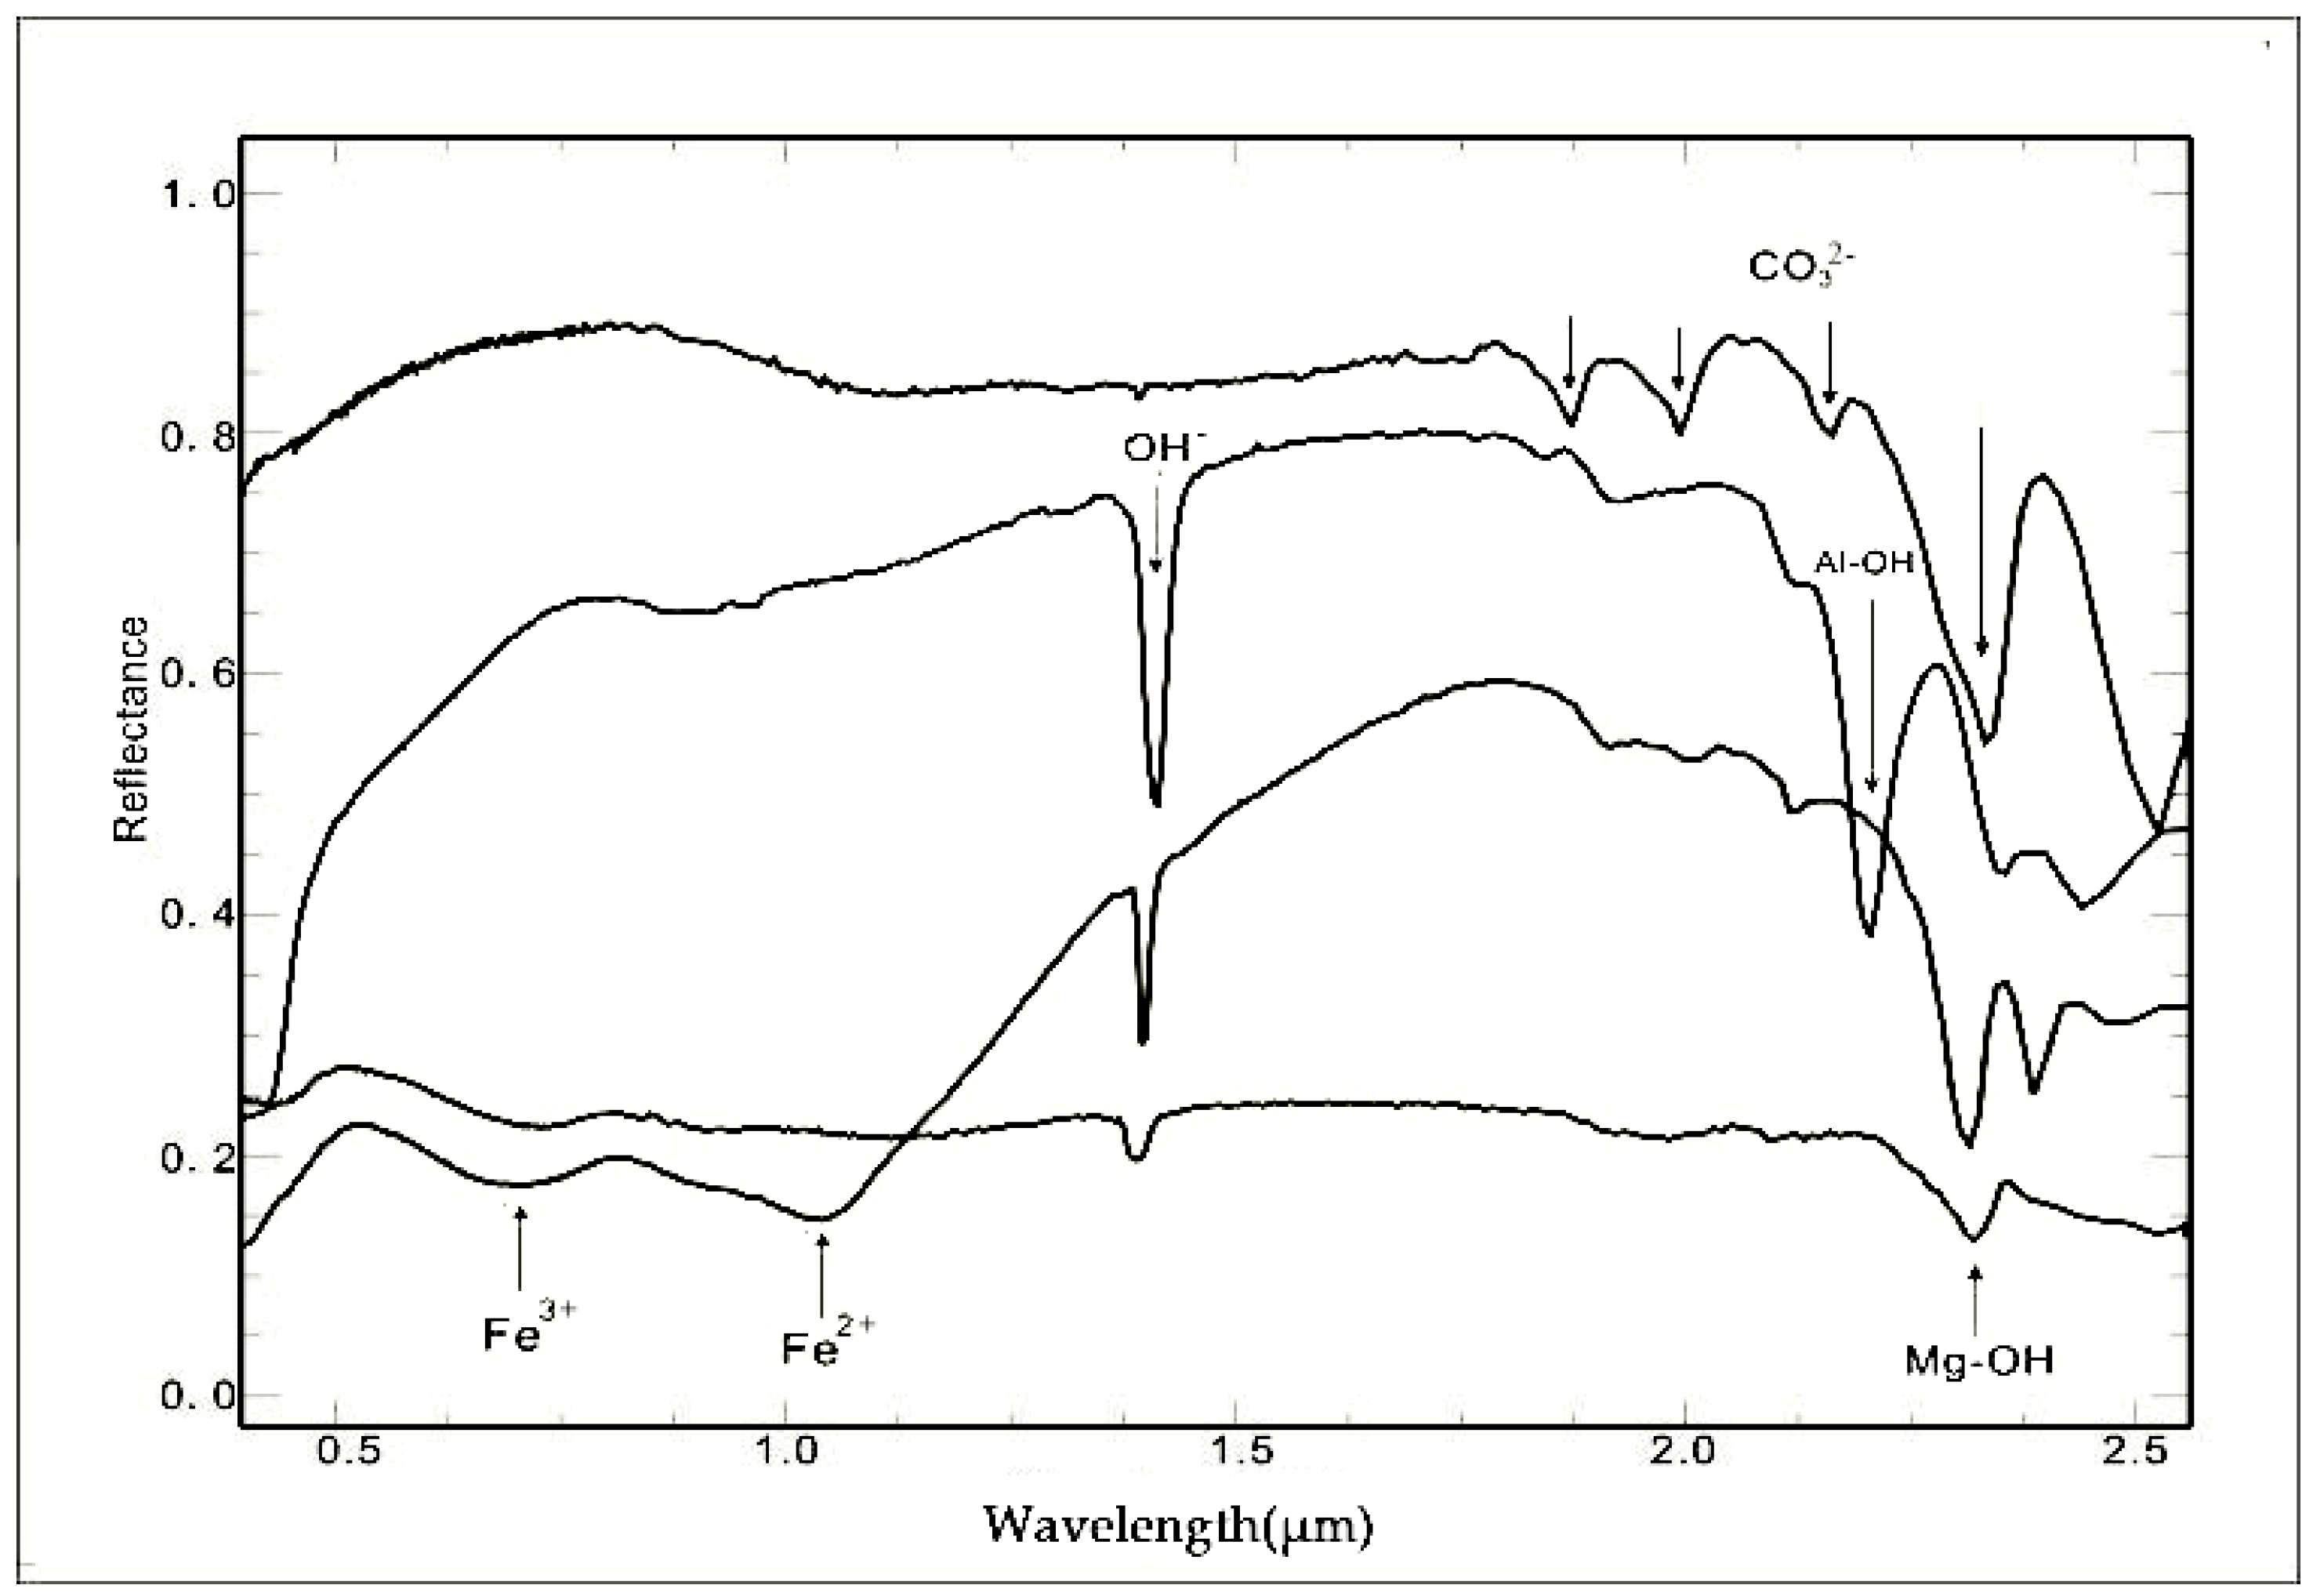
3.3. Analysis of Mineral Spectral Characteristics in the Study Area

The visible and near infrared (VNIR) and shortwave infrared (SWIR) spectral region play an important role in the identification and study of minerals and analysis of their components. By using the diagnostic spectral absorption features of molecular bonds, the minerals and their degree of crystallinity can be identified and distinguished. Therefore, single minerals could be discriminated from phyllosilicate (e.g., clay minerals, chlorite), silicate minerals containing OH molecular bonds could be identified (e.g., epidote, hornblende, montmorillonite, muscovite), and sulphate minerals (e.g., alunite, jarosite) and carbonate minerals (calcite, dolomite, malachite) could also be identified. The temperature and chemical environment for the hydrothermal alteration of minerals during the mineralization process can be identified from the degree of crystallinity of a mineral. Different degrees of mineral crystallinity cause infrared absorption peaks at different positions and of different shapes [3,8]. Most alteration minerals show most diagnostic absorption features in the spectral range of 1.30 μm to 2.50 μm; the corresponding diagnostic absorption features are given in Table 2. The characteristics of the spectral curves of each typical mineral are summarized, laying a theoretical foundation for further mineral mapping.

4. Mineral Mapping

The mineral mapping of the study area is based primarily on the diagnostic absorption band measurement method [17,26]. Based on a programmable feature extraction processing channel, the script for this channel is designed for extracting spectral parameters (absorption depth, wavelength, width, asymmetry). First, the image spectral data are pre-processed (mean normalization, de-continuation, convolution smoothing), and second, the feature parameter extraction is done (feature depth, feature area, feature width, minimum wavelength, ratio, arithmetic, and logic operations) (Figure 4) [27,28,29,30]. Therein, the absorption band-position is located at point B, which has the minimum value of spectral reflectance in the whole spectral region. In addition, the spectral absorption band-depth H is defined as the distance between point B and the non-absorption baseline, which passes through the two shoulders A and C.

4.1. Typical Altered Mineral Spectral Characteristics

Metal cations affect the visible light characteristics of altered minerals, while several functional groups vibrate in the near infrared range, mainly including Fe2+, Fe3+, Al-OH, Mg-OH, OH and CO32− [31,32,33,34]. (1) Spectral absorption characteristics of iron ions: The characteristic absorption peak of Fe3+ ions is mainly 0.60–0.80 μm (Figure 5), the centre position is about 0.70 μm, while the characteristic absorption peak of Fe2+ ions is mainly 0.90–1.50 μm, and the centre position is about 1.20 μm [35,36,37].
(2) Spectral absorption characteristics of hydroxyl groups: Some hydrous minerals contain hydroxyl groups that have absorption peaks around 1.40 μm and 1.90 μm [38,39]. The most significant characteristic absorption peak of Al-OH minerals is the 2.15 to 2.22 μm peak, while some secondary absorption peaks on both sides constitute a “dual structure”. The mineral absorption characteristics of Al-OH containing minerals are shown in Table 3. The most significant absorption peak of Mg-OH minerals is in the region of 2.30 to 2.39 μm. The absorption peak positions of minerals containing Mg-OH are shown in Table 4.
(3) The spectral absorption characteristics of the CO32− group: the fundamental absorption peak of the CO32− group vibration is 5.13 to 6.45 μm, and there are four secondary frequency doubling absorption peaks around 1.88 μm, 2.00 μm, 2.16 μm, and 2.35 μm. The absorption peak at 2.35 μm is the main absorption peak, and exhibits deep absorption depth and a relatively unusual, steep, asymmetric peak shape (Table 5).

4.2. Focus on Extracting Common Altered Minerals

The Al-OH class includes muscovite, pyrophyllite, kaolinite, montmorillonite, and hydroxyl-containing sulphates (jarosite and alunite).
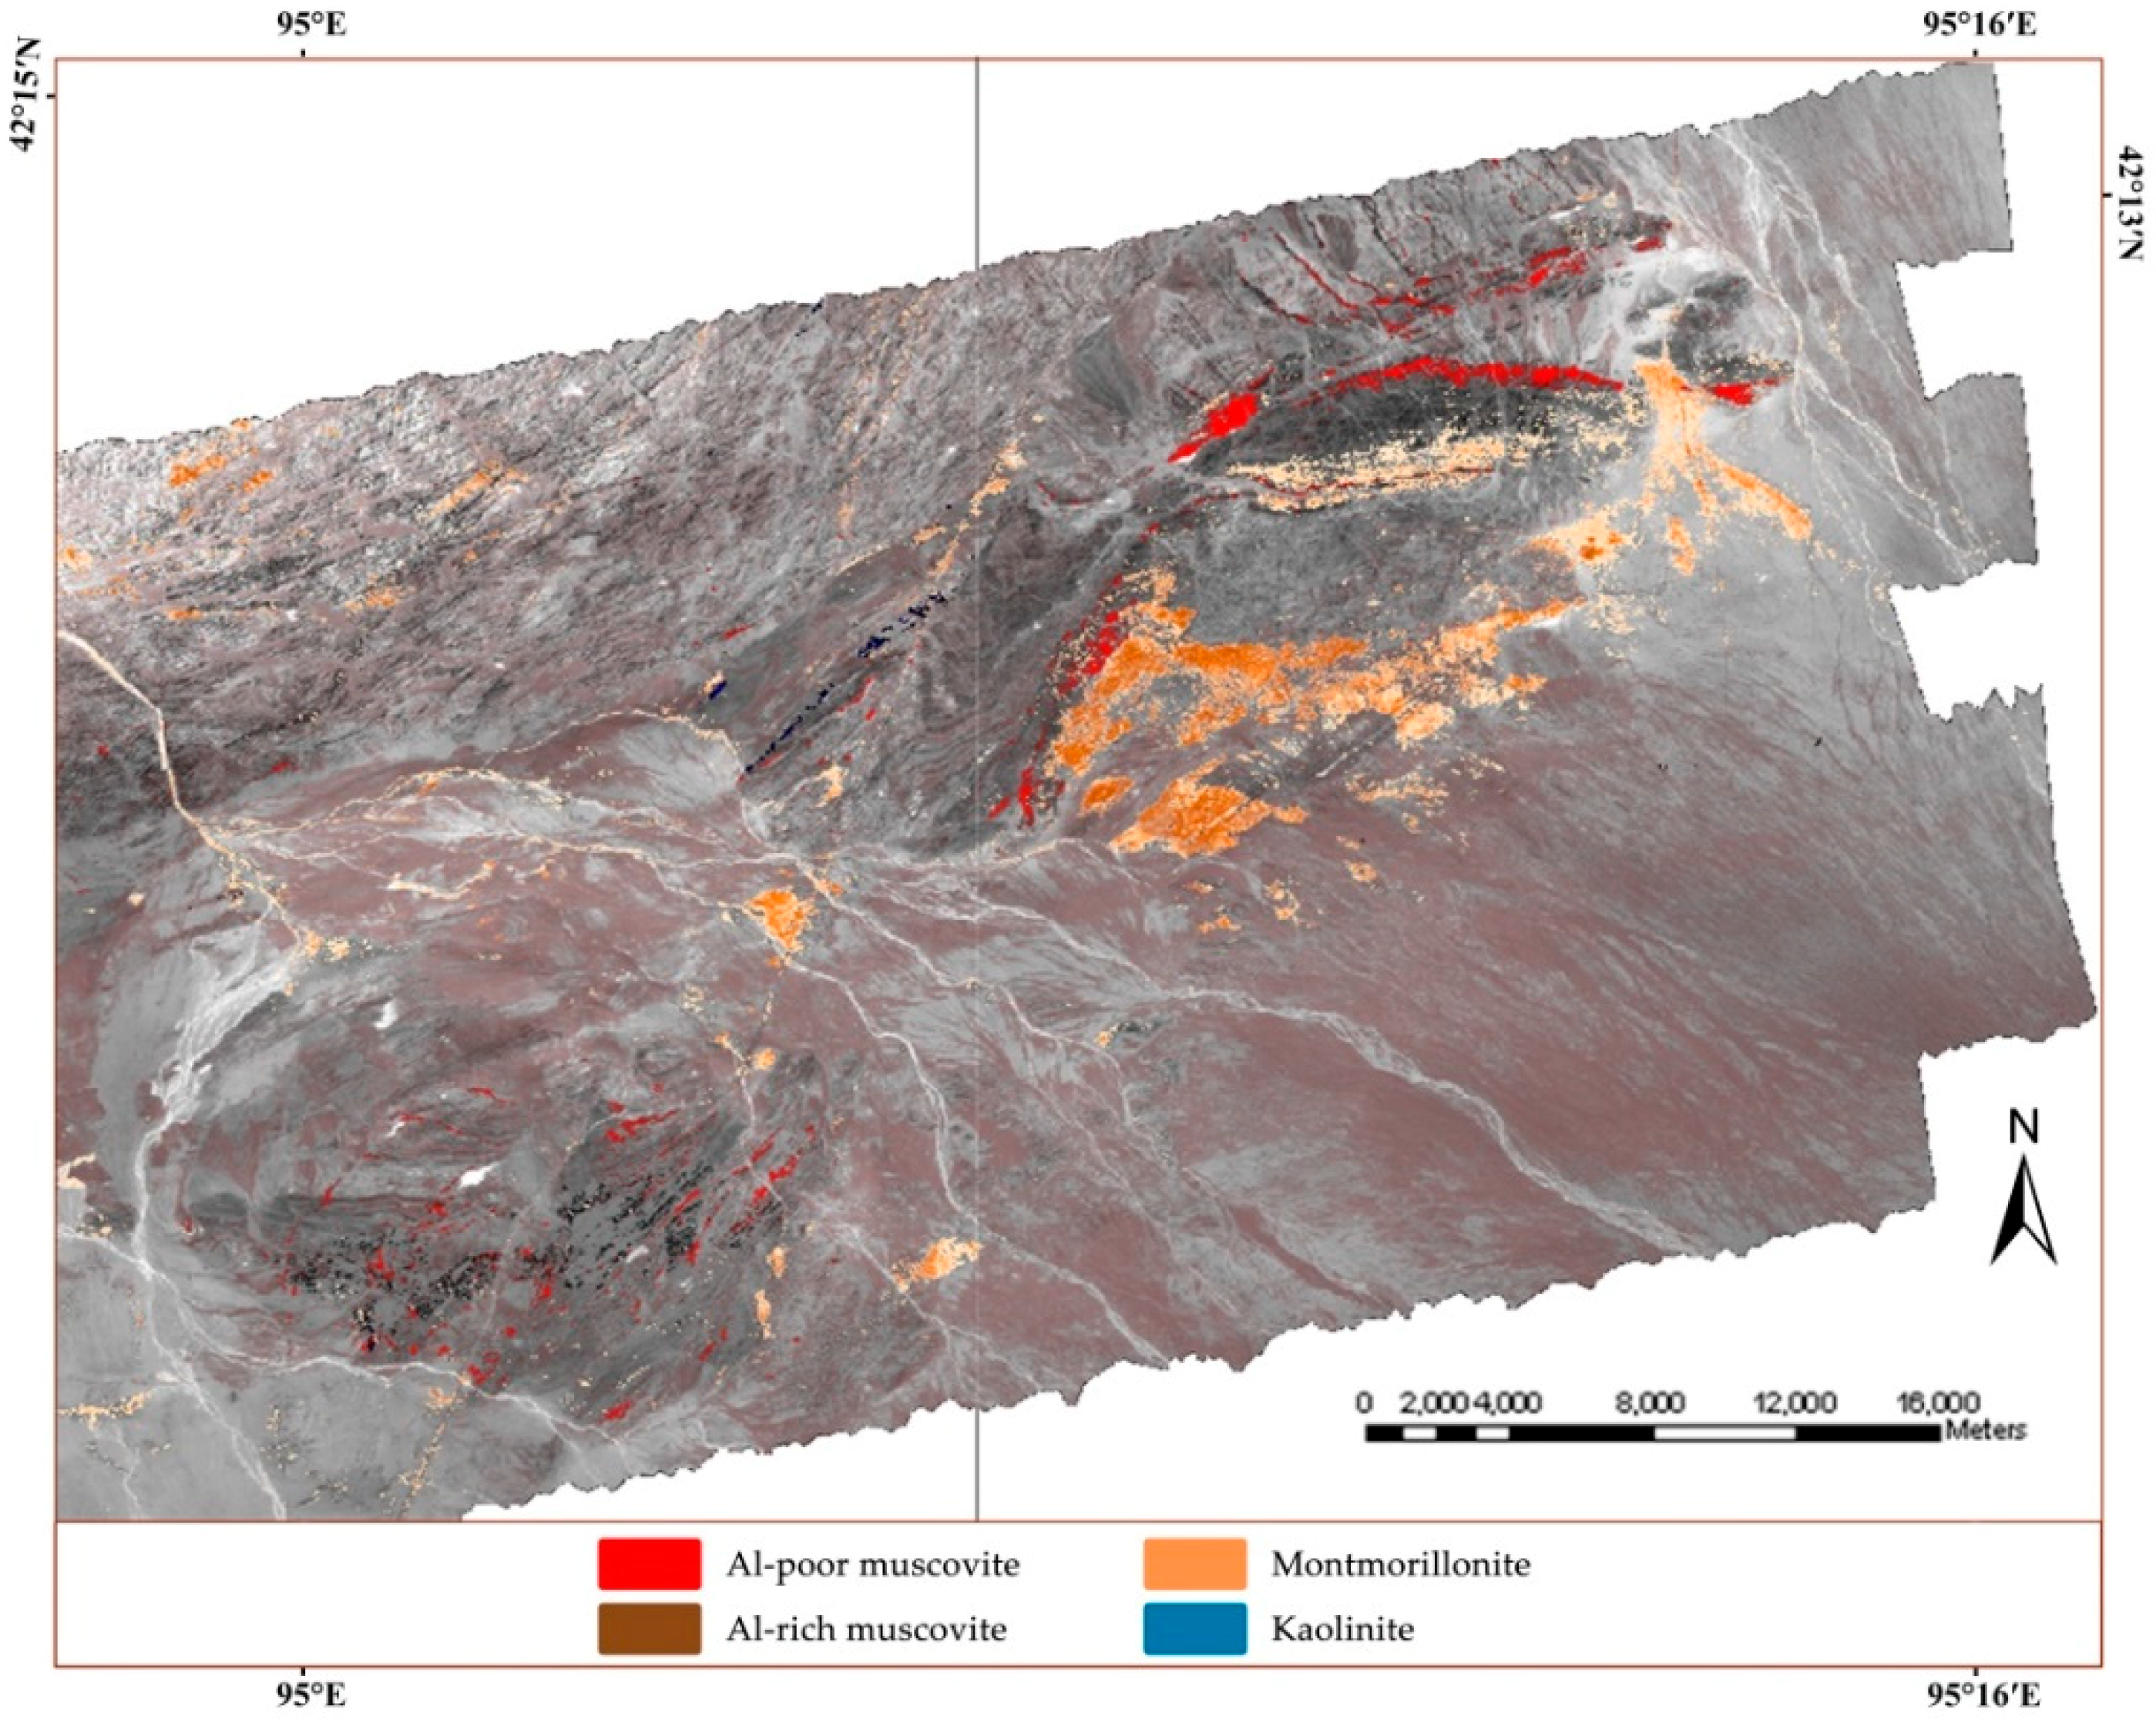
  • This group of minerals has a common feature around 2.20 μm, which is the first parameter of information extracted (the depth of the 2.20 μm absorption spectrum is greater than the threshold value of Al-OH minerals).
  • Absorption near 2.16 μm and 2.34 μm is the secondary parameter, and the group of minerals is divided into two subgroups: “kaolinite + pyrophyllite” (2.16 μm > threshold) and “muscovite + montmorillonite + sulphate” (2.16 μm < threshold).
  • Taking the relative intensity of the two absorption bands of 2.16 μm and 2.20 μm as parameters, the pixels in the image are mainly kaolinite (2.16 μm weaker than 2.20 μm) and pyrophyllite (2.16 μm stronger than 2.20 μm). Note: Cells with a roughly equal mixture of the two minerals will not be considered for unmixing.
  • Taking the 2.34 μm absorption band as a parameter, the pixel containing no muscovite (2.34 μm absorption < threshold value) is separated from “muscovite + montmorillonite + sulphate”.
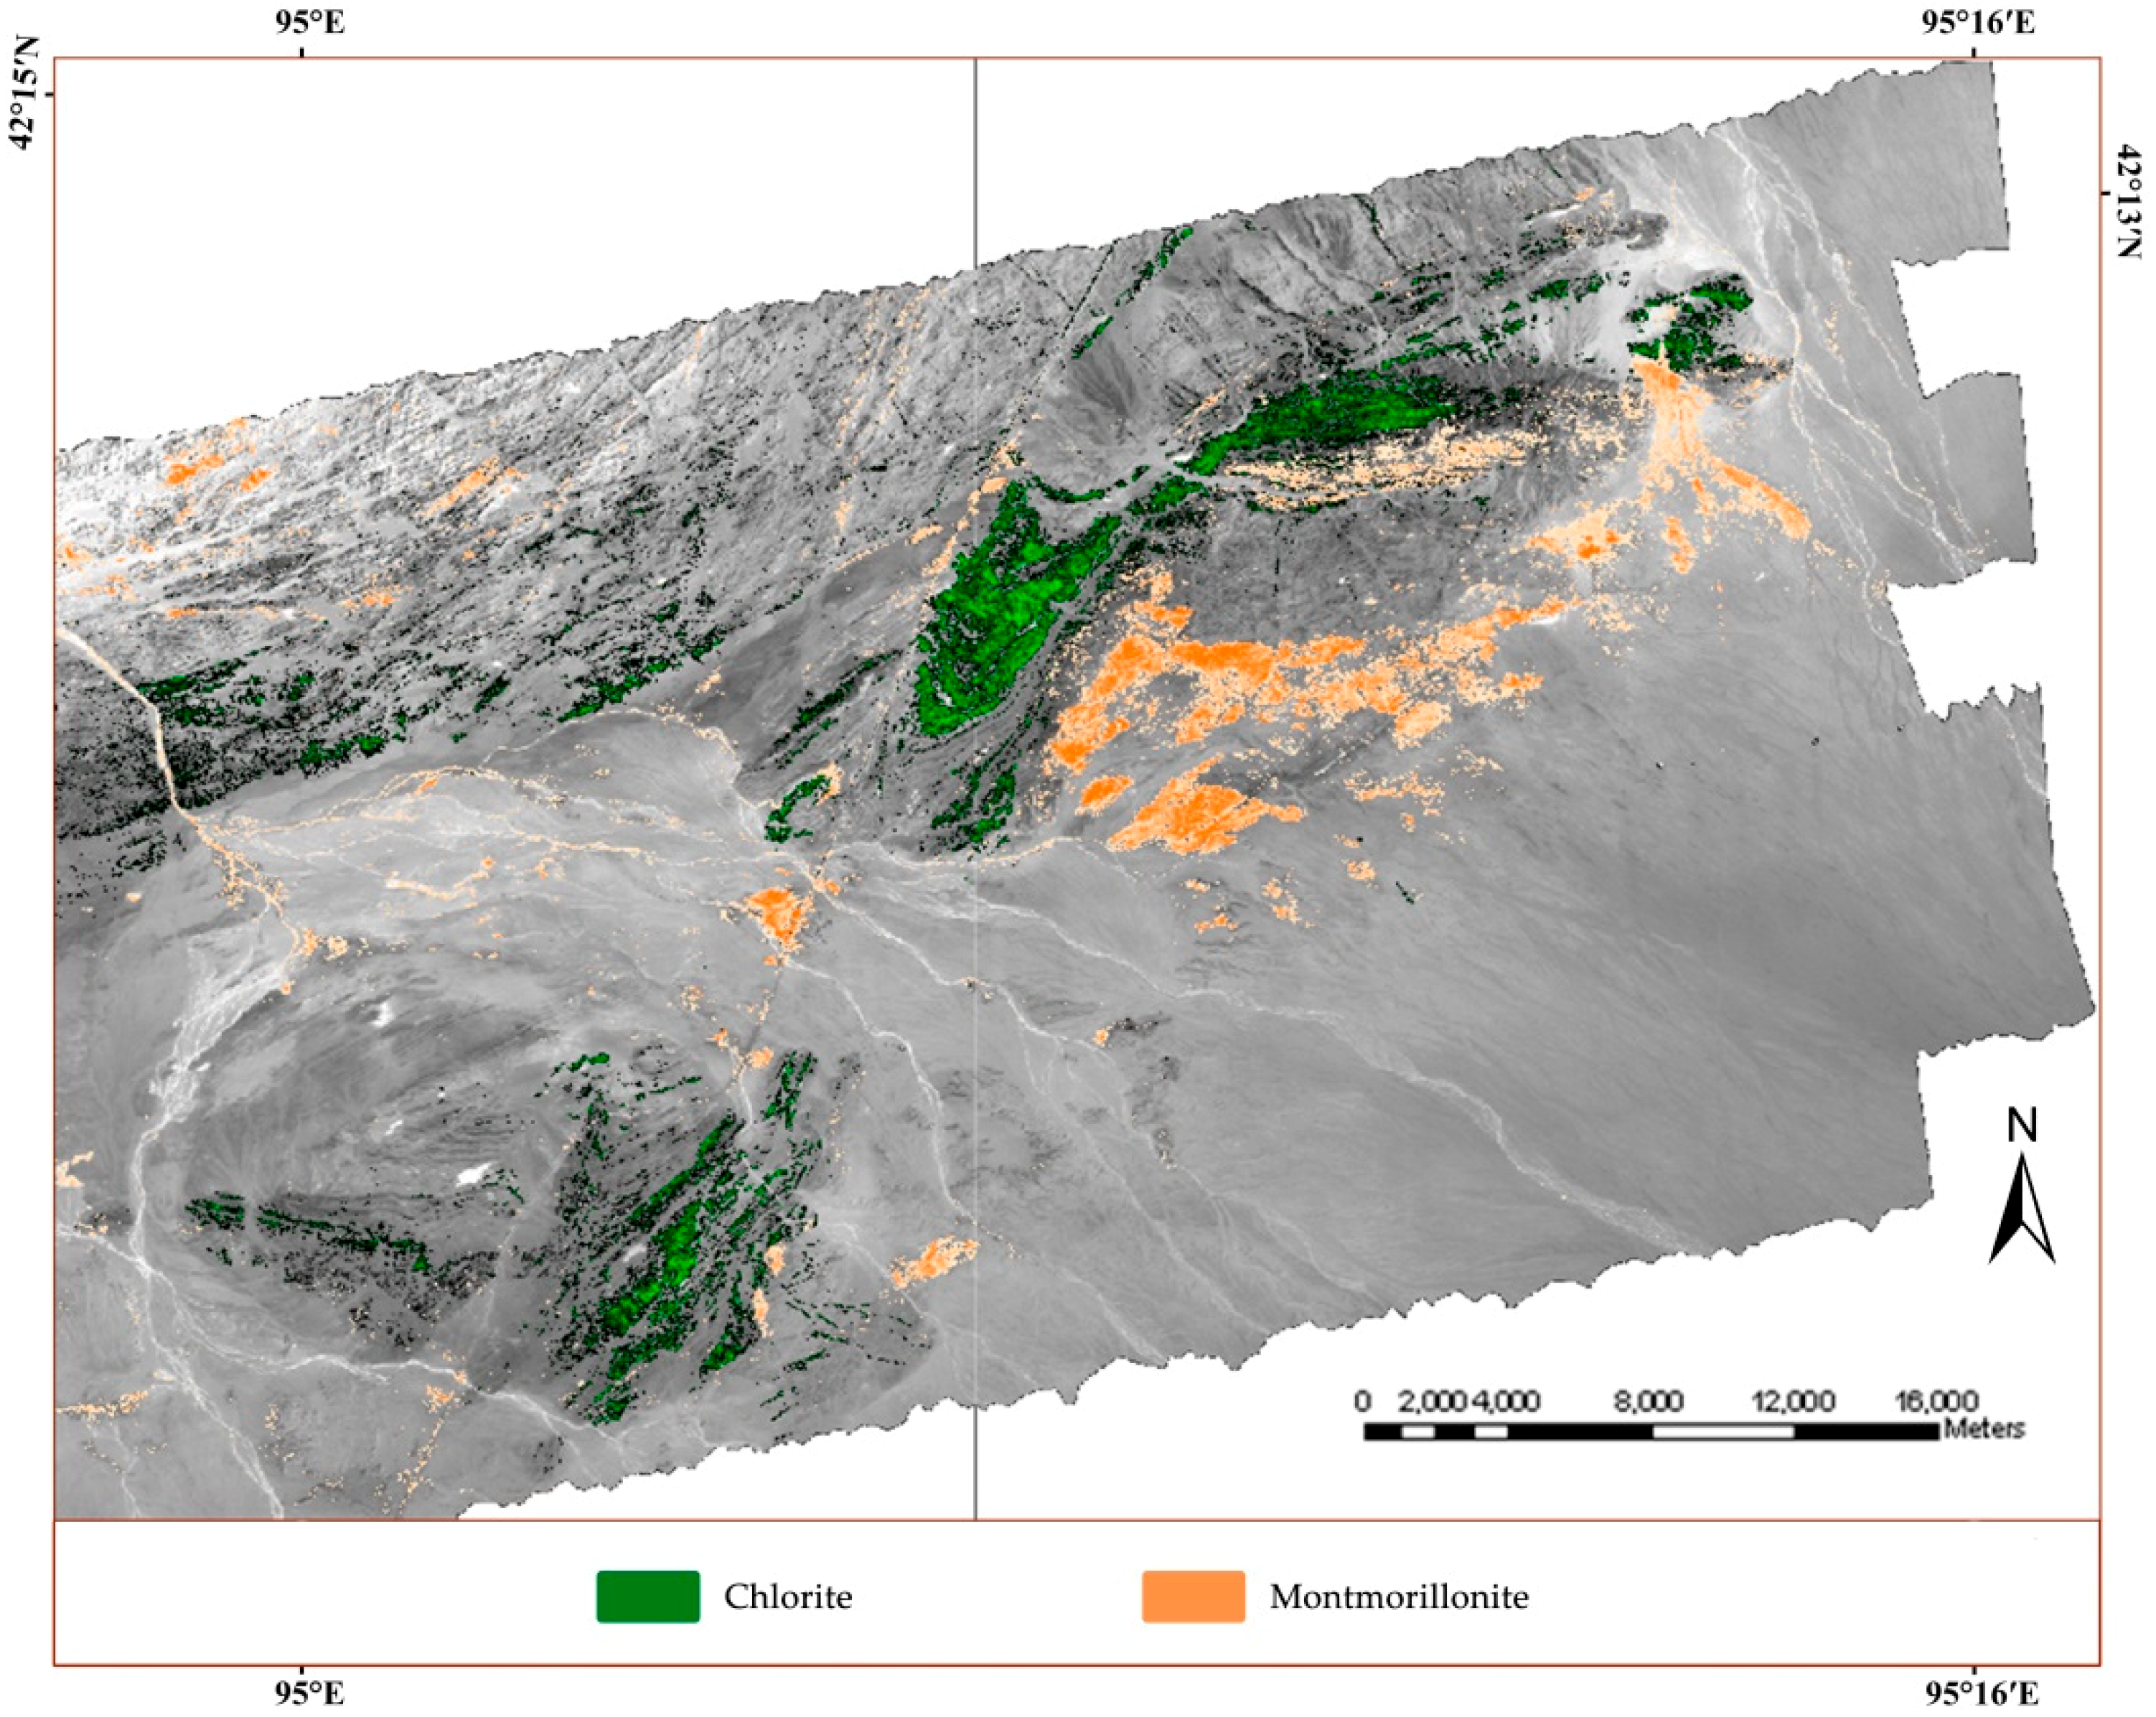
  • When there is chlorite (absorption at 2.25 μm), it is necessary to adjust and eliminate the contribution of chlorite to 2.34 μm absorption.
Fe-OH class include chlorite, epidote, and actinolite (very similar in spectrum, especially the airborne hyperspectral data).
  • Separation of Al-OH minerals with Fe-OH absorption at 2.25 μm as a first-order parameter.
  • Use 2.34 μm, 2.385 μm, and 2.20 μm absorption as auxiliary parameters to separate the minerals in the group (not necessarily fully separated).
  • Using 2.20 μm as an auxiliary parameter, calculate and separate the contribution of Al-OH minerals to 2.34 μm.
  • When a mineral cannot be completely separated from the superimposed mineral, only a high content of the mineral pixel is extracted. This is usually the case with epidote.
CO3 class: carbonate, including calcite and dolomite.
  • The high-absorption value of 2.34 μm and the high ratio of 2.34 μm to 2.25 μm are used as parameters to extract high-carbon carbonate pixels, namely carbonate sedimentary rocks such as limestone.
  • Low levels of carbonate are not extracted (e.g., carbonates produced in basic volcanic rocks and intergrown with chlorite).
Iron oxide class:
  • Extraction of ferric oxide minerals is carried out using a Fe3+ spectrum between 0.70 μm and 0.90 μm.

4.3. MTMF Algorithm

The mineral mapping is mainly divided into three parts: (1) endmember selection, (2) mineral identification and mapping, and (3) mineral distribution map production. Endmember selection is divided into two parts: feature extraction and endmember spectral selection [40,41]. The feature extraction uses the minimum noise separation transform (MNF transform) method, and the endmember spectrum is selected using the pure pixel index calculation (PPI). This mapping uses the hybrid tuning matched filter (MTMF) algorithm [42,43,44,45]:
ω = i = 1 N p i e i + ε
i = 1 N p i = 1     0 p i 1
where ω is the spectral vector in the image of any band number; N is the number of endmembers in the image; P is the coefficient vector = P (P1, P2, ..., PN)T; Pi represents the proportion of the end elements ei in the pixel ω; ei is the endmember vector; and ε is an error term.
The Mixed Modulation Matched Filtering (MTMF) is a mapping method that combines a linear spectral mixture model with a matched filtering technique [46,47,48,49]. It has the advantage of matching filtering without the knowledge of other background endmembers, and the linear mixed pixel decomposes the constraint that the content of each endmember in one pixel is positive and the sum is 1 [23,50,51], thus reducing the detection of minerals. Limits can detect trace minerals in rocks that cannot be detected by other methods [52,53]. The processed object of the method is a dimensionally reduced image, and the obtained mapping result includes an MF image and an infeasibility image in units of sigma noise. The MF image is obtained by spectral matching using matched filtering. Using endmember mineral matching scores (MF scores), the pixels in the image are brightened to match the distribution in the infeasibility image. The higher the brightness of the pixel, the less likely the pixel is to correspond to the target endmember, combined with the MF image and impossibility. The image is analysed and processed to obtain the mineral distribution result after removing the “false positive” pixels. The higher the degree, the higher the degree of matching with the endmember. The unique infeasibility image of MTMF is similar to a mineral endmember.
Based on the actual geological conditions of the complete study area, the comparison between the field measured spectra and the typical mineral spectrum curves shows that the types of alterations in the study area include ferritization, sericitisation, chloritization/epidotization. Eight minerals were proposed in the Yemaquan Gold Field, including: hematite + goethite, muscovite (including aluminium-rich and aluminium-poor), kaolinite, montmorillonite, chlorite, epidote, and hornblende.

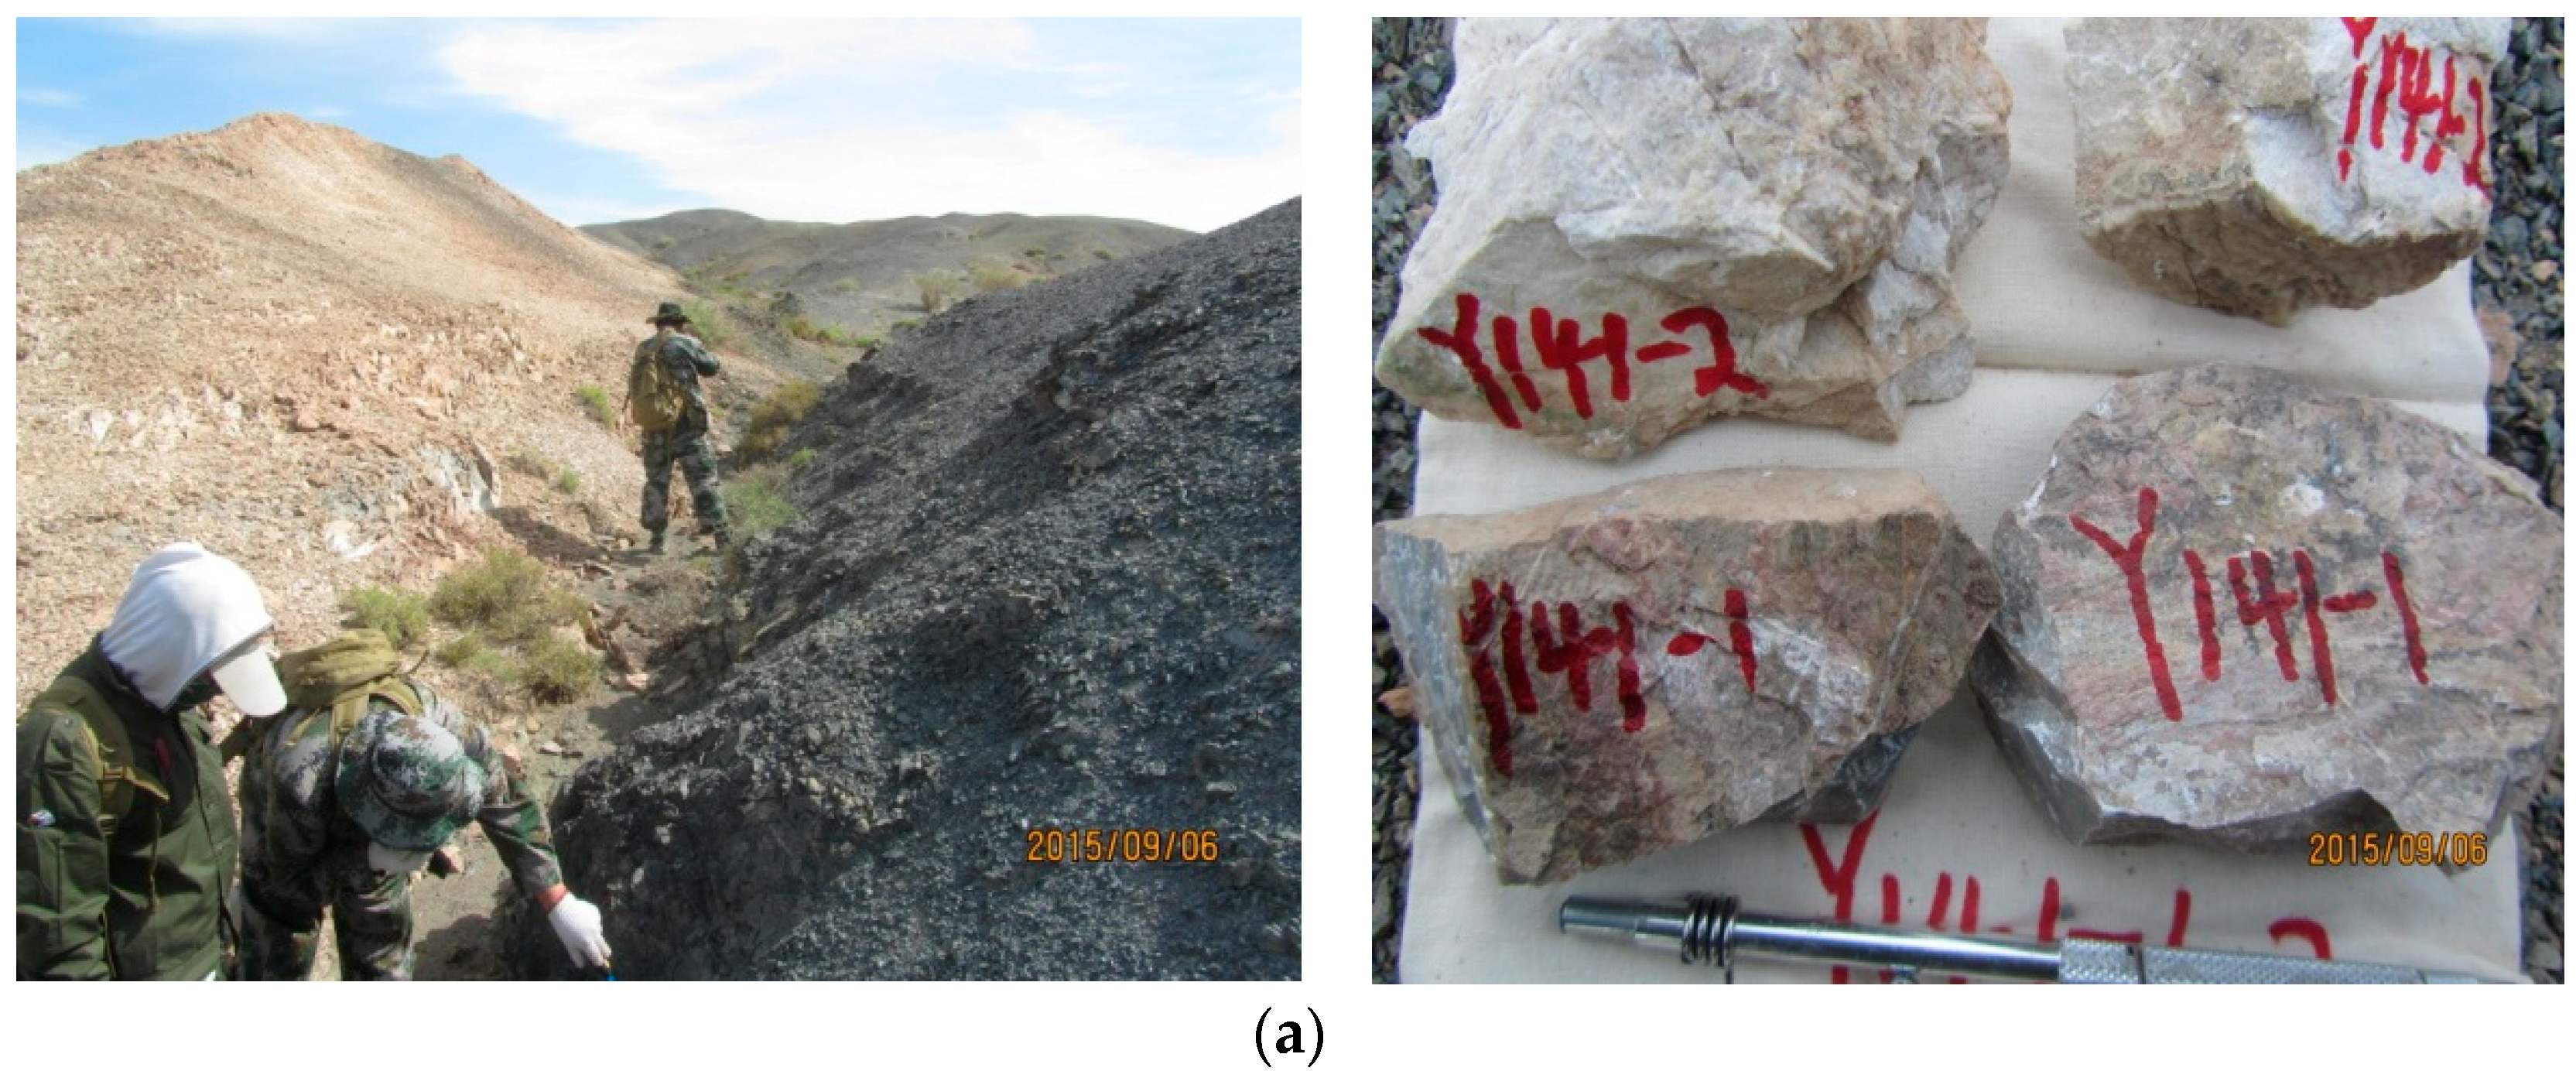
4.4. Field Investigation and Verification

Based on the results of hyperspectral mineral mapping and the actual geological ground conditions, the mapping results of altered minerals, such as chlorite, muscovite, kaolinite and iron oxide were validated, and the gold, silver, copper, nickel, and other geochemical anomaly areas underwent verification work, with 172 samples collected and 860 spectra measured. For example, Figure 6 and Figure 7 present the verification of muscovite. According to the field verification of statistics of various alteration minerals in the Yemaquan Gold Field of Xinjiang, there are 37 verification points for the hematite + goethite alteration combination, with the recognition rate at 100% and an accuracy of 96.23%. There were 37 verification points for chlorite, with the recognition rate at 95.55% and an accuracy of 94.59%. There are 45 verification points for epidotite, with the recognition rate at 100%, and an accuracy of 93.33%. There are 12 verification points for Hornblende, with the recognition rate at 100%, and an accuracy of 93.33%. There are 33 verification points for muscovite, with an identification rate of 94.57% and accuracy rate of 93.94%.

5. Results and Discussions

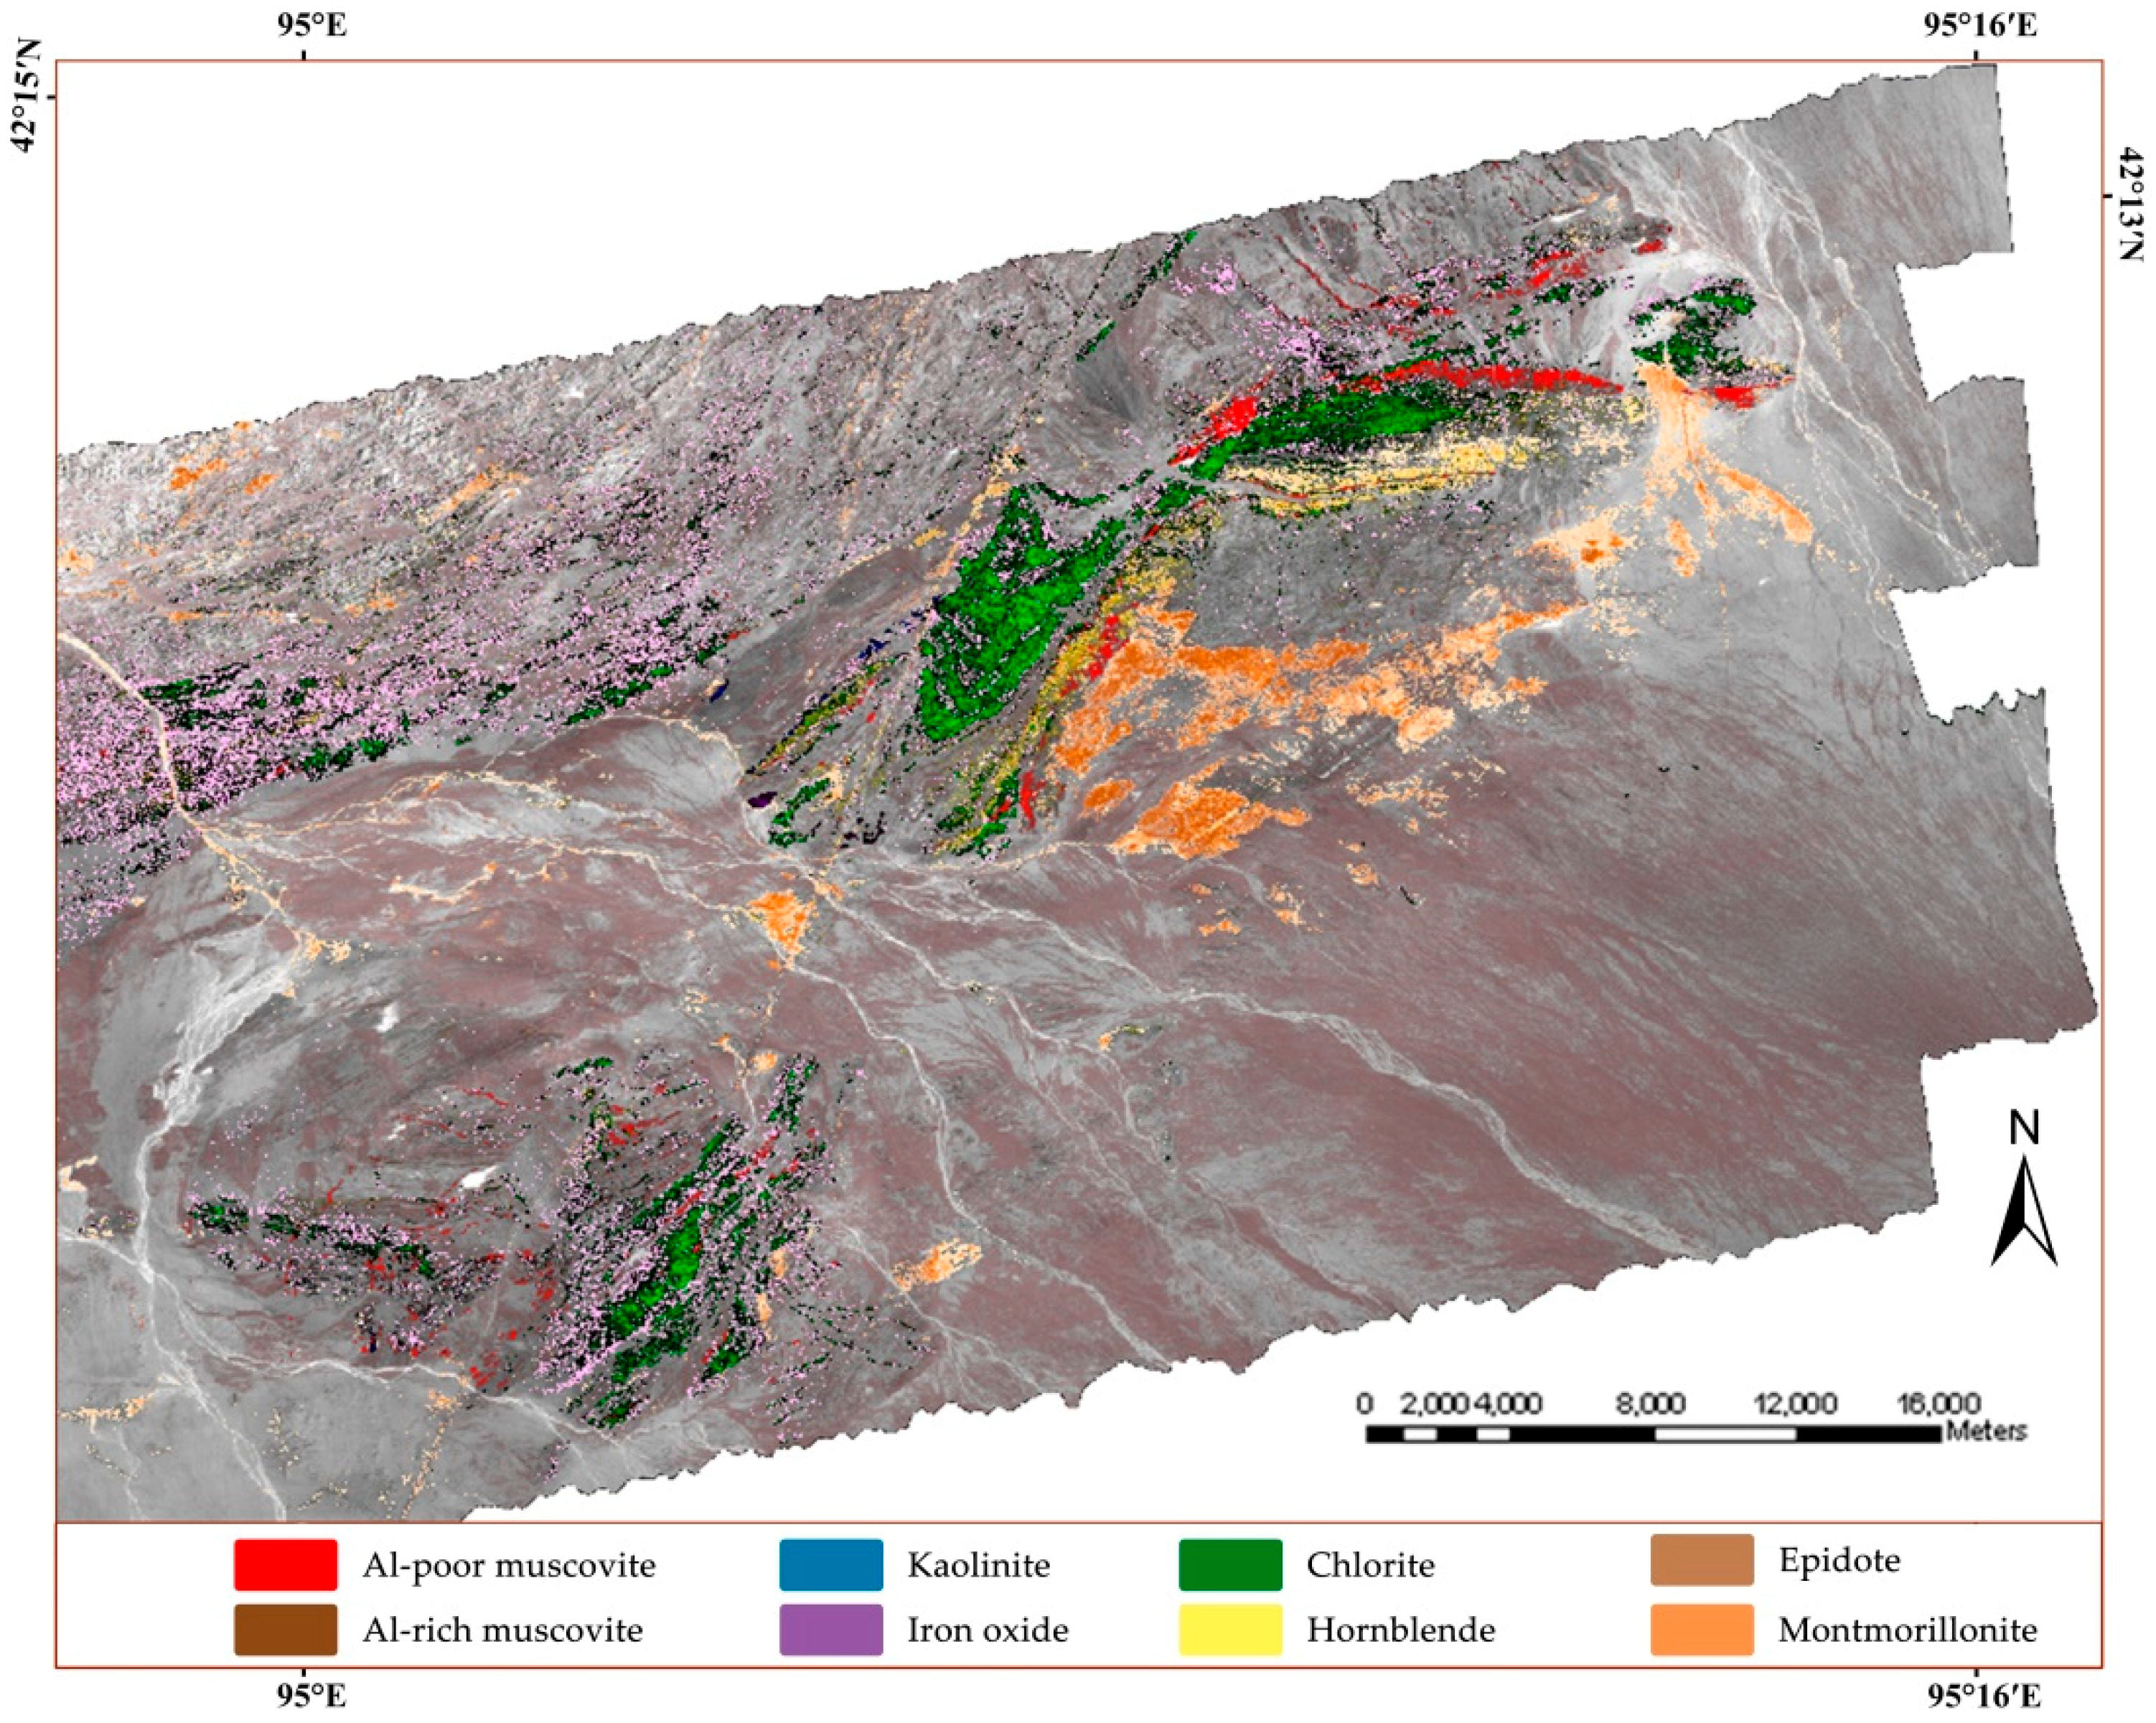
5.1. Altered Mineral Assemblage Characteristics

The study area belongs to a region containing an intracontinental, tectono-magmatic, stacked ductile shear zone related to gold deposits. Based on the alteration mineral assemblage produced by endogenous metalliferous deposits, we can see that the combination of Hymap hyperspectral mineral mapping, field verification and existing exploration work shows that shear zones are closely associated with mineral assemblages related to gold (Figure 8, Figure 9, Figure 10, Figure 11, Figure 12 and Figure 13). Particularly, according to the absorption characteristics observed in the Al-OH spectrum, the light-colored mica minerals can be classified as Al-rich muscovite or Al-poor muscovite. Al-rich muscovite underwent intensive alteration and the minerals of mica, including muscovite and illite, and accompanied by pyrophyllite and fine-grain quartz, were altered. In contrast, Al-poor muscovite underwent medium alteration, and the minerals altered were predominantly illite and andreattite, and accompanied by more chlorite and minor laumonite. Al-rich muscovite identified in hyperspectral images may have formed in a hydrothermal fluid environment with comparatively high temperatures and slight acidity. The Al-poor muscovite formed in a fluid environment of comparatively low temperatures and slight alkalinity. The main mineral information extracted from the HyMap data, located in the vicinity of 2.192 μm with shoulders in the vicinity of 2.156 μm and 2.297 μm, was pertaining to Al-rich muscovite. In addition, the mineral information extracted from the airborne data for mineral located in the vicinity of 2.21 μm, with shoulders at 2.174 μm and 2.262 μm, is mainly presented as Al-poor muscovite.

5.2. Prospecting Prediction in the Study Area

After Hymap hyperspectral mineral mapping and field verification, the spatial distribution of muscovite, chlorite, epidote, montmorillonite, kaolinite, hornblende, goethite, malachite, and other major alteration minerals had been mapped. The results of hyperspectral mineral extraction show that the mineral assemblages closely related to the gold deposits in the shear zones are muscovite + chlorite + epidote + kaolinite. The alteration mineral assemblage could then be used as regional search criteria for shear zone gold ore, and was the basis for the identification of mineralised hydrothermal alteration centres and delineation of four prospective targets (Figure 14).
Based on the known geology, geophysical, and geochemical exploration in surveyed areas and Hymap hyperspectral mineral mapping, the favourable conditions for finding gold-bearing tectonic zones in the region are summarized as follows:
  • Close to the intersection of the tectonic fault zone with the gold geochemical anomaly and the NE or near EW structure of the metallogenic belt for copper, gold, nickel and other elements, which represents a favourable prospecting area for polymetallic targets. The favourable prospecting area has a WNW orientation and covers an area of about 2.30 km2. The stratigraphic distribution in the area is the lower Carboniferous Mansou Su Formation (C1y), and the faults are developed in an EW direction. The quartz veins are interspersed in the volcanic strata with abundant alteration in the form of sericitisation, chloritisation, etc. Preliminary chemical analysis shows that the content of copper is up to 245.50 mg/kg, the content of nickel is up to 107.40 mg/kg, and the content of TiO2 is up to 0.95%.
  • The outer peripheral region around the Waringixian granite body has potential for copper, gold and other elements, and represents a favourable prospecting area for polymetallic targets. The favourable prospecting area is nearly EW oriented and covers an area of about 3.2 km2. The strata distributed in the area belong to the Miocene Taoshugou Formation (N1t), with an ENE fault structure developed. The granodiorite bodies are distributed in the nearly EW orientation. The quartz veins are mainly distributed in the volcanic strata and there have been multiple occurrences of ferritization, sericitisation, epidotization, and malachitization. The preliminary chemical analysis shows that the content of copper is up to 118.50 mg/kg, the content of TiO2 is up to 1.05%, and there are copper and gold deposits in the area.
  • The early Carboniferous Yaman Su Group are favourable strata for copper, nickel, silver, and other elements, and represent a favourable prospecting area for polymetallic targets. The prospective area has a NE orientation and covers an area of about 2.4 km2. The strata distributed in the area are the Miocene Taoshugou Formation (N1t), and ENE trending faults have been developed. Rhyolitic porphyries are distributed in volcanic strata to the northwest, and exhibit chloritization and epidotization. The preliminary chemical analysis shows that the content of copper is up to 238.50 mg/kg, the content of nickel is up to 108.50 mg/kg, the content of silver is up to 92.90 mg/kg, while the distribution of gold deposits in the area has been studied.
  • The alteration of mineral assemblages are non-granite-induced, aluminium-poor + muscovite + chlorite + kaolinite (distal) + montmorillonite (proximal; rock mass interior). This is a favourable prospecting location for copper, gold, nickel, and other elements. The prospective area exhibits a NE orientation and covers an area of about 2.10 km2. The stratigraphic distribution in the area comprises of the lower Carboniferous Mansou Su Formation (C1y) with NE and EW trending fault structures developed. The tonalite are distributed in the volcanic strata along a WNW trend. Crenulated micas are frequently developed in the area, along with chloritization and epidotization. The preliminary chemical analysis shows that the content of copper is up to 258.50 mg/kg, the content of nickel is up to 98.50 mg/kg, the content of TiO2 is up to 0.85%, and gold deposits are distributed in the area.
Field verification at the Yemaquan West Gold Mine indicates that the minerals that can be identified by the visible-near-infrared method are relatively complete. Seven low-temperature hydrothermal alteration minerals, namely chlorite, epidote, muscovite, montmorillonite, kaolin, hornblende, and goethite, are present. At present, the mineral information extracted from the hyperspectral data in this study area is rich, and is suitable for high-spectral mapping work. Based on the combination of hyperspectral mineral mapping and field verification, the characteristics of individual altered minerals are as follows:
(1)
Chloritization: It is mainly distributed in schists, volcanic rocks, and altered fracture belts, and co-exists with epidotite. It is distributed over a large area, and is easy to identify using the hyperspectral method.
(2)
Epidotization: The minerals are widely distributed and are often produced in conjunction with chlorite. Their spectral curves are similar and not easy to distinguish.
(3)
Sericitization: It is mainly distributed in intermediate-acid rock masses, schists, and as part of sandstones and altered fracture belts. It often co-exists with ferritization and chloritization.
(4)
Amphibolization: It is mainly distributed in diorite, and exhibits obvious spectral features.
(5)
Kaolinization: It is mainly distributed in the lithotripsic altered fracture belts of ferritization and is closely related to ferritization and alteration.
(6)
Malachitization: This mineral distribution range is relatively small. It is only distributed in the altered fracture belts, is easily covered by other altered minerals, and is found in a zone measuring about 10 × 40 m along the railway.
(7)
Ferritization: This mineral is widely distributed in various lithologic and alteration belts and is associated with other alteration minerals.
Relatively little geological work has thus far been carried out in the study area. In addition to a comprehensive regional geological survey and small- and medium-scale physical and chemical exploration, 1:50,000 geological mapping has not been carried out. Large-scale geological mapping and mineral exploration work is mainly concentrated in existing mining areas. There is thus a lack of a unified understanding, and the potential of advantageous and strategic mineral resources is unknown. Remote sensing-based geological surveys are mainly carried out in conjunction with regional geological surveys and mineral exploration work. The data source is mainly medium-resolution multi-spectral data, such as TM, ETM, and ASTER data. Hyperspectral data contains both image information and spectral information of the ground object. This provides basic images for geological interpretation of the regional stratigraphy, lithology, and structure. More importantly, it allows the identification of the types and components of minerals, and facilitates the quantitative or semi-quantitative estimation of relative alteration intensity and altered mineral content, mineral mapping, mineralization of hydrothermal alteration centres, and delineation of mineralization alteration zones or prospecting targets. Mineral mapping can be used to trace the mineralized hydrothermal alteration center and delineate the mineralized alteration belts or the target area for prospecting.

6. Conclusions

We used a HyMap airborne imaging spectrometer for the first time in the study area, and obtained high-quality hyperspectral data with abundant information. It provides new basic information for the study of the regional geological background, metallogenic geological characteristics and mineralization alteration belts, as well as the rapid evaluation of mineral resources. Hyperspectral remote sensing technology shows obvious advantages for prospecting work in this area. After field verification, the hyperspectral remote sensing mapping using Mixed Matched Matching Filter (MTMF) achieved good results, indicating that this method can be applied to mineral mapping in areas with poor natural conditions, saving manpower and financial resources. At the same time, it provides new technologies for regional basic geological surveys, mineral surveys, and prospecting predictions, but the precision and accuracy should be improved in a further step.
Although hyperspectral remote sensing mineral mapping technology has begun to emerge from the research and development stage and enter the stage of production and engineering application at home and abroad, the origin of mineral anomalies, such as muscovite, kaolinite, chlorite, epidote, serpentine, and calcite, extracted by hyperspectral techniques tend to be multi-faceted, and most anomalies may not be directly related to mineralisation. Although in some specific regions at home and abroad, there are successful cases in which minerals that are indicative of mineralisation have been found to achieve that purpose during prospecting, these cases are not universal.
The spectral reflection and emission characteristics of rocks and minerals form the basis for mineral identification. It is necessary to improve the study in terms of the fine features, the regular patterns of variation with elements and structures, the geological significance, and the identification characteristics and method of mineral spectra. We need to increase the variety of minerals identified to further improve identification reliability, detection sensitivity, precision of identification and the level of quantization and intellectualization. In particular, it is necessary to pay attention to methods for identifying minerals that are difficult to identify, those that are easy to mistake for other minerals, and those with a low recognition accuracy.

Author Contributions

All authors conceived, designed, and implemented the study. Conceptualization: Z.P.; methodology: F.Q.; software: L.M.; validation: J.L. and F.C.; formal analysis: F.C. and G.Z.; investigation and resources: H.Z.; data curation: J.H., Y.L. and J.W.; original draft preparation: Z.P. and F.Q.; and review and editing: F.Q. and G.Z.

Funding

This research was funded jointly by the China Geological Survey Evaluation Project (No. 12120114036501), National Science and Technology Platform Construction Project of China (2005DKA32300) and Major Projects of the Ministry of Education Base (16JJD770019) in China.

Acknowledgments

The research work was financially supported by China Geological Survey Evaluation Project (No. 12120114036501). Many thanks are extended to the National Science & Technology Infrastructure of China (No. 2005DKA32300), the Major Projects of the Ministry of Education (No. 16JJD770019), the Data Sharing Infrastructure of Earth System Science Data Centre of the Lower Yellow River Region (http://henu.geodata.cn).

Conflicts of Interest

The authors declare no conflicts of interest.

References

  1. Torres-Vera, M.A.; Prol-Ledesma, R.M. Spectral Enhancement of Selected Pixels in Thematic Mapper Images of the Guanajuato District (Mexico) to Identify Hydrothermally Altered Rocks. Int. J. Remote Sens. 2003, 24, 4357–4373. [Google Scholar] [CrossRef]
  2. Wang, R.; Li, M.; Wang, B.; Niu, H.; Sun, Y.; Li, C. Prospecting Model Based on Ground Hyperspectral Remote Sensing Data of Hongshan Cu-Au Ore Deposit in Xinjiang. Geoscience 2016, 30, 577–586. [Google Scholar]
  3. Bi, X.; Miao, F.; Ye, C. Lithology Identification and Mapping by Hyperion Hyperspectral Remote Sensing. Comput. Tech. Geophys. Geochem. Explor. 2012, 34, 599–603. [Google Scholar] [CrossRef]
  4. Jones, B.; Renaut, R.W.; Rosen, M.R. Taphonomy of Silicified Filamentous Microbes in Modern Geothermal Sinters—Implications for Identification. Palaios 2001, 16, 580–592. [Google Scholar] [CrossRef]
  5. Gan, F.; Wang, R.; Ma, A.; Zhang, Z.; Li, M. Integration for Extracting and Mineral Analysis Models for Geological Application Using Remote Sensing Data. J. Remote Sens. 2003, 7, 207–332. [Google Scholar] [CrossRef]
  6. Tong, Q.; Zhang, B.; Zheng, L. Hyperspectral Remote Sensing; Higher Education Press: Beijing, China, 2006; p. 415. ISBN 9787040192773. [Google Scholar]
  7. Li, Z.Z.; Yang, R.H.; Dang, F.X.; Zhang, X.F.; Tan, B.X.; Zhao, H.J. The Hyperspectral Remote Sensing Technology and Its Application. Geol. Bull. China 2009, 28, 270–277. [Google Scholar] [CrossRef]
  8. Huo, H.; Ni, Z.; Jiang, X.; Zhou, P.; Liu, L. Mineral Mapping and Ore Prospecting with HyMap Data over Eastern Tien Shan, Xinjiang Uyghur Autonomous Region. Remote Sens. 2014, 6, 11829–11851. [Google Scholar] [CrossRef] [Green Version]
  9. Tansho, M.; Tamura, K.; Shimizu, T. Identification of Multiple Cs+ Adsorption Sites in a Hydroxy-interlayered Vermiculite-like Layered Silicate through Cs-133 MAS NMR Analysis. Chem. Lett. 2016, 45, 1385–1387. [Google Scholar] [CrossRef]
  10. Zhang, N.; Zhou, K. Research on Identification Methods of Porphyry Alteration Zones Based on Aster Data. Chin. J. Geol. 2016, 51, 990–1001. [Google Scholar]
  11. Prabaharan, S.; Subramani, T. Identification of Hydrocarbon Micro-seeps Based on Mineral Alteration in a Part of Cauvery Basin, South India Using Hyperion Data. Indian J. Geo-Mar. Sci. 2016, 45, 1138–1147. [Google Scholar]
  12. Kruse, F.A.; Perry, S.L. Improving Multispectral Mapping by Spectral Modeling with Hyperspectral Signatures. J. Appl. Remote Sens. 2009, 3, 85–99. [Google Scholar] [CrossRef]
  13. Huang, Z.; Yao, Z.; Cheng, M. Lithologic Anomaly Identification of Hydrocarbon Microseepages in Kelasu Fold-and-thrust Belt, West China Using ASTER Imagery. In Proceedings of the 2014 IEEE International Geoscience & Remote Sensing Symposium, Quebec City, QC, Canada, 3–18 July 2014; pp. 863–866. [Google Scholar]
  14. Wang, A.-M.; Li, X.-G.; Huang, Z.-Q.; Huang, X.-C.; Wang, Z.-F.; Wu, Q.; Cui, J.-L.; Lu, X.-J. Laboratory Study on Engineering Geological Characteristics and Formation Mechanism of Altered Rocks of Henan Tianchi Pumped Storage Power Station, China. Environ. Earth Sci. 2015, 74, 5063–5075. [Google Scholar] [CrossRef]
  15. Simpson, M.P.; Rae, A.J. Short-wave Infrared (SWIR) Reflectance Spectrometric Characterisation of Clays from Geothermal Systems of the Taupo Volcanic Zone, New Zealand. Geothermics 2018, 73, 74–90. [Google Scholar] [CrossRef]
  16. Eastwood, A.; Oze, C.; Fraser, S.J.; Cole, J.; Gravley, D.; Chambefort, I.; Gordon, K.C. Application of Raman Spectroscopy to Distinguish Adularia and Sanidine in Drill Cuttings from the Ngatamariki Geothermal Field, New Zealand. N. Z. J. Geol. Geophys. 2015, 58, 66–77. [Google Scholar] [CrossRef]
  17. Kopačková, V.; Koucká, L. Integration of Absorption Feature Information from Visible to Longwave Infrared Spectral Ranges for Mineral Mapping. Remote Sens. 2017, 9, 1006. [Google Scholar] [CrossRef]
  18. Jin, Q.; Zhu, L.L.; Zhang, L. Examples of Using Hyperspectral Remote Sensing Technology for Mineral Resource Evaluation and Mining Environment Monitoring. Geol. Bull. China 2009, 28, 278–284. [Google Scholar] [CrossRef]
  19. Lv, F.; Xing, L.; Fan, J.; Pan, J. Extraction of Remotely Sensing Alteration Information Based on Statistical Identification Model. J. Jilin Univ. 2005, 35, 535–538. [Google Scholar]
  20. Gou, S.; Yue, Z.; Di, K.; Wang, J. Hyperspectral Identification of Mineral Diversity and Formation Mechanism Analysis in the Mclaughlin Crater on Mars. In Proceedings of the Remote Sensing of the Environment: 18th National Symposium on Remote Sensing of China, Wuhan, China, 20–23 October 2012; Volume 9158, p. 91580J. [Google Scholar] [CrossRef]
  21. Govil, H. Identification and Mapping of Hydrothermally Altered Minerals in Parts of Delhi Fold Belt, Jaipur, India, through EO-1 Hyperion Data. Soc. Photo-Opt. Instrum. Eng. 2016, 9880, 988015. [Google Scholar] [CrossRef]
  22. Govil, H.; Gill, N.; Rajendran, S.; Santosh, M.; Kumar, S. Identification of New Base Metal Mineralization in Kumaon Himalaya, India, Using Hyperspectral Remote Sensing and Hydrothermal Alteration. Ore Geol. Rev. 2018, 92, 271–283. [Google Scholar] [CrossRef]
  23. Zhang, N.; Zhou, K. Identification of Hydrothermal Alteration Zones of the Baogutu Porphyry Copper Deposits in Northwest China Using ASTER Data. J. Appl. Remote Sens. 2017, 11, 015016. [Google Scholar] [CrossRef]
  24. Dos Reis Salles, R.; de Souza Filho, C.R.; Cudahy, T.; Vicente, L.E.; Soares Monteiro, L.V. Hyperspectral Remote Sensing Applied to Uranium Exploration: A Case Study at the Mary Kathleen Metamorphic-Hydrothermal U-REE Deposit, NW, Queensland, Australia. J. Geochem. Explor. 2017, 179, 36–50. [Google Scholar] [CrossRef]
  25. Ren, G.L.; Yi, H.; Yang, M.; Liang, N.; Li, J.Q.; Yang, J.L. Using ASD Data to Identify the Altered Minerals for Exploring of Gold Deposit in the Beishan Area, North China. IOP Conf. Ser. Earth Environ. Sci. 2016, 46, 012004. [Google Scholar] [CrossRef]
  26. Ercit, T.S. Identification and Alteration Trends of Granitic-pegmatite-hosted (Y,REE,U,Th)-(Nb,Ta,Ti) Oxide Minerals: A Statistical Approach. Can. Mineral. 2005, 43, 1291–1303. [Google Scholar] [CrossRef]
  27. Zhou, Y.; Chen, Z.; Chen, X.; Chen, B. Alteration Zone Mapping for Detecting Potential Mineralized Areas in Kaladawan of North Altyn Tagh Using ASTER Data. IOP Conf. Ser. Earth Environ. Sci. 2014, 17, 012173. [Google Scholar] [CrossRef]
  28. Zhang, C.; Ye, F.; Xu, Q.; Wu, D.; Che, Y. Drill Core Hyperspectral Technology System and Its Application in Mineral Prospecting. Geol. Sci. Technol. Inf. 2016, 35, 177–183. [Google Scholar]
  29. Wu, H.; Xu, Y.; Gao, R. Extraction of Alteration Information from Hyperspectral Imagery Based on SCA and SID. Geogr. Geo-Inf. Sci. 2016, 32, 44–48. [Google Scholar]
  30. Zhang, Y.; Zhang, J.; Zhao, X.; Yuan, B. Extraction of Mineral Alteration Information from Core Hyperspectral Images Based on Weight of Absorption Peak. Remote Sens. Land Resour. 2015, 27, 154–159. [Google Scholar]
  31. Yazdi, M.; Sadati, N.; Matkan, A.A.; Ashoorloo, D. Application of Remote Sensing in Monitoring of Faults. Int. J. Environ. Res. 2011, 5, 457–468. [Google Scholar] [CrossRef]
  32. Yuan, G.; Wu, Q.; Shang, Y.; Huang, Z.; Cui, J. Engineering Geological Analysis of Altered Rocks with Expansibility in Unlined Caverns for Underground Oil Storage. J. Eng. Geol. 2010, 18, 950–955. [Google Scholar]
  33. Xu, Y.; Ma, H.; Meng, P.; Yang, M. Extraction of the Information of Altered Minerals and Altered Rocks from Hyperspectral Imagery of Vegetation Covered Area. Acta Geosci. Sin. 2015, 36, 229–236. [Google Scholar] [CrossRef]
  34. Lee, H.-J.; Kim, E.-J.; Moon, D.H. Identification of Advanced Argillic-altered Rocks of the Haenam Area, Using by ASTER Spectral Analysis. Econ. Environ. Geol. 2011, 44, 463–474. [Google Scholar] [CrossRef] [Green Version]
  35. Riveros, K.; Veloso, E.; Campos, E.; Menzies, A.; Veliz, W. Magnetic Properties Related to Hydrothermal Alteration Processes at the Escondida Porphyry Copper Deposit, Northern Chile. Miner. Depos. 2014, 49, 693–707. [Google Scholar] [CrossRef]
  36. Wang, Y.-J.; Wang, Q.-J.; Chen, Y.; Hu, F.; Xu, R.; Lin, Q.-Z. A Method to Extract Content of Minerals Based on Measured Hyperspectral Data. Spectrosc. Spectr. Anal. 2015, 35, 1700–1704. [Google Scholar] [CrossRef]
  37. Wang, Y.J.; Lin, Q.Z.; Wang, Q.J.; Chen, Y. A Method to Improve Mineral Identification Accuracy Based on Hyperspectral Data. IOP Conf. Ser. Earth Environ. Sci. 2014, 17, 012206. [Google Scholar] [CrossRef] [Green Version]
  38. Glikson, A.Y.; Eggins, S.; Golding, S.D.; Haines, P.W.; Iasky, R.P.; Mernagh, T.P.; Mory, A.J.; Pirajno, F.; Uysal, I.T. Microchemistry and Microstructures of Hydrothermally Altered Shock-metamorphosed Basement Gneiss, Woodleigh Impact Structure, Southern Carnarvon Basin, Western Australia. Aust. J. Earth Sci. 2005, 52, 555–573. [Google Scholar] [CrossRef]
  39. Izadi, H.; Sadri, J.; Mehran, N.-A. A New Intelligent Method for Minerals Segmentation in Thin Sections Based on a Novel Incremental Color Clustering. Comput. Geosci. 2015, 81, 38–52. [Google Scholar] [CrossRef]
  40. Jakob, S.; Gloaguen, R.; Laukamp, C. Remote Sensing-Based Exploration of Structurally-Related Mineralizations around Mount Isa, Queensland, Australia. Remote Sens. 2016, 8, 358. [Google Scholar] [CrossRef]
  41. Lahondere, D.; Cagnard, F.; Wille, G.; Duron, J.; Misseri, M. TEM and FESEM Characterization of Asbestiform and Non-asbestiform Actinolite Fibers in Hydrothermally Altered Dolerites (France). Environ. Earth Sci. 2018, 77, 384–385. [Google Scholar] [CrossRef]
  42. Pour, A.B.; Park, T.-Y.S.; Park, Y.; Hong, J.K.; Zoheir, B.; Pradhan, B.; Ayoobi, I.; Hashim, M. Application of Multi-Sensor Satellite Data for Exploration of Zn-Pb Sulfide Mineralization in the Franklinian Basin, North Greenland. Remote Sens. 2018, 10, 1186. [Google Scholar] [CrossRef]
  43. Mezned, N.; Bouzidi, W.; Dkhala, B.; Abdeljaouad, S. Cascade Sub-Pixel Unmixing of ASTER SWIR Data for Mapping Alteration Minerals in TAMRA SIDI-DRISS SITE, NW Tunisia. In Proceedings of the 2017 IEEE International Geoscience and Remote Sensing Symposium, Fort Worth, TX, USA, 23–28 July 2017; pp. 6267–6270. [Google Scholar]
  44. Rajendran, S.; Nasir, S. Characterization of ASTER Spectral Bands for Mapping of Alteration Zones of Volcanogenic Massive Sulphide Deposits. Ore Geol. Rev. 2017, 88, 317–335. [Google Scholar] [CrossRef]
  45. Li, X.; Hong, Z.; Han, Y.; Zhang, Y.; Wang, J. Coastal Waterline Extraction Based on an Improved Sub-pixel Unmixing Method Using EO-1 Hyperion Data. J. Shanghai Ocean Univ. 2018, 27, 633–643. [Google Scholar]
  46. Wang, J.; Zhang, T.; Yi, G.; Zhong, K.; Bie, X.; Ye, H.; Yang, R. Discernment of Alteration Zoning Minerals Using Multispectral Remote Sensing Data in the Ga’erqin Porphyry Cu-Au Deposit, Tibet. Geol. Explor. 2018, 54, 358–365. [Google Scholar]
  47. Okyay, U.; Khan, S.D.; Lakshmikantha, M.R.; Sarmiento, S. Ground-Based Hyperspectral Image Analysis of the Lower Mississippian (Osagean) Reeds Spring Formation Rocks in Southwestern Missouri. Remote Sens. 2016, 8, 1018. [Google Scholar] [CrossRef]
  48. Carrino, T.A.; Crosta, A.P.; Bemfica Toledo, C.L.; Silva, A.M. Hyperspectral Remote Sensing Applied to Mineral Exploration in Southern Peru: A Multiple Data Integration Approach in the Chapi Chiara Gold Prospect. Int. J. Appl. Earth Obs. Geoinf. 2018, 64, 287–300. [Google Scholar] [CrossRef]
  49. Wang, M.; Wang, Y.; Tian, M.; Fu, A.; Zhu, J.; Zhang, S.; Yu, G. Identification of Effective Reservoir and Quantitative Evaluation of Porosity of Altered Igneous Rock: A Case Study of Igneous Rock in the Upper Fourth Member of Shahejie Formation in Binnan Oilfield. Pet. Geol. Recovery Effic. 2018, 25, 22–27. [Google Scholar]
  50. Zhan, Y.; Su, Y.; Huang, J.; Ye, F.; Zhang, C. Mineral Recognition Mapping Using Measured Spectra Based on Classification and Regression Tree. J. Appl. Remote Sens. 2016, 10, 045017. [Google Scholar] [CrossRef]
  51. Cao, G.; Hou, P.; Zheng, Z.; Lu, N.; Li, G. New Method and Error Analysis of Lake Retrieval with MetOp-A AVHRR Images on the Tibetan Plateau. Int. J. Remote Sens. 2016, 37, 3547–3567. [Google Scholar] [CrossRef]
  52. Zadeh, M.H.; Honarmand, M. A Remote Sensing-based Discrimination of High- and Low-potential Mineralization for Porphyry Copper Deposits; A Case Study from Dehaj-Sarduiyeh Copper Bbelt, SE Iran. Eur. J. Remote Sens. 2017, 50, 332–342. [Google Scholar] [CrossRef]
  53. Modabberi, S.; Ahmadi, A.; Tangestani, M.H. Sub-pixel Mapping of Alunite and Jarosite Using ASTER Data; A Case Study from North of Semnan, North Central Iran. Ore Geol. Rev. 2017, 80, 429–436. [Google Scholar] [CrossRef]
Figure 1. Flow chart of airborne hyperspectral mineral mapping.
Sustainability 11 00428 g001
Figure 2. Regional Geological Map (according to the China Non-ferrous Metals Resource Geological Survey). 1. Hong alluvial gravel, sand; 2. Fluvial gravel; 3. Grey conglomerate formation; grey conglomerate sandstone lenses; 4. Red sandstone, conglomerate and mudstone; 5. Grape Valley Formation: Paleo, brown conglomerate and sandstone; 6. Peach Circle Formation: Brick red clay, silty sandstone, argillaceous rock, and conglomerate; 7. Shanshan Formation: Reddish purple conglomerate, arkosic conglomerate, siltstone; 8. Grey-green, grey, grey-black, fine conglomerate, tuff, silica, mica-quartz schist, fine bijire, quartz porphyry, limestone; 9. Masamitsu Formation: Phyllite, feldspathic porphyry, quartz porphyry, quartz-albite dacite, clastic tuff with fine boulders, limestone, sandstone; 10. Brown granite sand, conglomerate, sandstone; 11. Xingxingxia Formation: Light grey, grey-green biotite plagiogneiss, mixed rock, quartzite, marble, sparry limestone; 12. Deep red granite; 13. White muscovite granite; 14. Light grey biotite granite; 15. Diorite, quartz diorite; 16. Regional major fault; 17. Reverse fault; 18. Normal fault; 19. Translational fault; 20. Inferred fault of unknown nature; 21. Underlying formation; 22. Copper mine; 23. Gold mine; 24. Outline of completed 1:50,000 range of laser scanning; 25. Outline of 2015 designed 1:50,000 range of laser scanning; 26. Outline of 2016 designed 1:50,000 range of laser scanning.
Sustainability 11 00428 g002
Figure 3. Seamless mosaic of study area (false colour composite with RGB bands 108-28-3 for colour synthesis overview).
Sustainability 11 00428 g003
Figure 4. The schematic diagram of mineral abundances and physicochemical characteristics by spectral parameters.
Sustainability 11 00428 g004
Figure 5. Schematic diagram of the spectrum.
Sustainability 11 00428 g005
Figure 6. The two main forms of muscovite occurrences: (a) Granite (porphyry) type and, (b) Tectonic fracture zone type.
Sustainability 11 00428 g006
Figure 7. Field photographs and spectral curves of muscovite verification points. (a) Photograph of field geomorphology (left) and photograph of collected samples (right). (b) c: Field sample measurement spectrum(reflectance), d: Airborne HyMap measurement spectrum (value).
Sustainability 11 00428 g007aSustainability 11 00428 g007b
Figure 8. The main alteration minerals in the study area.
Sustainability 11 00428 g008
Figure 9. Muscovite stage mineralization in the study area.
Sustainability 11 00428 g009
Figure 10. Clay alteration minerals in the study area.
Sustainability 11 00428 g010
Figure 11. Out-of-area propylitization in the study area.
Sustainability 11 00428 g011
Figure 12. In-of-area propylitization in the study area.
Sustainability 11 00428 g012
Figure 13. A comprehensive map of altered minerals in the study area.
Sustainability 11 00428 g013
Figure 14. HyMap hyperspectral alteration mapping integrated with geologic map of the study area.
Sustainability 11 00428 g014
Table 1. Relevant technical parameters of the HyMap airborne imaging spectrometer.
Wavelength Range (μm)Wavelength Bandwidth (nm)Spectral Sampling Interval (nm)The Number of Bands
VIS: 0.45–0.8915–161532
NIR: 0.89–1.3515–161532
SWIR1: 1.40–1.8015–161332
SWIR2: 1.95–2.4818–201732
FOV61.3°
IFOVHeading 2.5 mrad, the vertical heading 2.0 mrad
Spatial resolution4.5 m
SNR>800:1
Table 2. Related minerals with absorption features.
Molecular BondAbsorption Feature (μm)Example of Mineral
Al-OH2.17–2.21 Kaolinite, Montmorillonite, Muscovite,
Mg-OH2.30–2.40Chlorite, Epidote, Hornblende, Actinolite
Fe-OH2.21–2.30Jarosite, Alunite, Goethite
CO32−2.30–2.35 Calcite, Dolomite, Malachite
Table 3. Absorption peak positions of several common Al-OH minerals.
MineralAluniteIlliteKaoliniteCookeiteHalloysite
Characteristic absorption (μm)2.1652.2152.2052.1752.215
2.3252.3552.1652.3652.355
MineralMontmorilloniteMuscovitePyrophylliteRectoriteTopaz
Characteristic absorption (μm)2.2052.195~2.2252.1652.1952.085
2.155
2.215
2.2152.3552.315
Table 4. Several common Mg-OH minerals absorption peak positions.
MineralActinoliteBiotiteTalcBruciteChlorite
Characteristic absorption (μm)2.3152.3352.3152.3152.330
2.224
2.386
MineralHectoritePhlogopiteSerpentineTremoliteEpidote
Characteristic absorption (μm)2.3052.3252.3252.3152.330
2.225~2.226
Table 5. Absorption peak positions of several common carbonate minerals.
TypeMineralChemical FormulaCharacteristic Absorption (μm)
12345
CalciteMagnesiteMgCO32.4962.305 1.9151.975
DolomiteCaMgCO32.5282.3152.1451.9851.865
CalciteCaCO32.5282.3352.1651.9951.875
DialogiteMnCO3 2.3652.1752.0051.895
SideriteFeCO32.5282.345 1.925
AragoniteStrontianiteSrCO3 2.3452.1752.0151.885
AlstoniteBaCO3 2.3862.2052.0451.915
MalachiteAzuriteCu(CO3)2 (OH)22.4182.3652.2652.205
MalachiteCu2(CO3) (OH)2 2.3552.2852.2152.205

