Key Factors Affecting Environmental Protection Values in China


Abstract
:1. Introduction
2. Methodology
2.1. Data Processing
2.2. Regression Analysis
2.3. Contributions and Possible Mechanisms
3. Conclusions and Discussion
Author Contributions
Funding
Acknowledgments
Conflicts of Interest
Appendix A

| Dataset | Variable | Variable Label | Value Label |
|---|---|---|---|
| WVS 2 | V12 | Would give part of my income for the environment | 1-strongly agree; 2-agree; 3-disagree; 4-strongly disagree |
| V13 | Increase in taxes if used to prevent environmental pollution | 1-strongly agree; 2-agree; 3-disagree; 4-strongly disagree | |
| V14 | Government should reduce environmental pollution | 1-strongly agree; 2-agree; 3-disagree; 4-strongly disagree | |
| V15 | All talk about the environment makes people anxious | 1-strongly agree; 2-agree; 3-disagree; 4-strongly disagree | |
| V16 | Combating unemployment, we have to accept environmental problems | 1-strongly disagree; 2-disagree; 3-agree; 4-strongly agree | |
| V17 | Protecting the environment and fighting pollution is less urgent than suggested | 1-strongly disagree; 2-disagree; 3-agree; 4-strongly agree | |
| V33 | Membership in voluntary organizations: environmental organizations | 1-active member; 2-inactive member; 3-not a member | |
| WVS 3 | V38 | I would agree to an increase in taxes if the extra money was used to prevent environmental damage | 1-strongly agree; 2-agree; 3-disagree; 4-strongly disagree |
| V39 | I would buy things at a 20% higher price if it helped to protect the environment | 1-strongly agree; 2-agree; 3-disagree; 4-strongly disagree | |
| V40 | Environmental problems can be solved without any international agreements to handle them | 1-strongly agree; 2-agree; 3-disagree; 4-strongly disagree | |
| V41 | Environment vs. economic growth | 1-protecting the environment should be given priority; 2-economic growth and creating jobs should be the top priority | |
| V42 | Environmental action: choose products that are better for the environment | 1-have done; 2-have not | |
| V43 | Environmental action: recycle something rather than throw it away | 1-have done; 2-have not | |
| V44 | Environmental action: reduce water consumption for environmental reasons | 1-have done; 2-have not | |
| V45 | Environmental action: attend meetings and sign petitions aimed at protecting the environment | 1-have done; 2-have not | |
| V46 | Environmental action: contribute to an environmental organization | 1-have done; 2-have not | |
| V49 | Human beings should master nature vs. coexist with nature | 1-human beings should master nature; 2-humans should coexist with nature | |
| WVS 4 | V33 | Would give part of my income for the environment | 1-strongly agree; 2-agree; 3-disagree; 4-strongly disagree |
| V34 | Increase taxes if the extra money is used to prevent environmental pollution | 1-strongly agree; 2-agree; 3-disagree; 4-strongly disagree | |
| V35 | Government should reduce environmental pollution | 1-strongly agree; 2-agree; 3-disagree; 4-strongly disagree | |
| V36 | Environmental and economic growth | 1-protecting environment; 2-economic growth and creating jobs | |
| V37 | Humans and nature | 1-master nature; 2-coexist with nature | |
| WVS 5 | V29 | Membership in an environmental organization | 0-not a member; 1-inactive member; 2-active member |
| V104 | Environmental vs. economic growth | 1-protect the environment; 2-economic growth and creating jobs | |
| V105 | Would give part of my income for the environment | 1-strongly agree; 2-agree; 3-disagree; 4-strongly disagree | |
| V106 | Increase taxes if the extra money is used to protect the environment | 1-strongly agree; 2-agree; 3-disagree; 4-strongly disagree | |
| V107 | Government should reduce environmental pollution | 1-strongly agree; 2-agree; 3-disagree; 4-strongly disagree | |
| WVS 6 | V30 | Active/inactive membership: environmental organization | 0-not a member; 1-inactive member; 2-active member |
| V81 | Protecting environmental vs. economic growth | 1-protecting the environment should be given priority; 2-economic growth and creating jobs should be the top priority | |
| V82 | Past two years: given money to an ecological organization | 1-yes; 2-no | |
| V83 | Past two years: participated in a demonstration for the environment | 1-yes; 2-no |
Appendix B
| Indices and Factors | x1 | x2 | x3 | x4 | x5 | x6 | x7 | x8 | x9 | x10 | x11 | x12 | x13 | x14 | x15 |
|---|---|---|---|---|---|---|---|---|---|---|---|---|---|---|---|
| Action (y1) | −0.33 (0) | 0.04 (0) | −0.21 (0) | 0.89 (95%) | 0.75 (90%) | 0.54 (0) | 0.51 (0) | 0.45 (0) | 0.51 (0) | 0.71 (80%) | −0.58 (0) | −0.56 (0) | −0.46 (0) | −0.35 (0) | −0.51 (0) |
| Attitude (y2) | 0.07 (0) | 0.72 (80%) | 0.84 (95%) | −0.39 (0) | −0.81 (90%) | 0.12 (0) | 0.45 (0) | 0.004 (0) | −0.48 (0) | −0.18 (0) | −0.06 (0) | −0.28 (0) | 0.27 (0) | 0.48 (0) | −0.29 (0) |
| x1 | 1.0 | ||||||||||||||
| x2 | 0.30 (0) | 1.0 | |||||||||||||
| x3 | 0.54 (0) | 0.84 (95%) | 1.0 | ||||||||||||
| x4 | −0.07 (0) | −0.16 (0) | −0.17 (0) | 1.0 | |||||||||||
| x5 | −0.38 (0) | −0.38 (0) | −0.73 (90%) | 0.59 (0) | 1.0 | ||||||||||
| x6 | −0.50 (0) | 0.51 (0) | −0.007 (0) | 0.09 (0) | 0.44 (0) | 1.0 | |||||||||
| x7 | −0.65 (0) | 0.50 (0) | 0.18 (0) | 0.16 (0) | 0.14 (0) | 0.84 (95%) | 1.0 | ||||||||
| x8 | −0.67 (0) | −0.41 (0) | −0.29 (0) | 0.53 (0) | 0.17 (0) | −0.02 (0) | 0.40 (0) | 1.0 | |||||||
| x9 | 0.05 (0) | −0.55 (0) | −0.30 (0) | 0.83 (95%) | 0.36 (0) | −0.45 (0) | −0.29 (0) | 0.58 (0) | 1.0 | ||||||
| x10 | −0.55 (0) | 0.26 (0) | −0.26 (0) | 0.31 (0) | 0.70 (80%) | 0.95 (99%) | 0.74 (90%) | 0.09 (0) | −0.20 (0) | 1.0 | |||||
| x11 | 0.73 (90%) | −0.29 (0) | 0.19 (0) | −0.15 (0) | −0.50 (0) | −0.95 (99%) | −0.89 (98%) | −0.24 (0) | 0.32 (0) | −0.94 (99%) | 1.0 | ||||
| x12 | 0.83 (95%) | −0.18 (0) | 0.07 (0) | −0.28 (0) | −0.25 (0) | −0.70 (80%) | −0.94 (99%) | −0.67 (80%) | 0.05 (0) | −0.67 (80%) | 0.84 (95%) | 1.0 | |||
| x13 | 0.78 (90%) | 0.62 (80%) | 0.59 (0) | −0.49 (0) | −0.40 (0) | −0.03 (0) | −0.31 (0) | −0.94 (99%) | −0.56 (0) | −0.23 (0) | 0.32 (0) | 0.63 (80%) | 1.0 | ||
| x14 | −0.09 (0) | 0.64 (90%) | 0.32 (0) | −0.72 (80%) | −0.26 (0) | 0.59 (0) | 0.41 (0) | −0.56 (0) | −0.98 (99.9%) | 0.35 (0) | −0.45 (0) | −0.16 (0) | 0.54 (0) | 1.0 | |
| x15 | 0.52 (0) | −0.58 (0) | −0.12 (0) | −0.08 (0) | −0.31 (0) | −0.98 (99.9%) | −0.92 (99%) | −0.08 (0) | 0.45 (0) | −0.89 (98%) | 0.95 (99%) | 0.78 (90%) | 0.07 (0) | −0.59 (0) | 1.0 |
References
- Sia, A.P.; Hungerford, H.R.; Tomera, A.N. Selected Predictors of Responsible Environmental Behavior: An Analysis. J. Environ. Educ. 1986, 17, 31–40. [Google Scholar] [CrossRef]
- Stern, P.C. Toward a Coherent Theory of Environmentally Significant Behavior. J. Soc. Issues 2000, 56, 407–424. [Google Scholar] [CrossRef]
- Gatersleben, B.; StegL, V.C. Measurement and determinants of environmentally significant consumer behavior. Environ. Behav. 2002, 34, 335–362. [Google Scholar] [CrossRef]
- Ziadat, A.H. Major factors contributing to environmental awareness among people in a third world country/Jordan. Environ. Dev. Sustain. 2010, 12, 135–145. [Google Scholar] [CrossRef]
- Wu, H.; Mweemba, L. Environmental self-efficacy, attitude and behavior among small scale farmers in Zambia. Environ. Dev. Sustain. 2010, 12, 727–744. [Google Scholar] [CrossRef]
- Reardon, T.; Barrett, C.; Kelly, V.; Savadogo, K. Policy reforms and sustainable agricultural intensification in Africa. Dev. Policy Rev. 2002, 17, 375–395. [Google Scholar] [CrossRef]
- Brooks, J. Economic and social dimensions of environmental behavior: Balancing conservation and development in Bhutan. Conserv. Biol. 2010, 24, 1499–1509. [Google Scholar] [CrossRef]
- Lentijo, G.M.; Hostetler, M.E. Effects of a participatory bird census project on knowledge, attitudes and behaviors of coffee farmers in Colombia. Environ. Dev. Sustain. 2013, 15, 199–223. [Google Scholar] [CrossRef]
- Dietz, T.; Stern, P.C.; Guagnano, G.A. Social Structural and Social Psychological Bases of Environmental Concern. Environ. Behav. 1998, 30, 450–471. [Google Scholar] [CrossRef]
- David, B.R. Where are the Gaps in the Environmental Education? Disadvantaged kids have different needs and concerns. EPA J. 1995, 21, 12. [Google Scholar]
- Maloney, M.P.; Ward, M.P. Ecology: Let’s hear from the people. An objective scale for the measurement of ecological attitudes and knowledge. Am. Psychol. 1973, 28, 583–586. [Google Scholar] [CrossRef]
- Oskamp, S.; Harrington, M.J.; Edwards, T.C.; Sherwood, D.L.; Okuda, S.M.; Swanson, D.C. Factors influencing household recycling behaviour. Environ. Behav. 1991, 23, 494–519. [Google Scholar] [CrossRef]
- Brand, K.W. Environmental Consciousness and Behaviour: The Greening of Lifestyles. In The International Handbook of Environmental Sociology; Redclift, M., Woodgate, G., Eds.; Edward Elgar: London, UK, 1997; pp. 204–215. [Google Scholar]
- Inglehart, R.; Haerpfer, C.; Moreno, A.; Welzel, C.; Kizilova, K.; Diez-Medrano, J.; Lagos, M.; Norris, P.; Ponarin, E.; Puranen, B. (Eds.) World Values Survey; Version 2018; JD Systems Institute: Madrid, Spain, 2004. [Google Scholar]
- Inglehart, R.; Basanez, M.; Diez-Medrano, J.; Halman, L.; Luijkx, R. Human Beleifs and Values: A Cross-Cultural Sourcebook Based on the 1999–2002 Values Survey; Siglo XXI: Mexico City, Mexico, 2004. [Google Scholar]
- The Word Bank, GDP per Capita Growth (annual %). Available online: https://data.worldbank.org/indicator/NY.GDP.PCAP.KD.ZG?view=chart (accessed on 8 January 2018).
- The Word Bank, CO2 Emissions (Metric tons per Capita). Available online: http://www.mee.gov.cn/gzfw_13107/hjtj/qghjtjgb/ (accessed on 8 May 2018).
- Ministry of Ecology and Environment of the People’s Republic of China, the National Environment Statistical Bulletin. Available online: https://data.worldbank.org/indicator/EN.ATM.CO2E.PC?locations=CN&view=chart (accessed on 8 January 2018).
- Committee of the Township Enterprise Statistics. Statistical Yearbooks of Township Enterprises in China (1995–2016); China Agriculture Press: Beijing, China, 2016. [Google Scholar]
- China Environmental News. Ministry of Ecology and Environment of the People’s Republic of China. 2015. Available online: http://www.cenews.com.cn (accessed on 4 March 2015).
- Statistical Yearbook of Township Enterprises in China (1990–2014), The Chinese Statistical Bureau. Available online: http://www.stats.gov.cn (accessed on 31 December 2015).
- Li, Z.Z. A Study on Corporate Social Responsibility of China’s Township Enterprise; East China Normal University: Shanghai, China, 2007; pp. 1–191. [Google Scholar]
- Liu, G.L. Township enterprises environmental protection problems and optimization methods under the new situation. Beijing Agric. 2015, 24, 183–184. [Google Scholar]
- Zou, X.J. Review and analysis of township enterprises development since 1978 in China. J. Shijiazhuang Univ. Econ. 2011, 34, 64–67. [Google Scholar]
- Zhu, J.W. Restrictive factors and countermeasures for sustainable development of township enterprises in China. Enterp. Strategy 2011, 6, 28–30. [Google Scholar]
- Zhou, J.Q. Studies of Township Enterprises’ Development under the Construction of New Countryside; Fujian Normal University: Fuzhou, China, 2009. [Google Scholar]
- Wu, Z.Q. Public environmental awareness investigation and valuation research in Shanghai. Environ. Sci. Shanghai 1997, 7, 13–16. [Google Scholar]
- Hong, D.Y. Comprehensive evaluation of civil environment consciousness and sampling analysis. Technol. Rev. Rep. 1998, 9, 13–16. [Google Scholar]
- Ren, L.Y. The Public Participation in Environmental Protection. Environmental Awareness and Perceptions; Huaxia Press: Beijing, China, 2002; pp. 89–113. [Google Scholar]
- Tong, Y.Q. Environmental Consciousness and Policy Orientation. Environmental Awareness and Perceptions; Huaxia Press: Beijing, China, 2002; pp. 56–75. [Google Scholar]
- Li, Y.; Bai, M.; Zhang, W.; Yang, K.; Wang, X. Analysis on the influence factors of residents willingness to pay for improving air quality in Beijing. China Popul. Resour. Environ. 2002, 6, 123–126. [Google Scholar]
- Zhang, L.; Wu, Y. Market segmentation and willingness to pay for green electricity electricity among urban residents in China: The case of Jiangsu Province. Energy Policy 2012, 51, 514–523. [Google Scholar] [CrossRef]
- Qiao, Z. A perspective analysis of environmental problems based on the utility. Contemp. Econ. Res. 2005, 2, 54–57. [Google Scholar]
- Dong, Y.Q. Environmental consciousness and environmental protection policy orientation. In Environmental Problem and Awareness; Huaxia Publishing House: Beijing, China, 2002; pp. 56–75. [Google Scholar]
- Xi, X.L.; Fan, L.H.; Deng, X.M. Public Environment Awareness in China: An Analysis of the Results of Public Surveys. China Soft Sci. 1998, 9, 24–30. [Google Scholar]
- Zhong, Y.P. The investigation of the college students’ environmental awareness and behavior. J. Psychol. Sci. 2003, 26, 542–543. [Google Scholar]
- Hong, D.Y. The investigation and analysis of the public’s environmental protection awareness in China. China Popul. Resour. Environ. 1997, 2, 27–31. [Google Scholar]
- The Central People’s Government of the People’s Republic of China, Law of the People;s Republic of China on Township Enterprises. Available online: http://www.gov.cn/banshi/2005-06/01/content_3432.htm (accessed on 8 May 2018).
- Zhang, Y. The development of township enterprises in the process of urbanization. Knowl. Econ. 2016, 24, 75–77. [Google Scholar]
- Sheng, J. Talking about environmental pollution and solutions in township enterprises. Agric. Technol. 2015, 35, 215–216. [Google Scholar]
- Li, M. The development course and trend of township enterprises analysis. Contemp. Manag. 2006, 21, 141–142. [Google Scholar]


| Period | 1990–1994 (WVS2) | 1995–1998 (WVS3) | 1999–2004 (WVS4) | 2005–2009 (WVS5) | 2010–2014 (WVS6) |
|---|---|---|---|---|---|
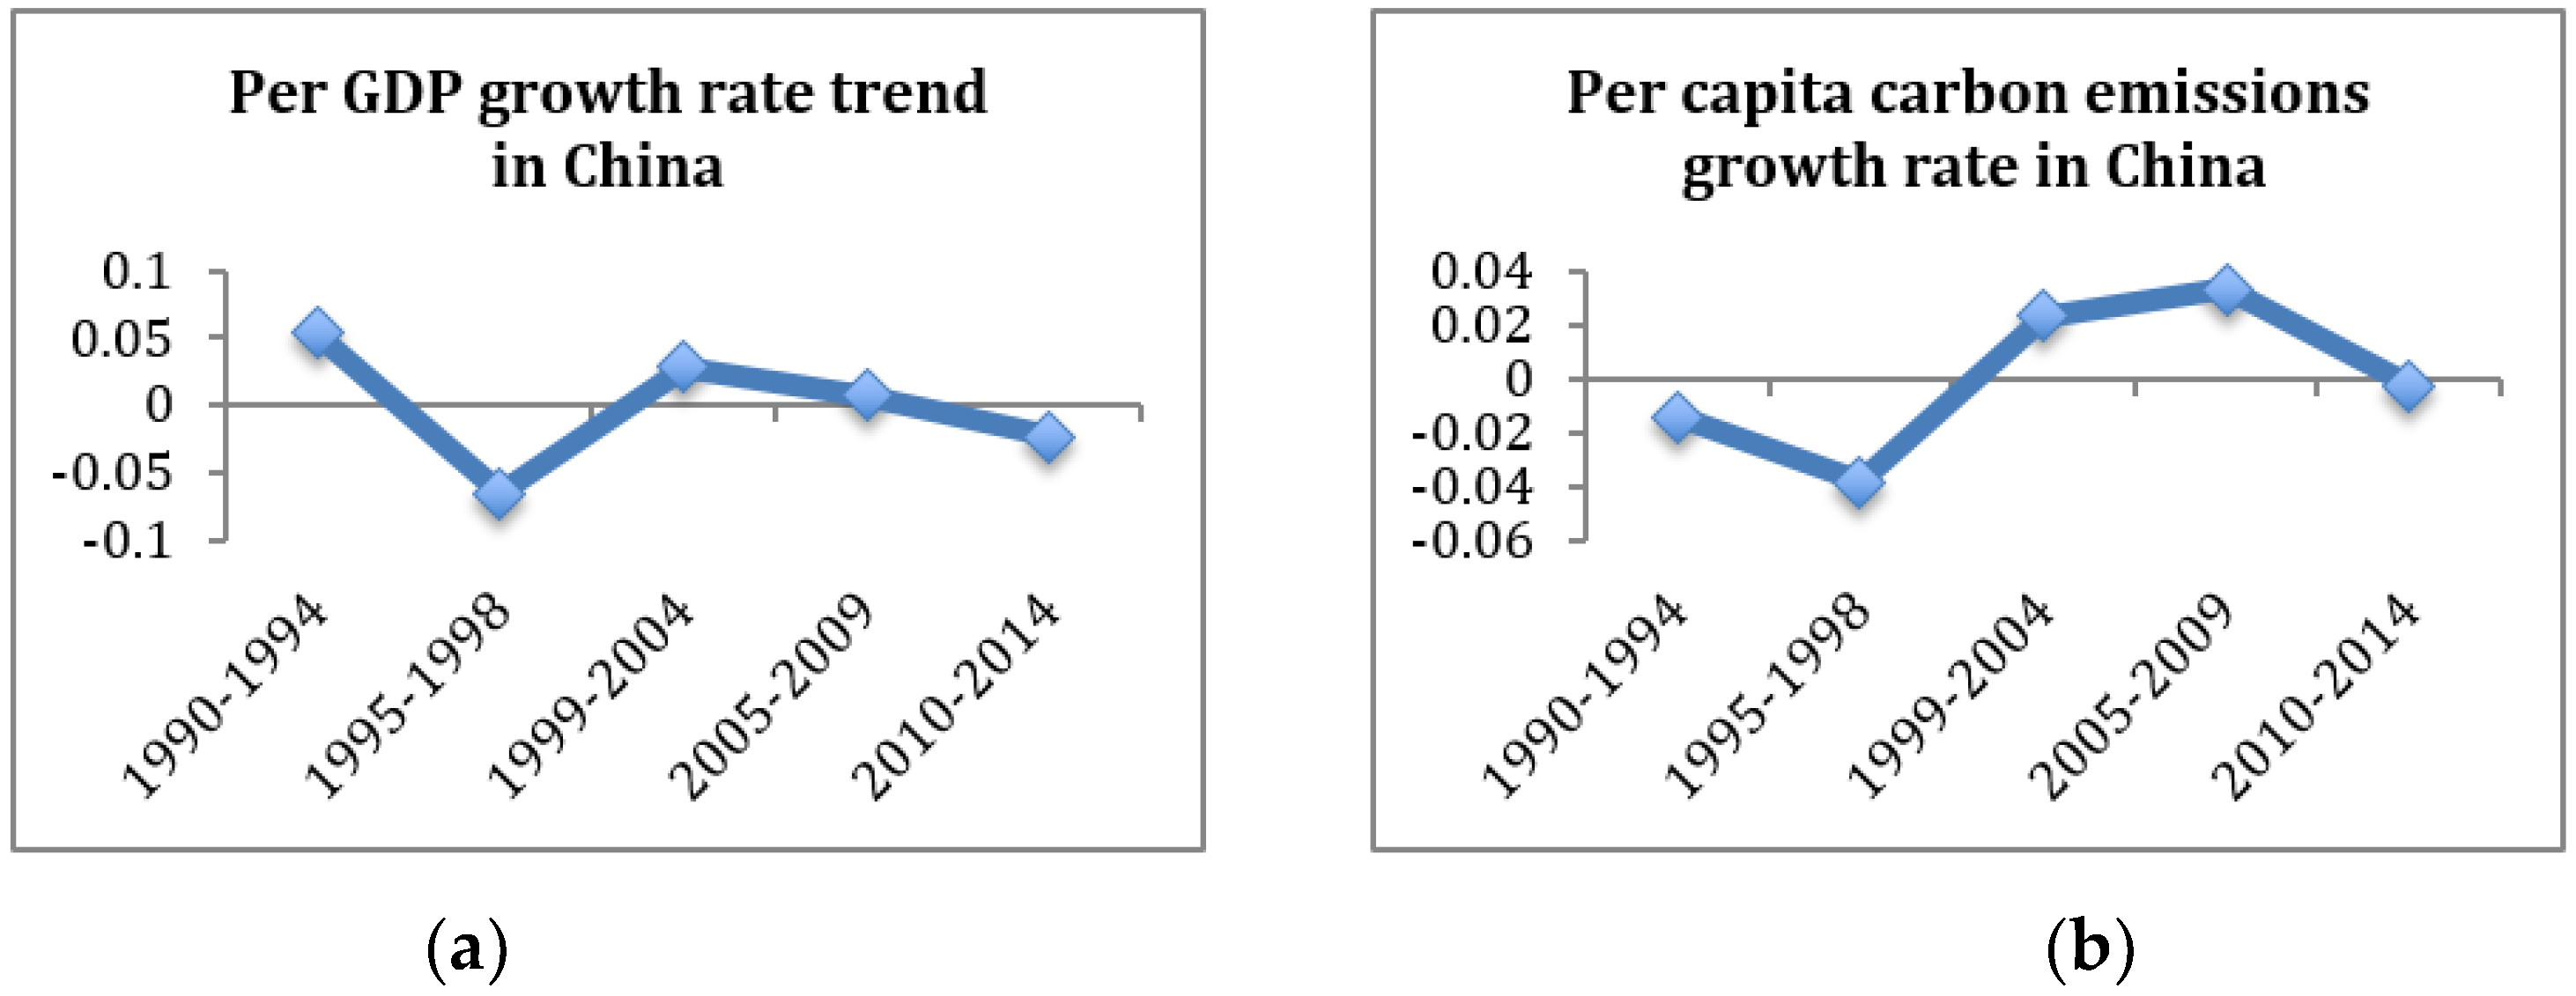
| a4× (x4) (a4 = 0.4796) | 0.0377 | 0.0730 | 0.0163 | 0.0270 | −0.1540 |
| a6× (x6) (a6 = 1.0527) | 0.0566 | −0.0687 | 0.0292 | 0.0074 | −0.0244 |
| a4× (x4) + a6× (x6) | 0.0943 | 0.0043 | 0.0455 | 0.0344 | −0.1784 |
| Time gradient of a4× (x4) | 0.0353 | −0.0567 | 0.0107 | −0.1810 | |
| Time gradient of a6× (x6) | −0.1253 | 0.0979 | −0.0218 | −0.0318 | |
| Time gradient of a4× (x4) + a6× (x6) | −0.0900 | 0.0412 | −0.0111 | −0.2128 | |
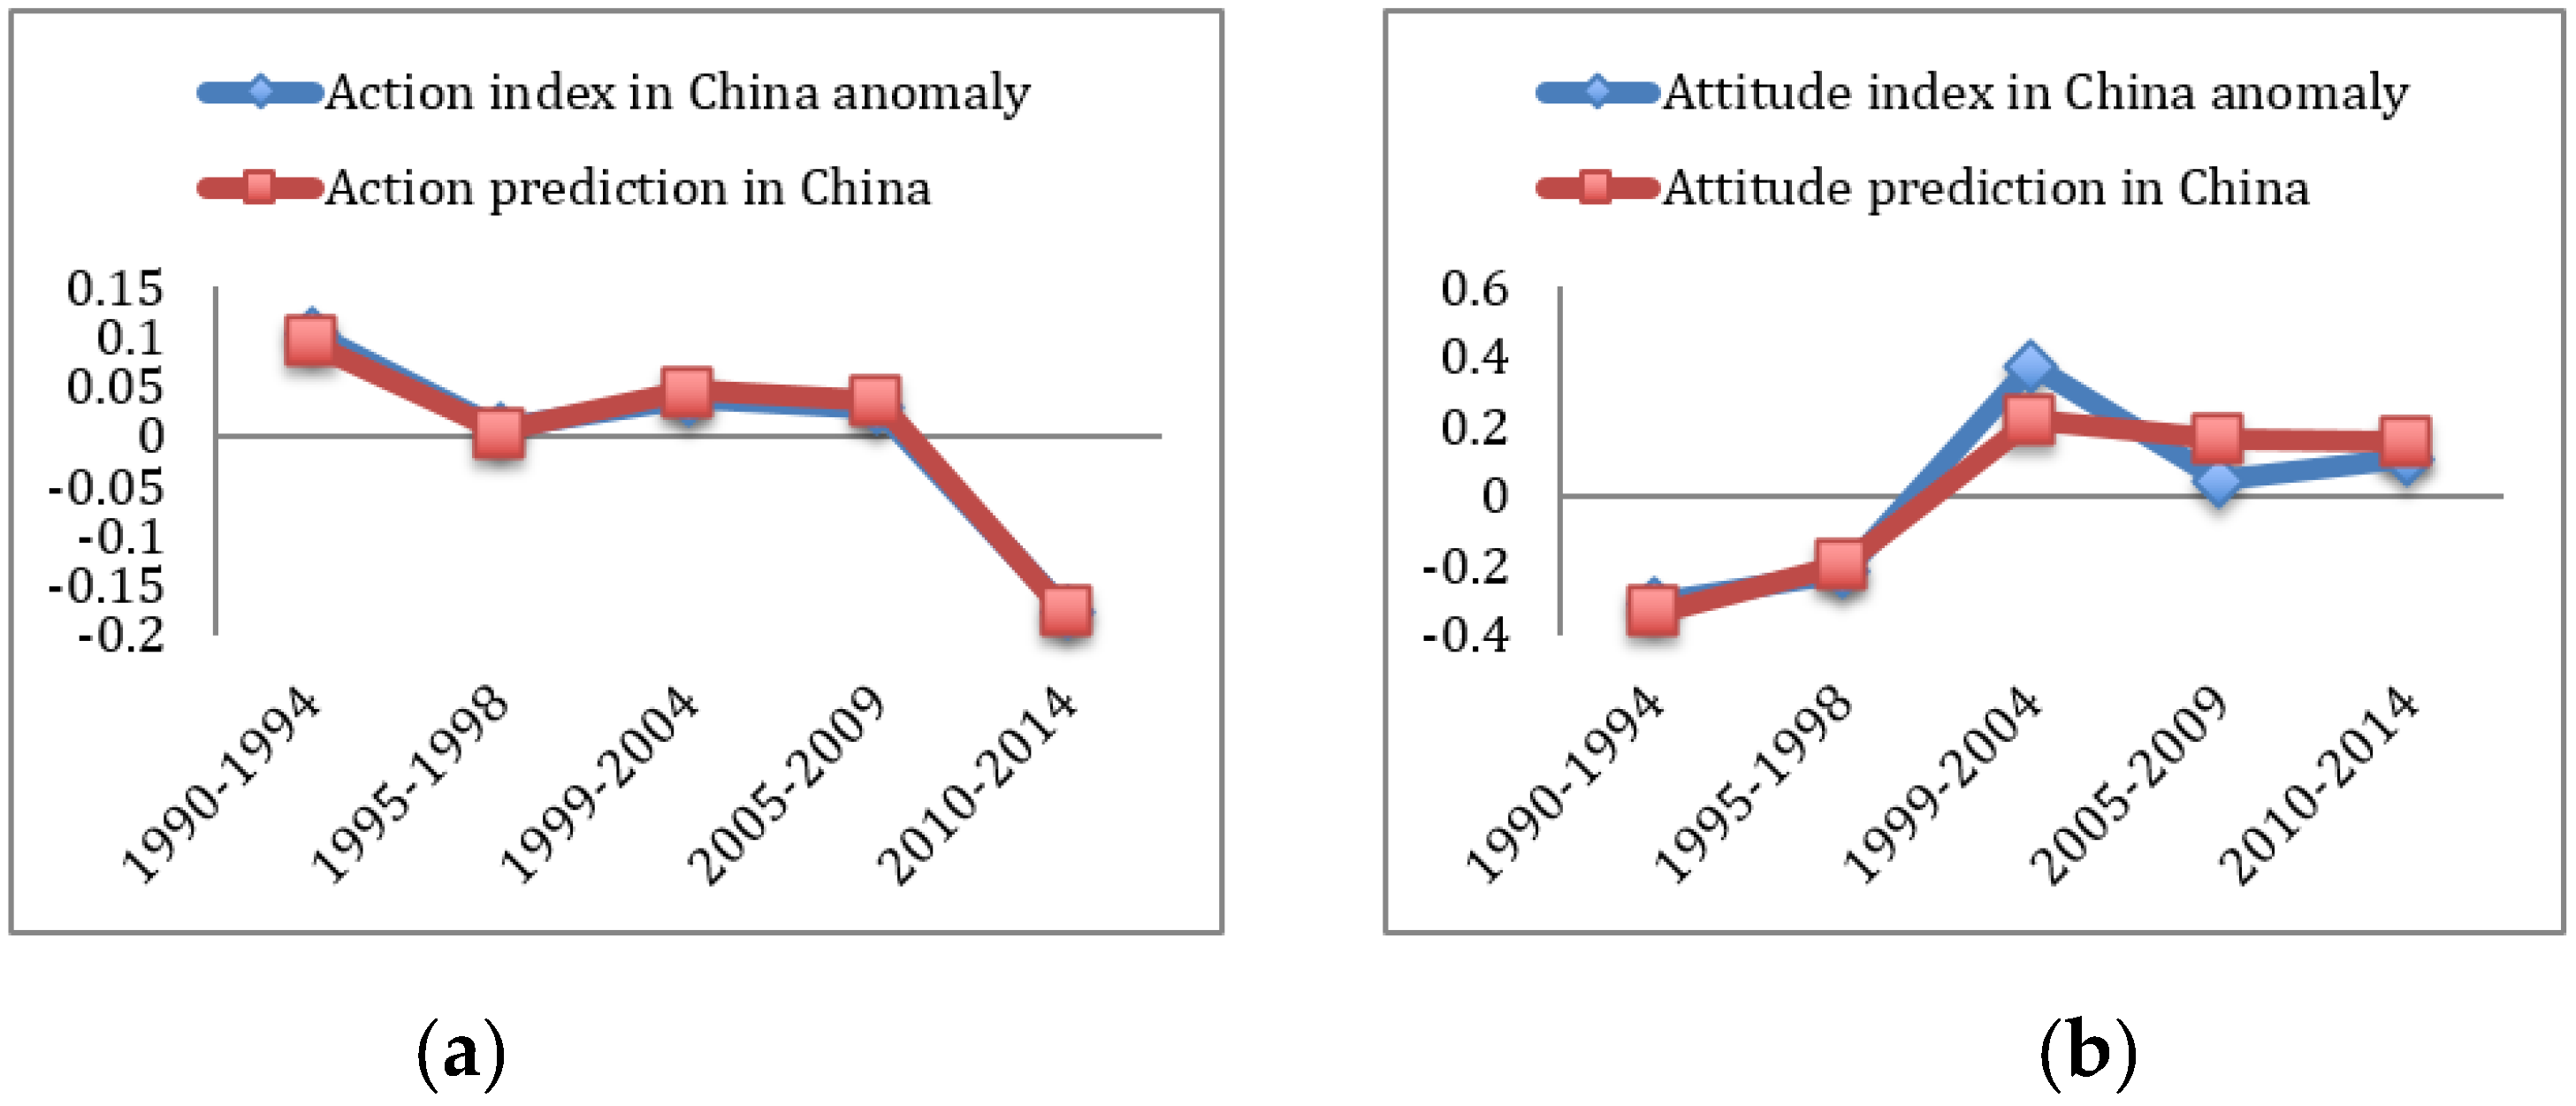
| Action index anomaly | 0.1037 | 0.0076 | 0.0385 | 0.0268 | −0.1766 |
| Time gradient of the action index anomaly | −0.0961 | 0.0309 | −0.0117 | −0.2034 |
| Period | 1990–1994 (WVS2) | 1995–1998 (WVS3) | 1999–2004 (WVS4) | 2005–2009 (WVS5) | 2010–2014 (WVS6) |
|---|---|---|---|---|---|
| a2× (x2) (a2 = 4.6017) | −0.0659 | −0.1774 | 0.1054 | 0.1510 | −0.0132 |
| a5× (x5) (a5 = −1.1849) | −0.2706 | −0.0229 | 0.1111 | 0.0145 | 0.1680 |
| a2× (x2) + a5× (x5) | −0.3365 | −0.2003 | 0.2165 | 0.1655 | 0.1548 |
| Time gradient of a2× (x2) | −0.1115 | 0.2828 | 0.0456 | −0.1642 | |
| Time gradient of a5× (x5) | 0.2477 | 0.1340 | −0.0966 | 0.1535 | |
| Time gradient of a2× (x2) + a5× (x5) | 0.1362 | 0.4168 | −0.0510 | −0.0107 | |
| Attitude index anomaly | −0.3055 | −0.2198 | 0.3720 | 0.0437 | 0.1097 |
| Time gradient of the attitude index anomaly | 0.0857 | 0.5918 | −0.3283 | 0.0660 |
© 2019 by the authors. Licensee MDPI, Basel, Switzerland. This article is an open access article distributed under the terms and conditions of the Creative Commons Attribution (CC BY) license (http://creativecommons.org/licenses/by/4.0/).
Share and Cite
Li, Q.; Wang, B.; Yu, C.; Deng, H.; Liu, L.; Huang, W. Key Factors Affecting Environmental Protection Values in China. Sustainability 2019, 11, 304. https://doi.org/10.3390/su11020304
Li Q, Wang B, Yu C, Deng H, Liu L, Huang W. Key Factors Affecting Environmental Protection Values in China. Sustainability. 2019; 11(2):304. https://doi.org/10.3390/su11020304
Chicago/Turabian StyleLi, Qiuhua, Bin Wang, Chaoqing Yu, Haifeng Deng, Li Liu, and Wenyu Huang. 2019. "Key Factors Affecting Environmental Protection Values in China" Sustainability 11, no. 2: 304. https://doi.org/10.3390/su11020304
APA StyleLi, Q., Wang, B., Yu, C., Deng, H., Liu, L., & Huang, W. (2019). Key Factors Affecting Environmental Protection Values in China. Sustainability, 11(2), 304. https://doi.org/10.3390/su11020304