Abstract
Agriculture is increasingly facing major challenges such as climate change, scarcity of natural resources and changing societal demands. To tackle these challenges there is a pressing need to evolve towards more sustainable agricultural practices. As a result, sustainability stands among the most relevant topics in agricultural research worldwide, and Spain is no exception. Agricultural sustainability has been analysed in Spain mainly at a national and farm scale. This contribution aims at assessing agricultural sustainability in Spain at a provincial scale, allowing the scrutiny of regional variability induced by the existing differences in extension, relevance and policies of the agricultural activity at this level. The sustainability assessment performed is based on a selection of twenty-two indicators covering the three classical dimensions of sustainability—environmental, economic and social. The methodology implemented is based on normalising and aggregating selected indicators according to three composite indicators for the fifty Spanish provinces. Numerous statistical and cartographic sources are used. Cluster analysis establishes four different groups of provinces according to their performance in terms of agricultural sustainability. Higher economic sustainability in provincial agriculture seems to be mostly associated with more intensive use of agricultural labour and agricultural machinery and faster wealth growth. Social sustainability seems to be linked to greater diversification of economic activities and to quality productions under Protected Designations of Origin (PDO) and Protected Geographical Indications (PGI). Best environmental sustainability is achieved where extension of agricultural land is larger, less agricultural area is burned, and carbon stock and sequestration by agricultural ecosystems is better. It is expected that the results could improve the policy coherence and decision-making for more sustainable agricultural systems in Spanish regions.
1. Introduction
Since the concept of sustainable development was established as a guiding principle for policy action [1], diverse sustainability tools and assessments have been developed. In this context, agriculture is one of the productive activities that have been most interesting for analysts of sustainable development [2,3,4]. The increasing concerns regarding the deterioration of natural resources on which agricultural output and rural economies rely are behind this development. Agriculture constitutes the basis for the provision of a set of private goods (food and agricultural raw materials) and public goods such as the contribution to the viability of rural regions (According to the European Commission [5], in Spain both predominantly rural and intermediate regions represent 77% of the total territory, 37% of total population, 34% of total gross value-added and 36% of total employment), the function of carbon dioxide (CO2) sinks, or the generation of landscapes and biodiversity valued by society [6,7]. However, more than other productive activities, agriculture is also associated with the extensive use of natural resources (especially land, water, energy) that need appropriate and pressing sustainable management.
This means that the challenges for the sustainability of many agricultural systems are numerous and diverse. These challenges can be grouped from the socioeconomic and environmental perspectives, while implying important management actions to reach a balance between obtaining food and other basic products, and the conservation of natural resources. Revealed evidence suggests that biodiversity conservation, environmental protection and social empowerment are preconditions for medium and long-term sustainable economic development.
In the Spanish and European case, the challenges of sustainable agriculture correspond to a large extent with the strategic challenges proposed in the current reform of the Common Agricultural Policy (CAP) 2014–2020 [8,9]. Yet, the most innovative sustainability scheme introduced by CAP 2014–2020 is the green payments regulation, which imposes new conditions for receiving 30% of the direct payments. The greening measures consist of maintaining permanent grassland at the 2014 level, crop diversification, and maintaining an Ecological Focus Area. This approach seems to respond to the principle of “public money for public goods” increasingly advocated to boost the legitimacy of the CAP payments [10,11]. (In most advanced countries and an increasing number of emerging countries, agriculture is supported by costly public policies whose effectiveness is often questioned in terms of their ability to improve the adaptation and resilience of the agricultural sector to generate long-term sustainability. According to OECD [12], most agricultural policies in place are not well-aligned with shared objectives for the sector “to increase productivity sustainably, enhance environmental performance, and improve farmers’ ability to manage risks and shocks.”).
Sustainability also has been gaining more momentum within the policy debate on the future of the CAP currently underway [13]. The objectives of the future CAP post 2020 tend to be designed in a close linkage to the principles of sustainable development as conceived in international frameworks such as the Sustainable Development Goals (SDGs). In addition, objectives and targets for specific themes (e.g., climate change mitigation, water management) should be strongly aligned to relevant frameworks such as the 2030 climate and energy package of the Paris Agreement COP21. This means that targets should be formulated to ensure that European agriculture contributes in a significant manner to the achievement of the commonly agreed international objectives.
Moreover, the concept of sustainability should be applicable at multiple levels (supranational, national, local) in order to provide policy coherence between the different administrative levels and ensure that resources are directed towards specifically established targets. This implies the formulation of clear and tangible objectives according to national and regional priorities, taking into account both the structure of the agricultural sector and international obligations.
There are many different approaches and tools for assessing agricultural sustainability [14,15,16]. Although all methods aim at contributing to a more sustainable agriculture in general, they can be distinguished according to their level of assessment (product, sector, farm, country, region) and the more or less emphasis put on the pursued sustainability goals. Moreover, some tools concentrate on single dimensions of sustainability while others address the three dimensions of sustainability—the environmental, social and economic dimensions [17]. Tools covering more than three dimensions are very scarce. The most salient exception is the Guidelines for Sustainability Assessment for Food and Agriculture Systems (SAFA), which includes four dimensions: environment, economic aspects, social issues and governance [18]. The SAFA provides a hierarchical structure of sustainability dimensions, themes and subthemes making the assessment results more comparable [19].
The vast majority of these methods use indicators to provide a picture of the sustainability status. The choice of indicators is a critical aspect for the development of appropriate sustainability assessments, since the data used for the calculation of each indicator will influence the outcome of the analysis [20,21]. Several selection criteria are provided in the literature, including representativeness, transferability, adaptability and measurability at an assumable cost [22]. Indicators are also used to establish benchmarks to improve sustainability performance [23,24,25], or to set regional sustainability targets [26].
Despite the important role of agriculture and the interest of sustainable agricultural systems at administratively smaller units such as provinces, no studies have been conducted at this level in Spain to the best of our knowledge. Agricultural sustainability has been analysed in Spain mainly on a national and farm scale [27,28,29,30], the same as internationally (recent comprehensive overviews on farm sustainability assessment and adoption can be found in several contributions [22,31,32,33,34]).
This study contributes to overcoming this limitation by assessing regional heterogeneity of agricultural sustainability in Spain. Therefore its objective is threefold: (1) to propose a conceptual approach to selecting a multidimensional set of sustainability indicators suggested as most relevant for Spanish agriculture, (2) to provide a quantitative measurements for these indicators at provincial scale (Spain is administratively divided into 17 Autonomous Communities and 50 provinces with administrative competence in several policy areas), and (3) to contribute to scientific literature on agricultural sustainability from a regional perspective.
This type of assessment can be especially useful for national and regional public managers when taking locational decisions aiming at prioritising practical actions, including (i) coordination of national agricultural policy, (ii) distribution of CAP and national agri-environmental payments to farms and regions, (iii) implementation of differentiated policies in specific provinces due to their singularities, (iv) enhancing sustainable agricultural practices where appropriate, e.g., organic and integrated productions), providing resources to provinces with high socio-economic vulnerability or high risk of rural depopulation (a quite pressing problem in numerous Spanish provinces).
2. Materials and Methods
2.1. Indicator Selection and Data Collection
Based on a review of the specialised literature and international indicator systems used in assessing sustainable agriculture [16,17,18,35,36,37,38,39,40], 22 agricultural sustainability indicators were selected in this study: eight economic, five social and nine environmental indicators (see detailed description of indicators in Appendix A). The selection process of indicators was carried out based on three premises: the coherence with the established frameworks for sustainable development (UN, OECD, EU frameworks [7,14,16,41]), the relevance of these indicators in the Spanish context, and data availability at provincial level. The acceptance of the schemes and frameworks proposed by international organisations has helped the construction of indicators less arbitrarily and more systematically.
The approach used for the empirical evaluation of agricultural sustainability allows the transformation of general and abstract frameworks to a concrete proposal of a consistent set of indicators that can be quantified, monitored and evaluated. Selected indicators should capture strategic sustainability goals and translate the accepted principles into measurable parameters. They should be independent as much as possible from each other. Their number should not be very large in order to avoid major inconsistencies. Small sets of indicators are more effective and keep the focus on truly important factors. The approach followed also assumes the objective of reaching a certain state (target) considered as sustainable for the regional agricultural system. It should be pointed out that several indicators conceptually relevant for sustainable agriculture (e.g., soil quality, animal health, water and pesticide usage, risk management, working conditions, gender balance—see for instance [18,34]) have not been included due to the lack of data at the required spatial scale.
2.2. Data Analysis and Statistical Methods
Statistical and spatial analyses were performed by means of SPSS v22 and ARC-GIS v10.3, respectively. Following Martínez-Vega et al. [42], the original data were transformed (TfV: transformed values) in line with the method proposed for calculating each indicator, and are expressed in the corresponding unit of measurement. In some cases, the raw data were related to surface units to make them comparable and to establish a ranking of provinces.
With regard to four indicators that are considered a threat for social (SO1, SO3) and environmental (EN5, EN8) sustainability, the original values of the indicators were reversed deducting them from 100 (best sustainability), in order to be added to the rest of indicators which are positively correlated to social and environmental sustainability of each province. Indeed, this operation was not necessary for the rest of the indicators because the desirable trends move in an upward direction in terms of positive sustainability added value. Based on the recommendations of Morse and Fraser [43] and in order to standardise the data and achieve normalised values (NV), the TfV were divided by a target value (TV) for each indicator, this being the desirable threshold in the context of sustainability [44], so that:
Table 1 provides detailed information about the extreme values (minimum, maximum) as well as the target values used and how these were established for each indicator. In some cases, the forecasts and targets set in territorial strategies (e.g., Convention on Biological Diversity; scenarios on agricultural land [45]) were taken into account. In other cases, the target value was established at level 100 expressing a no-loss situation (EC7, EN2). However, for most indicators where there are no clear, widely accepted references in the scientific literature, the regulatory setting or the agriculture sectoral plans as well as the distribution of frequency of values for each province were considered, and the target value was set at percentile 85.

Table 1.
Extreme and target values by selected agricultural sustainability indicator.
At this stage, a decision on whether or not to apply weights to the different indicators was necessary, taking into account that some of the selected indicators are considered by international systems to have priority while others are considered complementary. However, several authors [46,47] indicate that the processes of assigning weights usually are highly arbitrary. This is in part attributable to the fact that there is no agreed methodology to weight individual indicators [48,49]. In addition, authors such as Sajeva et al. [50] have shown that weighting often has no significant effect on the ranking of the indicators. As a consequence, no weights have been assigned to indicators in this study.
In the next stage, the normalised indicators relating to each sustainability dimension were integrated in a unique index for the purpose of obtaining, for each province, one index for economic sustainability (ECSI), another for social sustainability (SOSI) and another for environmental sustainability (ENSI). The average value for each dimension (economic, social and environmental) was calculated using the following equations:
The values obtained for the economic, social and environmental indices for the agricultural sector in each province were transformed into Z units in order to harmonise their measurements, allowing a uniform unit of measure useful to have a reference baseline [39,40]. This was done using the following formula:
where are values resulting from operations (2), (3) and (4), the mean of the series (50 provinces), and the standard deviation of the series. indicates how many units each province is away from the general mean. Z scores are designed in such a way that users know if a province is above or below average and by how much. With this design, obviously, the average is zero and the standard deviation is 1. It should be noted that the Z-score is among the most widely used standardisation techniques [48,49,51]. The advantage of this technique is that it provides dimensionless values and individual scores from different distributions can be directly compared [48,52].
Subsequently, a k-means cluster analysis on the standardised values of the three indices was performed in order to classify the Spanish provinces in relatively homogeneous groups according to their economic, social and environmental characteristics in the agricultural sector. Lastly, the positioning of the 50 provinces studied was shown graphically to compare their relative positions regarding each sustainability dimension.
3. Results and Discussion
The results of the provincial distribution of the integrated sustainability dimension indices resulting from operations (2), (3) and (4) show high inequality across provinces: only three provinces (6%) are above the desirable minimum value (target value) for economic sustainability (values above zero): A Coruña, Pontevedra and Santa Cruz de Tenerife (see Figure A1 in Appendix B). At the same time, no province reaches the desirable minimum value for social sustainability (Figure A2 in Appendix B), while 28 provinces (56%) surpass the established target values for environmental sustainability (Figure A3 in Appendix B) (Note that at this stage these indices represent the integration in one value for each province of the values of all indicators of the corresponding sustainability dimension, allowing a ranking of provinces within each dimension but not comparisons across dimensions).
Once these data are normalised (Z values), the positions of different provinces in different indices can be directly compared, and it is visually easy to notice whether a province is above or below average (zero) and by how much. Table 2 summarises the normalised values reached in each province in the economic, social and environmental sustainability indices, and indicates the cluster to which each province belongs.
Table 2.
Normalised values (Z) of sustainability indices and grouping of provinces.
Hierarchical clustering of the three standardised sustainability indices yielded four clearly distinguishable groups of provinces according to their performance in terms of agricultural sustainability (Table 3). Cluster 1 is formed by provinces presenting balanced values in all three sustainability dimensions. Cluster 2 is composed of provinces presenting rather high values for economic sustainability and low values for social sustainability. Cluster 3 includes provinces with relatively high values for social sustainability, while the provinces of Cluster 4 present relatively high values for environmental sustainability.
Table 3.
Average values of sustainability indices in each cluster of provinces (Z values).
Figure 1 presents the positioning of the provinces belonging to each cluster according to their agricultural sustainability in different dimensions. As shown, no province is highly positioned simultaneously in all dimensions. Moreover, the rank values obtained for composite dimension indices (see supplementary data) indicate that higher economic sustainability of the agricultural sector is observed mainly in Northern provinces and seems to be associated with more intensive use of agricultural labour (number of annual agricultural work units per 100 ha of tilled farmland) and agricultural machinery (agricultural machines density per 100 ha of cultivated area), as well as to higher increase of average wealth in the province (variation in per capita GDP 2004–2014).
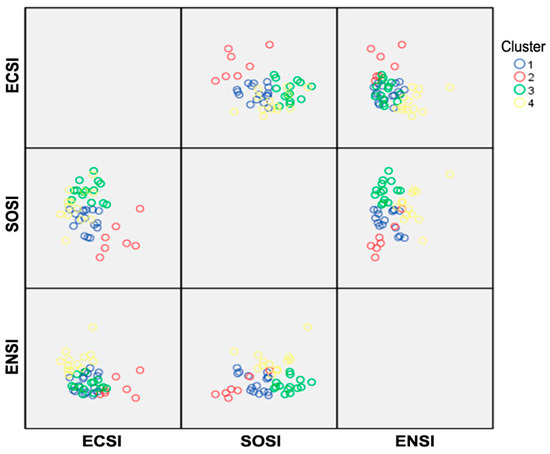
Figure 1.
Distribution of clusters of provinces according to their agricultural sustainability. Legend: ECSI = economic sustainability index, SOSI = social sustainability index, ENSI = environmental sustainability index.
Meanwhile, social sustainability seems to be positively associated with higher diversification of economic activities (higher proportion of non-farm enterprises in total firms operating in the province), lower share of small farms (less than 10 ha), and higher share of agricultural area under Protected Designations of Origin (PDO) and Protected Geographical Indications (PGI).
As for environmental sustainability, the best positioned provinces are those where there are a higher share of agricultural and grassland area in the total province area combined with higher increase of this share between 2006 and 2012, where there has been less burned agricultural area between 2006 and 2012 in proportion of total agricultural land, and where there is better carbon stock and sequestration by agricultural ecosystems and grassland of the province.
Methodologically, the evaluation carried out depends obviously on the normative options that have been introduced at the beginning in relation to the target values or tolerance ranges established for the indicators [44,45,46,47,53,54,55]. A controversial point is the feasibility of using, for each indicator, a common target value for the whole of Spain or, alternatively, a dynamic and different target value adapted to the peculiarities of each province (in this study dynamic values have been used only for indicator EN9: carbon stock). A priori, this idea is suggestive [56], though its implementation could hinder the comparison of results across provinces and with the national average, in addition to the complexity of finding target values adapted to the specificities of each province.
Data standardisation makes it easier to compare different geographical areas [57]. Thus, the methodology used can be replicated (with the necessary adaptations) in other countries, especially those presenting similar agricultural ecosystems. However, there are still conceptual and methodological caveats that need to be explored and resolved in future research. For instance, the debate concerning the convenience to integrate indicators with [42,54,57,58] or without [46,53] weights remains open. Furthermore, the analysis performed is primarily static. It would be desirable to build a time series data making it possible to analyse agricultural sustainability in a dynamic way over time and adapt agricultural policy according to the results achieved.
It is also necessary to bear in mind that the results should be interpreted within the numerous limitations faced in the construction of a viable system of indicators at the subnational (regional) level. The first limitation is that currently the effort of both national and supranational organizations (OECD, European Commission, European Environment Agency, FAO, the World Bank) for the construction of sustainability indicators is mainly focused on a national scale. This implies that information is often not collected or available at lower geographical settings. A second type of difficulty is the intrinsically ambiguous nature of the sustainability indicators [59,60], which are commonly contingent on the contextual and geographical viewpoint. A third limitation is that sustainability indicators hardly allow the causes of the unsustainability of the systems scrutinised to be explained. Finally, the open nature of regional systems allows a portion of the environmental and social externalities to be exported to other neighbouring systems or imported from them, hence a part of the considerations that can be made regarding the sustainability of a regional system will be influenced by external causes [61].
The approach used and the results obtained provide a reference point that may be of use to policymakers when designing or adjusting socio-economic and environmental policies related to agriculture. As stated by Schader et al. [17], sustainability assessment can support agricultural policy, inter alia, in designing and targeting agricultural policy more effectively according to the principles of sustainable development and according to societal needs, in monitoring and controlling the sustainability performance, in allocating payments according to the degree of achieving sustainability goals, and in enabling farmers to develop individual farm sustainability strategies in line with the sustainability goals.
4. Conclusions
Sustainability currently represents one of the main concerns of analysts and political agents involved in regional development. Despite the interest and topicality of sustainable agriculture analysis at the regional level, very few studies have been conducted in this area in Spain and actually none at provincial scale. Hence, the main motivation for this study was the need for assessments of sustainable agricultural systems accounting for regional diversity.
The provincial scale approach helped to point out the significant discrepancies in agricultural sustainability between different groups of provinces as well as by sustainability dimension, which advocates for the relevance of sustainability analysis at this scale. The fact that no Spanish province is highly sustainable simultaneously in all dimensions indicates that, despite the growing efforts undertaken in Spain to implement sustainable agriculture principles, many agricultural areas are still far from the minimum desirable sustainability levels from a balanced, multidimensional perspective.
The top-performing provinces do not necessarily have top performance in all three sustainability dimensions, and vice versa the bottom performing provinces do not necessarily have the lowest performance in all three dimensions. The greatest weaknesses are evident in social and economic sustainability. Structural factors make it difficult to reach desirable sustainability levels. Rural depopulation, the aging of the agrarian population and the scarce diversification of the rural economy are significant factors that negatively influence these two dimensions of sustainability. Conversely, environmental sustainability shows more encouraging results: 56% of the Spanish provinces are already above the reference level. The Spanish agricultural ecosystems provide valuable ecosystem services and are the support of extensive protected areas integrated into the European Natura 2000 network and into the national network of protected natural areas. They are the habitats of species of flora and fauna that are threatened or at risk of extinction.
The assessment carried out can be quite useful for ensuring policy coherence between different national and subnational administrative levels, and also for assisting national and regional decision-makers. It could enhance the effectiveness and the acceptability of agricultural policy for regions and society by bridging the gap between action-based and results-oriented measures at the regional level. Findings could also support the regional dimension of the notion of “public money for public goods”, which is playing a growing role in the debate on the CAP post 2020 currently underway, where environmental and climatic objectives are high on the agenda. Each indicator considered individually is the reflection of a specific evaluation criterion which varies according to the users (political decision-makers, farmers, society), who could use it either for the purpose of simple evaluation or as a guide for decision-making.
In the different clusters of provinces, sustainable agriculture should target positive progress in all three dimensions simultaneously. The progress of one sustainability dimension must not be achieved at the expense of the deterioration of the others. Moreover, even though each province has unique characteristics and policy priorities, cross comparisons between different provinces and clusters can yield useful insights. The cross-province comparisons allow the identification of leaders, learners, laggards and best practices on an indicator-by-indicator as well as aggregate basis. Low-performing provinces on some aspects can learn from the success of peer provinces.
Specific policies to incentive sustainable agriculture will be needed in Spain for a while, as the challenge over the coming decades will continue to be the increase of agricultural production and productivity while at the same time managing natural resources sustainably, including the impacts of climate change. As a corollary, it seems logical to continue supporting extensively rural development programs, the establishment of young farmers and the promotion of initiatives that reinforce the diversification of the rural economy. The implantation of new agrifood and agrotourism companies are welcome as drivers of sustainability in the rural areas. In parallel, it is necessary to increase investment in specific R & D actions and in the improvement of rural services and infrastructure. From the environmental perspective, it is essential to continue promoting actions to further value ecosystem services, so that social agents that facilitate them can be properly recognised and remunerated. Also, it is highly recommended to involve the rural population in the definition of the management plans of protected areas established in agricultural areas or in their borders (agricultural-forest and grassland-forest interfaces). The feasibility of economic compensation for the limitations of certain land uses within these protected areas needs to be addressed. Participatory planning is an effective way to achieve plans acceptable to all the agents involved and thus reduce hostile behaviour that can hinder the achievement of goals relating to biodiversity. Implementing measures of this type could, for instance, reduce the arson in some provinces of Northwestern Spain or burned areas caused by negligence of farmers.
Finally, additional research would be needed to perform sensitivity analysis by applying different thresholds for sustainability targets and different weighting methods to the selected indicators, and exploring their impact on the results. Another interesting avenue would be conducting a dynamic analysis of agricultural sustainability through building time-series data; the analysis performed in this contribution is essentially static. In any event, it is important to highlight the synergies between the different components of sustainability and the need for an appropriate balance between them, avoiding as much as possible the competition between the three dimensions. Sustainability requires a parallel development of economic, social and environmental dimensions.
Author Contributions
The authors contributed equally to this work. Conceptualization, S.M. and J.M.-V.; Data curation, S.M. and J.M.-V.; Formal analysis, S.M. and J.M.-V.; Methodology, S.M. and J.M.-V.; Writing—original draft, S.M. and J.M.-V.
Acknowledgments
This research was performed in the framework of the project: Synergies between agricultural and environmental policies aiming at the sustainability of Mediterranean agrosystems—SYNERCAP (ECO2015-64438-R), coordinated by the Technical University of Madrid and funded by MINECO/FEDER. We thank Pilar Echavarría from IEGD-CSIC for the processing of geospatial data and the Statistics Unit of the Centre for Human and Social Sciences of CSIC for the support given in statistical data processing.
Conflicts of Interest
The authors declare no conflicts of interest.
Appendix A.
Table A1.
Sustainability Indicator Description.
Table A1.
Sustainability Indicator Description.
| Sustainability Dimension | Sustainability Indicator Code | Indicator Definition | Indicator Measurement | Data Source |
|---|---|---|---|---|
| Economic | EC1 | Agricultural productivity | Ratio of gross value added in agriculture, livestock and fisheries, and work units per year, AWU (€/AWU). | National Statistical Institute (NSI) and Agricultural Census 2009. http://www.ine.es/CA/Inicio.do?locale=en_US |
| EC2 | Capital stock | Market value of tangible assets in agriculture per labour unit (€/AWU). | Sources: BBVA Foundation, NSI | |
| EC3 | Rural development | Share of public support allocated to rural development programmes (2008), in %. | [62] | |
| EC4 | Agricultural labour intensity index | Number of annual agricultural work units per 100 ha of tilled farmland (AWU/100 ha). | Agricultural Census 2009, NSI | |
| EC5 | Full time farmers | Ratio of full time farmers whose main professional activity takes place in the farm to the total number of registered farmers (in %). | Agricultural Census 2009, NSI | |
| EC6 | Agricultural machinery intensity index | Agricultural machines density per 100 ha of cultivated area. | Census of machinery 2010, MAPAMA. http://www.mapama.gob.es/es/agricultura/temas/medios-de-produccion/maquinaria-agricola/estadisticas/ | |
| EC7 | Variation in per capita Gross Domestic Product | Index base 100 in constant prices: | NSI: http://www.ine.es/dyngs/INEbase/es/operacion.htm?c=Estadistica_C&cid=1254736167628&menu=resultados&idp=1254735576581 | |
| EC8 | Investment in R&D | Ratio of investment in research and development per Gross Domestic Product | 2013, BBVA-IVIE and NSI | |
| Social | SO1 | Farmers aging index | Ratio of farmers older than 55 years to the total number of farmers (in %). The value of this indicator has been reversed (100—indicator value) in order to be additive to other indicators positively related to sustainability. | Agricultural Census 2009, NSI |
| SO2 | Non-farm enterprises | Percentage of non-farm enterprises in total. | Agricultural Census 2009, and Central Business Directory 2009, NSI: http://www.ine.es/dynt3 /inebase/en/index.htm?padre=51&dh=1 | |
| SO3 | Small farms | Percentage of farms with an acreage of less than 10 ha. The value of this indicator has been reversed (100—indicator value) in order to be additive to other indicators positively related to sustainability. | Agricultural Census 2009, NSI | |
| SO4 | Salaried labour | Share of paid work units in total work units per year. | Agricultural Census 2009, NSI | |
| SO5 | Quality areas | Share of agricultural area and grasslands under Protected Designations of Origin and Protected Geographical Indications. | MAPAMA: http://www.mapama.gob.es/es/cartografia-y-sig/ide/descargas/ | |
| Environmental | EN1 | Agricultural land | Share of agricultural and grassland area in total area. | Copernicus Land Monitoring Services (2016). Pan-European. CORINE-Land Cover, CLC 2012. 18.5 version. http://land.copernicus.eu/pan-european/corine-land-cover/clc-2012/view Accessed 26 June 2018 and GIS data (Total surface—of each province) |
| EN2 | Variation of agricultural land | Variation of agricultural land and grassland between 2006 and 2012. The difference is quantified relative to 100 (100=base index value CLC2006 surface). | CORINE Land Cover maps 2006 and 2012 | |
| EN3 | Organic farming | Share of organic land in total agricultural land (CLC 2012). | MAPAMA, 2012 and CLC 2012 | |
| EN4 | Livestock pressure | This indicator can be interpreted from different perspectives. From the environmental point of view, we have considered it as positive: livestock keeps a less dense vegetation cover, hence the wildfire risk is lower. | Agricultural Census 2009, NSI for Animal Units and CLC2006 for Permanent Pastures Area | |
| EN5 | Burned agricultural area | Percentage of the burned agricultural area (BAA) between 2006 and 2012 with respect to the total agricultural land (AL): The value of this indicator has been reversed (100—indicator value) in order to be additive to other indicators positively related to sustainability. | CLC 2012 and European Forest Fire Information System—EFFIS http://effis.jrc.ec.europa.eu, European Commission Joint Research Centre, [63] | |
| EN6 | Terrestrial protected areas | Percentage of terrestrial protected areas (Nationally Designated Spaces and Biosphere Reserves) located in agricultural areas over the total arable land | Database of Biodiversity (MARM-Ministry of Environment), GIS of Europarc-Spain and GIS data, CLC 2012 | |
| EN7 | Natura 2000 network | Percentage of area occupied by areas under Natura 2000 network (Special Protection Areas for Birds, SPA, Sites of Community Importance, SCI, Habitats of Community Importance priority) in agricultural areas over arable land | Database of Biodiversity (MARM-Ministry of Environment), GIS of Europarc-Spain and GIS data, CLC 2012 | |
| EN8 | Soil erosion | Percentage of geographical area (ha) affected by intense or extremely intense laminar and gully erosion (>25 ton/ha/year) in total erodible surface. The value of this indicator was reversed (100—indicator value) in order to be additive to other indicators positively related to sustainability. | National Inventory of Soil Erosion and statements erosive map (1987–2002) | |
| EN9 | Carbon stock | First we calculated the CO2 sequestration made by the agricultural ecosystems and grasslands of each province taking into account the surface area of each class of CORINE Land Cover 2012 (LC). Then, we applied a coefficient of CO2 density (D)—tons/ha ([64,65,66] and our modification). Second we considered emissions (E) related to agricultural management in 2012 [54] in each province based on the area occupied by these ecosystems. The indicator is the ratio: The target value is dynamic looking for at least the balance between CO2 emissions and sequestration in each province. | CLC 2012, [67] (http://www.fao.org/faostat/en/#country/203) |
Source: Authors’ construction.
Appendix B. Provincial Distribution of Composite Sustainability Indices

Figure A1.
Economic sustainability of Spanish agriculture.

Figure A2.
Social sustainability of Spanish agriculture.

Figure A3.
Environmental sustainability of Spanish agriculture.
References
- World Commission on Environment and Development. Our Common Future; Oxford University Press: Oxford, UK, 1987; Available online: http://www.un-documents.net/our-common- future.pdf (accessed on 15 January 2018).
- Pretty, J. Agricultural sustainability: Concepts, principles and evidence. Philos. Trans. R. Soc. B 2008, 363, 447–465. [Google Scholar] [CrossRef] [PubMed]
- Darnhofer, I.; Fairweather, J.; Moller, H. Assessing a farm’s sustainability: Insights from resilience thinking. Int. J. Agric. Sustain. 2010, 8, 186–198. [Google Scholar] [CrossRef]
- DeLonge, M.S.; Miles, A.; Carlisle, L. Investing in the transition to sustainable agriculture. Environ. Sci. Policy 2016, 55, 266–273. [Google Scholar] [CrossRef]
- European Commission. Statistical Factsheet Spain; European Commission, DG Agriculture and Rural Development: Brussels, Belgium, 2018. Available online: https://ec.europa.eu/agriculture/sites/agriculture/files/statistics/factsheets/pdf/es_en.pdf (accessed on 11 June 2018).
- Salazar-Ordóñez, M.; Rodríguez-Entrena, M.; Sayadi, S. Agricultural Sustainability from a Societal View: An Analysis of Southern Spanish Citizens. J. Agric. Environ. Ethics 2013, 26, 473–490. [Google Scholar] [CrossRef]
- Slätmo, E.; Fischer, K.; Röös, E. The Framing of Sustainability in Sustainability Assessment Frameworks for Agriculture. Sociol. Rural. 2017, 57, 378–395. [Google Scholar] [CrossRef]
- European Commission. Overview of CAP Reform 2014–2020. Agricultural Policy Perspectives Brief; European Commission, DG Agriculture and Rural Development: Brussels, Belgium, 2013; Volume 5. Available online: https://eige.europa.eu/resources/05_en.pdf (accessed on 20 February 2018).
- European Commission. CAP Reform—An Explanation of the Main Elements; MEMO/13/937; European Commission, DG Agriculture and Rural Development: Brussels, Belgium, 2013. Available online: http://europa.eu/rapid/press-release_MEMO-13-621_en.htm (accessed on 5 April 2018).
- International Centre for Trade and Sustainable Development. The European Union CAP: Towards Public Money for Public Goods? ICTSD: Geneva, Switzerland, 2015; Available online: https://www.ictsd.org/sites/default/files/The%20EU%20CAP%20-Towards%20Public%20Money%20for%20Public%20Goods_1.pdf (accessed on 15 December 2017).
- Mili, S.; Júdez, L.; de Andrés, R. Investigating the impacts of EU CAP reform 2014-20 and developments in sustainable olive farming systems. New Medit. 2017, 16, 2–10. Available online: http://newmedit.iamb.it/edizioni_new_medit,229,229,2017,168,1107,investigating-the-impacts-of-eu-cap-reform-2014-20-and-developments-in-sustainable-olive-farming-systems-.htm (accessed on 22 June 2018).
- OECD. OECD Agricultural Policy Monitoring and Evaluation 2018; OECD: Paris, France, 2018; Available online: http://www.oecd.org/tad/agricultural-policies/monitoring-and-evaluation.htm (accessed on 27 September 2018).
- European Commission. The Future of Food and Farming: Communication from the Commission to the European Parliament, the Council, the European Economic and Social Committee and the Committee of the Regions; European Commission: Brussels, Belgium, 2017. Available online: https://ec.europa.eu/agriculture/sites/agriculture/files/future-of-cap/future_of_food_and_farming_communication_en.pdf (accessed on 14 March 2018).
- Ness, B.; Urbel-Piirsalu, E.; Anderberg, S.; Olsson, L. Categorising tools for sustainability assessment. Ecol. Econ. 2007, 60, 498–508. [Google Scholar] [CrossRef]
- Schader, C.; Grenz, J.; Meier, M.S.; Stolze, M. Scope and precision of sustainability assessment approaches to food systems. Ecol. Soc. 2014, 19, 42. [Google Scholar] [CrossRef]
- Wustenberghs, H.; Coteur, I.; Debruyne, L.; Marchand, F. TempAg Pilot Activity 1.1. 1. Survey of Sustainability Assessment Methods; Institute for Agricultural and Fisheries Research ILVO: Merelbeke, Belgium, 2015. [Google Scholar]
- Schader, C.; Grovermann, C.; Frick, R.; Grenz, J.; Stolze, M. Towards a New Public Goods Payment Model for Remunerating Farmers under the CAP Post-2020. Potential of Sustainability Assessment tools for Improving the Effectiveness, Efficiency, and Acceptance of the CAP; Research Institute of Organic Agriculture FIBL: Frick, Switzerland, 2017; Available online: https://www.ifoam-eu.org/sites/default/files/towards_a_new_public_goods_payment_model_for_remunerating_farmers_under_the_cap_post-2020_report_by_fibl.pdf (accessed on 10 April 2018).
- FAO. Sustainability Assessment of Food and Agriculture systems (SAFA); Food and Agriculture Organization of the United Nations (FAO): Rome, Italy, 2014; Available online: http://www.fao.org/nr/sustainability/sustainability-assessments-safa/en/ (accessed on 13 June 2018).
- Schader, C.; Baumgart, L.; Landert, J.; Muller, A.; Ssebunya, B.; Blockeel, J.; Weisshaidinger, R.; Petrasek, R.; Mészáros, D.; Padel, S.; et al. Using the Sustainability Monitoring and Assessment Routine (SMART) for the Systematic 4. Analysis of Trade-Offs and Synergies between Sustainability Dimensions and Themes at Farm Level. Sustainability 2016, 8, 274. [Google Scholar] [CrossRef]
- Binder, C.R.; Feola, G.; Steinberger, J.K. Considering the normative, systemic and procedural dimensions in indicator-based sustainability assessments in agriculture. Environ. Impact Assess. 2010, 30, 71–81. [Google Scholar] [CrossRef]
- Binder, C.R.; Feola, G. Normative, systemic and procedural aspects: A review of indicator-based sustainability assessments in agriculture. In Methods and Procedures for Building Sustainable Farming Systems; Marta-Costa, A.A., Silva, E., Eds.; Springer: New York, NY, USA, 2013; pp. 33–46. [Google Scholar]
- Latruffe, L.; Diazabakana, A.; Bockstaller, C.; Desjeux, Y.; Finn, J.; Kelly, E.; Ryan, M.; Uthes, S. Measurement of sustainability in agriculture: A review of indicators. Stud. Agric. Econ. 2016, 118, 123–130. [Google Scholar] [CrossRef]
- Rigby, D.; Woodhouse, P.; Young, T.; Burton, M. Constructing a farm level indicator of sustainable agricultural practice. Ecol. Econ. 2001, 39, 463–478. [Google Scholar] [CrossRef]
- Santiago-Brown, I.; Metcalfe, A.; Jerram, C.; Collins, C. Sustainability Assessment in Wine-Grape Growing in the New World: Economic, Environmental, and Social Indicators for Agricultural Businesses. Sustainability 2015, 7, 8178–8204. [Google Scholar] [CrossRef]
- Torres, J.; Valera, D.L.; Belmonte, L.J.; Herrero-Sánchez, C. Economic and Social Sustainability through Organic Agriculture: Study of the Restructuring of the Citrus Sector in the “Bajo Andarax” District (Spain). Sustainability 2016, 8, 918. [Google Scholar] [CrossRef]
- Reed, M.S.; Fraser, E.D.G.; Dougill, A.J. An adaptive learning process for developing and applying sustainability indicators with local communities. Ecol. Econ. 2006, 59, 406–418. [Google Scholar] [CrossRef]
- Gómez-Limón, J.A.; Sanchez-Fernandez, G. Empirical evaluation of agricultural sustainability using composite indicators. Ecol. Econ. 2010, 69, 1062–1075. [Google Scholar] [CrossRef]
- Garrido, A. (Ed.) Indicadores de Sostenibilidad de la Agricultura y Ganadería Españolas; Fundación Cajamar: Almería, Spain, 2011; Available online: http://www.publicacionescajamar.es/pdf/series-tematicas/sostenibilidad/indicadores-de-sostenibilidad.pdf (accessed on 13 November 2017).
- Gómez-Limón, J.A.; Reig Martínez, E. (Eds.) La Sostenibilidad de la Agricultura española; Cajamar Caja Rural: Almería, Spain, 2013; Available online: http://www.publicacionescajamar.es/pdf/series-tematicas/sostenibilidad/la-sostenibilidad-de-la-agricultura.pdf (accessed on 14 December 2017).
- Galdeano, E.; Aznar, J.A.; Pérez Mesa, J.C. Contribuciones Económicas, Sociales y Medioambientales de la Agricultura Intensiva de Almería. Un Análisis de Sinergias Entre las Dimensiones de Sostenibilidad; Cajamar Caja Rural: Almería, Spain, 2016; Available online: http://www.publicacionescajamar.es/series-tematicas/sostenibilidad/contribuciones-economicas-sociales-y-medioambientales-de-la-agricultura-intensiva-de-almeria-un-analisis-de-las-sinergias-entre-las-dimensiones-de-la-sostenibilidad/ (accessed on 9 July 2018).
- de Olde, E.M.; Oudshoorn, F.W.; Sørensen, C.A.G.; Bokkers, E.A.M.; de Boer, I.J.M. Assessing sustainability at farm-level: Lessons learned from a comparison of tools in practice. Ecol. Indic. 2016, 66, 391–404. [Google Scholar] [CrossRef]
- Coteur, I.; Marchand, F.; Debruyne, L.; Dalemans, F.; Lauwers, L. A framework for guiding sustainability assessment and on-farm strategic decision making. Environ. Impact Assess. 2016, 60, 16–23. [Google Scholar] [CrossRef]
- de Olde, E.M.; Sautier, M.; Whitehead, J. Comprehensiveness or implementation: Challenges in translating farm-level sustainability assessments into action for sustainable development. Ecol. Indic. 2018, 85, 1107–1112. [Google Scholar] [CrossRef]
- Poppe, K.; Vrolijk, H. Microdata: A critical source for policy evaluation. EuroChoices 2018, 17, 28–35. [Google Scholar] [CrossRef]
- Costanza, R.; d’Arge, R.; de Groot, R.; Farber, S.; Grasso, M.; Hannon, B.; Limburg, K.; Naeem, S.; O’Neill, R.V.; Paruelo, J.; et al. The value of the world’s ecosystem services and natural capital. Nature 1997, 387, 253–260. [Google Scholar] [CrossRef]
- Spangenberg, J. Sustainability Indicators. A Compass on the Road towards Sustainability; Wuppertal Institute: Wuppertal, Germany, 1998; Available online: https://epub.wupperinst.org/frontdoor/deliver/index/docId/721/file/WP81.pdf (accessed on 18 October 2017).
- European Commission. Communication to the Council and the European Parliament. Development of Agri-Environmental Indicators for Monitoring the Integration of Environmental Concerns into the Common Agricultural Policy. COM (2006) 508 Final; European Commission: Brussels, Belgium, 2006.
- Pintus, F.; Giraud, J.P. Measuring agricultural and rural development. In Mediterra 2009: Rethinking Rural Development in the Mediterranean; Hervieu, B., Thibault, H.L., Eds.; Presses de Sciences Po: Paris, France, 2009; pp. 333–351. [Google Scholar]
- Rametsteiner, E.; Pülzl, H.; Alkan-Olsson, J.; Frederiksen, P. Sustainability indicator development-science or political negotiation? Ecol. Indic. 2011, 11, 61–70. [Google Scholar] [CrossRef]
- Pülzl, H.; Prokofieva, I.; Berg, S.; Rametsteiner, E.; Aggestam, F.; Wolfslehner, B. Indicator development in sustainability impact assessment: Balancing theory and practice. Eur. J. For. Res. 2012, 131, 35–46. [Google Scholar] [CrossRef]
- Kniivilä, M.; Bäckman, S.; Horne, P.; Martinez-Vega, J.; Mili, S.; Pyykkönen, P. Frameworks for Sustainable Agriculture and Forestry: Applications to Finland and Spain; PTT: Helsinki, Finland, 2012; Available online: http://www.ptt.fi/julkaisut-ja-hankkeet/kaikki-julkaisut/frameworks-for-sustainable-agriculture-and-forestry-applications-to-finland-and-spain.html (accessed on 20 February 2017).
- Martínez-Vega, J.; Mili, S.; Echavarría, P. Assessing forest sustainability: Evidence from Spanish provinces. Geoforum 2016, 70, 1–10. [Google Scholar] [CrossRef]
- Morse, S.; Fraser, E.D.G. Making “dirty” nations look clean? The nation state and the problem of selecting and weighting indices as tools for measuring progress towards sustainability. Geoforum 2005, 36, 625–640. [Google Scholar] [CrossRef]
- Maes, W.H.; Fontaine, M.; Rongé, K.; Hermy, M.; Muys, B. A quantitative indicator framework for stand level evaluation and monitoring of environmentally sustainable forest management. Ecol. Indic. 2011, 11, 468–479. [Google Scholar] [CrossRef]
- Prieto, F.; Ruiz, P. Prospectiva 2030 en los Cambios de Ocupación del Suelo en España y sus Impactos en el Ciclo Hidrológico: Algunas Ideas Para un Futuro Sostenible; Expo Zaragoza 2008: Zaragoza, Spain, 2008; Available online: https://www.zaragoza.es/contenidos/medioambiente/cajaAzul/13S5-P2-PRIETO RUIZ_ACC.pdf (accessed on 15 May 2018).
- Böhringer, C.; Jochem, P.E.P. Measuring the inmeasurable. A survey of sustainability indices. Ecol. Econ. 2007, 63, 1–8. [Google Scholar] [CrossRef]
- Bockstaller, C.; Guichard, L.; Makowski, D.; Aveline, A.; Girardin, P.; Plantureux, S. Agri-environmental indicators to assess cropping and farming systems. A review. Agron. Sustain. Dev. 2008, 28, 139–149. [Google Scholar] [CrossRef]
- Nardo, M.; Saisana, M.; Saltelli, A.; Tarantola, S. Tools for Composite Indicators Building; European Commission, Institute for the Protection and Security of the Citizen, JRC: Ispra, Italy, 2005.
- Talukder, B.; Hipel, K.W.; vanLoon, G.W. Developing Composite Indicators for Agricultural Sustainability Assessment: Effect of Normalization and Aggregation Techniques. Resources 2017, 6, 66. [Google Scholar] [CrossRef]
- Sajeva, M.; Gatelli, D.; Tarantola, S.; Hollanders, H. Methodology Report on European Innovation Scoreboard 2005; European Commission, Enterprise Directorate-General: Brussels, Belgium, 2005.
- Salzman, J. Methodological Choices Encountered in the Construction of Composite Indices of Economic and Social Well-Being; Center for the Study of Living Standards: Ottawa, ON, Canada, 2003. [Google Scholar]
- Tate, E. Social vulnerability indices: A comparative assessment using uncertainty and sensitivity analysis. Nat. Hazards 2012, 63, 325–347. [Google Scholar] [CrossRef]
- Esty, D.C.; Levy, M.; Srebotnjak, T.; de Sherbinin, A. Environmental Sustainability Index: Benchmarking National Environmental Stewardship; Yale Center for Environmental Law & Policy: New Haven, CT, USA, 2005; Available online: http://archive.epi.yale.edu/files/2005_esi_report.pdf (accessed on 16 January 2018).
- Salvati, L.; Carlucci, M. A composite index of sustainable development at the local scale: Italy as a case study. Ecol. Indic. 2014, 43, 162–171. [Google Scholar] [CrossRef]
- Moldan, B.; Svatava, J.; Hák, T. How to understand and measure environmental sustainability: Indicators and targets. Ecol. Indic. 2012, 17, 4–13. [Google Scholar] [CrossRef]
- Trexler, J.C.; Goss, C.W. Aquatic fauna as indicators for Everglades restoration: Applying dynamic targets in assessments. Ecol. Indic. 2009, 9, s108–s119. [Google Scholar] [CrossRef]
- OECD. Handbook on Constructing Composite Indicators. Methodology and User Guide; OECD: Paris, France, 2008; Available online: http://www.oecd.org/sdd/42495745.pdf (accessed on 16 November 2017).
- Rodrigues, G.S.; Rodrigues, I.A.; Buschinelli, C.C.A.; de Barros, I. Integrated farm sustainability assessment for the environmental management of rural activities. Environ. Impact Assess. 2010, 30, 229–239. [Google Scholar] [CrossRef]
- Parris, T.; Kates, R. Characterizing and measuring sustainable development. Annu. Rev. Environ. Resour. 2003, 28, 559–586. [Google Scholar] [CrossRef]
- Hák, T.; Janousková, S.; Moldan, B. Sustainable Development Goals: A need for relevant indicators. Ecol. Indic. 2016, 60, 565–573. [Google Scholar] [CrossRef]
- Reig Martínez, E.; Gómez-Limón, J.A. La sostenibilidad de la agricultura actual. In La Sostenibilidad de la Agricultura Española; Gómez-Limón, J.A., Reig Martínez, E., Eds.; Cajamar Caja Rural: Almería, Spain, 2013; pp. 37–86. [Google Scholar]
- Sineiro, F.; Lorenzana, R.; Vázquez González, I. Distribución territorial de las ayudas. In Apoyo Público a la Agricultura Española 2003–2010; García Álvarez-Coque, J.M., Sineiro, F., Eds.; Ministerio de Medio Ambiente y Medio Rural y Marino MARM: Madrid, Spain, 2011; pp. 157–198. Available online: http://www.usc.es/ecoagra/arquivos//2011-cap%C3%ADtulo-de-livro-Sineiro-Garc%C3%ADa-Lorenzana-Fern%C3%A1ndez-e-V%C3%A1zquez-Gonz%C3%A1lez-Distribuci%C3%B3n-territorial-de-las-ayudas-PAC.pdf (accessed on 28 February 2018).
- San Miguel-Ayanz, J.; Schulte, E.; Schmuck, G.; Camia, A.; Strobl, P.; Libertà, G.; Giovando, C.; Boca, R.; Sedano, F.; Kempeneers, P.; et al. Comprehensive monitoring of wildfires in Europe: The European Forest Fire Information System (EFFIS). In Approaches to Managing Disaster—Assessing Hazards, Emergencies and Disaster Impacts; Tiefenbacher, J., Ed.; InTech: London, UK, 2012; pp. 87–105. [Google Scholar]
- Cruickshank, M.M.; Tomlinson, R.W.; Trew, S. Application of CORINE land-cover mapping to estimate carbon stored in the vegetation of Ireland. J. Environ. Manag. 2000, 58, 269–287. [Google Scholar] [CrossRef]
- Molin, P.G. Estimation of Vegetation Carbon Stock in Portugal Using Land Use/Land Cover Data; University of Nova Lisboa: Lisbon, Portugal, 2010; Available online: https://run.unl.pt/bitstream/10362/2730/3/TGEO0028.pdf (accessed on 22 March 2018).
- OSE. Biodiversidad en España. Base de la Sostenibilidad ante el Cambio Global; Observatorio de la Sostenibilidad (OSE) en España: Madrid, Spain, 2011; Available online: https://www.researchgate.net/publication/280528506_Biodiversidad_en_Espana_Base_para_la_sostenibilidad_ante_el_cambio_global (accessed on 18 May 2018).
- FAO. Spain, Country Indicators, Emissions; Food and Agriculture Organization of the United Nations (FAO): Rome, Italy, 2018; Available online: http://www.fao.org/faostat/en/#country/203 (accessed on 21 September 2018).
© 2019 by the authors. Licensee MDPI, Basel, Switzerland. This article is an open access article distributed under the terms and conditions of the Creative Commons Attribution (CC BY) license (http://creativecommons.org/licenses/by/4.0/).