Social Media Data-Based Sentiment Analysis of Tourists’ Air Quality Perceptions

1
School of History Culture and Tourism, Jiangsu Normal University, Xuzhou 221116, China
2
School of Geography, Geomatics and Planning, Jiangsu Normal University, Xuzhou 221116, China
*
Author to whom correspondence should be addressed.
Sustainability 2019, 11(18), 5070; https://doi.org/10.3390/su11185070
Submission received: 24 July 2019
/
Revised: 7 September 2019
/
Accepted: 11 September 2019
/
Published: 17 September 2019
(This article belongs to the Section Environmental Sustainability and Applications)
Abstract
:Analyzing tourists’ perceptions of air quality is of great significance to the study of tourist experience satisfaction and the image construction of tourism destinations. In this study, using the web crawler technique, we collected 27,500 comments regarding the air quality of 195 of China’s Class 5A tourist destinations posted by tourists on Sina Weibo from January 2011 to December 2017; these comments were then subjected to a content analysis using the Gooseeker, ROST CM (Content Mining System) and BosonNLP (Natural Language Processing) tools. Based on an analysis of the proportions of sentences with different emotional polarities with ROST EA (Emotion Analysis), we measured the sentiment value of texts using the artificial neural network (ANN) machine learning method implemented through a Chinese social media data-oriented Boson platform based on the Python programming language. The content analysis results indicated that in the adaption stage in Sina Weibo, tourists’ perceptions of air quality were mainly positive and had poor air pollution crisis awareness. Objective emotion words exhibited a similarly high proportion as subjective emotion words, indicating that taking both objective and subjective emotion words into account simultaneously helps to comprehensively understand the emotional content of the comments. The sentiment analysis results showed that for the entire text, sentences with positive emotions accounted for 85.53% of the total comments, with a sentiment value of 0.786, which belonged to the positive medium level; the direction of the temporal “up-down-up” changes and the spatial pattern of high in the south and low in the north (while having little difference between the east and the west) were basically consistent with reality. A further exploration of the theoretical basis of the semi-supervised ANN approach or the introduction of other machine learning methods using different data sources will help to analyze this phenomenon in greater depth. The paper provides evidence for new data and methods for air quality research in tourist destinations and provides a new tool for air quality monitoring.
1. Introduction
Air quality, climate change and ozone depletion are three important indicators for assessing the sustainable development of the atmospheric environment [1], of which the first two have become major challenges in tourism development [2]. Coping with these challenges must involve tourists as core stakeholders. Compared with achievements from extensive studies on tourists’ perceptions of climate change [3], tourists’ perceptions of air quality have only attracted attention recently and have allowed for some achievements, mainly from the data acquired through traditional survey methods [4,5,6,7].
As an increasing number of people are voicing their feelings and opinions about their living environments on social media, it has proven feasible and effective to use social media data to monitor the quality of the environment, including air pollution, which has long been a serious public health issue [8,9,10]. Performing a sentiment analysis on social media data to extract public opinions also provides a new data source and a new method for tourism research [11]. Sentiment analysis is the computational study of people’s perceptions, evaluations, attitudes, and emotions concerning entities, individuals, problems, events, themes, and attributes [12]. The purpose of a sentiment analysis is to extract the emotional orientation of a text toward a certain thing based on the words in the unstructured text [13]. Currently, sentiment analysis has allowed for many achievements in tourism studies [14,15,16,17,18,19,20], and existing UGC (user-generated content) data can effectively support sentiment analysis to understand tourists’ perception of the overall environmental perception of tourism destinations [21]; however, whether the existing data can help understand tourists’ perceptions of air quality at the level of environmental components through sentiment analysis is still a proposition worth examining.
Since the Office of the State Council issued the Action Plan for Air Pollution Prevention and Control in 2013, the Chinese government has made remarkable progress in air quality control, and significant improvements have been made in key areas [22]. China is both a major tourist destination and a social media superpower; tourists have been very keen on sharing a wide range of tourism content on social media [11]. Therefore, it is ideal to choose China as a pilot area to verify whether the existing data can support the study of tourists’ perceptions of air quality. In summary, in this study, we collected Sina Weibo data on China’s Class 5A tourism destinations, and these data were then subjected to an artificial neural network (ANN) machine learning method to perform a sentiment analysis to verify whether the existing data can support the study of tourists’ perceptions of the air quality of various tourism destinations. After demonstrating feasibility, we then comprehensively and systematically summarized the features and patterns of the perception from three levels, i.e., macro, meso and micro levels; we also made comparisons with cases from the United States to introduce a new research approach to this field and enrich the content system from points to area, providing implications for the control of air pollution crises.
2. Literature Review
2.1. Tourist’ Perception of Air Quality
Air is an important natural resource; air quality has an important impact on tourism development [23]. To tourists, air pollution is more detrimental to the atmospheric environment than ozone depletion [4]. Before going to Hong Kong, tourists generally have a neutral attitude towards the air quality in the region [24] but often express dissatisfaction after a tour [25]. Most tourists in Beijing are aware of the risks of haze to health [5], and a structural equation model further revealed that concerns about haze directly affect their environmental risk perceptions and tourism satisfaction [6]. Becken et al. [7] conducted a survey on residents in the United States and Australia and found that air quality plays a major negative role in the decision process regarding China as a potential tourist destination. These studies on tourists’ perceptions of air quality indicate that the research subjects have mostly been countries or cities at the meso and macro levels, but these studies have rarely focused on tourism destinations, i.e., the micro level, with a limited number of cases, mainly through survey data-oriented statistical methods.
2.2. Sentiment Analysis in Tourism
Sentiment analysis has gained increasing interest among researchers in recent years [26]. Current sentiment analysis methods fall into two categories: Lexicon matching methods based on a sentiment dictionary and corpus-based machine learning methods [27,28]. According to different algorithms (e.g., geometry, probability and artificial intelligence), machine learning methods can be classified into three categories: (1) The support vector machine (SVM) method, which looks for the best linear separation between the data expressing positive emotions and those expressing negative emotions; (2) the naïve Bayesian (NB) method, which estimates the probability of a certain emotion based on the attributes of a text; and (3) the artificial neural network method, which simulates the biological brain through data processing using self-organizing networks of “neurons.” Sentiment analysis varies with the granularity of the processed text at various levels, such as word, phrase, sentence and text [29].
In recent years, sentiment analysis has allowed for abundant achievements in tourism studies. Existing studies have mainly focused on overall perception of hotels [14,16,28,30,31,32,33] and tourism destinations [15,17,18,20,34]. In terms of methodology, dictionary matching method and machine learning methods have been applied equally frequently. The dictionaries used mainly includes English and Chinese dictionaries, such as WordNet, SentiWordNet, and HowNet [15,20,35,36], and some dictionaries used in studies, such as the Valence Aware Dictionary for Sentiment Reasoning (VADER), even include a tourism vocabulary [21,31]. Among the aforementioned three types of machine learning methods, the support vector machine and the naïve Bayesian methods have been widely used in tourism research due to their fast processing speeds [18]. The artificial neural network has yielded the most accurate results, but its high computational requirements have resulted in relatively few studies employing it [17,18,37]. The data of the above-described sentiment analyses of tourism have often been from multilingual travel websites and social media data in English, while social media data in Chinese have rarely been addressed. The majority of studies discuss and compare analysis methodology rather than using sentiment analysis methods for research [11,18].
In addition to the abovementioned general studies, in recent years, special studies using sentiment analyses of social media data have also attracted the attention of tourism researchers. Among them, tourists’ perception of environmental quality has been very representative. Becken et al. [21], Saura et al. [38], and Saura et al. [39] conducted sentiment analyses on tweets (comments on Twitter) regarding the overall environmental quality of tourism destinations, including the natural environment and social environment of Australia’s Great Barrier Reef tourism destination and Spain’s and Switzerland’s hotels, using the vocabulary matching method, the unsupervised support vector machine method, and the Python-programmed algorithm; they argued that air quality has a very important impact on the destinations’ environments. Unlike the high correlation between tourists’ emotions and air quality based on questionnaire survey data [40], the correlation obtained through the analysis of large data collected from Weibo using the dictionary matching method is rather weak [41], which also represents a few studies that have analyzed tourists’ perceptions of air quality based on social media data and focused only on a single city. In summary, using a sentiment analysis of social media data to understand tourists’ perception of air quality has been covered in a few environmental thematic studies, and a small number of studies focusing only on this environmental component have been published. However, whether existing data can support the general research and systematically sum up the characteristics and laws of this perception has yet to be verified.
3. Research Methods and Data Sources
3.1. Research Methods
In content analysis, we adopted three word segmentation methods—the widely used dictionary matching-based ROST CM (Content Mining System) Chinese and English word segmentation method and two machine learning algorithm-based Chinese word segmentation methods, Gooseeker and BosonNLP (Natural Language Processing)—to conduct a word frequency analysis on social media data and use the semantic network diagram generated through ROST CM to compare and analyze the content and structure of the comments. In the sentiment analysis, to address the issue that the existing studies have rarely used social media data in Chinese, we adopted the semi-supervised and Chinese corpus-based artificial neural network machine learning method through the Boson platform, programmed using Python 3.0 based on an analysis of the proportions of sentence polarities of text using the emotional dictionary method of ROST EA (Emotion Analysis), i.e., a hybrid method that primarily an artificial neural network and secondarily affects ROST EA.
The artificial neural network method has two distinct characteristics. First, it can effectively dock data from Weibo. The semantic corpus of the platform was automatically constructed based on data from channels such as Weibo and online forums. In the analysis, we set the URL (Uniform Resoure Locator) parameters to define the corpus as the Weibo corpus, thus achieving seamless docking. Second, the artificial neural network method has a high accuracy. Kirilenko et al. [18] established the evaluation criteria of sentiment analysis, and the calculation formulas are presented in Table 1. The accuracy (A) represents the ratio of the number of correct topics to the total number of topics in the test results. The precision (P) indicates the ratio of the number of topics of a specific polarity in the detection results to the number of topics of the same polarity. The recall (R) indicates the ratio of the number of correctly classified topics in the test results to the total number of topics that should be of the same classification. The F1 value synthesizes the precision and recall values to capture the overall pros and cons of the algorithm.
There are two reasons for the high accuracy of the artificial neural network method. First, the size of the training corpus reaches the level of tens of millions. With machine learning methods, the larger the size of the training corpus is, the higher the accuracy of the analysis is [26,34]. Alaei et al. [11] also noted that machine learning methods would be heavily used for more complex sentiment analysis with more extensive training corpuses in the future. Second, the artificial neural network method not only effectively identifies various parts of speech of general vocabularies, such as nouns and verbs, but also recognizes proper nouns such as Timothy Easton, comprehends peculiar glossaries such as slang terms, and assesses the sentiment of online buzzwords. The method can even uncover the implicit emotions of neutral comments. The results of the artificial neural network method showed that the sentiment score of the proverb “liu wan’er” (go for a stroll) was 0.73, the sentiment scores of the online buzzwords “555” and “666” were 0.04 and 0.89, respectively, and those of the sentences “The smog in Beijing cannot be avoided” and “Beijing makes people hide from smog” were 0.25 and 0.80, respectively.
There were two stages to the Python 3.0 program. The first entailed calling the artificial neural network method on the Boson platform to analyze chapter-level review texts. The other stage involved generating the output of the annual, quarterly, and monthly sentiment scores of the scenic destinations. Considering that the sentiment score was between 0 and 1 and the threshold value to distinguish positive and negative images was 0.5, we established the following grade criteria based on the equidistance principle: Extremely poor (0~0.100), very poor (0.101~0.200), poor (0.201~0.300), somewhat poor (0.301~0.400), slightly below average (0.401~0.500), slightly above average (0.501~0.600), somewhat good (0.601~0.700), good (0.701~0.800), very good (0.801~0.900), and excellent (0.901~1).
3.2. Data Source
Sina Weibo was launched in August 2009, and by 2013, it had 536 million registered users [42]. Like other online social media platforms such as Facebook and Twitter, Sina Weibo has a large text corpus and is an important data source for the study of sentiment analysis [43,44]. The social media data were collected from Sina Weibo using a web crawler, “Bazhuayu” (octopus). Given that the time units used in this study were mainly years and quarters, we set the time period from January 1, 2010 to December 31, 2017 when collecting the data in 2018. The data were collected using query keywords of “air” and “name of the 5A tourism destination,” and denoised as follows: (1) Redundant comments were deleted; (2) the data from 2010 were discarded due to the data size being too small; (3) information from government agencies, enterprises and other organizations, which also have Weibo accounts, was excluded because we wanted to focus on public opinions that are disseminated online; and (4) among 249 tourism destinations, those that had less than ten comments were excluded. The data cleansing was performed manually, which reflected the semi-supervised nature of the machine learning method adopted in this study and provided a more accurate and larger dataset despite being time intensive. After cleaning, 27,500 comments on 195 tourism destinations made from 1 January, 2011 to 31 December, 2017, containing a total of 2.05 million words (141 comments per tourism destination and 74 words per comment, on average), were obtained. Compared with the dataset collated by Alaei et al. [11], the dataset collected in this study was larger in size. In addition, it should be noted that first, although comments after denoising were mostly from tourists, some of them were from stakeholders, such as residents and tourism practitioners, who also commented on the air quality of tourism destinations from perspectives inconsistent with those of tourists. Second, to facilitate the Python program performing machine recognition on the comments, we performed normalization on some aspects, such as the date. Third, to compare with cases from the United States, we also collected 372 comments from Chinese tourists regarding US destinations.
4. Result and Analysis
4.1. Analysis of the Number of Comments
As mentioned above, in 2010, there were very few comments in Weibo about the air quality of tourism destinations, and, as such, these comments were neglected in this study. Starting in 2011, this topic attracted more attention, and in 2013, the number of comments on this topic peaked; during 2011–2013, Weibo underwent a surge period, and the number of comments increased by 233% (Figure 1). In 2014, Weibo returned to reasonableness, and in subsequent years, the number of comments has maintained a high level, indicating that tourists continued their attentions to air quality after entering the adaption stage in Weibo. In terms of months, the number of comments made in the period from March to October were high, especially in April and October, and those made at other times, especially in January and December, were low; the highest number of comments were made in April, and the lowest were made in January (the number of comments made in January was only 36.82% of those made in April), indicating that the strong seasonal characteristics of tourism activities are also reflected in the number of comments on air quality of tourism destinations.
In terms of the spatial distribution of comments, the top five provinces in terms of popularity were Zhejiang, Jiangsu, Fujian, Beijing, and Sichuan, four of which are in the south; the top ten tourism destinations were West Lake, Juzizhou, Dujiangyan and Qingchengshan, the Olympic Park, Gulangyu Island, Taihu Lake, Qiandao Lake, the Forbidden City, Sun Yat-sen Mausoleum and Wuzhen, eight of which are in the south, indicating that whether or not they are popular at the provincial level or tourism destination level, most of the destinations with high tourism strength are in the south, and only a few are in the north.
4.2. Content Analysis
Analyzing high-frequency words in text is an important means to study large datasets, and the numbers of high-frequency words can effectively reflect the key information in the comments [45]. Relative to the two types of word frequency analysis software for bilingual (English and Chinese) or Chinese texts, i.e., the currently widely used ROST CM and BosonNLP (the latter has attracted more attention in recent years), Gooseeker can accommodate a larger scale when conducting analysis on word frequency statistics and thus was adopted to process the high-frequency words in the 27,500 comments in Chinese. The statistics showed that in addition to words that are of little emotional significance, such as “air,” “here,” and “today,” image-related words with a word frequency of greater than 2000 mainly included “freshening,” “fresh,” and “not bad.”
To further analyze word frequencies, we examined the part of speech aspect of word frequency analysis. Alaei et al. [11] and Kirilenko et al. [18] pointed out that the vast majority of studies on tourism sentiment analysis only took into account subjective emotion words such as “happy” and “sorry.” In fact, objective words such as “family” and “war” also carry emotions and should be included in the category of sentiment analysis. Among them, the part of speech of subjective emotion words is the adjective, while that of objective emotion words is mostly the noun [46,47]. These two types of emotion words can be further categorized into two types: Positive and negative. Therefore, the words in the comments can be divided into five categories: Positive subjective emotion words, positive objective emotion words, negative subjective emotion words, negative objective emotion words, and non-emotional words. It was argued that “forest,” “sunrise,” “landscape,” “diversity,” etc., are positive objective emotion words that reflect the quality of the natural environment [39], while “low temperature,” “high temperature,” “precipitation,” “cloudiness,” etc., are negative objective emotion words that reflect weather conditions [48]. However, the word frequencies of these five categories have not been comprehensively analyzed.
First, to gain a preliminary understanding of the perception of air quality by Chinese tourists at the macro level, we obtained the statistics on the most important subjective emotion words in the comments among the five categories using Gooseeker, and the results showed that among the first 100 high-frequency words, the positive subjective emotion words “freshening,” “fresh,” “good,” “like,” “beautiful,” and “comfortable” ranked 2nd, 6th, 15th, 20th, 32nd and 35th, respectively, and the only negative subjective emotion word “pollution” ranked 71st. Be it quantity or ranking, positive subjective emotion words were higher than negative subjective emotion words, and tourists’ perceptions of air quality were dominated by positive images. The comments containing “pollution” only accounted for 2.63% of the total comments, indicating that on social media, tourists have poor awareness of the air quality crisis.
Second, to further analyze the compositions of the five word categories and compare the word segmentation accuracies of three word frequency analysis tools, i.e., Gooseeker, ROST CM and BosonNLP, while considering that ROST CM and BosonNLP have been mostly used in small-scale data processing (BosonNLP exports its emotion dictionary to ROST CM to achieve word frequency analysis, so the two have the same capacity when processing text), we chose different tourism destinations above the mesoscopic level; these destinations were Heilongjiang, which is dominated by rural tourism destinations, and Shanghai, which is dominated by urban tourism destinations. Table 2 indicates that the numbers of comments with non-emotional words, positive subjective emotion words, positive objective emotion words, negative subjective emotion words and negative objective emotion words on tourism destinations in Heilongjiang accounted for 68.69%, 12.14%, 19.16%, 0% and 0%, respectively, of the total comments, while those on tourism destinations in Shanghai accounted for 92.24%, 4.77%, 1.20%, 1.35% and 0.43%, respectively, of the total comments. The similarities between the proportions of destinations in Heilongjiang and Shanghai were that non-emotional words dominated and that positive emotion words were far more common than negative emotion words; this outcome is consistent with the conclusion from other related studies that the tourism reviews are dominated by comments with positive polarity [18,20,49,50], and comments with objective emotion words and those with subjective emotion words accounted for similarly high proportions in the total comments, which is worth noting. The differences between the proportions of sites in Heilongjiang and Shanghai were that sites in Shanghai exhibited the comments with all five word categories, while those in Heilongjiang lacked the negative high-frequency words and exhibited higher proportions of comments with non-emotional words and positive emotion words. Clearly, the tourism image of Heilongjiang is significantly better than that of Shanghai.
Table 2 also indicates that the word segmentation accuracies of Gooseeker, ROST CM and BosonNLP on comments on Heilongjiang destinations were 93.65%, 94.43% and 93.09%, respectively, while those on Shanghai destinations were 92.14%, 96.10% and 94.51%, respectively, indicating that all three tools could achieve a high word segmentation accuracy; of these tools, the most widely used, ROST CM, had the highest accuracy. BosonNLP followed, and Gooseeker, which has the highest data processing capacity, had the lowest accuracy, though it exhibited only a slight accuracy difference from BosonNLP. These results support the results of Cong et al. [51] obtained using ROST for Chinese word frequency analysis while providing implications for choosing appropriate tools in future studies.
4.3. Sentiment Analysis
The above content analysis concluded that tourists’ perceptions of air quality were mainly positive, so we further conducted a quantitative study through sentiment analysis. Among the above-described methods, Gooseeker was not able to perform a sentiment analysis, ROST EA could generate a general assessment on the ternary polarity proportion of each sentence of the comments using the sentiment dictionary method, and the artificial neural network machine learning method on the Boson platform was able to estimate the sentimental value of each or all comments with spatiotemporal message tags. In this study, we adopted a hybrid method in which the artificial neural network was the primary method, and ROST EA was the secondary method.
4.3.1. ROST Sentiment Analysis
The results of the ROST EA analysis showed that in the sentences of comments on the air quality of China’s 195 Class 5A tourism destinations, those with positive emotions, neutral emotions and negative emotions accounted for 85.53%, 7.21% and 7.26%, respectively, of the total number of sentences, indicating that positive emotions dominated, negative emotions also corresponded to a large proportion and should not be ignored, and neutral comments exhibited the lowest proportion; therefore, the comments posted by tourists on social media are mostly with emotional content. Due to differences in subjects, directly comparing these proportions with those in other studies is meaningless. However, comparing the proportions of sentences with different emotional polarities can facilitate the generalization of these patterns. Like this study, in the sentences of the comments about the hotel accommodations in Spain and Switzerland and the Great Barrier Reef in Australia, the proportion of positive comments was also significantly higher than that of negative comments [21,38,39], and in some special circumstances, tourists’ emotions regarding tourism destinations may also be more negative than positive [34]. Therefore, we postulate that tourists’ comments regarding the environment, including various aspects such as eating, lodging, traveling, touring, shopping and entertaining, are mostly positive, although not absolutely positive.
4.3.2. ANN Sentiment Analysis
We wrote some Python codes to use the artificial intelligence algorithm-based artificial neural network method on the Boson platform to further estimate the sentiment value of the text that contains both objective and subjective emotion words. Prior to the analysis on sentimental values at three levels, i.e., overall, annual and quarterly, we first analyzed the parameters of the assessment criterion.
We obtained a series of assessment criterion coefficients by analyzing the data using the semi-supervised artificial neural network method, and the accuracy, precision, recall rate and F1 were all 0.87. Given that the parameters generally varied little (Table 3), we adopted accuracy, the most representative parameter, to assess performance. Table 3 indicates that the accuracies were generally high. Given that only coefficients based on the same data are comparable, we focused on the analysis of the results from social media data that were only in English rather than Chinese. In a previous study, the accuracy of an analysis on 116 tweets about Iizuka City, a tourist city in Fukuoka Prefecture of Japan, using an adjusted unsupervised naïve Bayesian method was 0.78–0.92 [15]. In a recent study, the supervised support vector machine, naïve Bayesian, and unsupervised deep learning methods were used to analyze 762,475 tweets, achieving accuracies of 0.50–0.51, 0.54–0.55, and 0.39, respectively [18]. Generally, an accuracy value of 0.7 can be used as a baseline for the accuracy of a sentiment analysis [52]. In this study, we analyzed a total of 27,500 comments, so an accuracy of 0.87 could be regarded as rather high.
(1) National Sentiment Value
The results showed that the overall sentiment value of tourists for the air quality of China’s Class 5A tourism destinations was 0.786, which was at the positive and medium level. Compared with the proportion of sentences with positive emotion in the total sentences (85.53%) obtained through ROST EA, this sentiment value reflected a slightly decreased positive image, while the result that the comments with positive images dominated is consistent with the conclusion in the content analysis section—as well as with those of previous studies—that emotion words were mostly positive and only slightly negative [18,20,49].
From the time evolution point of view, the sentiment values of 2011–2017 were 0.801, 0.770, 0.787, 0.798, 0.806, 0.774 and 0.777, respectively, all dominated by positive images, and the highest value was greater than the lowest value by 4.71%. After removing the “abnormal” value of 2011 when Weibo was in its initial overzealous stage, the sentiment values exhibited slight fluctuations (up-down-up, with a standard deviation σ of 0.014), assuming an overall stable trend (Figure 2). The linearity shown in Figure 2 indicates that the time period of 2012–2017 was a stable stage of sentiment value, and air quality showed the pattern of a slight increase accompanied by a slight drop as well as a slight drop accompanied by a slight increase. In 2013, the General Office of the State Council of the People’s Republic of China issued the Action Plan for Air Pollution Prevention and Control, and this year may have also been the “first year” in which China took air pollution seriously. The relatively stable sentiment value reflected the effectiveness of China’s control of the atmospheric environment to some extent. In terms of quarterly changes, the sentiment values of the first, second, third and fourth quarters were 0.777, 0.798, 0.789 and 0.775, respectively, of which the highest value (the second quarter) was greater than the lowest value (the fourth quarter) by 2.98%, indicating a rather small seasonal fluctuation.
We then compared the sentiment values with the actual situation. According to the Report on the State of the Environment in China issued by the Ministry of Ecology and Environment, except for 2016, the national air quality in each year during 2012–2017 was generally better than that of the previous year. The comparison showed that the direction of sentiment value change was precisely consistent with the actual situation. This provides evidence for the credibility of the method that uses a sentiment analysis on the existing social media data to understand tourists’ perceptions of air quality. The sentiment value of 2016 decreased by 4.02% compared with that of 2015, while the national average air quality index (AQI) over the same period fell by 5.4% [61], and the difference between the two numbers could mean that in terms of the level of air quality change, tourists’ perceptions may be worse than the actual situation.
(2) Regional Sentiment Value
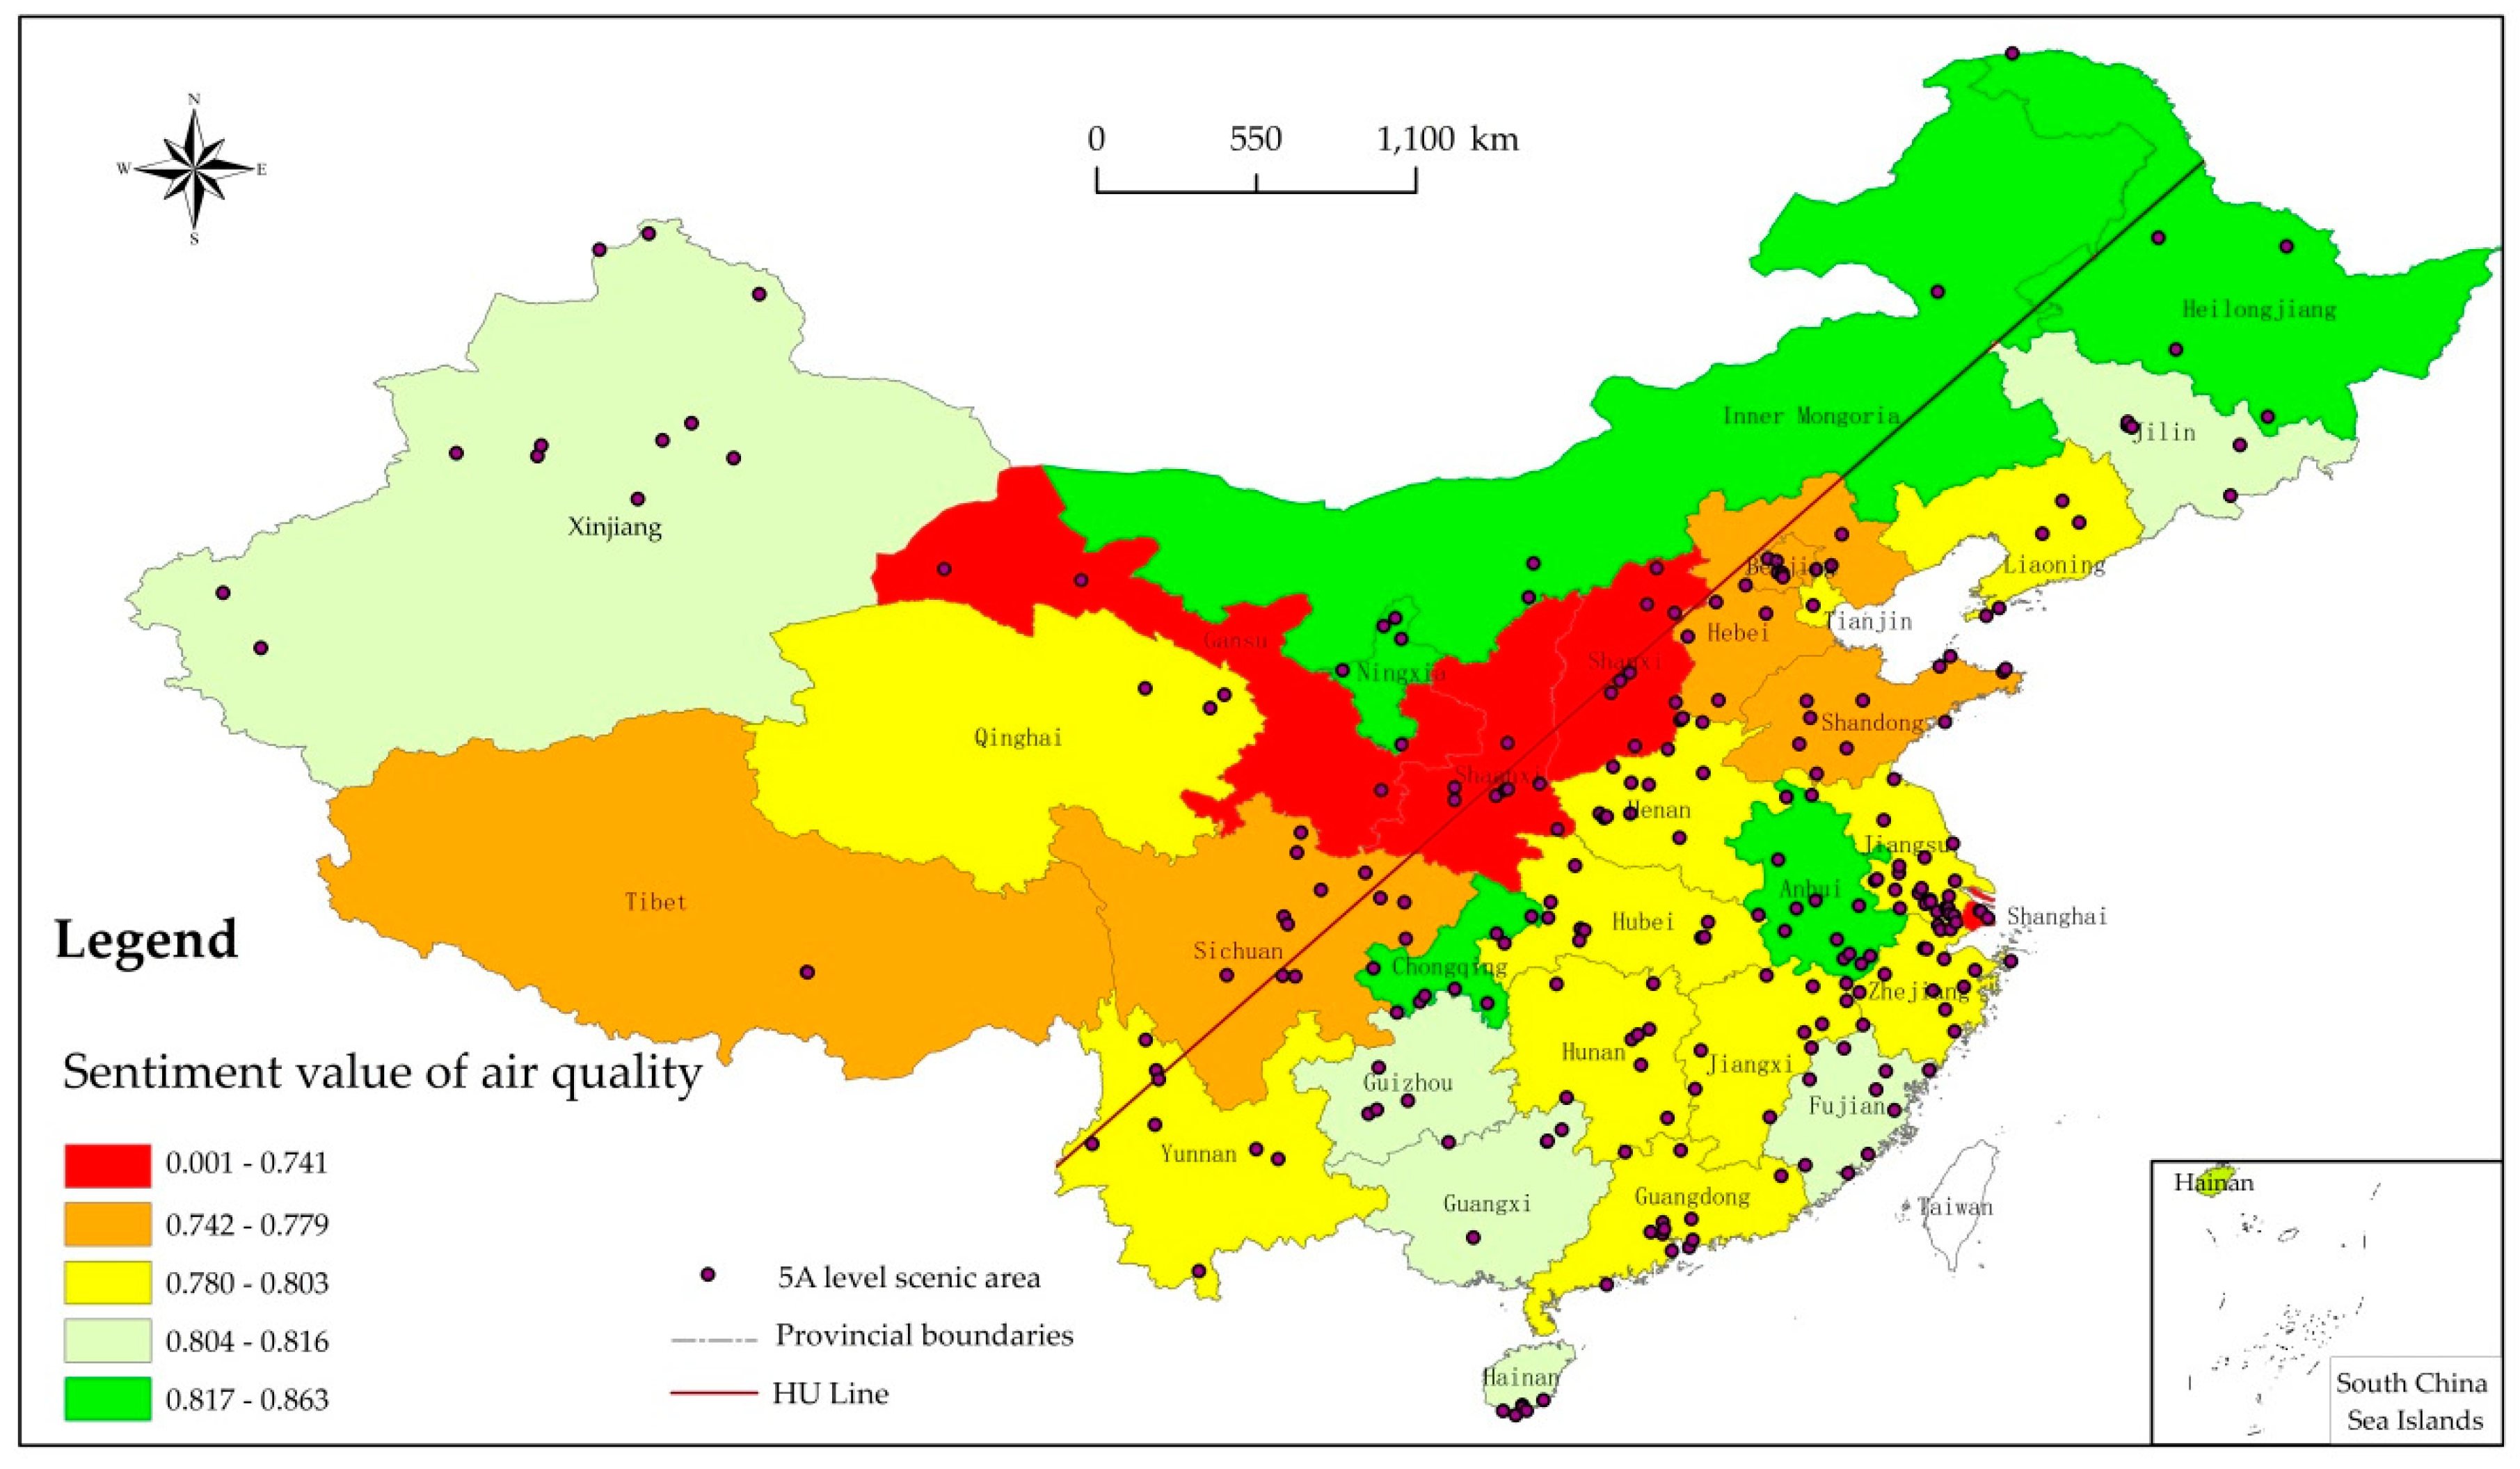
Based on the sentiment value of each province, we generated China’s sentiment map of tourists’ perceptions of air quality (Figure 3). Except for Shanghai, Gansu, Shanxi, Shaanxi and other provinces with the lowest sentiment values connected to form the north-Northwest China region; Beijing, Hebei, Shandong, Tibet, Sichuan and other provinces with low sentiment values formed the North China region and the Southwest China region; provinces with moderate sentiment values were numerous and mainly included Henan, Hubei, Hunan, Guangdong, Jiangxi, Zhejiang and Jiangsu, which extend inland from the southeast coast and form the vast Southeast China region, while Liaoning, Qinghai and Yunnan are relatively isolated; except for Guizhou and Guangxi, provinces with high sentiment values, such as Jilin, Xinjiang and Fujian, are relatively scattered, and Heilongjiang, Inner Mongolia and Ningxia, which had the highest sentiment values, constitute the northeast-North China region. The three regions with the lowest or lower sentiment value of north-Northwest China, North China and Southwest China were further combined into a northeast-southwest low-value area. In other words, the two regions with the lowest and the second-lowest emotional values were roughly the dividing line of the emotional division. The regional distribution pattern indicated the regional characteristics of tourists’ perceptions of air quality, while the presence of some decentralized provinces reflected the complexity of the perception.
Figure 3 also shows that except for Shanghai, provinces with the worst air quality were mostly in the north, those with the best air quality were in both the north and south, and those with medium-level air quality were mostly in the south, indicating that the perception assumed a pattern of lower air quality in the north but higher air quality in the south; divided by the Hu Huanyong Line, the east-west difference was small. Previous studies revealed that air pollution in China’s cities is characterized by the spatial pattern of “high in the north and east but low in the south and west,” of which the Beijing-Tianjin-Hebei region, the Northwest China region, the Shandong Peninsula, and the middle reaches of the Yellow River are highly polluted areas, and the southern coastal areas, the Yunnan-Guizhou Plateau and the Qinghai-Tibet Plateau are clean areas [62,63,64]. The comparison indicates that the result of tourists’ perceptions was essentially consistent with the actual situation of regional air pollution. The existence of the above-described large regions as well as the consistency between their sentiment values and the actual air pollution situation provide additional evidence for the reliability of the sentiment analysis results.
The perception result of each tourism destination was basically consistent with the actual air quality of the region where the tourism destination was located, but there were still some differences due to the following reasons: First, air pollution is an important part of air quality perception, which was reflected in that among the top 100 high-frequency words nationwide, “pollution” was the only negative subjective emotion word; however, other aspects, such as air thinness and air temperature, also affected the sentiment value of perception. For example, comments about “air thinness” accounted for 0.50% of the total comments nationwide but 19.33% of the comments in Tibet, and the thin air lowered the sentiment value. The above analysis provides an explanation that although there is only mild air pollution in Western China [62,63,64], the sentiment value of this region was not significantly different from that of Eastern China, i.e., Western and Eastern China did not exhibit the air pollution pattern of “high in the east but low in the west.” Second, the reference to the object only included the city, but tourism destinations as the carriers of the perceived content included those from both urban and rural areas, and the sentiment values of urban and rural tourism destinations differed significantly. The statistical results showed that the average sentiment value of urban tourism destinations was 0.772, while that of rural tourism destinations was 0.800 and thus higher than that of urban tourism destinations by 3.57%. The northeast-North China region showed the highest sentiment value, which is related to that their tourism destinations are mainly located in rural areas. One of the reasons for the formation of the “enclave-type” provinces, such as Chongqing and Anhui, that had significantly different sentiment values from their surrounding regions is that the vast majority of their tourism destinations had rural characteristics. Third, the tourism destination areas are generally discontinuous in space, and only a small part of the region had better air quality. Fourth, tourism activities have profound seasonal characteristics, so the perception was uneven or even biased. Fifth, the characteristics of tourism activities themselves are an important cause. The sentiment value of the “enclave-type” provinces such as Shanghai was much less than that of Beijing, which is also a mega city and located in a heavily polluted area, likely because the comments about Shanghai were mostly on the Oriental Pearl TV Tower, and the tourism activities at this particular destination have a high requirement for air visibility so the visitors can have a bird’s-eye view from the towering height. Low visibility has a significant negative impact on tourists’ perceptions of the atmospheric environment [65]. The above analyses on the causes provide some explanation for the “distortion” of the perception in addition to its “truthfulness.”
In addition to the regional perspective derived from the provincial sentiment values, China’s eight-region division scheme based on geographical similarities and provincial-level administrative division integrity [66,67] also provides another perspective. The eight major regions are the Northeast China region (Heilongjiang, Jilin and Liaoning), the North China region (Beijing, Tianjin, Hebei, Shanxi, Henan, and Shandong), the East China region (Shanghai, Jiangsu, Zhejiang, and Fujian), the Central China region (Anhui, Jiangxi, Hubei, and Hunan), the South China region (Guangdong, Guangxi, and Hainan), the Southwest China region (Yunnan, Guizhou, Sichuan, and Chongqing), the Northwest China region (Shaanxi, Gansu, Ningxia, Inner Mongolia, and Xinjiang) and the Qinghai-Tibet region (Qinghai and Tibetan). Based on this division scheme, in terms of sentiment value, the regions were ranked in the following descending order: Northeast China, South China, Central China, East China, Northwest China, Southwest China, North China and the Qinghai-Tibet region. Among them, the Northeast China region was first-ranked, mainly because the tourism destinations are mainly in rural areas; the South China and North China regions, respectively, ranked the second highest and the second lowest, which is consistent with the rankings in the national air quality list reported by others [62,63,64]; although the Qinghai-Tibet Plateau had little air pollution, it was still bottom-ranked, largely because it has thin and cold air.
Quarterly sentiment value can provide a criterion for assessing the quarterly air quality. Table 4 indicates that the highest quarterly sentiment value was 0.805 (the fourth quarter in the South China region), which was at a very high level and significantly greater than that of other regions. Tourists are more satisfied with warm weather in the cold winter than that in the summer [3], and the results for this region indicate that warm air in the cold winter made tourists more satisfied than that in other quarters. In short, the warm atmosphere of that cold winter made tourists more satisfied than that in other quarters. The lowest quarterly sentiment value was 0.757 (the first quarter in the Qinghai-Tibet region, i.e., the coldest quarter of the region with the lowest sentiment value), which was at a high level. The North China and Southwest China regions, respectively, exhibited a significantly lower third quarter sentiment value and a significantly higher first quarter sentiment value. In addition to the four regions mentioned above, the interquarter sentiment value differences of other regions (the Northeast China, Central China, East China and Northwest China regions) were rather small, and four regions exhibited a certain interquarter sentiment value difference, mainly in low-latitude areas.
(3) Provincial Sentiment Values
Figure 4 shows that the sentiment values of 31 provinces were distributed in the range of 0.630–0.855, of which one was at the moderate level, 17 were at the high level, and 13 were at the very high level; the sentiment value of Shanghai was the lowest, and that of Heilongjiang was the highest (higher than that of Shanghai by 35.63%), exhibiting a significant difference; except for Shanghai, Gansu and the connecting area of Chongqing and Ningxia, the sentiment values of the remaining provinces exhibited no remarkable differences. Shanghai and Heilongjiang, respectively, had the highest and the lowest sentiment values, which is also an important reason why they were chosen as the subjects in the word frequency analysis. Tourists’ assessments of the air quality of each province were always positive, which is consistent with the findings of previous studies [11,18].
Shanghai was only at the moderate level because it is a megacity and has its own characteristics of tourism activities, as mentioned above. Among the 17 provinces rated at the “high level,” those with low sentiment values, such as Gansu, Shanxi, Shaanxi and Beijing, are mainly in the northern regions, while those with high sentiment values, such as Guangdong, Jiangxi, Jiangsu and Yunnan, are mainly in southern regions, which is largely consistent with the spatial pattern of air pollution in China, i.e., heavily polluted in the north but mildly polluted in the south [62,63,64].
Haze is a key indicator of current air quality in China and was found to be significantly correlated with public sentiment [68]. By reviewing the sentiment value of each province and the proportion of the comments containing “haze” out of the total comments, the correlation coefficient between the two was −0.54 (p < 0.05), indicating that there was a significant negative correlation between haze and tourists’ sentiment value. Therefore, using “haze” as a representative to analyze tourists’ perceptions of the air pollution crisis is more convincing. Of the 27,500 comments made nationwide, only 522 contained the word “haze,” accounting for 1.90% of the total comments, of which the proportions of comments mentioning “haze” made by tourists to the Shanghai, Gansu, Shanxi, Shaanxi, Tibet and Beijing destinations in their respective total comments were 3.89%, 0.81%, 2.81%, 2.96%, 1.12% and 3.63%, indicating that contrary to the conclusion that tourists’ perceptions of haze are strong, which has been drawn based on suggestive questionnaires [5,40,41], tourists’ perceptions of the air pollution crisis on the internet are more relaxed, more free, and not strong; they are, however, more truthful and reliable, which is consistent with the conclusion in the content analysis section based on the word “pollution.”
(4) Sentiment Value of Scenic Spot
Accurately grasping the overall polarity of tourists’ online reviews of tourism destinations is a key to tourism analysis and application [69]. At the tourism destination level, in terms of sentiment value, the top ten tourism destinations were ranked in descending order as follows: Huanglong, Yunnan Stone Forest, Bailidujuan, Qingyan ancient town, Langshan, Dajueshan, Keketuohai, Kunming Exposition Garden, Dongjiang Lake and Jingpo Lake. Among them, except for Keketuohai and Jingpo Lake, all the tourism destinations are in the south (Figure 5). The bottom ten destinations in terms of sentiment value were ranked as follows: Terracotta Warriors and Horses Museum, Oriental Pearl TV Tower, Eastern Qing Mausoleum, Xiangsha Bay, Qiao Family Courtyard, Famen Temple, Jiayuguan, Yueya Spring, Minggucheng (Cemetery of Confucius, Confucius Family Mansion, Confucian Temple) and Pingyao Ancient City. Except for the Oriental Pearl TV Tower, all the tourism destinations are in the north, concentrating in areas with severe air pollution, such as Shaanxi, Shanxi, Gansu and Hebei (Figure 6). These results show that tourism destinations with high sentiment values are mainly in the south and that those with low sentiment values are mainly in the north, which further confirms that the air quality of tourism destinations in China assumes a spatial pattern of low pollution in the south and high pollution in the north. In particular, the destination of Terracotta Warriors and Horses Museum exhibited the lowest sentiment value, possibly because of the poor overall regional air quality, heavy smell in the air, oxidation of terracotta figurines, and other factors.
Previously, the reliability of the sentiment value at the macro level has been confirmed through the AQI. We also used this index to examine the reliability of the tourism destination sentiment value at the micro level. The atmospheric movement characteristics made such analysis rather difficult, so we chose to analyze the island-type destination Putuoshan, which is relatively untouched, as a case study. By comparing the daily sentiment value in 2017 and the AQI of the corresponding date from the actual monitoring, the two sets of data exhibited a low correlation but were close to a moderate correlation (correlation coefficient −0.45, n = 25, p < 0.05), which also provides a third piece of evidence for the reliability of the sentiment analysis.
(5) Sentiment Values in China and the US
Based on Sina Weibo comments, it was also possible to analyze the air quality sentiment values of a few important destination countries. Considering that the US datasets are large and that China and the US are similar in terms of geological location and land area, we focused on comparing the air quality difference of the two countries, which enabled us to examine some propositions such as “the American moon is brighter than the Chinese moon” from the perspective of the human sensor. The sentiment value of air quality perception of the US by Chinese tourists was 0.803, which was greater than that of China (0.786) by 2.22%, indicating that Chinese tourists have a higher regard for US air quality, with a higher level of satisfaction.
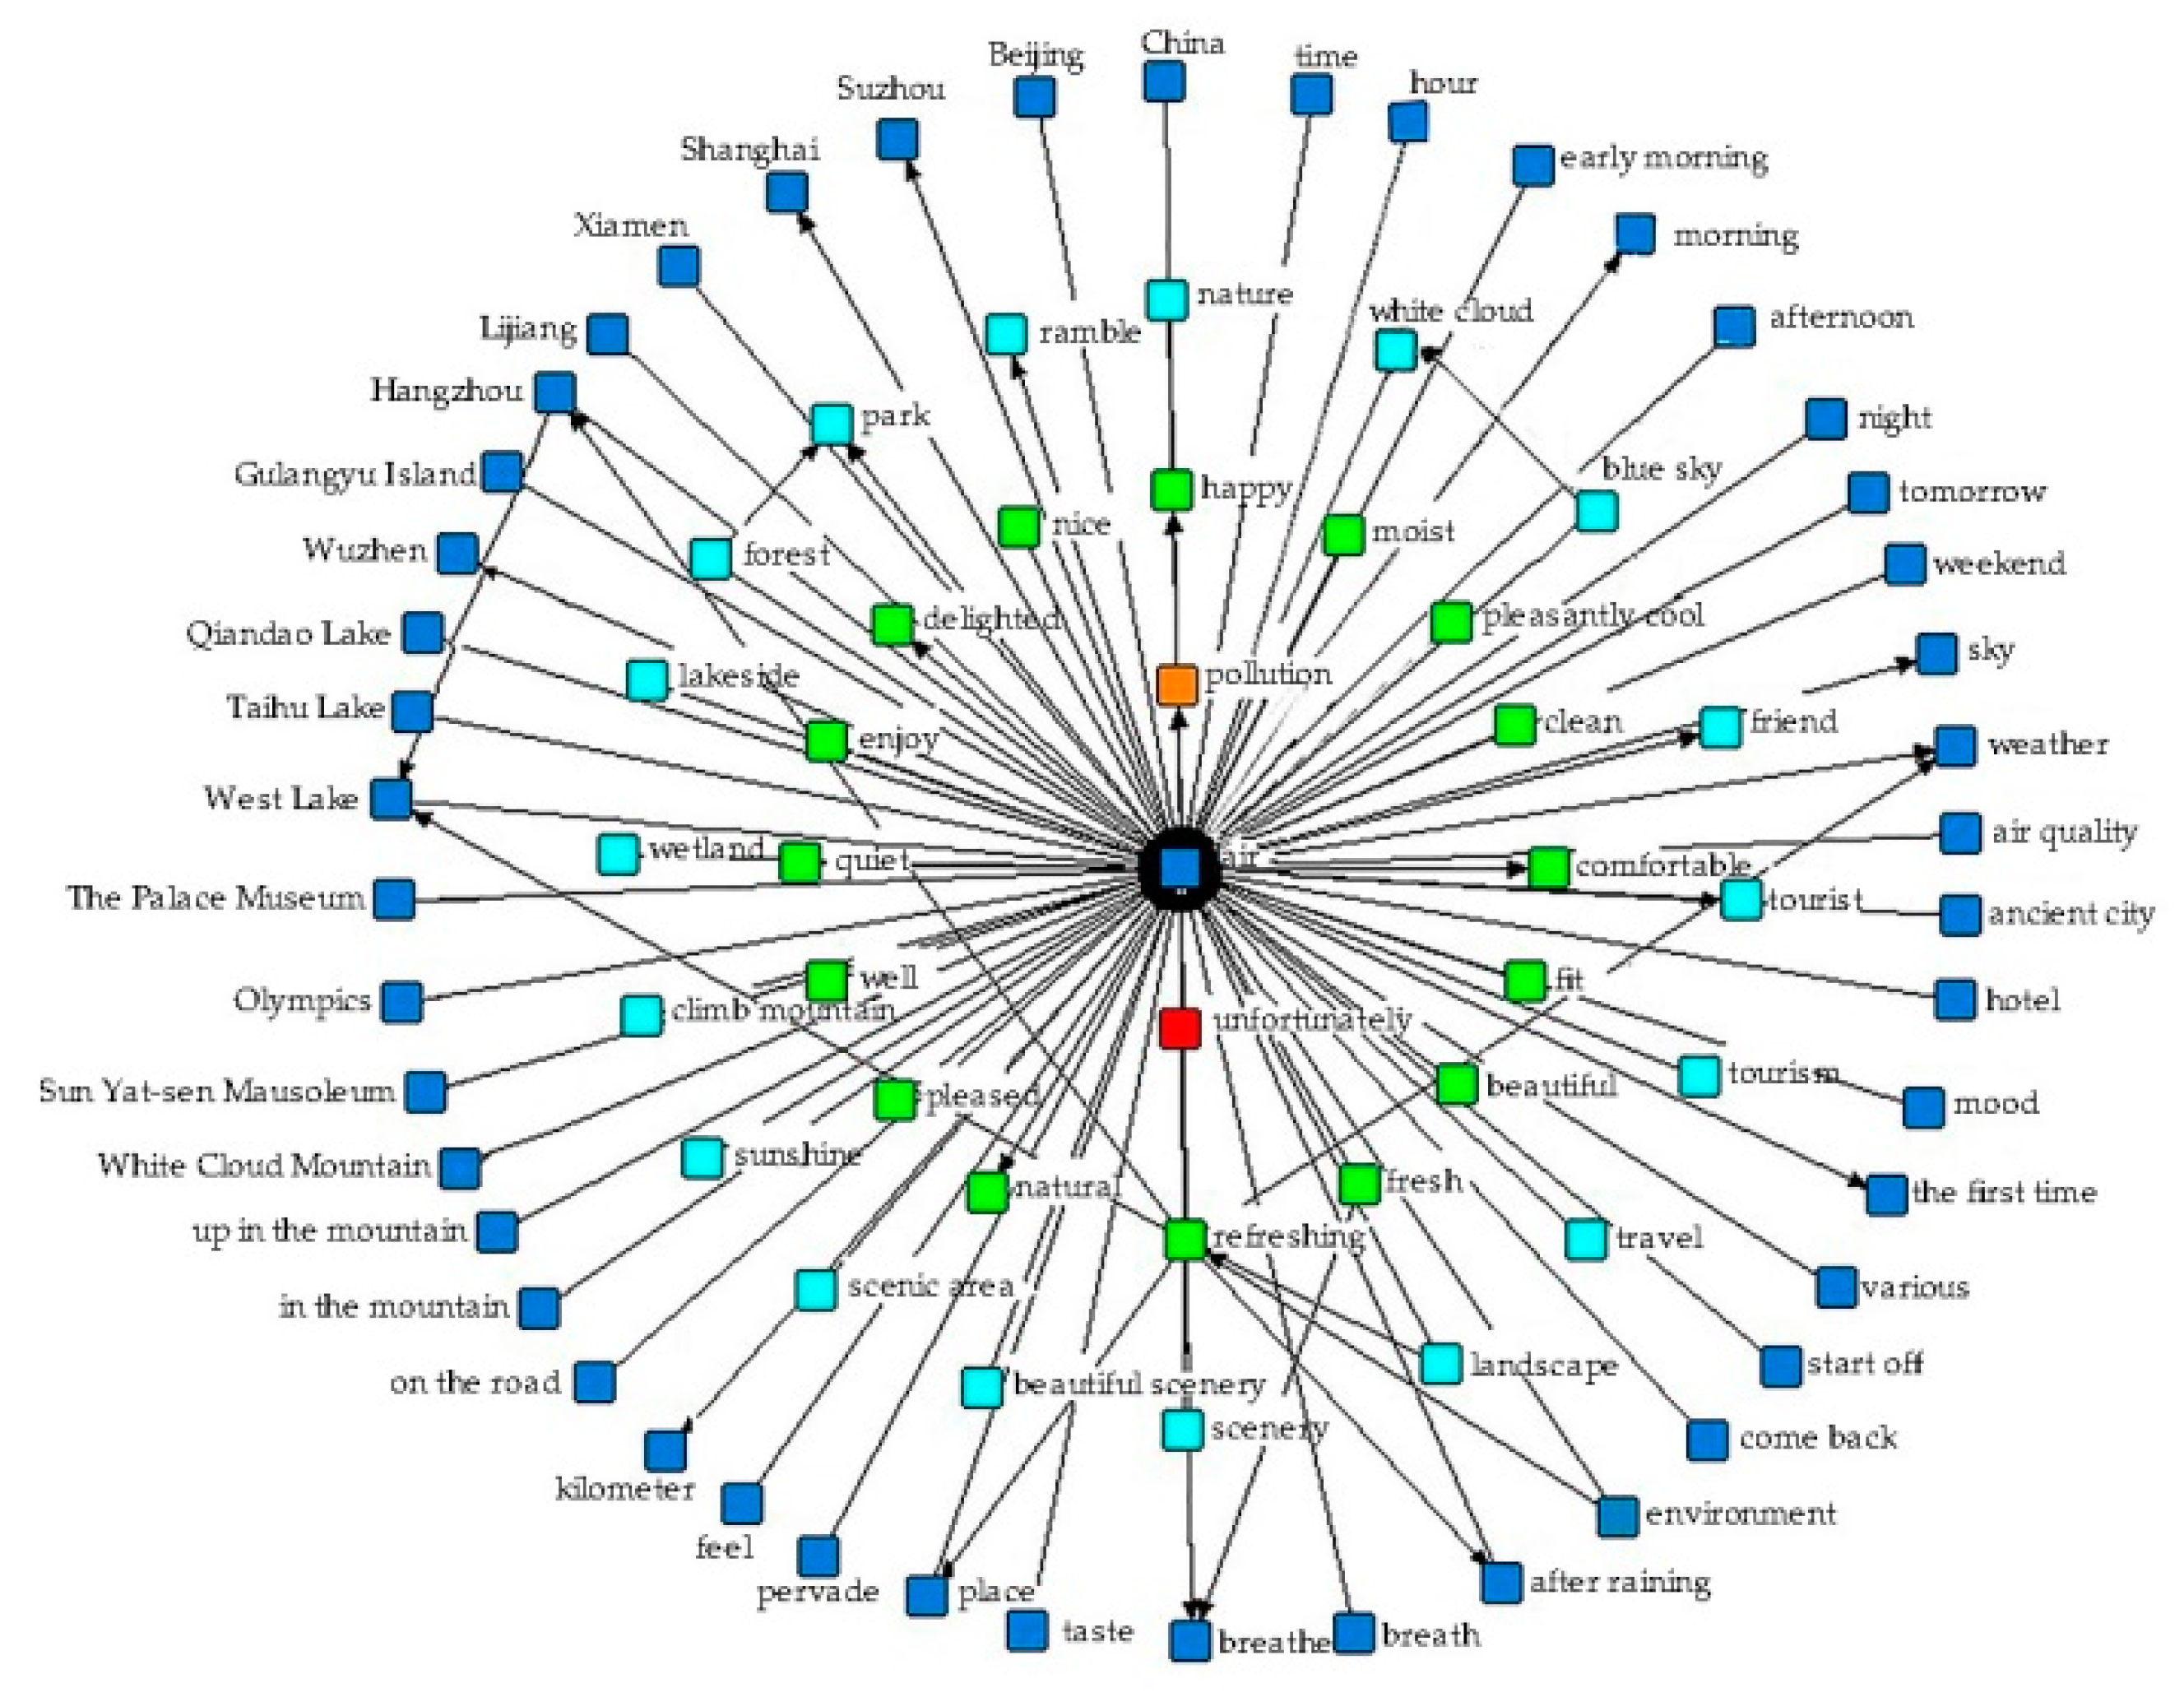
The semantic network diagrams of the Chinese and American comments generated by ROST showed that compared with that of the US, the overall air quality image of China was slightly poorer, with a higher level of diversity and structural complexity (Figure 7 and Figure 8). Specifically, from the perspective of positive and negative emotion words, in the case of China, the number of positive emotion words was higher than that of negative emotion words (in Figure 7 and Figure 8, dark green represents the positive subjective emotion word, sky blue represents the positive objective emotion word, red represents the negative subjective emotion word, orange represents the negative objective emotion word, and dark blue represents the non-emotional word). Meanwhile, in the case of the US, only positive emotion words were present, and no negative emotion words were present. In terms of content, in the case of China, more names of tourism destinations showed up, reflecting that tourists’ attention to air quality was mainly at the tourism destination level, while in the case of the US, the names of tourism destinations were rarely mentioned; instead, names of cities were frequently mentioned, indicating that tourists’ attention was mainly on the regional environment, not yet at the tourism destination level. In terms of structure, the emergence of negative subjective emotion words, such as “unfortunately” and “pollution,” in the case of China increased emotion word diversity as well as complexity; “fresh” (a positive subjective emotion word) and “breathing” (a non-emotional word) coemerged frequently in both the US and China cases, showing remarkable aggregation structure and constituting a subcore.
5. Conclusions and Discussion
5.1. Conclusions
(1) In this study, using Chinese social media data about the air quality of 195 tourism destinations, we performed a content analysis using the Gooseeker, ROST CM and BosonNLP tools and a sentiment analysis using the artificial neural network machine learning method on the Boson platform through Python programming; we confirmed that the social media data posted by tourists online can provide a new perspective and data source for the study of tourists’ air quality perception at the micro, meso and macro levels, and the Chinese social media data-oriented artificial neural network application helps enrich the existing tourist emotion research methodology, while the findings with high reliability can provide implications for the management of the air pollution crisis in the tourism industry.
Based on these conclusions, the method of performing a sentiment analysis on social media data posted by tourists online can provide a new tool for air quality monitoring in tourist destinations; for example, the new tool can be used to some extent to evaluate the implementation outcomes of environmental protection policies. The Scheme for Building the Ecological Environment Monitoring Network issued by the State Council of the People’s Republic of China in 2015 stated that the Ecological Environment Monitoring Network will be fully constructed by 2020. Our study found that tourists’ air quality perception can largely reflect the air quality status of the area where the scenic spots are located. This finding indicates that the method can assist air quality monitoring in the background of economic activities in the whole of society, can be a vital component in the Ecological Environment Monitoring Network, and can be interconnected with other monitoring measures. In addition, for tourist destinations without an air quality monitoring station, air quality monitoring can be achieved using this method. Furthermore, a supervision network that covers major tourist destinations can be constructed to provide a reference for the formulation of air quality protection policies.
(2) The results of a content analysis showed that when investigating tourists’ air quality perception, while paying attention to subjective emotion words, we should also include objective emotion words; when perceiving air quality, tourists in China used positive emotion words primarily and negative emotion words secondarily, and they exhibited a weak awareness of the air pollution crisis on the internet, which means that it is easier to find positive messages about air quality from the tourists’ comments and difficult to find negative comments on air pollution. We compared word frequencies using the ROST CM, BosonNLP and Gooseeker tools and found that the word segmentation accuracies of the three tools were similarly high, while Gooseeker is more capable of processing large text datasets; these findings provide some references for future related research. The tourism industry requires a high quality air environment. Therefore, it is crucial to strengthen education about atmospheric environment protection, enhance tourists’ consciousness of atmospheric environment crisis and responsibility, and help them practice air pollution control measures while enjoying tourism activities.
(3) In the sentiment analysis section, the results of ROST EA showed that Chinese tourists’ comments with positive emotions on air quality accounted for 85.53% of the total comments, and it was confirmed that tourists’ comments on environmental topics including eating, lodging, traveling, touring, shopping, and entertaining on social media were dominated by positive images; however, they were not absolutely positive. The sentiment value obtained through the artificial neural network was 0.786, which was increased slightly compared with that obtained through ROST EA and at the positive and high levels; temporally, it had the same direction of change to that of the actual air quality, which to some extent reflects the effectiveness of the atmospheric environment control by the Chinese government. Spatially, it exhibited the pattern of high in the south but low in the north that is in line with China’s actual air pollution situation. The heterogeneity at the tourism destination level was significantly higher in rural areas than in urban areas, which is closely associated with the actual AQI measurements and profoundly lower than that of the US. Therefore, the comparison of the change directions and spatial patterns at the national macro level, the detection on the presence or absence of multiple regions that reflect the regional characteristics of air quality at the meso level, and the correlation analysis on sentiment value and AQI index at the micro level, as well as the word frequency analysis results, provide evidence for the feasibility of using social media data to conduct a sentiment analysis to examine air quality.
5.2. Discussion
(1) In terms of methodology, we tried to use the Chinese social media data-oriented artificial neural network method to conduct a sentiment analysis to understand tourists’ perceptions of air quality, but this study is still at the exploration stage. In addition, various basic theoretical aspects, e.g., the definitions of objective emotion and nonsemotional words as well as the validity of conclusions, need to be strengthened. Moreover, in the future, the results obtained using the artificial neural network can be compared with those obtained using other Chinese artificial intelligence methods, such as the Baidu AI (Artificial Intelligence) and Tencent Wenzhi, to further enrich the emotional research methodology while cross-examining each other. The English version of the machine learning software can be introduced for processing data on social media such as Twitter to verify whether such data and methods can support the relevant studies, especially large-scale perception studies. Future studies will improve the algorithms of the support vector machine, naïve Bayesian, the artificial neural network, and deep learning to improve the recognition of emotions, including implicit emotions.
(2) In terms of data collection, the data acquired using “tourism destination name” and “air” as keywords could reflect the air quality of tourist destinations. However, they were not solely from tourists, and a small portion of the data were from residents and other stakeholders; this outcome is in conflict with the analytical perspective of tourists. When screening the data, we adopted the manual identification method, which is low in efficiency despite its high accuracy, and in the future, machine learning methods can be applied to synchronously denoise [70]. In addition, the data collected in this study only contained text content and excluded data in other forms such as picture and video. In the future, these multisource data can be integrated to improve the reasonableness and accuracy of the study [19]. In future studies, text data from travel websites and social media will be analyzed, and the pros and cons of different data types will be compared; in addition, different methods will be used to process different types of data such that the effect of the data and method matching can be better verified.
(3) In terms of result analysis, since the data from only a short period of time were acquired, the data-derived perception characteristics (especially the evolutionary patterns) are not comprehensive enough. In the future, the inclusion of data from longer time period or the addition of more spatial subjects can help draw more reasonable and complete conclusions. This descriptive investigation did not dig into details. For example, the sentiment characteristics and patterns in China’s sentiment map of tourists’ perceptions of air quality await further studies. Moreover, the underlying causes of certain phenomena were not comprehensively analyzed. For example, the underlying cause of the downward trend of the sentiment values from 2015 to 2016 was briefly mentioned, and there was a lack of in-depth analysis regarding the impact of the thin air on tourists’ perception of air quality in Tibet. An analysis of the underlying mechanisms will deepen the explanatory studies on the basis of methodological studies and descriptive studies.
Author Contributions
The data analysis and writing of the article were done by Y.T. The data collection, method application and analysis were done by F.Z., and C.S. The results interpretation and English editing were done by Y.C. All authors have read and approved the final manuscript.
Funding
This research was funded by the National Natural Science Foundation of China (grant number 41571131, 41701147), and a Grant of the Humanities and Social Sciences Research Projects of Ministry of Education of China (grant number 19YJC630018).
Acknowledgments
The authors thank Zehai He, Ye Lu, Cheng Han and Liang Feng for collecting data.
Conflicts of Interest
The authors declare no conflict of interest.
References
- United Nations. Indicators of Sustainable Development: Guidelines and Methodologies; UNDSD Publication: New York, NY, USA, 2007. [Google Scholar]
- Sajjad, F.; Noreen, U.; Zaman, K. Climate change and air pollution jointly creating nightmare for tourism industry. Environ. Sci. Pollut. Res. 2014, 21, 12403–12418. [Google Scholar] [CrossRef] [PubMed]
- Gössling, S.; Scott, D.; Hall, C.M.; Ceron, J.P.; Dubois, G. Consumer behaviour and demand response of tourists to climate change. Ann. Tour. Res. 2012, 39, 36–58. [Google Scholar] [CrossRef]
- Böhm, G.; Pfister, H.R. Tourism in the Face of Environmental Risks: Sunbathing under the Ozone Hole and Strolling through Polluted Air. Scand. J. Hosp. Tour. 2011, 11, 250–267. [Google Scholar] [CrossRef]
- Zhang, A.; Zhong, L.; Xu, Y.; Wang, H.; Dang, L. Tourists’ Perception of Haze Pollution and the Potential Impacts on Travel: Reshaping the Features of Tourism Seasonality in Beijing, China. Sustainability 2015, 7, 2397–2414. [Google Scholar] [CrossRef]
- Li, J.; Pearce, P.L.; Morrison, A.M.; Wu, B.H. Up in Smoke? The impact of smog on risk perception and satisfaction of international tourists in Beijing. Int. J. Tour. Res. 2016, 18, 373–386. [Google Scholar] [CrossRef]
- Becken, S.; Jin, X.; Zhang, C.; Gao, J. Urban air pollution in China: Destination image and risk perceptions. J. Sustain. Tour. 2016, 25, 1–18. [Google Scholar] [CrossRef]
- Wang, Y.T.; Sun, M.X.; Yang, X.C.; Yuan, X.L. Public awareness and willingness to pay for tackling smog pollution in China: A case study. J. Clean. Prod. 2015, 112, 1627–1634. [Google Scholar] [CrossRef]
- Wang, Z.; Ke, L.; Cui, X.; Yin, Q.; Liao, L.; Gao, L.; Wang, Z. Monitoring Environmental Quality by Sniffing Social Media. Sustainability 2017, 9, 85. [Google Scholar] [CrossRef]
- Hswen, Y.; Qin, Q.; Brownstein, J.S.; Hawkins, J.B. Feasibility of using social media to monitor outdoor air pollution in London, England. Prev. Med. 2019, 121, 86–93. [Google Scholar] [CrossRef] [PubMed]
- Alaei, A.R.; Becken, S.; Stantic, B. Sentiment Analysis in Tourism: Capitalizing on Big Data. J. Travel Res. 2017, 58, 175–191. [Google Scholar] [CrossRef]
- Liu, B.; Zhang, L. A Survey of Opinion Mining and Sentiment Analysis. In Mining Text Data; Springer Science and Business Media LLC: Boston, MA, USA, 2012; pp. 415–463. [Google Scholar]
- García, A.; Gaines, S.; Linaza, M.T. A lexicon based sentiment analysis retrieval system for tourism domain. Expert Syst. Appl. 2012, 3, 9166–9180. [Google Scholar]
- Zhang, Z.; Ye, Q.; Zhang, Z.; Li, Y. Sentiment classification of Internet restaurant reviews written in Cantonese. Expert Syst. Appl. 2011, 38, 7674–7682. [Google Scholar] [CrossRef]
- Shimada, K.; Inoue, S.; Maeda, H.; Endo, T. Analyzing Tourism Information on Twitter for a Local City. In Proceedings of the 2011 First ACIS International Symposium on Software and Network Engineering (SSNE 2011), Seoul, Korea, 19–20 December 2011; pp. 61–66. [Google Scholar]
- Marrese-Taylor, E.; Velásquez, J.D.; Bravo-Marquez, F.; Matsuo, Y. Identifying Customer Preferences about Tourism Products Using an Aspect-based Opinion Mining Approach. Procedia Comput. Sci. 2013, 22, 182–191. [Google Scholar] [CrossRef] [Green Version]
- Claster, W.; Pardo, P.; Cooper, M.; Tajeddini, K. Tourism, travel and tweets: Algorithmic text analysis methodologies in tourism. Middle East J. Manag. 2013, 1, 81. [Google Scholar] [CrossRef]
- Kirilenko, A.P.; Stepchenkova, S.O.; Kim, H.; Li, X. (Robert) Automated Sentiment Analysis in Tourism: Comparison of Approaches. J. Travel Res. 2017, 57, 1012–1025. [Google Scholar] [CrossRef]
- Deng, N.; Li, X. (Robert) Feeling a destination through the “right” photos: A machine learning model for DMOs’ photo selection. Tour. Manag. 2018, 65, 267–278. [Google Scholar] [CrossRef]
- Liu, Y.; Huang, K.; Bao, J.; Chen, K. Listen to the voices from home: An analysis of Chinese tourists’ sentiments regarding Australian destinations. Tour. Manag. 2019, 71, 337–347. [Google Scholar] [CrossRef]
- Becken, S.; Stantic, B.; Chen, J.; Alaei, A.R.; Connolly, R.M. Monitoring the environment and human sentiment on the Great Barrier Reef: Assessing the potential of collective sensing. J. Environ. Manag. 2017, 203, 87–97. [Google Scholar] [CrossRef]
- MEE (Ministry of Ecology and Environment of the People’s Republic of China). China Reports Improved Air Quality (2013–2018). Available online: http://news.cnr.cn/native/gd/20190605/t20190605_524640603.shtml?ivk_sa=1023197a&ivk_sa_s=130824 (accessed on 21 July 2019).
- Chen, C.M.; Lin, Y.L.; Hsu, C.L. Does air pollution drive away tourists? A case study of the Sun Moon Lake National Scenic Area, Taiwan. Transp. Res. Part D Transp. Environ. 2017, 53, 398–402. [Google Scholar] [CrossRef]
- Law, C.H.R.; Cheung, C. Air Quality in Hong Kong: A Study of the Perception of International Visitors. J. Sustain. Tour. 2007, 15, 390–401. [Google Scholar] [CrossRef]
- Cheung, C.; Law, R. The impact of air quality on tourism: The case of Hong Kong. Pac. Tour. Rev. 2001, 5, 69–74. [Google Scholar]
- Schmunk, S.; Höpken, W.; Fuchs, M.; Lexhagen, M. Sentiment analysis: Extracting decision-relevant knowledge from UGC. In Information and Communication Technologies in Tourism 2014; Springer International Publishing: Cham, Switzerland, 2014. [Google Scholar]
- Feldman, R. Techniques and applications for sentiment analysis. Commun. ACM 2013, 56, 82. [Google Scholar] [CrossRef]
- Chiu, C.; Chiu, N.H.; Sung, R.J.; Hsith, P.Y. Opinion mining of hotel customer-generated contents in Chinese weblogs. Curr. Issues Tour. 2015, 18, 477–495. [Google Scholar] [CrossRef]
- Hu, Y.H.; Chen, Y.L.; Chou, H.L. Opinion mining from online hotel reviews—A text summarization approach. Inf. Process. Manag. 2017, 53, 436–449. [Google Scholar] [CrossRef]
- Kang, H.; Yoo, S.J.; Han, D. Senti-lexicon and improved Naïve Bayes algorithms for sentiment analysis of restaurant reviews. Expert Syst. Appl. 2012, 39, 6000–6010. [Google Scholar] [CrossRef]
- Gräbner, D.; Zanker, M.; Fliedl, G.; Fuchs, M. Classification of Customer Reviews based on Sentiment Analysis. In Information and Communication Technologies in Tourism 2012; Springer Science and Business Media LLC: New York, NY, USA, 2012; pp. 460–470. [Google Scholar] [Green Version]
- Brob, J. Aspect-Oriented Sentiment Analysis of Customer Reviews Using Distant Supervision Techniques. Ph.D. Thesis, University of Berlin, Berlin, Germany, 2013. [Google Scholar]
- Xiang, Z.; Schwartz, Z.; Gerdes, J.H.; Uysal, M. What can big data and text analytics tell us about hotel guest experience and satisfaction? Int. J. Hosp. Manag. 2015, 44, 120–130. [Google Scholar] [CrossRef]
- Ye, Q.; Zhang, Z.; Law, R.; Law, C.H.R. Sentiment classification of online reviews to travel destinations by supervised machine learning approaches. Expert Syst. Appl. 2009, 36, 6527–6535. [Google Scholar] [CrossRef]
- Tan, S.; Wu, Q. A random walk algorithm for automatic construction of domain-oriented sentiment lexicon. Expert Syst. Appl. 2011, 38, 12094–12100. [Google Scholar] [CrossRef]
- Misopoulos, F.; Mitic, M.; Kapoulas, A.; Karapiperis, C. Uncovering customer service experiences with Twitter: The case of airline industry. Manag. Decis. 2014, 52, 705–723. [Google Scholar] [CrossRef]
- Starosta, K.; Budz, S.; Krutwig, M. The impact of German-speaking online media on tourist arrivals in popular tourist destinations for Europeans. Appl. Econ. 2018, 51, 1558–1573. [Google Scholar] [CrossRef]
- Saura, J.R.; Palossanchez, P.; Martin, M.A.R. Attitudes expressed in online comments about environmental factors in the tourism sector: An exploratory study. Int. J. Environ. Res. Public Health 2018, 15, 553. [Google Scholar] [CrossRef]
- Saura, J.R.; Reyes-Menendez, A.; Alvarez-Alonso, C. Do online comments affect environmental management? Identifying factors related to environmental management and sustainability of hotels. Sustainability 2018, 10, 3016. [Google Scholar] [CrossRef]
- Peng, J.; Xiao, H. How does smog influence domestic tourism in China? A case study of Beijing. Asia Pac. J. Tour. Res. 2018, 23, 1115–1128. [Google Scholar] [CrossRef]
- Zhang, S.D.; Li, J.Y. The relation of air quality and tourist emotion based on the micro-blog data: A case study of Xi’an city. J. Shangxi Norm. Univ. 2016, 44, 102–107. [Google Scholar]
- Sina Technology. Sina Released the First Quarter of 2013 Financial Report. Available online: https://tech.sina.com.cn/i/2013-05-17/ 04598348853.shtml (accessed on 22 June 2018).
- Kontopoulos, E.; Berberidis, C.; Dergiades, T.; Bassiliades, N. Ontology-based sentiment analysis of twitter posts. Expert Syst. Appl. 2013, 40, 4065–4074. [Google Scholar] [CrossRef]
- Confente, I. Twenty-Five Years of Word-of-Mouth Studies: A Critical Review of Tourism Research. Int. J. Tour. Res. 2014, 17, 613–624. [Google Scholar] [CrossRef]
- Xu, F.F.; La, L.Q.; Ye, F. A research on destination image and perceived dimension difference based on big data of tourists’ comments: A case of Nanjing. Resour. Sci. 2018, 40, 1483–1493. [Google Scholar]
- Osgood, C.E.; George, J.S.; Percy, H.T. The Measurement of Meaning; University of Illinois Press: Urbana, IL, USA, 1978. [Google Scholar]
- Kahn, J.H.; Tobin, R.M.; Massey, A.E.; Anderson, J.A. Measuring emotional expression with the Linguistic Inquiry and Word Count. Am. J. Psychol. 2007, 120, 263. [Google Scholar] [CrossRef]
- Baylis, P.; Obradovich, N.; Kryvasheyeu, Y.; Chen, H.; Coviello, L.; Moro, E.; Cebrian, M.; Fowler, J.H. Weather impacts expressed sentiment. PLoS ONE 2018, 13, e0195750. [Google Scholar] [CrossRef]
- Kirilenko, A.P.; Molodtsova, T.; Stepchenkova, S.O. People as sensors: Mass media and local temperature influence climate change discussion on Twitter. Glob. Environ. Chang. 2015, 30, 92–100. [Google Scholar] [CrossRef]
- Yan, Q.; Zhou, S.; Wu, S. The influences of tourists’ emotions on the selection of electronic word of mouth platforms. Tour. Manag. 2018, 66, 348–363. [Google Scholar] [CrossRef]
- Cong, L.; Wu, B.; Morrison, A.M.; Shu, H.; Wang, M. Analysis of wildlife tourism experiences with endangered species: An exploratory study of encounters with giant pandas in Chengdu, China. Tour. Manag. 2014, 40, 300–310. [Google Scholar] [CrossRef]
- Donkor, B. Sentiment Analysis: Why It’s Never 100% Accurate. Available online: http://brnrd.me/sentiment-analysis -never-accurate (accessed on 2 April 2019).
- Ganu, G.; Elhadad, N.; Marian, A. Beyond the Stars: Improving Rating Predictions using Review Text Content. In International Workshop on the Web and Databases; ACM: New York, NY, USA, 2009. [Google Scholar]
- Zheng, W.; Ye, Q. Sentiment Classification of Chinese Traveler Reviews by Support Vector Machine Algorithm. In Proceedings of the 2009 Third International Symposium on Intelligent Information Technology Application, Shanghai, China, 21–22 November 2009; Volume 3, pp. 335–338. [Google Scholar]
- Markopoulos, G.; Mikros, G.; Iliadi, A.; Liontos, M. Sentiment analysis of hotel reviews in Greek: A comparison of unigram features of cultural tourism in a digital era. In Cultural Tourism in a Digital Era; Springer: New York, NY, USA, 2015. [Google Scholar]
- Gindl, S.; Weichselbraun, A.; Scharl, A. Cross-Domain contextualisation of sentiment lexicons. In Proceedings of the 19th European Conference on Artificial Intelligence, Lisbon, Portugal, 6 August 2010; IOS: Amsterdam, The Netherlands, 2010. [Google Scholar]
- Kasper, W.; Vela, M. Monitoring and Summarization of Hotel Reviews. In Information and Communication Technologies in Tourism 2012; Springer Science and Business Media LLC: New York, NY, USA, 2012; pp. 471–482. [Google Scholar]
- Bjørkelund, E.; Burnett, T.H.; Nørvåg, K. A study of opinion mining and visualization of hotel reviews. In Proceedings of the 14th International Conference on Mobile and Ubiquitous Multimedia—MUM ’15, Bali, Indonesia, 3–5 December 2012; p. 229. [Google Scholar]
- Bucur, C. Using Opinion Mining Techniques in Tourism. Procedia Econ. Finance 2015, 23, 1666–1673. [Google Scholar] [CrossRef] [Green Version]
- Pablos, A.; Cuadros, M.; Linaza, M.T. OpeNER: Open tools to perform natural language processing on accommodation. In Information and Communication Technologies in Tourism 2015; Springer: New York, NY, USA, 2015. [Google Scholar]
- Jiang, L.; Zhou, H.F.; Bai, L.; Wang, Z.J. The spatio-temporal variation of air quality index of cities in China. Econ. Geogr. 2018, 38, 87–95. [Google Scholar]
- He, C.F.; Zhang, T.; Yang, S.L. Air pollution in Chinese cities: Does enforcement of environmental regulations matter? J. Nat. Resour. 2013, 28, 1651–1663. [Google Scholar]
- Lin, X.Q.; Wang, D. Spatio-temporal variations and socio-economic driving forces of air quality in Chinese cities. Acta Geogr. Sin. 2016, 71, 1357–1371. [Google Scholar]
- Xiao, Y.; Tian, Y.Z.; Xu, W.X.; Wu, J.J.; Tian, L.; Liu, J. Spatiotemporal Pattern Changes of Air Quality in China from 2005 to 2015. Ecol. Environ. Sci. 2017, 26, 243–252. [Google Scholar]
- Denstadli, J.M.; Jacobsen, J.K.S. More Clouds on the Horizon? Polar Tourists’ Weather Tolerances in the Context of Climate Change. Scand. J. Hosp. Tour. 2014, 14, 80–99. [Google Scholar] [CrossRef]
- Zhang, J.C. Climate of China; China Meteorological Press: Beijing, China, 1991. [Google Scholar]
- Xie, Z.H.; Wu, B.H. Tourism spatial structure of resources-based attractions in China. Sci. Geogr. Sin. 2008, 28, 748–753. [Google Scholar]
- Sun, X.; Yang, W.T.; Sun, T.; Wang, Y.P. Negative Emotion under Haze: An Investigation Based on the Microblog and Weather Records of Tianjin, China. Int. J. Environ. Res. Public Health 2019, 16, 86. [Google Scholar] [CrossRef]
- Li, Q.; Li, S.; Hu, J.; Zhang, S.; Hu, J. Tourism Review Sentiment Classification Using a Bidirectional Recurrent Neural Network with an Attention Mechanism and Topic-Enriched Word Vectors. Sustainability 2018, 10, 3313. [Google Scholar] [CrossRef]
- Zhang, C.; Huang, Z.; Cao, F.; Chen, X. Recognise me from outside to inside: Learning the influence chain of urban destination personalities. Tour. Manag. 2019, 70, 390–403. [Google Scholar] [CrossRef]
Figure 1.
The numbers of Weibo comments on the air quality of Class 5A tourism destinations in 2011–2017.
Figure 1.
The numbers of Weibo comments on the air quality of Class 5A tourism destinations in 2011–2017.

Figure 2.
Sentiment values and the numbers of comments on air quality in 2012–2017.

Figure 3.
China’s sentiment map of tourists’ perceptions of air quality.

Figure 4.
Sentiment values of air quality perception of tourism destinations in each province.

Figure 5.
Top ten tourism destinations in terms of sentiment value.

Figure 6.
Bottom ten tourism destinations in terms of sentiment value.

Figure 7.
Semantic network diagram of air quality of China’s tourism destinations by Chinese tourists.
Figure 7.
Semantic network diagram of air quality of China’s tourism destinations by Chinese tourists.

Figure 8.
Semantic network diagram of air quality of the US’s tourism destinations by Chinese tourists.
Figure 8.
Semantic network diagram of air quality of the US’s tourism destinations by Chinese tourists.


Table 1.
Confusion matrix of the results obtained for a general three-class classification problem.
| Predicted | ||||
|---|---|---|---|---|
| Positive | Neutral | Negative | ||
| Original | Positive | a | b | c |
| Neutral | d | e | f | |
| Negative | g | h | i | |
| (1) | ||||
| (2) | ||||
Table 2.
Tourists’ high-frequency words about air quality perception for Heilongjiang and Shanghai sites and their deviations (first 50 words).
Table 2.
Tourists’ high-frequency words about air quality perception for Heilongjiang and Shanghai sites and their deviations (first 50 words).
| High-Frequency Word | OB | GO | RO | BO | High-Frequency Word | OB | GO | RO | BO | High-Frequency Word | OB | GO | RO | BO |
|---|---|---|---|---|---|---|---|---|---|---|---|---|---|---|
| Air | 329 | 2 | 2 | 2 | Environment | 17 | 2 | 2 | 2 | Huangpu River | 20 | 1 | 2 | 2 |
| Sun Island | 136 | 0 | 7 | 0 | Shanghai | 15 | 0 | 0 | 0 | Finance | 19 | 0 | 0 | 0 |
| Wudalianchi | 112 | 3 | 0 | 3 | Taste | 15 | 0 | 0 | 0 | Edifice | 19 | 1 | 1 | 2 |
| Freshing ** | 90 | 0 | 0 | 4 | Forest * | 14 | 0 | 0 | 1 | Clear ** | 19 | 2 | 3 | 3 |
| The North Pole | 83 | 3 | 3 | 3 | Comfortable ** | 14 | 0 | 0 | 1 | Visibility | 17 | 0 | 0 | 0 |
| Jingpo Lake | 64 | 0 | 0 | 0 | Enjoy ** | 14 | 0 | 0 | 0 | See | 17 | 0 | 0 | 0 |
| Harbin | 55 | 2 | 2 | 3 | Nature * | 14 | 0 | 1 | 1 | Building | 16 | 3 | 3 | 3 |
| Fresh ** | 49 | 1 | 0 | 0 | Mood | 14 | 1 | 0 | 1 | Place | 15 | 0 | 0 | 0 |
| Mohe River | 43 | 0 | 0 | 0 | All The Way | 14 | 3 | 1 | 3 | First | 13 | 7 | 0 | 13 |
| Breathe | 42 | 6 | 3 | 6 | Morning | 13 | 0 | 0 | 0 | Everyday | 13 | 0 | 0 | 0 |
| Scenery * | 41 | 18 | 17 | 18 | Russia | 13 | 0 | 0 | 1 | Park * | 13 | 0 | 0 | 0 |
| Volcano * | 40 | 16 | 12 | 16 | Heihe | 13 | 2 | 6 | 2 | Beijing | 13 | 0 | 1 | 1 |
| Northeast | 33 | 5 | 2 | 5 | Time | 12 | 0 | 0 | 0 | Zoo * | 12 | 0 | 0 | 0 |
| Scenic Spot * | 32 | 18 | 17 | 18 | Feeling | 12 | 0 | 0 | 0 | Balcony | 12 | 0 | 0 | 0 |
| Travel * | 30 | 3 | 3 | 3 | Quiet ** | 12 | 1 | 1 | 1 | Afternoon | 12 | 0 | 0 | 2 |
| Heilongjiang River | 30 | 10 | 10 | 10 | Beijing | 11 | 0 | 0 | 0 | Distance | 12 | 1 | 1 | 1 |
| Blue Sky * | 29 | 0 | 1 | 0 | Total | 1795 | 114 | 100 | 124 | Opposite | 11 | 0 | 0 | 0 |
| China | 29 | 2 | 0 | 2 | Air | 367 | 5 | 9 | 9 | Happy ** | 11 | 0 | 0 | 0 |
| Place | 27 | 0 | 0 | 0 | East | 330 | 0 | 0 | 1 | Square | 11 | 0 | 1 | 0 |
| Sky | 16 | 0 | 0 | 0 | Pearl | 323 | 0 | 0 | 0 | Outside | 10 | 0 | 0 | 0 |
| White Cloud * | 22 | 0 | 0 | 0 | Shanghai | 245 | 4 | 4 | 5 | Wild ** | 10 | 0 | 0 | 0 |
| Park * | 22 | 1 | 0 | 1 | Unseen | 57 | 40 | 1 | 21 | Television Tower | 9 | 1 | 0 | 0 |
| Travel * | 22 | 3 | 1 | 3 | Sky | 52 | 44 | 41 | 41 | Hong Kong | 9 | 0 | 0 | 0 |
| Hour | 21 | 4 | 3 | 4 | The Bund | 41 | 10 | 0 | 0 | Century | 9 | 0 | 0 | 0 |
| Nice and Cool ** | 20 | 0 | 0 | 0 | Fresh ** | 41 | 2 | 2 | 3 | Tomorrow | 9 | 0 | 0 | 0 |
| Sunshine * | 20 | 0 | 0 | 0 | Weather | 37 | 0 | 1 | 1 | Beautiful ** | 9 | 0 | 0 | 0 |
| Vacation * | 20 | 6 | 5 | 6 | Science museum | 29 | 8 | 0 | 0 | Rain △ | 9 | 0 | 0 | 0 |
| Beautiful ** | 19 | 0 | 0 | 0 | Pollution △ | 28 | 0 | 0 | 0 | Sunshine * | 9 | 0 | 0 | 0 |
| Scenic Spot * | 17 | 0 | 0 | 0 | JinMao | 28 | 28 | 8 | 2 | Enjoy ** | 9 | 0 | 0 | 0 |
| Da Hinggan Mountains | 17 | 0 | 0 | 1 | Centrality | 23 | 0 | 0 | 0 | Airport | 9 | 1 | 1 | 1 |
| Afternoon | 17 | 0 | 0 | 0 | Global | 21 | 0 | 0 | 0 | Morning | 8 | 1 | 0 | 0 |
| Weather | 17 | 0 | 0 | 0 | Breathe | 21 | 0 | 0 | 0 | Hongqiao | 8 | 0 | 0 | 0 |
| Songhua River | 17 | 1 | 0 | 2 | Pudong | 20 | 0 | 0 | 1 | Taste | 8 | 0 | 0 | 0 |
| Mudan River | 17 | 1 | 1 | 1 | Evening | 20 | 4 | 2 | 2 | Total | 2075 | 163 | 81 | 114 |
Note: OB represents the actual frequency of each word recognized in the Word document composed of all comments on tourism sites in Heilongjiang and Shanghai by tourists; GO represents the deviation between the word segmentation results through Gooseeker and the actual frequency (the same below); RO represents the deviation of ROST CM; BO represents the deviation of BosonNLP; ** represents positive subjective emotion words; * represents positive objective emotion words; △△ represents negative subjective emotion words; △ represents negative objective emotion words; and non-emotional words are unlabeled.
Table 3.
Evaluation criterion parameters for tourism sentiment analysis. (Data source: Modified from the results of Alaei et al. [11])
Table 3.
Evaluation criterion parameters for tourism sentiment analysis. (Data source: Modified from the results of Alaei et al. [11])
| Research | Method | Source of Comments | Language | Data Volume | Polarity Type | Accuracy | Precision | Recall | F1 Index |
|---|---|---|---|---|---|---|---|---|---|
| Ye et al. [34] | SVM | Travel reviews | English | 1191 | 2 | 0.851 | 0.851 | 0.851 | — |
| Ganu et al. [53] | SVM | Hotel reviews | English | 52,264 | 4 | 0.81 | 0.51 | 0.45 | 0.48 |
| Zheng and Ye [54] | SVM | Hotel reviews | Chinese | 479 | 2 | 0.912 | 0.912 | 0.901 | — |
| Zhang et al. [14] | SVM | Hotel reviews | Chinese | 1800 | 2 | 0.948 | 0.948 | 0.948 | — |
| Brob [32] | SVM | Hotel reviews | English | 417,170 | 3 | — | 0.67 | 0.66 | 0.68 |
| Markopoulos et al. [55] | SVM | Hotel reviews | Greek | 1800 | 2 | 0.718 | 0.65 | 1 | 0.79 |
| Ye et al. [34] | Naïve Bayes | Travel reviews | English | 1191 | 2 | 0.807 | 0.82 | 0.82 | — |
| Gindl et al. [56] | Naïve Bayes | Travel reviews | English | 1800 | 2 | — | 0.81 | 0.78 | 0.78 |
| Zhang et al. [14] | Naïve Bayes | Hotel reviews | Chinese | 1800 | 2 | 0.957 | 0.957 | 0.957 | — |
| Shimada et al. [15] | Naïve Bayes | Twitter data | English | 116 | 2 | 0.92 | — | — | — |
| Kang et al. [30] | Naïve Bayes | Hotel reviews | English | 70,000 | 2 | — | 0.737 | 0.728 | — |
| Kasper and Vela [57] | Statistical classifier | Hotel reviews | German | 4792 | 2 | 0.81 | — | — | 0.80 |
| Bjorkelund et al. [58] | Dynamic language model classifier | Hotel reviews | English | 501,083 | 2 | 0.90 | — | — | — |
| 293,879 | 2 | 0.66 | — | — | — | ||||
| Marrese-Taylora et al. [15] | Lexicon-based method | Hotel reviews | English | 200 | 2/3 | — | 0.90 | 0.93 | 0.92 |
| Gräbner et al. [31] | Lexicon-based method | Hotel reviews | English | 80,000 | 3 | — | 0.68 | 0.57 | 0.62 |
| Bucur [59] | Lexicon-based method | Hotel reviews | English | 3000 | 3 | 0.72 | 0.737 | 0.856 | 0.792 |
| García et al. [13] | Lexicon-based method | Hotel reviews | Spanish | 1994 | 3 | 0.80 | — | — | — |
| Chiu et al. [28] | SVM and statistical classifier | Hotel reviews | Chinese | 2147 | 2 | — | 0.89 | 0.91 | 0.89 |
| Schmunk et al. [26] | SVM and lexicon-based method | Hotel reviews | English | 1516 | 3 | 0.724 | — | — | — |
| Pablos et al. [60] | SVM and CRF | Hotel reviews | 6 languages | 1200 | 3 | — | 0.76 | 0.49 | 0.59 |
| Kirilenko et al. [18] | Lexicon-based method | Surveys/Website/Twitter | English | 2232/500/762,475 | 3 | 0.57/0.55/0.60 | 0.38/0.52/0.64 | 0.37/0.49/0.60 | — |
| Kirilenko et al. [18] | SVM | Surveys/Website/Twitter | English | 2232/500/762,475 | 3 | 0.87/0.60/0.51 | 0.52/0.58/0.50 | 0.47/0.55/0.50 | — |
| Kirilenko et al. [18] | Naïve Bayes | Surveys/Website/Twitter | English | 2232/500/762,475 | 3 | 0.87/0.62/0.55 | 0.33/0.56/0.56 | 0.34/0.57/0.55 | — |
| Kirilenko et al. [18] | Deeply Moving | Surveys/Website/Twitter | English | 2232/500/762,475 | 3 | 0.65/0.53/0.39 | 0.45/0.61/0.62 | 0.65/0.58/0.44 | — |
Table 4.
Quarterly sentiment values regarding tourism air quality in different regions.
| Northeast | North | Central | East | South | Southwest | Northwest | Qinghai-Tibet | |
|---|---|---|---|---|---|---|---|---|
| First Quarter | 0.804 | 0.795 | 0.789 | 0.797 | 0.780 | 0.783 | 0.776 | 0.757 |
| Second Quarter | 0.804 | 0.802 | 0.784 | 0.792 | 0.774 | 0.765 | 0.767 | 0.774 |
| Third Quarter | 0.799 | 0.779 | 0.779 | 0.786 | 0.773 | 0.768 | 0.764 | 0.783 |
| Fourth Quarter | 0.804 | 0.787 | 0.782 | 0.788 | 0.805 | 0.777 | 0.758 | 0.768 |
© 2019 by the authors. Licensee MDPI, Basel, Switzerland. This article is an open access article distributed under the terms and conditions of the Creative Commons Attribution (CC BY) license (http://creativecommons.org/licenses/by/4.0/).
Share and Cite
MDPI and ACS Style
Tao, Y.; Zhang, F.; Shi, C.; Chen, Y. Social Media Data-Based Sentiment Analysis of Tourists’ Air Quality Perceptions. Sustainability 2019, 11, 5070. https://doi.org/10.3390/su11185070
AMA Style
Tao Y, Zhang F, Shi C, Chen Y. Social Media Data-Based Sentiment Analysis of Tourists’ Air Quality Perceptions. Sustainability. 2019; 11(18):5070. https://doi.org/10.3390/su11185070
Chicago/Turabian StyleTao, Yuguo, Feng Zhang, Chunyun Shi, and Yun Chen. 2019. "Social Media Data-Based Sentiment Analysis of Tourists’ Air Quality Perceptions" Sustainability 11, no. 18: 5070. https://doi.org/10.3390/su11185070
Note that from the first issue of 2016, this journal uses article numbers instead of page numbers. See further details here.