Dynamic Simulation of Land Use Change of the Upper and Middle Streams of the Luan River, Northern China


1
State Key Laboratory of Earth Surface Processes and Resource Ecology, Beijing Normal University, Beijing 100875, China
2
Faculty of Geographical Science, Beijing Normal University, Beijing 100875, China
3
Center for Human-Environment System Sustainability (CHESS), Beijing Normal University, Beijing 100875, China
*
Authors to whom correspondence should be addressed.
Sustainability 2019, 11(18), 4909; https://doi.org/10.3390/su11184909
Submission received: 13 August 2019
/
Revised: 4 September 2019
/
Accepted: 4 September 2019
/
Published: 8 September 2019
(This article belongs to the Section Environmental Sustainability and Applications)
Abstract
:Climatic, socio-economic, geophysical, and human activity factors, among others, influence land use patterns. However, these driving factors also have different relationships with each other. Combining machine learning methods and statistical models is a good way to simulate the dominant land use types. The Luan River basin is located in a farming-pastoral transitional zone and is an important ecological barrier between Beijing and Tianjin. In this study, we predicted future land use and land cover changes from 2010 to 2020 in the Luan River’s upper and middle reaches under three scenarios—the natural scenario, the ecological scenario, and the sustainable scenario. The results indicate that cultivated land will decrease while the forested areas will increase quantitatively in the future. Built-up areas would increase quickly in the natural scenario, and augmented expansion of forest would be the main features of land use changes in both the ecological scenario and the sustainable scenario. Regarding the spatial pattern, different land use patterns will be aggregated and patches will become larger. Our findings for the scenario analysis of land use changes can provide a reference case for sustainable land use planning and management in the upper and middle Luan River basin.
1. Introduction
Land has dramatic effects on human life. It has immense versatility and it can supply raw materials that are indispensable for human survival including food [1], water, and energy. It also serves other functions such as providing living spaces, transportation, recreation, and so forth, giving land use its multi-functional attributes [2]. Land use is the most direct signal of human impact on the environment [3,4] and includes human activities [5] such as population growth, urbanization, rapid economic development, and human decisions such as local regulations of the economy and environment, institutions, and governance structures [6,7]. The resulting conflicts between humans and nature have become increasingly prominent, gradually becoming a common theme in the field of resource management. Scientists devote themselves to understanding such changes from the perspective of the human-earth complex system, establishing spatial-visual models to simulate land changes and assess the consequences of system changes, such as vulnerability, resilience, and sustainability [8,9,10]. Optimizing the allocation of land resources is an important method to maintain land sustainability, promote the rapid development of regional economies, and gradually harmonize the environment with human activities [11]. Recent studies have been concerned not only with quantity structure optimization but also spatial layout optimization in different ways. Further, scenarios are increasingly being used in environmental change assessment as a means of exploring uncertainties about the consequence of human actions on the environment [12].
In order to provide technical support for land use planning and to establish interactive planning tools, researchers have used different methods to simulate future land use not only in terms of quantitative characteristics but also spatial landscape patterns [13,14]. Different approaches to simulating quantitative characteristics have been used to arrange tasks in order of complexity such as linear programming [15,16,17], multiple objective programming [18,19,20,21], and system dynamics models [22,23,24]. Besides the spatial layout, the optimization of land use has also been studied [25]. Modeling land use changes can promote understanding of the human-land interaction mechanism, and simulation results can provide a basis for land resource optimization and environmental policy formulation [8,26]. Parker [27] summarized and classified several popular land use models including the Equation-Based Models, System Model, Statistical Model, Expert Model, Evolutionary Model, Cellular Model, Hybrid Model, and Agent-based Model. These models are pattern-oriented models which can combine well with remote sensing data and better reflect the role of neighbors [8,28,29]. Presently, the widely used spatial simulation models of land use change includes the CA-Markov model [30], a series of CLUE models including the CLUE model, CLUE-s, and Dyna-CLUE models [2,31,32,33], TESim-LUC model [34], future land-use simulation (FLUS) [35], LTM [36], SLEUTH [37,38], FORE-SCE [39], and GEO-MOD [40].
The FLUS model tightly integrates machine learning and statistical models with the CA model [30,35,41,42] for a multiple land use and land cover (LUCC) dynamic simulation. The FLUS model can also consider the non-dominant land use types, which is smarter than the CLUE model. Many researchers have used the landscape pattern theory and GIS spatial analysis technology to construct different scenarios [43,44,45,46,47,48]. Land use and cover change are affected by complicated factors such as nature and the social economy, so simulating land use change in space and time becomes a difficult problem in LUCC research. LUCC simulation models are effective and reproducible tools for analyzing both the causes and consequences of future landscape dynamics under various scenarios [35]. Recently researchers have changed their focus from the global scale [49] to a finer scale, since details can be used to provide some advice for specific areas [33,50,51,52,53,54]. The planning and management of land use is an attempt to achieve land use configuration by influencing the dynamics of land use changes so that a balance is maintained between the stakeholders and environmental needs [31,55].
Here, the study area was the ecological barrier of Beijing, Tianjin, and even the whole northern China, which has almost 50% of its area covered by forests. It is also a critical water source for the Tianjin Province and Tangshan City with the “Diversion Project from Luan-he to Tianjin” [56,57], and is partly located in the agro-pastoral transitional zone of Northern China, which is vulnerable to environmental changes [58]. Others parts of it are located in the Northern China Plain, which results in incredibly complex biophysical attributes and landscape heterogeneity. The confluence of human activities and global changes have caused various environmental problems [59,60] in this area such as underground water shortages and land degradation.
The aim of this paper was to find the appropriate land use patterns that can improve the well-being of the local people. In order to achieve this goal, three steps were taken—First, three scenarios were constructed under different constraints of natural development, social and economic development, and sustainable development. Second, the linear fitting method was used. Linear planning was used to obtain the quantitative structures under the constraints of the three scenarios in 2020. Third, the spatial distribution of land use was simulated under different quantitative structures with the FLUS model. Finally, we compared the different landscape patterns under different scenarios by using landscape pattern indexes and determined the hotspots for land use change. The objective of this study was to seek landscape and regional spatial patterns that can promote long-term maintenance and improvement of ecosystem services and human well-being in the case of uncertain internal dynamics and external disturbances. We also sought to provide some advice for local governments to make the landscape design more sustainable, as well as to consider future perspectives and scenario setting.
2. Materials and Methods
2.1. Study Area
The study area is located in the northeast of Hebei Province, Northern China between 116.22°–119.24°E and 40.08°–42.60°N (Figure 1), and covers an area of 4.0×10⁴ km2. The Luan River basin is famous for its abundant water resources in Northern China. This area belongs to the upper and middle streams of the Luan River basin, which is an important water source for Beijing and Tianjin [61]. It is a link to the inland and the coast, which has a slightly temperate continental monsoon climate with little precipitation and a typical temperate monsoon climate with much precipitation during summer, mainly from June to September (67%–76%). In total, it has an average annual atmospheric temperature of 6.1 °C and a precipitation rate of 381.87–710.85 mm in the past three decades [62,63]. The terrain is complex and the elevation of the study area varies considerably. The northwest part of this area lies in the Bashang Plateau an with elevation of 1200–1800 m above sea level, and the rest is about 500-1200 m above sea level. In 2015, the main land use type was forest area (49.13%) and grassland (38.76%). In the study area, several major tributaries of the Luan River (Figure 1b) eventually drain into the Panjiakou Reservoirs. We used a digital elevation model (DEM) to delineate the main watershed with a GIS technique, and then we merged the main stream of the Luan River which resulted in ten watersheds [64]. The Xiaoluan River basin (XL), the upper streams of Mayitu River basin (MYT), and the Yixun River basin (YX) form the headstream of the Luan River basin, which are abundant with clear water. The basin in the study area includes MYT, YX, the Wulie River basin (WL), the Laoniu River basin (LN), the Liu River basin (LR), and the Bao River basin (BR), which are covered by a large amount of crops and larger buildings and thus face a lack of land and water.
2.2. Data
The Climate Change Initiative Land Cover (CCI-LC) project, which is funded by the European Space Agency delivers consistent global land cover maps at 300 m spatial resolution on an annual basis [65]. We selected the land use maps in 1995, 2000, 2005, 2010, and 2015 as the study objects. Land use was classified into six types—cultivated land, forestry area, grassland, water area, built-up area, and unused land. Otherwise, there are many driving factors for land use change, including natural factors as well as social factors [66]. Some basic information, such as climate, soil, elevation, and river data, was obtained from the Resource and Environment Data Cloud Platform [67]. Further, some human activities cause changes in land use, so data for roads, and the core administrative areas such as cities and counties, were included, and can be found on the Open Street Map [68].
2.3. Methodology
2.3.1. Scenario Design
According to the law of land use change, the requirements of economic development and ecological security should be guaranteed at the same time. We defined three scenarios on the basis of the land use status in 2010.
The natural scenario: It has been claimed that contemporary landscapes are contingent on past and present patterns, processes, and decisions [12]. The natural scenario is a reference case scenario based on past and recent (1995–2015) socioeconomic trends of economic and population growth. As time goes by, the development of a region transforms both social and environmental factors together. Such development provides the benefits of industrial growth, the introduction of modern techniques and improvements in infrastructure and global environmental protective measures. One key consequence is the rapid expansion of built-up and gradual growing water areas. However, what will the land be like after rapid land use changes if it was left alone? The natural scenario provides the answer. We used the linear fitting method and found that the area of cultivated land (R2=0.98), grassland (R2=0.77), water area (R2=0.79), and build-up area (R2=0.96), have great linear fitting trends every five years from 1995 to 2015 but not forest land and unused land (the change was too small to observe). So, we took the linear fitting trend and kept unused land as usual, then calculated the amount of forest area by using the total area minus the others. Finally, we used the total area minus the others to obtain the area of the forest.
The ecological scenario: As at the First Session of the Thirteenth National People’s Congress on March 11, 2018, the 2018 Amendment was passed by the Constitution of the People’s Republic of China: “The state protects and improves the environment in which people live and the ecological environment. It prevents and controls pollution and other public hazards. The state organizes and encourages afforestation and the protection of forests.” So, we designed the ecological scenario to increase green area. Under this scenario, cultivated land on steep slopes and low-yielding fields are returned to forest or grassland. According to the tree line of this region, we transformed cultivated land located on land steeper than 15° and at an altitude higher than 1600 m into grassland, and that at an altitude below 1600 m was turned into forest. This scenario assumes that ecology is the only concern and the environment is considered, before economic and population growth; also urbanization would be maintained at a lower rate.
The sustainable scenario: The core goal of the sustainable scenario is to balance environmental protection and economic growth. In this scenario, society, environmental protection, and economic growth are considered comprehensively. When environmental needs are met in ecology, the profits are also expected to be maximized in the economy. We used the linear planning strategy (Linear Interactive and General Optimizer, LINGO, Lindo Systems Inc., USA) to constrict the following factors—(i) The basic constraint includes land use and population. The area of cultivated land is not less than basic land needs; neither forestry nor built-up area is less than current situation. The population is less than predicted by city planning. (ii) The ecological constraint sets the standard for ecosystem services which entails the ecosystem services maintaining the current level and even surpassing it. (iii) The economic constraint considers financial earnings, which need to be no less than the predicted planning. (iv) Based on the first three steps, the maximum economic benefits are obtained. When factors (i)–(iii) are kept in the request field, the quantitative structure which can earn the most money in economy is chosen.
2.3.2. FLUS Model
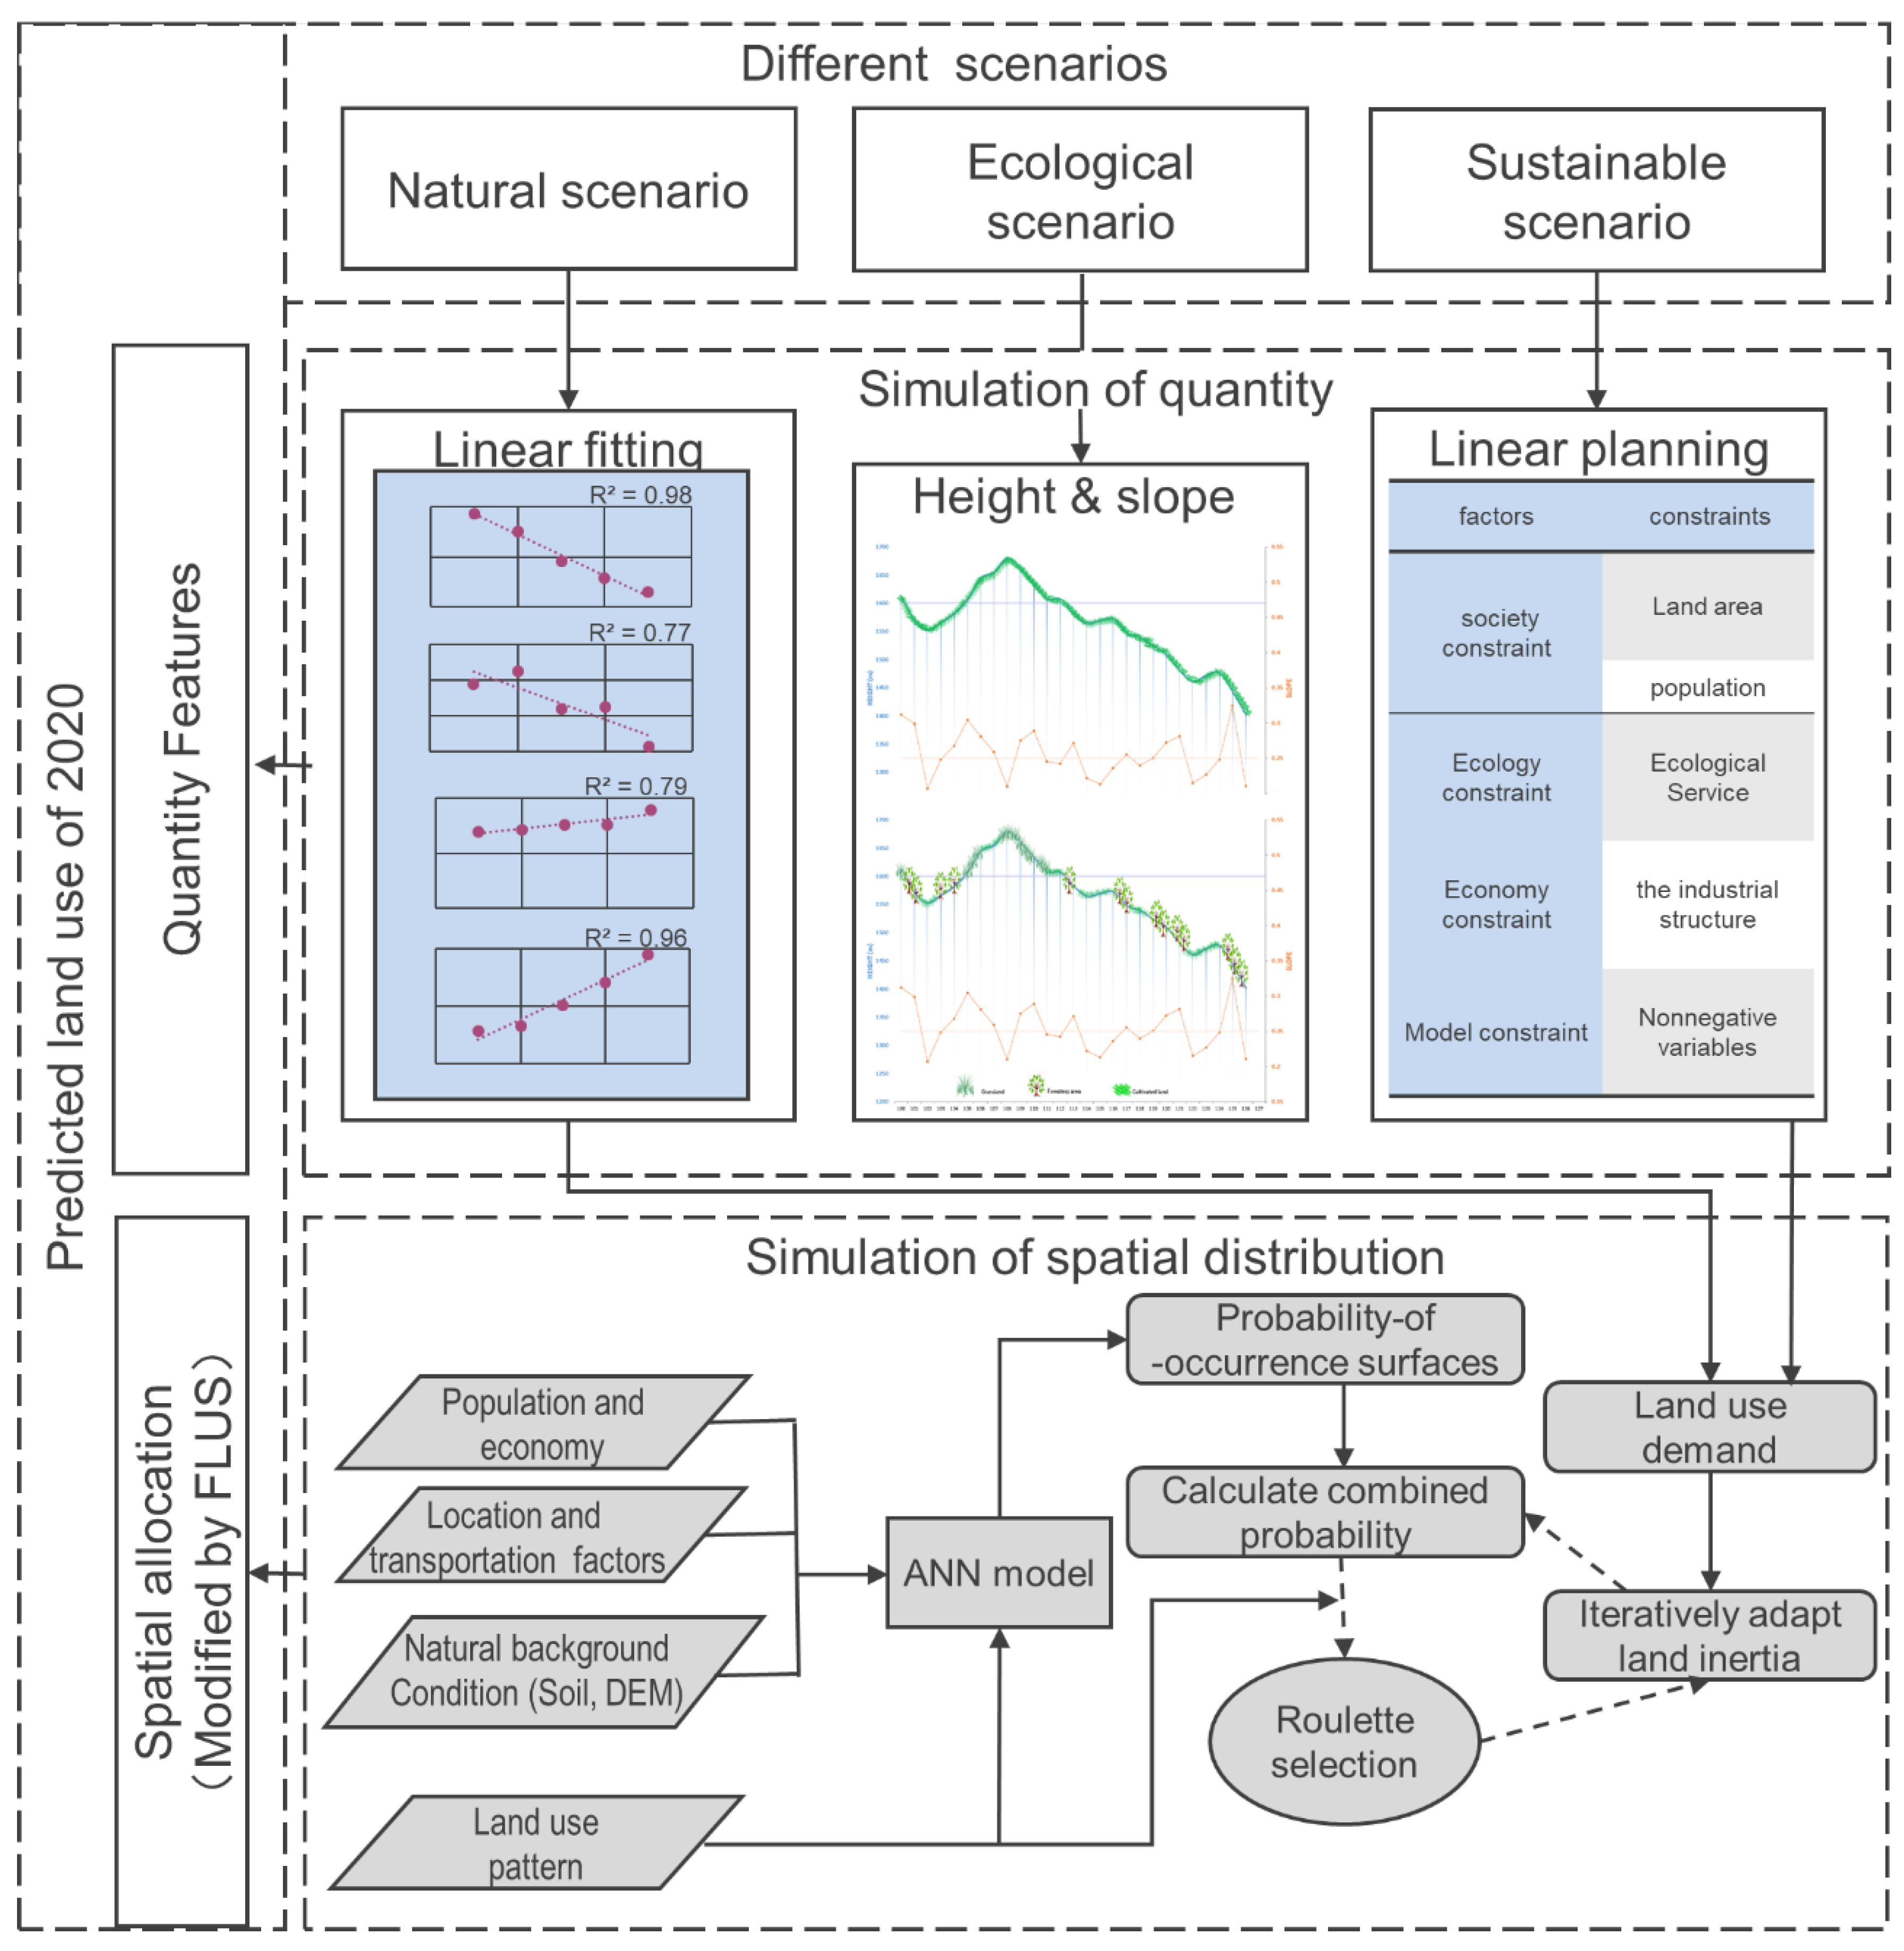
The FLUS model is a kind of LUCC simulation model that combines multiple CA allocation models and an artificial neural network [35]. A self-adaptive inertia and competition mechanism was developed within the CA model to process the complex competition and interactions between the different land-use types. Otherwise, the distinguishing aspect of the FLUS model compared with other models is that it has a roulette mechanism which was added to reflect the uncertainty of real-world LUCC dynamics. We used the land use data of 2010 as the base data map; added 17 driving data points, including soil and slope aspects; and calculated the distance of each pixel to the main rivers, streams, all kinds of roads, and different core administrative areas as the driving factors of the simulations of spatial allocation. Then, the model was set to complete 14 hidden layers to estimate the probability of occurrence [30]. It was trained many times and the land use data from 2010 to 2015 was finally adopted to evaluate the accuracy of the simulation results from the FLUS model and to set the weight of neighbors as, respectively 0.6, 0.8, 0.6, 0.7, 0.8, and 0.8. The simulation passed the validation and had an overall accuracy of 94.10%. Figure 2 shows the method framework of the paper.
3. Results
3.1. Quantifying Changes in Land Use
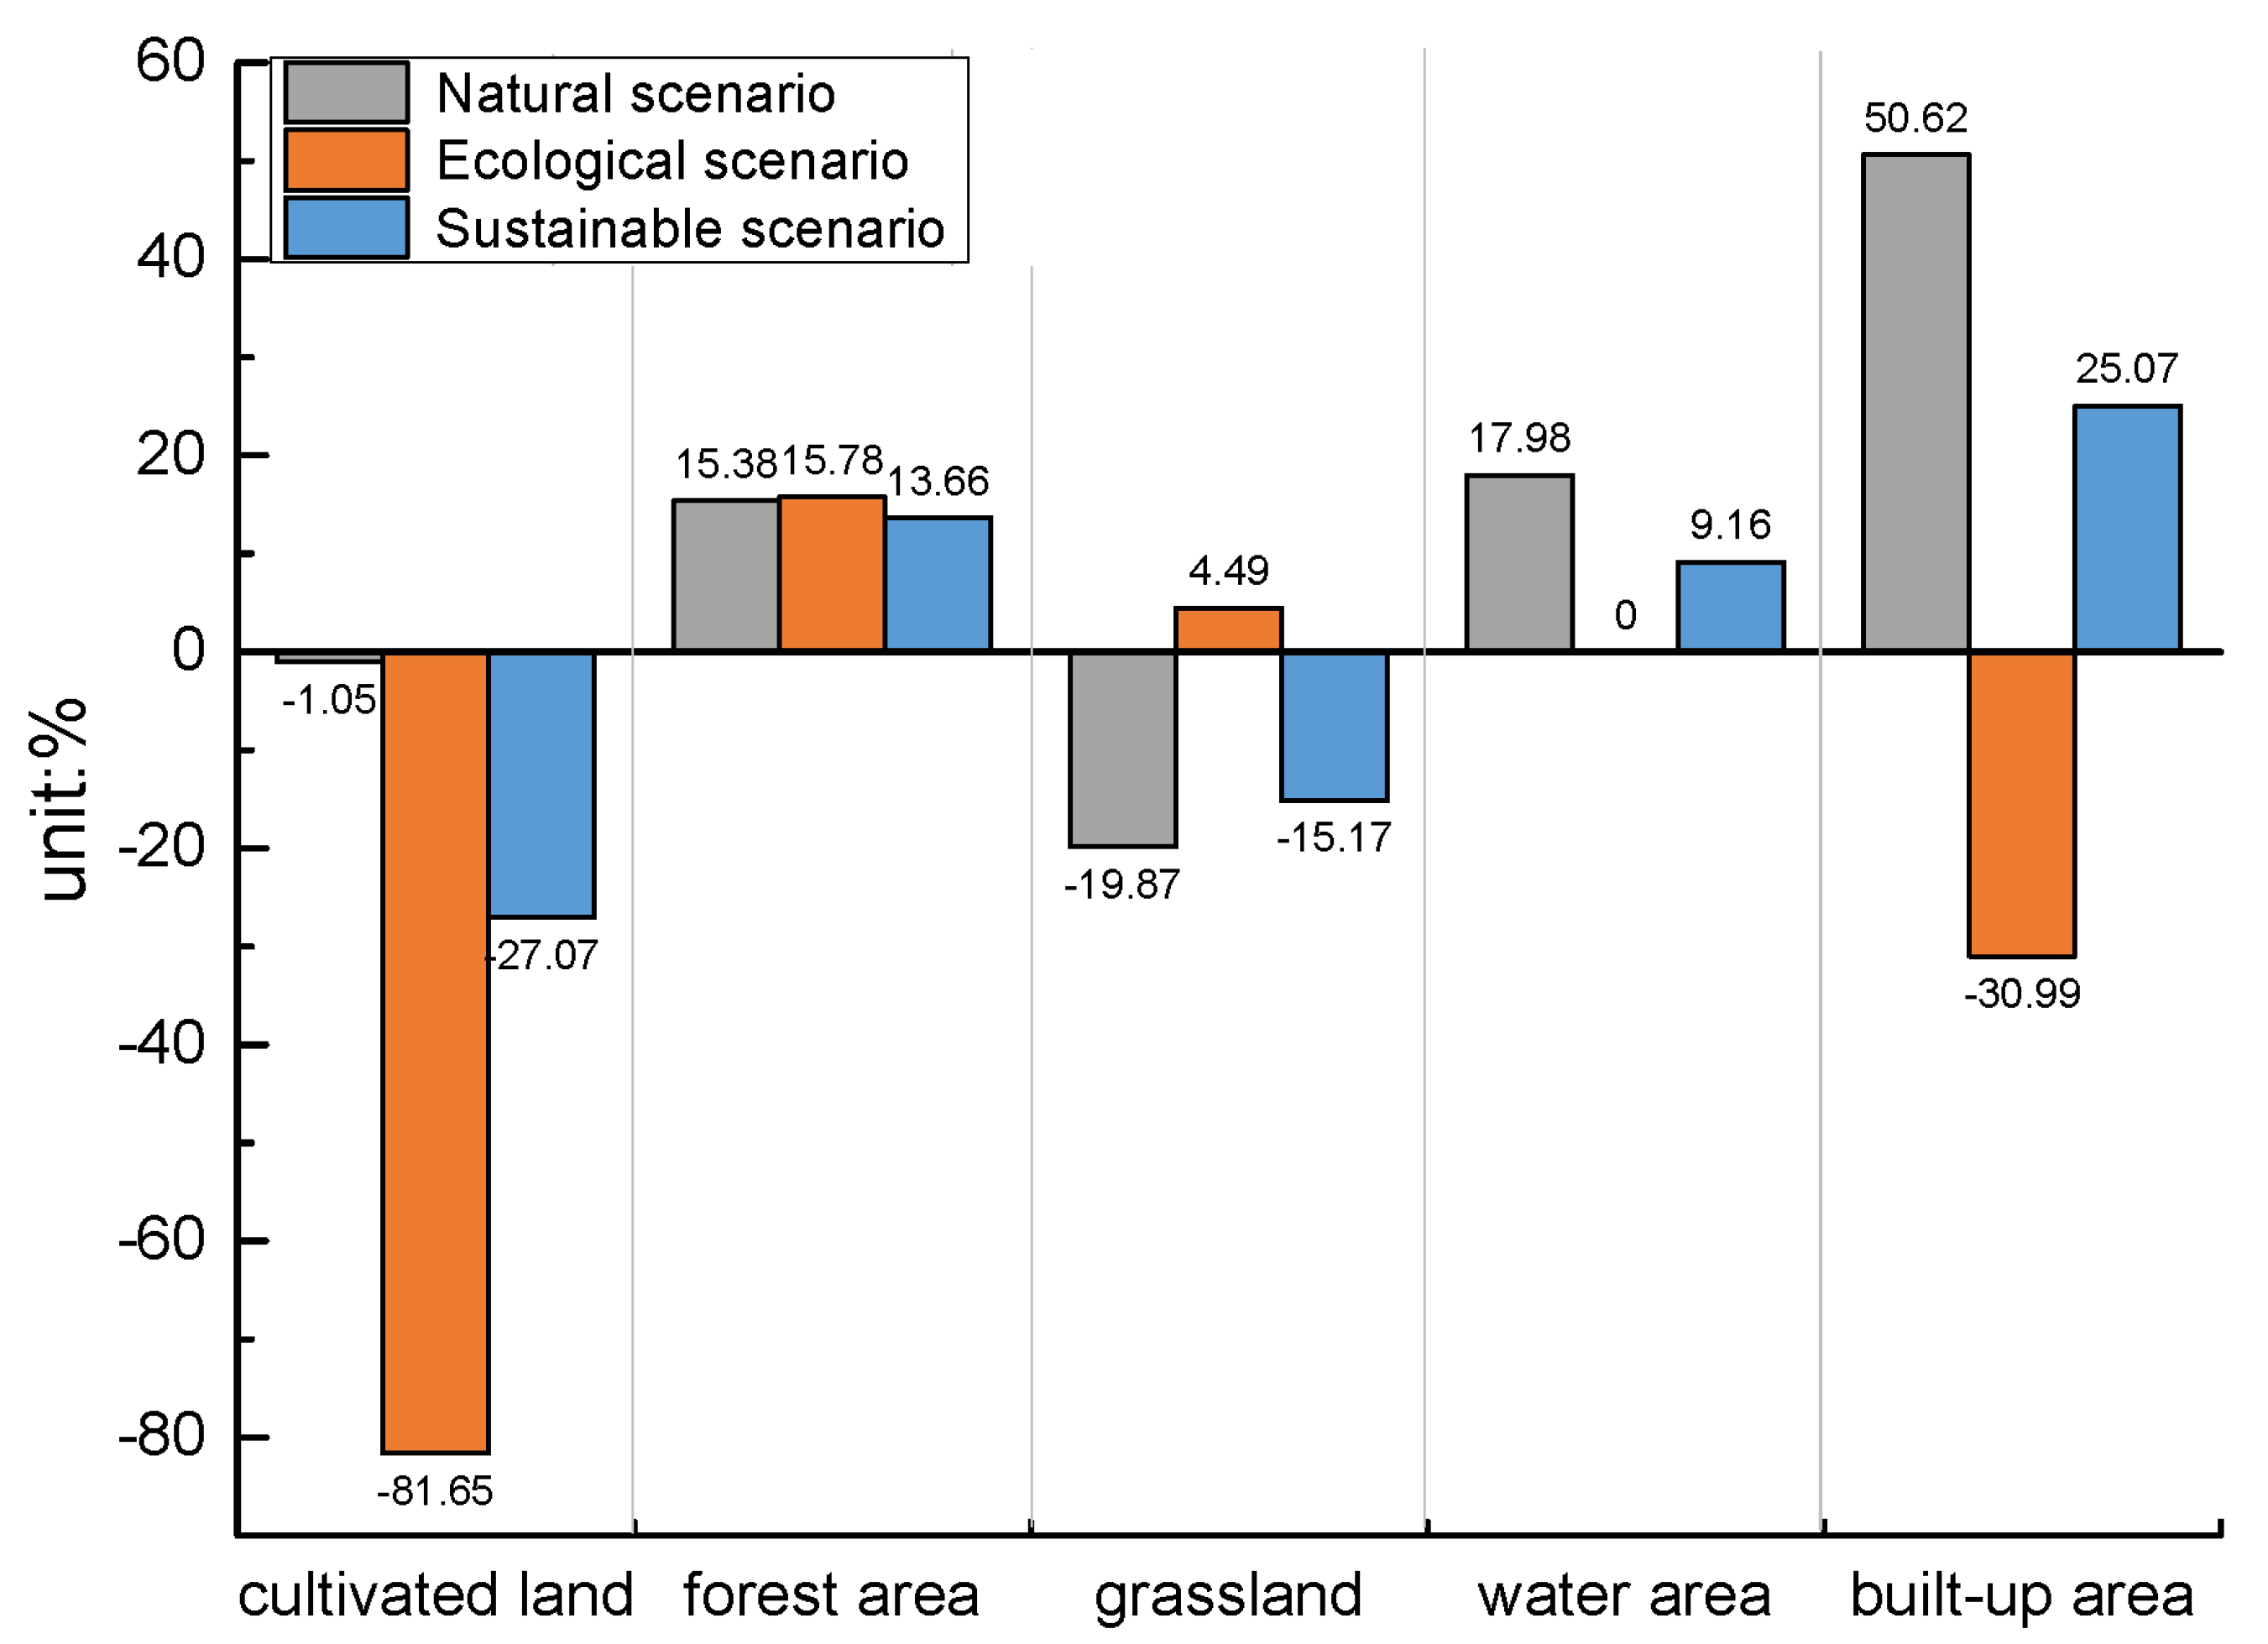
Under the three different scenarios, the quantifying structure of land use was different (Figure 3). Forest and grassland were major land use types in this area, accounting for about 49.13% and 38.76% of the total area, respectively, while cultivated land, water area, built-up, and unused land accounted for 11.42%, 0.24%, 0.39%, and 0.06% in 2010, respectively. Figure 3 shows the quantifying changes of different land use types under the three scenarios compared with 2010 respectively. What they have in common is that the cultivated land would decline, while the forest area would markedly increase, and the average increase rate of the three scenarios was 14.94%. The water area would remain stable, and the average increase rate of the three scenarios was 9.05%. In the natural scenario, the area of cultivated land decreased by 1.05%, and grassland by 19.87%. The forest, water, and built-up areas increased by 15.38%, 17.98%, and 50.62%, respectively. In the ecological scenario, the area of cultivated land decreased by 81.65% and the built-up area by 30.99%. The forest area increased by 15.78%, while grassland by 4.49%. In the sustainable scenario, the area of cultivated land decreased by 27.07% and grassland by 15.17%. The forest, water area, and built-up areas increased by 13.66%, 9.16%, and 25.07%, respectively.
3.2. Spatial Allocation of Land Use Changes
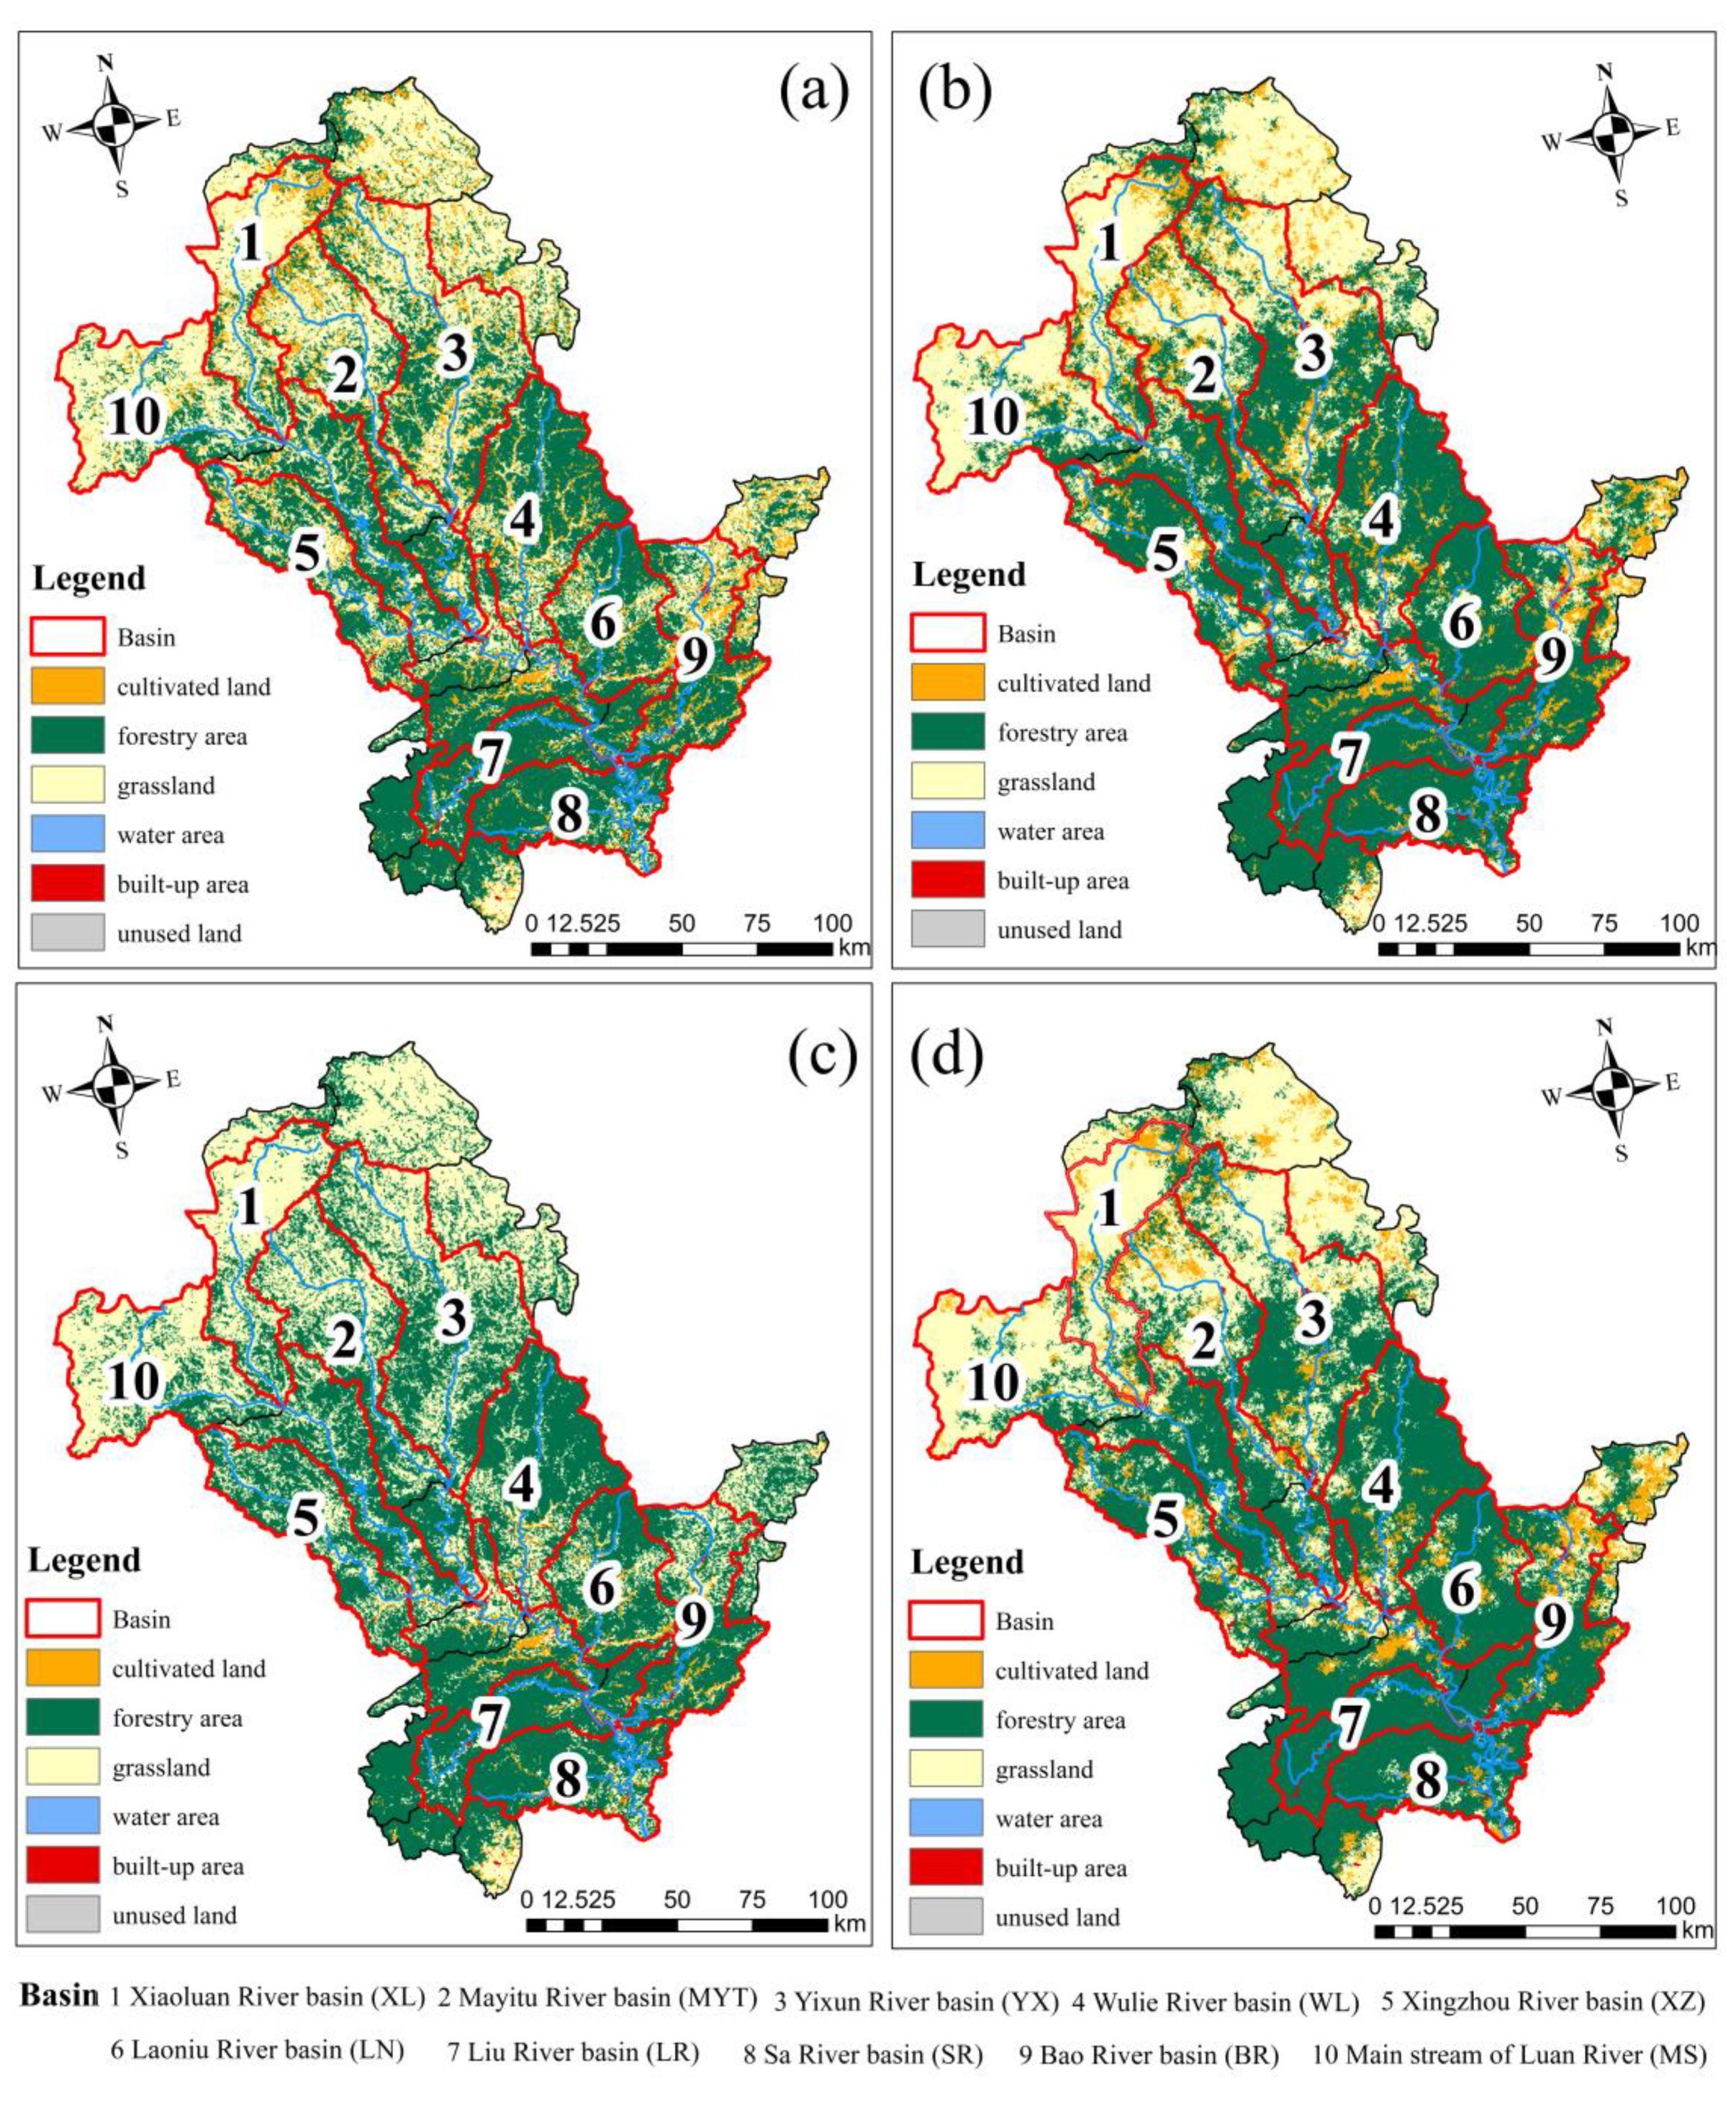
Figure 4 shows the spatial allocation of land use under the three scenarios and 2010. In 2010, the forest area covered about 49.13% of the study area, covering the middle and southwest areas, including the northern WL, the LN, the LR, and the SR. Grassland was located in the north, in the northern area of the XL, the MYT, and the YX. Cultivated land occupied the northeast of this area and was, mainly distributed in the northeast of the XL and the YX. The middle of this area was along the main stream of the Luan River which is near the WL, and the southeast of the whole watershed which is near the PR. Compared with the spatial allocation in 2010, under the natural scenario, 73.39% of the area would not change. However, the cultivated land would be generated around the past cultivated area though its total area would be reduced. The forest area would increase and be located in the middle area of the watershed. In the south area of the YX, the MYT, and the WL, some grassland would become forest area. Further, the built-up would expand into the middle of the YX, the WL, the PR, and the SR. Under the ecological scenario, the reduction of cultivated land would mainly be distributed in the south and middle of the study area. The built-up area may stop expanding in Chengde City and is expected to decrease in the XZ, the PR, and the LR. Grassland would increase in the north and the forest would increase in the south. Under the sustainable scenario, cultivated land would be generated in the southeast of the watershed and in the middle of the MYT and the YX, and forest area would increase in the south. The built-up area would expand in the middle of the YX and the WL.
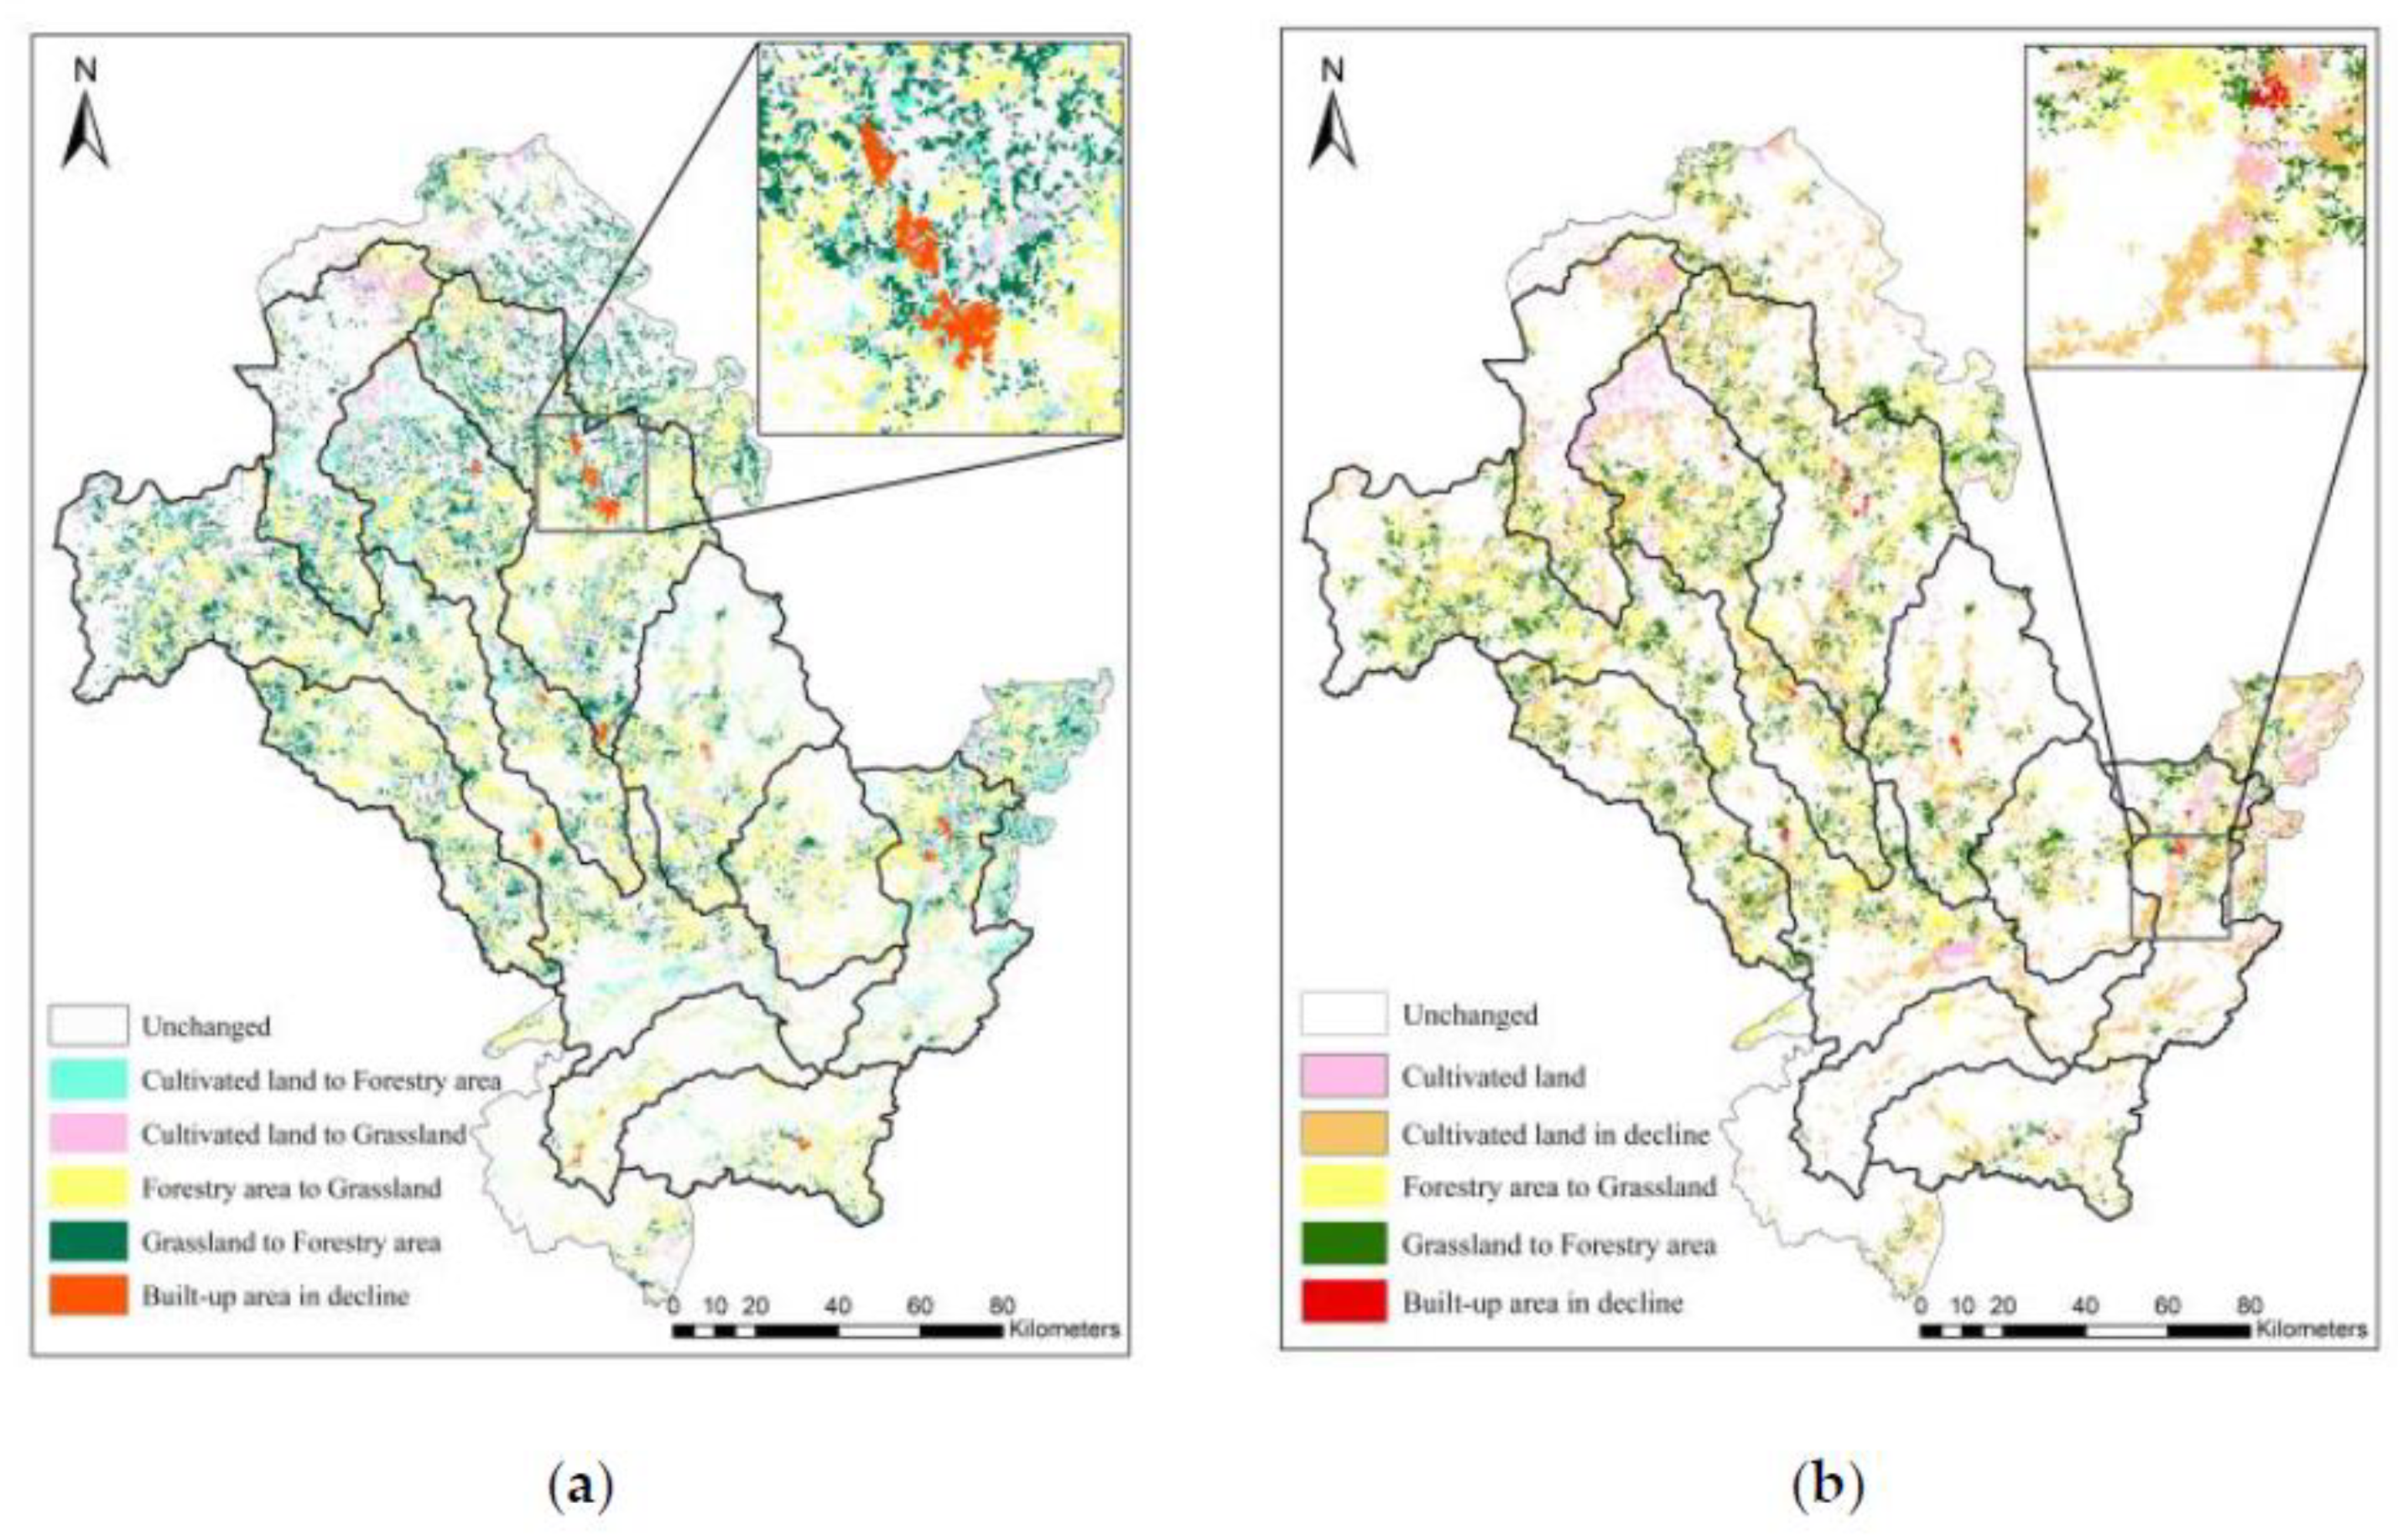
Comparing the ecological scenario with the natural scenario (Figure 5a), the spatial allocation of most land use (66.85%) under both scenarios is the same. About 5.16% of cultivated land under the natural scenario would become forest under the ecological scenario, mostly located in the PR and Chengde County, due to the expanding the natural environments without considering other factors under the ecological scenario. About 5.12% of cultivated land under the natural scenario would become grassland under the ecological scenario, mostly located in the MYT and PR, and about 12.87% of forest would become grassland most of which be in the watershed area except the PR and the SR. This is because the land in higher latitudes and barren soil is suitable for growing grass. Furthermore, about 8.49% of grassland would become forest, mostly in the MYT, the YX, and the XL, to improve the water quality. About 0.38% of the built-up area would change to other land use types, such as forest area and grassland, mostly in the middle of the YX.
Between the sustainable scenario and the natural scenario, the proportion of unchanged land use was 70.69%. Figure 5b shows the change between the natural scenario and the ecological scenario. Cultivated land (8.48%) under the natural scenario would be transferred to other land use types under the sustainable scenario, mostly in the northern and southern watershed. About 8.38% of forest under the natural scenario would become grassland under the sustainable scenario, and about 6.70% of grassland under the natural scenario would become forest under the sustainable scenario, located in most of the area of the watershed except Panjiakou Reservoir and the SR. The changes between forest and grassland would be in most of the area of the watershed except Panjiakou Reservoir and SR. Furthermore, about 0.16% of built-up area under the natural scenario would become forest and grassland under the sustainable scenario, mostly in the south.
3.3. Landscape Patterns under Different Scenarios
Using the FRAGSTATS software program [69], we calculated several indexes to compare the landscape patterns under different scenarios (Table 1).
The number of patches (NP) of the three scenarios were all smaller than that in 2010 which means that landscape patterns would be generated in the future. The landscape shape index (LSI) of the ecological scenario was bigger than the natural scenario and the sustainable scenario, meaning that the ecological scenario would have more complex patches than the others. The closer the index perimeter area fractal dimension (PAFRAC) is to 1, the larger the human impacts. Thus, in all three scenarios, the area would be more natural than before. The Shannon’s diversity index (SHDI) showed that the landscape richness of the ecological scenario was lower than the others. The aggregation index (AI) of the sustainable scenario was larger than the others. All in all, the ecological scenario had smaller landscape patches, smaller patch density, but simple landscape patterns. However, the sustainable scenario would be more generated and have complex landscape patterns.
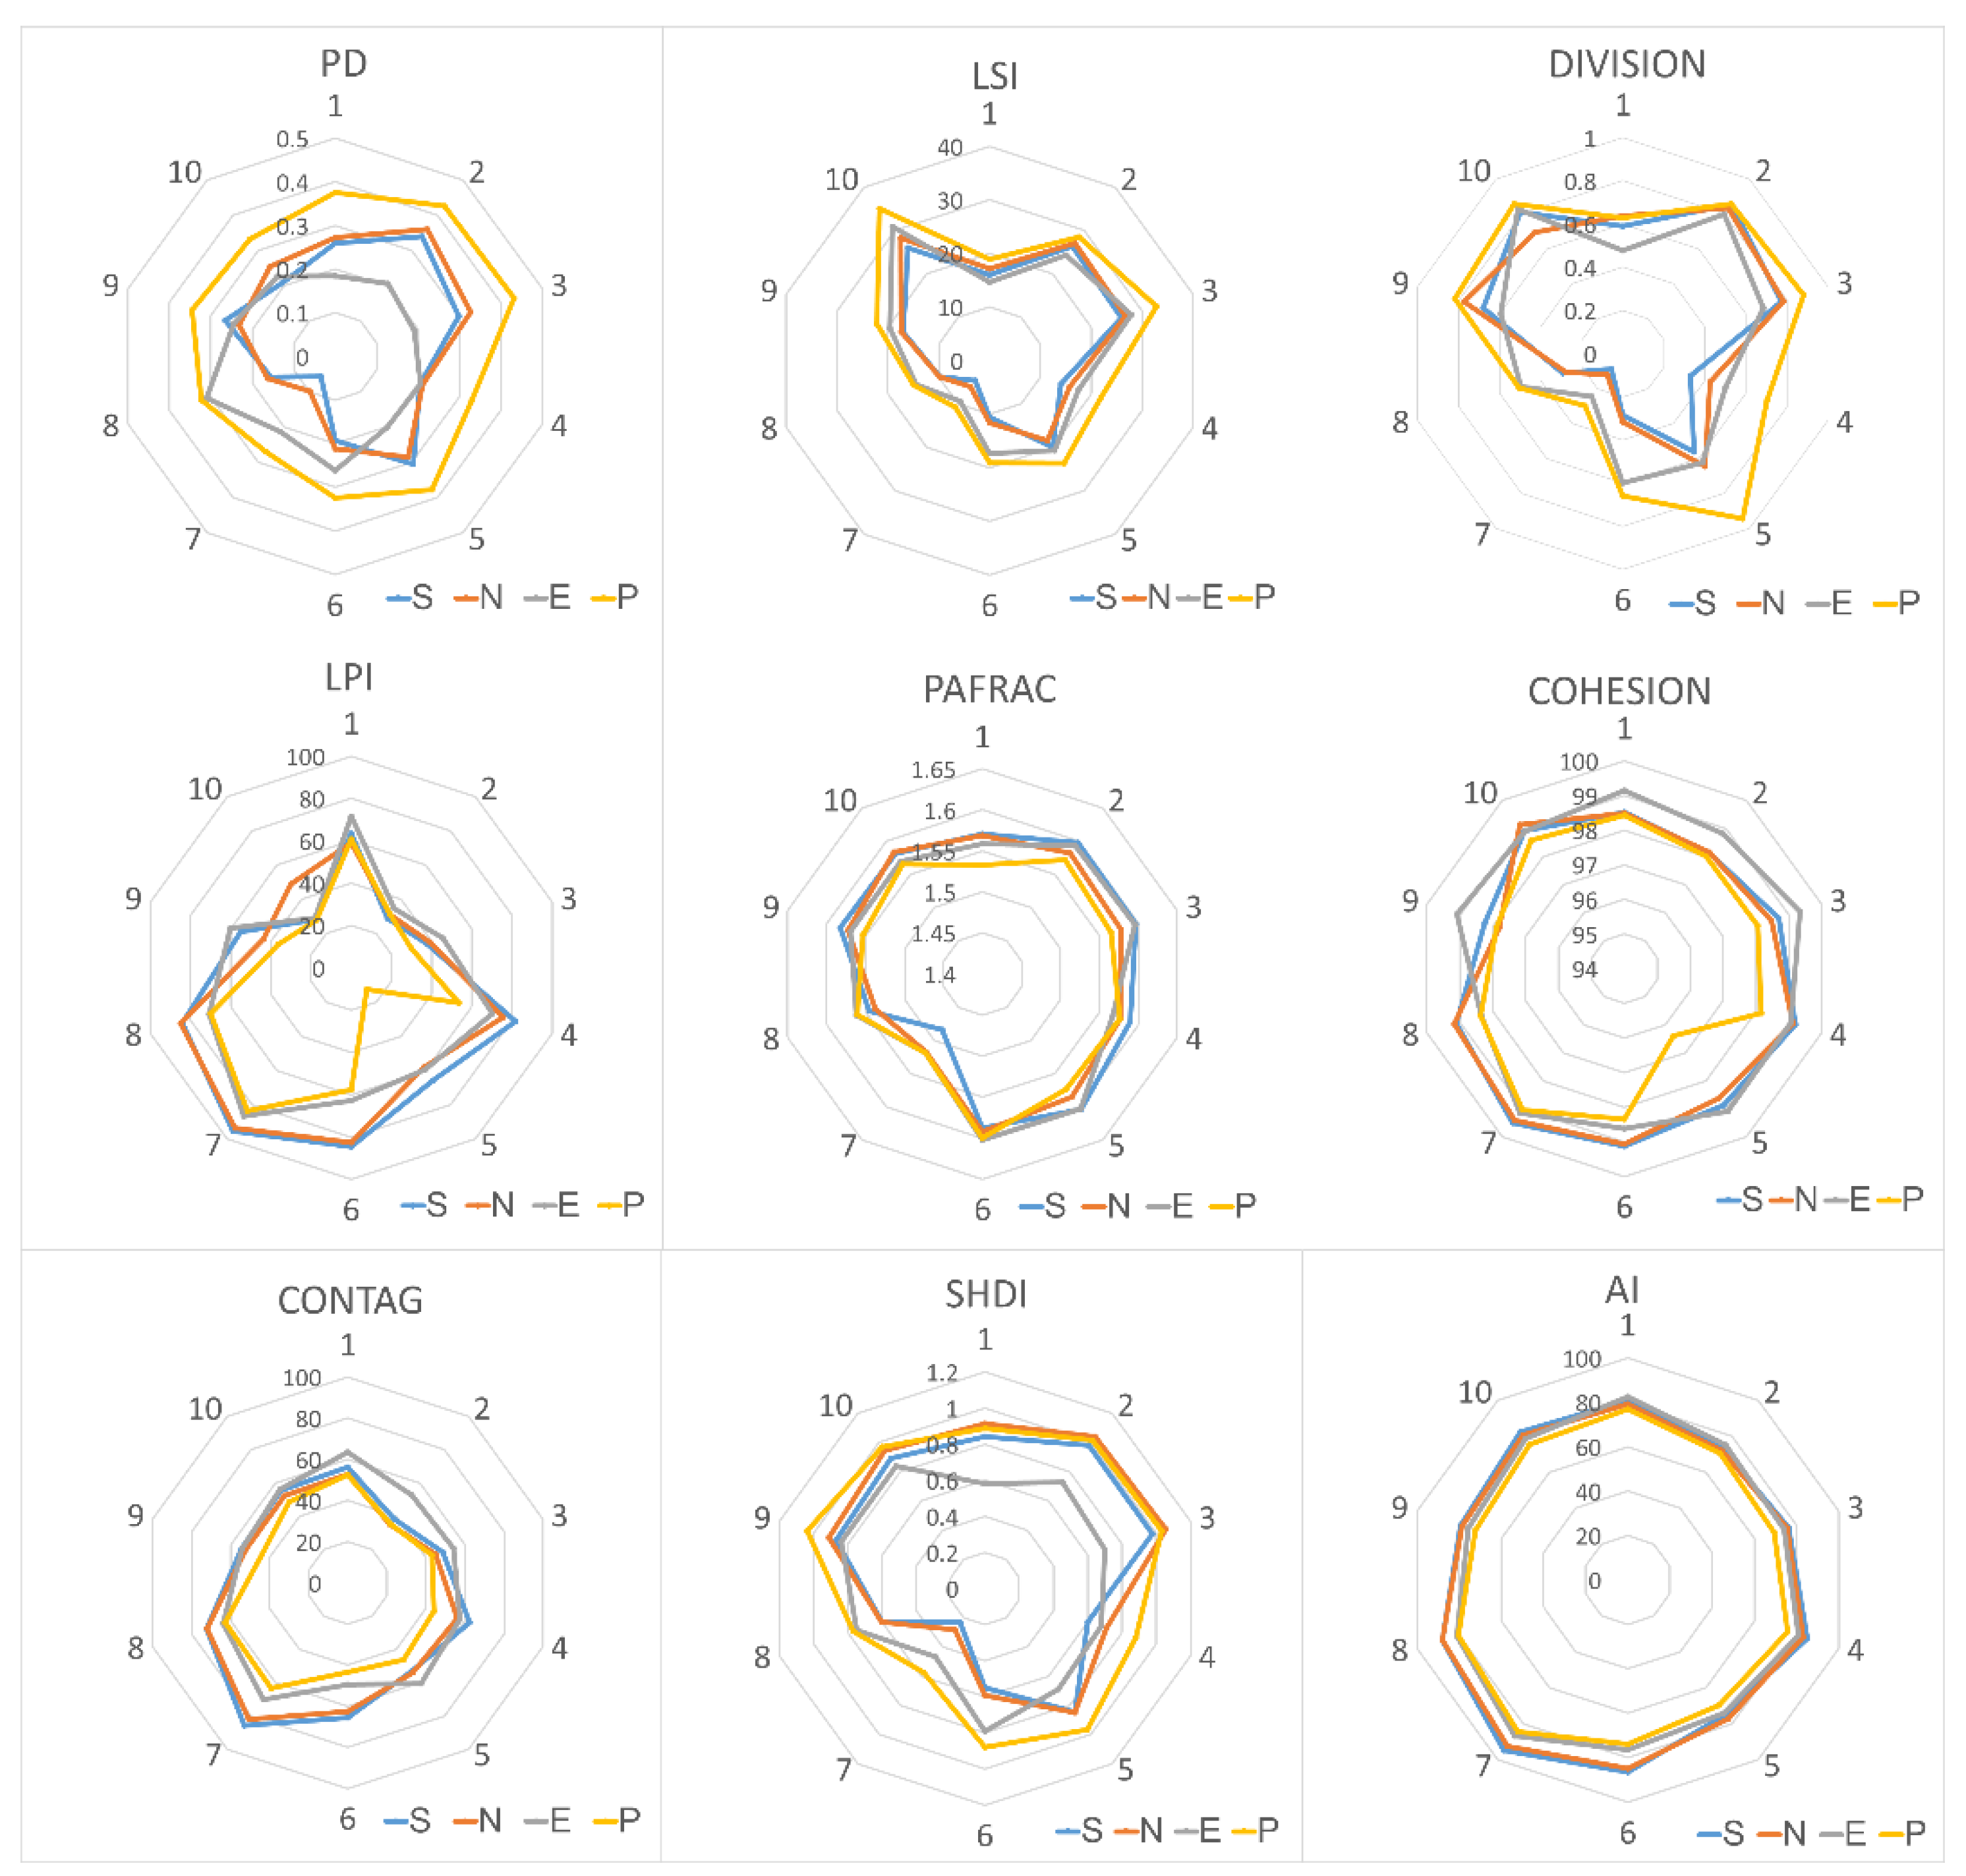
The watershed was separated into 10 sub-basins (Figure 1). The landscape pattern indexes of the different sub-basins are shown in Figure 6. The SR and LR showed more sensitivity. Under the natural scenario, the SR and LR had fewer patches and were more generated than the other sub-basins. The LSI under the natural scenario was less than the sustainable scenario, meaning that land use would be more affected by humans. The LR had a smaller PAFRAC than other sub-basins, which means that the shape of this land use become more regular. The SHDI index dropped sharply in the LR. The AI increased sharply in the LN. In total the patch density (PD) increased in the down reaches of the Luan River under the ecological scenario.
Using the table of ecosystem service equivalent value per unit area in China, which was made by Gao-di et al. (2015) [70], we calculated the monetary value of ecosystem services under each scenario (Table 2). The ecological scenario had the highest value. The profits earning value of the natural scenario was the highest. However, the total value of the sustainable scenario was the highest and the ecological scenario was the lowest.
4. Discussion
4.1. Characteristics of Scenarios Setting and Each Scenario Simulation
Scenario results are useful tools that provide potential options for environmental management and sustainable land use planning [17,25]. Many studies have used at least three scenarios to simulate land use changes such as the business-as-usual (BAU), coordinated environmental sustainability (CES), and rapid economic growth (REG) scenarios [7]. This paper not only considered the characteristics of land use and socioeconomic developments but also attempted to add specific land design projects into the simulation scenarios. Specifically, the natural scenario was based on past and current development tendencies including population growth and economic and environmental protection, which is the same as the BAU scenario [71]. The other two scenarios set a threshold value first based on the overall land use planning of Chengde City for 2009–2020 from the government such as that there would be a restricted area in Chengde City for two important nature reserves (Mulan Weichang and Saihanba). Further, the ecological scenario put the protection and improvement of the environment in first place in order to suit the strictest requirements of the Grain to Green Project. The sustainable scenario combined the implementation of both new economic and environmental policies and maintained the basic farmland area at no less than 2770 km2.
Many studies have shown that under the BAU scenario, built-up areas are expected to increase and forestry area to decrease in a rapidly urbanizing city in northwest China, and the transformation of urban land from water bodies and wetlands is expected in South China [72,73]. The study area has the same changes. However, in our study area, forestry area is increasing because the regional ecological governments have been protecting the environment and consider it to be the most important resource for sustainable development. The reason for the decrease in grassland is that more grassland would become built-up area than would other land use types change into grassland [74].
It is generally believed that the way to increase ecological land use is to transform surrounding wasteland, flat terrain, and unused land with good hydrological conditions into ecological land and expand existing forests and grasslands. However, the region itself has higher ecosystem services in the Beijing-Tianjin-Hebei region [75]. Since forests cover over 50% of the total area, it is less useful to increase the green area than to make efforts to preserve it. Specifically, grassland in the northern area would help limit wind erosion, since high-altitude shrubs may reduce the death of growing trees where it is difficult to grow. Under the three scenarios, cultivated land would decrease, which would be different from the area in the agro-pastoral transitional zone of Northern China. This raises that the problem of how to increase the trade-off between ecosystem services and food production security.
Our findings suggest that the sustainable scenario is the most ideal of the three, provided that the environmental policy is strictly implemented. It can offer both environmental and economic benefits and be highly sustainable [76].
4.2. The Changes of Landscape Pattern
A better understanding of the determining factors of land-use change is of crucial importance to the study of global environmental change. Our study showed that in the lower reaches of the Luan River, the landscape patches become more fragmented as the landscape diversity increase. In the three scenarios, most areas would undergo the same change trend, but there would be two different hotspot areas, including the YX and the middle area of the study area. In the YX, the built-up area would become more and more generated without any ecological constrictions. The YX is half cultivated land and half forestry area and in the middle along the river, the built-up area would expand. Further, the area that is grassland, water area and forestry area would change. Another hotspot area is the LR in the south of Chengde City. The forestry area there would expand and generate around the river. The landscape pattern index would change much more than in other places just like the NP, PD, and LSI would decline more than 60% and the AI would move up about 13.75%.
The overall trend of land use type area change based on the natural development scenario in this area is consistent with most studies, and the only difference is that the cultivated land area showed a declining trend, which was different from other places [7,72,77]. The changing trend was the same as other studies done in this area [78]. This is due to the continuous improvement of China’s urbanization and the gradual transition from focusing only on economic development to environmental considerations. Despite certain policies, built-up expansion has come at the expense of cultivated land and grassland [74]. Compared with Li’s study, the hotspot of construction land is from urban areas to the rural regions [74].
4.3. Availability of an Integrated Method
It is obvious that no single model could obtain the main processes to identify land use change and to make an overall evaluation of environmental variables and influences [79]. The FLUS model is a relatively new prediction model, which has been applied in this field [35]. Its validity has also been verified. Finally, the general simulation results obtained here are reasonable and consistent with those of the Ying Li [74]. Although there were some uncertainties in our research, they did not prevent us from achieving our research goals. In order to overcome the deficiency and uncertainty of landscape simulation, in the future, we will improve the parameter selection such the pollution footprint, according to the activities carried out in the area, and/or the population. We will also consider the consumption of water, energy, and other resources, the pressure on natural resources, and so forth. More work is required to develop overall land planning as much as possible in the future.
5. Conclusions
Quantitatively, cultivated land will decrease while the forest areas will increase, and water area will remain stable under all three scenarios tested in this study. Nevertheless, future land demand varies among the different scenarios. Built-up areas will increase quickly in the natural scenario, forest expansion and accumulation will be the main features of land use changes in the ecological scenario and both features appear in the sustainable scenario.
Regarding spatial patterns, the distributions of different land use have a similar developing trend, which will converge in order to enhance both the economy and ecosystem services. There will be more cultivated land in the north and east in the natural scenario and forest areas will increase in the northern middle area, while built-up areas will expand sharply. There will be more forest and grassland and less cultivated land in the north and middle of the watershed in the ecological scenario and the built-up area will decline in the south. In the sustainable scenario, cultivated land will be generated in south of Chengde City while forest areas will increase in the south of that area, and the built-up area will expand slowly along the main stream of the Luan river near the Wulie River and Laoniu River basins.
Comparing the landscape patterns of the different scenarios, the ecological scenario has smaller landscape patches, smaller patch density, and a more natural environment, but simple landscape patterns. However, the ecological scenario will get more generated and would have complex landscape patterns.
Our findings indicate that the study area will experience rapid urbanization in the future, becoming 50.62% larger than the built-up area in 2010. All in all, it can be stated that rapid population growth, city expansion, and infrastructure construction will greatly increase land requirements, and most likely, unused land and grassland will be used for this purpose [77]. At the same time, the forest area will expand in each scenario, mainly because of the implementation of the “Grain to Green Project”.
Our findings suggest that only with strict implementation of environmental policy will the ecological scenario be possible, though it would provide higher benefits in total. This scenario is suitable only for environmental development, but choosing it may result in food security problems due to a decline in cultivated areas, so the government should consider this when developing the implementing land use plans.
Author Contributions
X.X. conceived, designed, and performed the experiments; M.G. and H.J. analyzed the data; L.W. contributed materials and analysis tools; X.X. and M.G. wrote the paper. All authors reviewed the manuscript.
Funding
This research was funded by The National Key R&D Program of China, grant number 2017YFA0604902; the National Key Research and Development Program of China, grant number 2017ZX07301-001-03; the Foundation for Innovative Research Groups of the National Natural Science Foundation of China, grant number 41621061; and the Project Supported by State Key Laboratory of Earth Surface Processes and Resource Ecology.
Acknowledgments
We would like to thank Lei Duan (Tsinghua University) and Yongmei Huang (Beijing Normal University) for Their comments and discussions regarding an earlier draft of this paper. Thanks to the Data Center for Resources and Environmental Sciences, Chinese Academy of Sciences, which provided much data, and Li Xia’s team for improving the simulation model.
Conflicts of Interest
There is no conflict of interest. The founding sponsors had no role in the design of the study; in the collection, analyses, or interpretation of data; in the writing of the manuscript; and in the decision to publish the results.
References
- Jiang, L.; Cui, X.; Xu, X.; Jiang, Y.; Rounsevell, M.; Murray-Rust, D.; Liu, Y. A simple global food system model. Agric. Econ. 2014, 60, 188–197. [Google Scholar] [CrossRef] [Green Version]
- Verburg, P.H.; Overmars, K.P. Combining top-down and bottom-up dynamics in land use modeling: Exploring the future of abandoned farmlands in Europe with the Dyna-CLUE model. Landsc. Ecol. 2009, 24, 1167–1181. [Google Scholar] [CrossRef]
- Mooney, H.A.; Duraiappah, A.; Larigauderie, A. Evolution of natural and social science interactions in global change research programs. Proc. Natl. Acad. Sci. USA 2013, 110, 3665–3672. [Google Scholar] [CrossRef] [Green Version]
- Xu, X.; Gao, Q.; Peng, C.; Cui, X.; Liu, Y.; Jiang, L. Integrating global socio-economic influences into a regional land use change model for China. Front. Earth Sci. 2014, 8, 81–92. [Google Scholar] [CrossRef]
- Jiang, H.; Xu, X.; Guan, M.; Wang, L.; Huang, Y.; Liu, Y. Simulation of Spatiotemporal Land Use Changes for Integrated Model of Socioeconomic and Ecological Processes in China. Sustainability 2019, 11, 3627. [Google Scholar] [CrossRef]
- Metzger, M.J.; Rounsevell, M.D.A.; Acosta-Michlik, L.; Leemans, R.; Schröter, D. The vulnerability of ecosystem services to land use change. Agric. Ecosyst. Environ. 2006, 114, 69–85. [Google Scholar] [CrossRef]
- Samie, A.; Deng, X.; Jia, S.; Chen, D. Scenario-Based Simulation on Dynamics of Land-Use-Land-Cover Change in Punjab Province, Pakistan. Sustainability 2017, 9, 1285. [Google Scholar] [CrossRef]
- Erfu, D.A.I.; Liang, M.A. Review on land change modeling approaches. Prog. Geogr. 2018, 37, 152–162. [Google Scholar]
- Turner, B.L.; Lambin, E.F.; Reenberg, A. The emergence of land change science for global environmental change and sustainability. Proc. Natl. Acad. Sci. USA 2007, 104, 20666–20671. [Google Scholar] [CrossRef] [Green Version]
- Lambin, E.F.; Geist, H.J. Land-Use and Land-Cover Change: Local Processes and Global Impacts; Springer: Berlin/Heidelberg, Germany, 2005. [Google Scholar]
- Ding, L.; Yueqing, X.; Xiaomei, S.; Jing, W. Advnces and prospects of spatial optimal allocation of land use. Prog. Geogr. 2009, 28, 791–797. [Google Scholar]
- Rounsevell, M.D.A.; Pedroli, B.; Erb, K.H.; Gramberger, M.; Busck, A.G.; Haberl, H.; Kristensen, S.; Kuemmerle, T.; Lavorel, S.; Lindner, M.; et al. Challenges for land system science. Land Use Policy 2012, 29, 899–910. [Google Scholar] [CrossRef]
- Wang, R.C.; Derdouri, A.; Murayama, Y. Spatiotemporal Simulation of Future Land Use/Cover Change Scenarios in the Tokyo Metropolitan Area. Sustainability 2018, 10, 2056. [Google Scholar] [CrossRef]
- Debonne, N.; van Vliet, J.; Heinimann, A.; Verburg, P. Representing large-scale land acquisitions in land use change scenarios for the Lao PDR. Reg. Environ. Chang. 2018, 18, 1857–1869. [Google Scholar] [CrossRef] [Green Version]
- Xu, F.; Ge, Y.; Ma, J. Application the Linear Programme to Calculate Water Environmental Capacity. J. Water Resour. Water Eng. 2009, 20, 180–183. [Google Scholar]
- Aerts, J.C.J.H.; Eisinger, E.; Heuvelink, G.B.M.; Stewart, T.J. Using Linear Integer Programming for Multi-Site Land-Use Allocation. Geogr. Anal. 2003, 35, 148–169. [Google Scholar] [CrossRef]
- Aerts, J.; Herwijnen, M.V.; Janssen, R.; Stewart, T. Evaluating Spatial Design Techniques for Solving Land-use Allocation Problems. J. Environ. Plan. Manag. 2005, 48, 121–142. [Google Scholar] [CrossRef] [Green Version]
- Guo, H.C.; Huang, G.H.; Zou, R.; Xu, Y.L.; Liu, L. An inexact multiobjective programming method and its application in the watershed environmental system planning—Environmental system planning of the Lake Erhai Basin. China Environ. Sci. 1999, 19, 33–37. [Google Scholar]
- Cao, K.; Huang, B.; Wang, S.; Lin, H. Sustainable land use optimization using Boundary-based Fast Genetic Algorithm. Comput. Environ. Urban Syst. 2012, 36, 257–269. [Google Scholar] [CrossRef]
- Stewart, T.J.; Janssen, R. A multiobjective GIS-based land use planning algorithm. Comput. Environ. Urban Syst. 2014, 46, 25–34. [Google Scholar] [CrossRef]
- Stewart, T.J.; Janssen, R.; Herwijnen, M.V. A genetic algorithm approach to multiobjective land use planning. Comput. Oper. Res. 2004, 31, 2293–2313. [Google Scholar] [CrossRef]
- Yu, Y.J.; Guo, H.C.; Liu, Y.; Huang, K.; Wang, Z. On the progress in urban ecosystem dynamic modeling. Acta Ecol. Sin. 2007, 27, 2603–2614. [Google Scholar]
- Liu, X.; Ou, J.; Li, X.; Ai, B. Combining system dynamics and hybrid particle swarm optimization for land use allocation. Ecol. Model. 2013, 257, 11–24. [Google Scholar] [CrossRef]
- Mashayekhi, A.N. Rangelands destruction under population growth: The case of Iran. Syst. Dyn. Rev. 1990, 6, 167–193. [Google Scholar] [CrossRef]
- Janssen, R.; Herwijnen, M.V.; Stewart, T.J.; Aerts, J.C.J.H. Multiobjective decision support for land-use planning. Environ. Plan. B Plan. Des. 2008, 35, 740–756. [Google Scholar] [CrossRef]
- Liu, J.; Li, S.; Ouyang, Z.; Tam, C.; Chen, X. Ecological and socioeconomic effects of China’s policies for ecosystem services. Proc. Natl. Acad. Sci. USA 2008, 105, 9477–9482. [Google Scholar] [CrossRef]
- Parker, D.; Manson, S.; Janssen, M.; Hoffmann, M.; Deadman, P. Multi-Agent Systems for the Simulation of Land-Use and Land-Cover Change: A Review. Ann. Assoc. Am. Geogr. 2003, 93, 314–337. [Google Scholar] [CrossRef] [Green Version]
- Lantman, J.V.S.; Verburg, P.H.; Bregt, A.; Geertman, S. Core Principles and Concepts in Land-Use Modelling: A Literature Review; Springer: Dordrecht, The Netherlands, 2011. [Google Scholar]
- Fujita, M.; Krugman, P.; Mori, T. On the evolution of hierarchical urban systems 1. Eur. Econ. Rev. 1999, 43, 209–251. [Google Scholar] [CrossRef]
- Naboureh, A.; Rezaei Moghaddam, M.H.; Feizizadeh, B.; Blaschke, T. An integrated object-based image analysis and CA-Markov model approach for modeling land use/land cover trends in the Sarab plain. Arab. J. Geosci. 2017, 10, 259. [Google Scholar] [CrossRef]
- Verburg, P.H.; Soepboer, W.; Veldkamp, A.; Limpiada, R.; Espaldon, V.; Mastura, S.S. Modeling the spatial dynamics of regional land use: The CLUE-S model. Environ. Manag. 2002, 30, 391–405. [Google Scholar] [CrossRef]
- Verburg, P.H.; Overmars, K.P.; Huigen, M.G.A.; Groot, W.T.D.; Veldkamp, A. Analysis of the effects of land use change on protected areas in the Philippines. Appl. Geogr. 2006, 26, 153–173. [Google Scholar] [CrossRef]
- Wang, Y.; Li, X.M.; Zhang, Q.; Li, J.F.; Zhou, X.W. Projections of future land use changes: Multiple scenarios -based impacts analysis on ecosystem services for Wuhan city, China. Ecol. Indic. 2018, 94, 430–445. [Google Scholar] [CrossRef]
- Xu, X.; Gao, Q.; Liu, Y.H.; Wang, J.A.; Zhang, Y. Coupling a land use model and an ecosystem model for a crop-pasture zone. Ecol. Model. 2009, 220, 2503–2511. [Google Scholar] [CrossRef]
- Liu, X.; Liang, X.; Li, X.; Xu, X.; Ou, J.; Chen, Y.; Li, S.; Wang, S.; Pei, F. A future land use simulation model (FLUS) for simulating multiple land use scenarios by coupling human and natural effects. Landsc. Urban Plan. 2017, 168, 94–116. [Google Scholar] [CrossRef]
- Pijanowski, B.C.; Alexandridis, K.T.; Müller, D. Modelling urbanization patterns in two diverse regions of the world. J. Land Use Sci. 2006, 1, 83–108. [Google Scholar] [CrossRef]
- Dietzel, C.; Clarke, K.C. Toward Optimal Calibration of the SLEUTH Land Use Change Model. Trans. GIS 2007, 11, 29–45. [Google Scholar] [CrossRef]
- Clarke, K.C.; Gaydos, L.J. Loose-coupling a cellular automaton model and GIS: Long-term urban growth prediction for San Francisco and Washington/Baltimore. Int. J. Geogr. Inf. Sci. 1998, 12, 699–714. [Google Scholar] [CrossRef]
- Sohl, T.L.; Sayler, K.L.; Drummond, M.A.; Loveland, T.R. The FORE-SCE model: A practical approach for projecting land cover change using scenario-based modeling. J. Land Use Sci. 2007, 2, 103–126. [Google Scholar] [CrossRef]
- Pontius, R.G., Jr.; Cornell, J.D.; Hall, C.A. Modeling the spatial pattern of land-use change with GEOMOD2: Application and validation for Costa Rica. Agric. Ecosyst. Environ. 2001, 85, 191–203. [Google Scholar] [CrossRef]
- Nouri, J.; Gharagozlou, A.; Arjmandi, R.; Faryadi, S.; Adl, M. Predicting Urban Land Use Changes Using a CA–Markov Model. Arab. J. Sci. Eng. 2014, 39, 5565–5573. [Google Scholar] [CrossRef]
- Ferchichi, A.; Boulila, W.; Farah, I.R. Reducing uncertainties in land cover change models using sensitivity analysis. Knowl. Inf. Syst. 2017, 55, 719–740. [Google Scholar] [CrossRef]
- Knaapen, J.P.; Scheffer, M.; Harms, B. Estimating habitat isolation in landscape planning. Landsc. Urban Plan. 1992, 23, 1–16. [Google Scholar] [CrossRef]
- Guan, W.B.; Xie, C.H.; Ke Ming, M.A.; Niu, J.Z.; Zhao, Y.T.; Wang, X.L. A vital method for constructing regional ecological security pattern:landscape ecological restoration and rehabilitation. Acta Ecol. Sin. 2003, 23, 64–73. [Google Scholar]
- Gong, J.Z.; Xia, B.C.; Chen, J.F. Dynamic analysis of the Guangzhou landscape eco-security pattern based on 3S technology. Acta Ecol. Sin. 2008, 28, 4323–4333. [Google Scholar]
- Yu, K.J.; Qiao, Q.; Li, D.H.; Yuan, H.; Wang, S.S. Ecological land use in three towns of eastern Beijing: A case study based on landscape security pattern analysis. Chin. J. Appl. Ecol. 2009, 20, 1932. [Google Scholar]
- Zhang, Z.; Liu, S.; Dong, S. Ecological Security Assessment of Yuan River Watershed Based on Landscape Pattern and Soil Erosion. Procedia Environ. Sci. 2010, 2, 613–618. [Google Scholar] [CrossRef] [Green Version]
- Huang, N.; Yang, M.H.; Lin, Z.L.; Yang, D.W.; Huang, Y. Landscape pattern changes of Xiamen coastal zone and their impacts on local ecological security. Chin. J. Ecol. 2012, 31, 3193–3202. [Google Scholar]
- Lambin, E.F.; Geist, H.J. Land-Use and Land-Cover Change. Ambio 2006, 21, 122. [Google Scholar]
- Hu, H.; Liu, W.; Cao, M. Impact of land use and land cover changes on ecosystem services in Menglun, Xishuangbanna, Southwest China. Environ. Monit. Assess. 2008, 146, 147–156. [Google Scholar] [CrossRef]
- De Freitas, M.W.D.; Munoz, P.; dos Santos, J.R.; Alves, D.S. Land use and cover change modelling and scenarios in the Upper Uruguay Basin (Brazil). Ecol. Model. 2018, 384, 128–144. [Google Scholar] [CrossRef]
- Newbold, T. Future effects of climate and land-use change on terrestrial vertebrate community diversity under different scenarios. Proc. R. Soc. B Biol. Sci. 2018, 285, 20180792. [Google Scholar] [CrossRef]
- Shao, J.A.; Dang, Y.F.; Wang, W.; Zhang, S.C. Simulation of future land-use scenarios in the Three Gorges Reservoir Region under the effects of multiple factors. J. Geogr. Sci. 2018, 28, 1907–1932. [Google Scholar]
- Yang, S.Q.; Zhao, W.W.; Liu, Y.X.; Wang, S.; Wang, J.; Zhai, R.J. Influence of land use change on the ecosystem service trade-offs in the ecological restoration area: Dynamics and scenarios in the Yanhe watershed, China. Sci. Total Environ. 2018, 644, 556–566. [Google Scholar] [CrossRef]
- Asadolahi, Z.; Salmanmahiny, A.; Sakieh, Y.; Mirkarimi, S.H.; Baral, H.; Azimi, M. Dynamic trade-off analysis of multiple ecosystem services under land use change scenarios: Towards putting ecosystem services into planning in Iran. Ecol. Complex. 2018, 36, 250–260. [Google Scholar] [CrossRef]
- Feng, J.L.; Zhang, W. The evolution of the modern Luanhe River delta, north China. Geomorphology 1998, 25, 269–278. [Google Scholar] [CrossRef]
- Jowett, A.J. China’s Water Crisis: The Case of Tianjin (Tientsin). Geogr. J. 1986, 152, 9–18. [Google Scholar] [CrossRef]
- Wu, J.; He, C.; Zhang, Q.; Yu, D.; Huang, G.; Huang, Q. Integrative Modeling and Strategic Planning for Regional Sustainability under Climate Change. Adv. Earth Sci. 2014, 29, 1315–1324. [Google Scholar]
- Xinxiao, Y.; Jiangkun, Z.; Yousheng, W. Ecological and Hydrological Responses of Watershed to Human Activities and Climate Change; Science Press: Beijing, China, 2013. [Google Scholar]
- Xiaoliang, S.; Zhiyong, Y.; Denghua, Y.; Ying, L.; Zhe, Y. On hydrological response to land-use /cover change in Luanhe River basin. Adv. Water Sci. 2014, 25, 21–27. [Google Scholar]
- Tian, Y.; Jiang, Y.; Liu, Q.; Dong, M.; Xu, D.; Liu, Y.; Xu, X. Using a water quality index to assess the water quality of the upper and middle streams of the Luanhe River, northern China. Sci. Total Environ. 2019, 667, 142–151. [Google Scholar] [CrossRef]
- Wang, H.; Chen, L.; Yu, X. Distinguishing human and climate influences on streamflow changes in Luan River basin in China. Catena 2016, 136, 182–188. [Google Scholar] [CrossRef]
- National Meteorogical Information Center. Available online: http://data.cma.cn (accessed on 20 March 2015).
- Jenson, S.K. Applications of Hydrologic Information Automatically Extracted From Digital Elevation Models. Hydrol. Process. 2010, 5, 31–44. [Google Scholar] [CrossRef]
- Guidigan, M.L.G.; Sanou, C.L.; Ragatoa, D.S.; Fafa, C.O.; Mishra, V.N. Assessing Land Use/Land Cover Dynamic and Its Impact in Benin Republic Using Land Change Model and CCI-LC Products. Earth Syst. Environ. 2018, 3, 1–11. [Google Scholar] [CrossRef]
- Xu, X.; Gao, Q.; Peng, C.; Cui, X.; Liu, Y.; Jiang, L. A Simple Global Food System Model. Front. Earth Sci. 2014, 8, 81–92. [Google Scholar] [CrossRef]
- Resource and Environment Data Cloud Platform. Available online: http://www.resdc.cn (accessed on 28 May 1990).
- Open Street Map. Available online: https://www.openstreetmap.org (accessed on 8 June 2018).
- McGarigal, K. Landscape Pattern Metrics. In Wiley StatsRef: Statistics Reference Online; John Wiley & Sons, Ltd.: Hoboken, NJ, USA, 2014. [Google Scholar]
- Xie, G.D.; Zhang, C.X.; Zhang, L.M.; Chen, W.H.; Li, S.M. Improvement of the Evaluation Method for Ecosystem Service Value Based on Per Unit Area. J. Nat. Resour. 2015, 30, 1243–1254. [Google Scholar]
- Sahle, M.; Saito, O.; Fürst, C.; Demissew, S.; Yeshitela, K. Future land use management effects on ecosystem services under different scenarios in the Wabe River catchment of Gurage Mountain chain landscape, Ethiopia. Sustain. Sci. 2018, 14, 175–190. [Google Scholar] [CrossRef]
- Zhang, Y.; Wang, P.; Wang, T.; Cai, C.; Li, Z.; Teng, M. Scenarios Simulation of Spatio-Temporal Land Use Changes for Exploring Sustainable Management Strategies. Sustainability 2018, 10, 1013. [Google Scholar] [CrossRef]
- Yirsaw, E.; Wu, W.; Shi, X.P.; Temesgen, H.; Bekele, B. Land Use/Land Cover Change Modeling and the Prediction of Subsequent Changes in Ecosystem Service Values in a Coastal Area of China, the Su-Xi-Chang Region. Sustainability 2017, 9, 1204. [Google Scholar] [CrossRef]
- Ying, L.; Huang, S. Landscape Ecological Risk Responses to Land Use Change in the Luanhe River Basin, China. Sustainability 2015, 7, 16631–16652. [Google Scholar] [Green Version]
- Wang, Y. Estimation and analysis of ecosystem service value in beijing-tianjin-hebei region. Environ. Prot. Circ. Econ. 2017, 37, 50–54. [Google Scholar]
- Wu, J.; Guo, X.; Yang, J.; Qian, G.; Niu, J.; Liang, C.; Zhang, Q.; Li, A. What is sustainablilty science? Chin. J. Appl. Ecol. 2014, 25, 1–11. [Google Scholar]
- Amini Parsa, V.; Salehi, E. Spatio-temporal analysis and simulation pattern of land use/cover changes, case study: Naghadeh, Iran. J. Urban Manag. 2016, 5, 43–51. [Google Scholar] [CrossRef] [Green Version]
- Duan, Y. Study on land use change in chengde city, hebei province. Chin. J. Agric. Resour. Reg. Plan. 2017, 38, 118–123. [Google Scholar]
- Van Vliet, J.; Bregt, A.K.; Hagen-Zanker, A. Revisiting Kappa to account for change in the accuracy assessment of land-use change models. Ecol. Model. 2011, 222, 1367–1375. [Google Scholar] [CrossRef]
Figure 1.
Study area; (a) shows the location and land use structure of the upper and middle streams of the Luan River, northern China in 2015. (b) Shows the topography of the study area and its sub-basins.
Figure 1.
Study area; (a) shows the location and land use structure of the upper and middle streams of the Luan River, northern China in 2015. (b) Shows the topography of the study area and its sub-basins.

Figure 2.
The framework of the method. The spatial allocation part was modified by FLUS [35].
Figure 2.
The framework of the method. The spatial allocation part was modified by FLUS [35].

Figure 3.
Changing percentage under different scenarios compared to year 2010 (unit: %).

Figure 4.
Spatial pattern of land use under different scenarios in the upper and middle streams of the Luan River. (a) shows land use in 2010, (b) shows the spatial pattern of the natural scenario in 2020, (c) shows the spatial pattern of the ecological scenario in 2020 and (d) shows the spatial pattern of the sustainable scenario in 2020.

Figure 5.
Spatial pattern of land use transfer between three scenarios: (a) between the ecological scenario and the natural scenario, where the zoomed layer is the changing hotspot of the built-up area; and(b) between the sustainable scenario and the natural scenario, the zoomed layer is the changing hotspot of cultivated land in decline.

Figure 6.
The change of landscape patterns under different scenarios. Numbers 1 to 10 represents different sub-basins, Xiaoluan River basin (XL,1), Mayitu River basin (MYT, 2), Yixun River basin (YX,3), Wulie River basin (WL, 4), Xingzhou River basin (XZ, 5), Laoniu Rver basin (LN, 6), Liu River basin (LR, 7), Sa River basin (SR, 8), Bao River basin (PR, 9), and the main stream of the Luan River basin (MS, 10). Lines in orange represent the landscape pattern indexes under the natural scenario; the blue under the ecological scenario and the gray under the sustainable scenario.


Table 1.
Landscape patterns indexes of different scenarios.
| LID | NP | PD | LSI | PAFRAC | SHDI | AI |
|---|---|---|---|---|---|---|
| 2010 | 10966 | 0.35 | 76.95 | 1.57 | 1.00 | 74.71 |
| N | 7910 | 0.25 | 60.35 | 1.59 | 0.98 | 80.32 |
| E | 6525 | 0.21 | 65.44 | 1.58 | 0.80 | 78.58 |
| S | 7243 | 0.23 | 57.34 | 1.60 | 0.94 | 81.33 |
Note: N: Natural scenario; E: Ecological scenario; S: Sustainable scenario.
Table 2.
Value under different scenarios.
| Unit:10_8$ | 2010 | Natural Scenario | Ecological Scenario | Sustainable Scenario |
|---|---|---|---|---|
| Values of Ecosystem Eervices | 32.03 | 33.32 | 34.92 | 33.89 |
| Economic Ealues | 102.71 | 108.95 | 87.91 | 104.07 |
| Total Values | 134.74 | 142.27 | 122.83 | 137.97 |
© 2019 by the authors. Licensee MDPI, Basel, Switzerland. This article is an open access article distributed under the terms and conditions of the Creative Commons Attribution (CC BY) license (http://creativecommons.org/licenses/by/4.0/).
Share and Cite
MDPI and ACS Style
Xu, X.; Guan, M.; Jiang, H.; Wang, L. Dynamic Simulation of Land Use Change of the Upper and Middle Streams of the Luan River, Northern China. Sustainability 2019, 11, 4909. https://doi.org/10.3390/su11184909
AMA Style
Xu X, Guan M, Jiang H, Wang L. Dynamic Simulation of Land Use Change of the Upper and Middle Streams of the Luan River, Northern China. Sustainability. 2019; 11(18):4909. https://doi.org/10.3390/su11184909
Chicago/Turabian StyleXu, Xia, Mengxi Guan, Honglei Jiang, and Lingfei Wang. 2019. "Dynamic Simulation of Land Use Change of the Upper and Middle Streams of the Luan River, Northern China" Sustainability 11, no. 18: 4909. https://doi.org/10.3390/su11184909
Note that from the first issue of 2016, this journal uses article numbers instead of page numbers. See further details here.