Do Higher Asymmetry Threshold Effects Exist on the Gold Return Volatility during Highly Fluctuating Periods?

Department of Business Administration, National Taipei University, New Taipei City 23741, Taiwan
*
Author to whom correspondence should be addressed.
Sustainability 2019, 11(18), 4829; https://doi.org/10.3390/su11184829
Submission received: 16 June 2019
/
Revised: 27 July 2019
/
Accepted: 31 July 2019
/
Published: 4 September 2019
(This article belongs to the Special Issue Enterprise Resource Planning (ERP) and Sustainability)
Abstract
:The GJR-GARCH model is frequently used by researchers and academic institutions. However, the model conveys limited information, using zero as a threshold without considering other possible thresholds. This study shows that a favorable econometric model could be formed by constructing a hybrid momentum HMTAR-GARCH model. Our findings indicate that higher asymmetry momentum threshold effects exist on the gold return volatility during highly fluctuating periods. Sustainable Enterprise Resource Planning (S-ERP) systems could help in the formation of a good risk management strategy by using the HMTAR-GARCH model. Perhaps gold is more sustainable than many other financial assets in the creation of an investment portfolio.
1. Introduction
Gold is an underlying asset in which volatility is an important factor for option pricing. The issue of gold return volatility has been empirically discussed. There have been many insightful investigations published previously that use various sorts of econometric models to study the gold return volatility and the asymmetric effect of positive and negative shocks [1,2,3,4,5].
The core idea of sustainable investing has two elements. Firstly, it has value in helping investors to spot reputational risk threat and offset such a risk in advance. Secondly, it is an economic moat helping investors to identify what makes a company sustainable in the financial sense, leading to strong brands and healthy end-markets. If investors concern themselves with long-term future trends, the sustainable invest rating can help them to decide whether or not the investment target is worth the long-term investment and whether it will provide stable profits. Investors should definitely consider the target of sustainable investing, ethical investing, or socially responsible investing [6,7,8].
Only in an efficient market would the price of gold momentarily adjust and completely reflect the new information. As such, no tendency of future increases and decreases is predicted [3,5]. Sustainable Enterprise Resource Planning (S-ERP) systems could be a robust multi-function platform providing real-time and integration services and finding the most up-to-the-minute information available on trading metrics throughout the trading day [9,10,11,12,13]. Based on the principle of diversification, a multiple-asset portfolio has almost no unsystematic risk. Gold is known as the anti-complex asset. It could be the safe haven or hedge asset in times of an unstable economy or a highly adverse environment. During market fluctuation periods, it might be a good time to invest in the gold market [2,4,14]. In this context, we conclude that gold is more sustainable than many other financial assets in an investment portfolio. Figure 1 shows the evolution of the price of gold over a 40 year sample period.
ARCH-GARCH (autoregressive conditional heteroskedasticity - generalized autoregressive conditional heteroskedasticity) models are applied to account for empirical nonlinear time-series properties of gold return. Furthermore, the GJR (Glosten-Jagannathan-Runkle) -GARCH model has been widely applied to determine the asymmetric effects of positive or negative shocks to conditional volatility in financial research. The GJR-GARCH model uses the positive or negative previous residual term as a threshold to measure the asymmetric effect due to innovation shocks. The difference between the GARCH (p,q) and GJR-GARCH (p,q) models is the additional assumption that all leverage terms are equal to zero. However, using zero as a cut-off threshold in general does not guarantee an overall optimization fit in empirical estimation, according to the abovementioned studies [1,15,16,17].
The GARCH model can capture thick-tailed returns and volatility clustering. However, neither the ARCH model, which examines variance or volatility clustering, nor the GARCH model, which examines the dependence on the forecast variance of the previous period, can capture volatility asymmetry. To further account for the asymmetric and steepness asymmetric effects of the inter-period gold return’s change and volatility, the threshold autoregressive (TAR) and the momentum threshold autoregressive (MTAR or momentum TAR) econometric models could be jointly applied with the GARCH model [18,19,20].
The TAR and MTAR econometric models have been well documented as tools for measuring the asymmetric and nonlinear phenomenon in time-series analyses. However, in most cases both models are estimated separately, resulting in unbiased but inefficient estimators. The TAR dummy variable could measure asymmetric effects due to past residual shocks to the system, while the MTAR dummy variable tries to capture residual difference effects for measuring the incremental momentum (nonlinearity) during a highly volatile period. This paper thus proposes a hybrid integrated mean equation so that both asymmetric and nonlinear properties can be measured simultaneously [21,22,23].
Therefore, this paper proposes a hybrid momentum TAR/MTAR-GARCH (HMTAR-GARCH) model to explore a better functional fit in empirical estimation. A new programming algorithm is proposed for simulating two random thresholds for both TAR and MTAR components in the equations of mean and variance simultaneously. The paper also aims to investigate the gold return volatility in the following circumstances. First, the gold return volatility is greater during the financial tsunami period (i.e., extreme market conditions) than the non-financial tsunami period. Second, the effect on gold return volatility is greater whenever the lagged residual falls below its threshold during the financial tsunami period (TAR effect). Third, the effect on gold return volatility is greater whenever the first differencing of the lagged residual falls below its momentum threshold during the financial tsunami period (MTAR effect). Forth, the MTAR effect is even stronger than the TAR effect on gold return volatility.
2. Materials and Methods
2.1. Hypotheses and Data Set
Baur [2] tested the asymmetric volatility of gold return in the GJR-GARCH model framework and indicated that the gold returns exhibit highly significant ARCH, GARCH, and asymmetric effects. The unexpected negative market shocks tend to increase the gold return volatility. In addition, Enders and Siklos [21] found that TAR and MTAR econometric models could test for the presence of nonlinear adjustment and have good power. We assessed whether a higher asymmetry momentum threshold has an effect on the gold return volatility during highly fluctuating periods.
Based on the arguments of [2,21] and our intuition, the following hypotheses on the gold return volatility were tested within GARCH, GJR-GARCH, and HMTAR-GARCH models:
Hypothesis 1.
The gold return volatility is greater during the financial tsunami period (i.e., extreme market conditions) than the non-financial tsunami period (i.e., a stable or tranquil regime).
Hypothesis 2.
The effect of gold return volatility is greater whenever the lagged residual falls below its threshold during the financial tsunami period (TAR effect).
Hypothesis 3.
The effect of gold return volatility is greater whenever the first differencing of lagged residual falls below its momentum threshold during the financial tsunami period (MTAR effect).
Hypothesis 4.
The MTAR effect is even stronger than the TAR effect on gold return volatility during the financial tsunami period.
The main variable in this study is the gold return (RET), which is equal to the natural log of gold price at time t divided by gold price at time t−1, i.e., .
Daily gold spot prices in US$ were obtained through Bloomberg.com over the period of 3 January 2000 to 30 December 2016, including a total of 4432 observations. The sample period covers the extreme market conditions of the financial tsunami period in gold prices and uses balanced sampling. Following [2], we used a financial tsunami period from 1 August 2007 to 31 December 2008. The financial tsunami timeline was provided by the Federal Reserve Board of St. Louis (Fed) and the Bank for International Settlements (BIS). Furthermore, the Chow test was applied to test and confirm the structural break existing during the financial tsunami period [24,25].
2.2. Linear and Nonlinear Unit Root Tests
Many economic and financial time series exhibit trending behavior or non-stationarity in the mean. This paper tested the stationary time series by applying the augmented Dickey–Fuller (ADF) test [26,27], the Phillips–Perron (PP) test [28], the Kwiatkowski–Phillips–Schmidt–Shin (KPSS) test [29] and the Kapetanios–Shin–Snell (KSS) test [30]. The ADF test’s regression includes lags of the first differences of , and its three models are expressed in the following forms:
where t is the time index, α is an intercept constant called a drift, is the coefficient on a time trend, is the coefficient presenting the process root, i.e., the focus of testing, k is the lag order of the first-differences autoregressive process, and is an independent identically distributed residual term.
Model (1) is a pure random walk with the lag terms. Model (2) possesses a drift. Model (3) includes a drift and a time trend. The null hypothesis for the ADF test is: : = 0, with the alternative : −2 < < 0. The ADF t-test statistic is /se().
The PP test differs from the ADF test mainly in how it deals with serial correlation and heteroscedasticity in the error term. The PP test does not require the specification of the form of the serial correlation of under the null, or require that the errors be conditionally homoscedastic. The KPSS tests are intended to complement ADF and PP unit root tests, for obtaining consistent estimates in unit root tests. In addition, the KSS nonlinear unit test is applied since the above linear unit root tests might suffer from important power distortions in the presence of nonlinearities in the data generating process [26,27,28,29,30].
2.3. Traditional TAR and MTAR Models
Testing for the long-run relationship between the gold return of current and previous trading days, this study utilized the threshold co-integration techniques proposed by [19,21,31]. The techniques comprise two tests, the TAR and MTAR models, given as follows:
where and are co-integrated variables, is a white noise residual term, and , , and represent regression coefficients. Finally, is an indicator function such that is an unknown threshold to be simulated:
As an alternative adjustment process, the MTAR model, by using first differencing of the residual series, presents as follows:
Traditionally, Equations (4) and (5) and Equations (4) and (7) are estimated separately. It could be shown that by omitting important variables, separate estimation would result in unbiased but inefficient estimators. Thus, by combining Equations (4), (5), and (7), a hybrid TAR and MTAR model could be specified in the next section.
2.4. The HMTAR-GARCH Model
The mean and variance equations are proposed as follows [17,22]. The TAR coefficients and measure the asymmetric threshold impacts while observing previous innovative shocks. The MTAR coefficients and , which are the lagged residual differencing effect, demonstrate the tendency of nonlinear reaction during a volatile time period. The inclusion of lagged dependent variable terms might mitigate autocorrelation problems and trend the residuals toward a white noise process:
where
is the residual of the time series, is the innovation,
- , , , .
- is the dummy of the financial tsunami period.
The combination of TAR, MTAR, and GARCH is applied in gold return volatility forecasting. The GARCH model is useful for modeling the volatility characteristics, while TAR and MTAR reflect the two thresholds and are used to capture the historical residual shock feedback effects derived from the inter-period change of gold return and gold return volatility, especially sharp movements. Consequently, the HMTAR-GARCH model might be flexible enough to represent the intrinsic threshold structure of the gold return volatility time series.
Notice that if , Equations (9) and (10) are similar to the GJR-GARCH model. All proposed models are estimated using the Maximum Likelihood Estimation method with the BHHH (Berndt–Hall–Hall–Hausman) optimization algorithm based on [31].
To test hypothesis 1, we tested whether the volatility of gold return in the financial tsunami period was greater than the volatility of gold return in the stable or tranquil regime (i.e., and statistically significant). To test hypotheses 2 (TAR effect), we tested whether the effect on gold return volatility would be greater whenever the lagged residual falls below its threshold (i.e., ) during the financial tsunami period (i.e., and statistically significant). Then to test hypotheses 3 (MTAR effect), we tested whether the effect on gold return volatility would be greater whenever the first differencing of lagged residual falls below its momentum threshold (i.e., ) during the financial tsunami period (i.e., and statistically significant).
Finally, to test hypothesis 4, we tested whether the MTAR effect is even stronger than the TAR effect on gold return volatility during the financial tsunami period (i.e., and statistically significant). Another way to test hypothesis 4 is known as the Wald test, used to verify the joint significance alternatives of , which is the total volatility effect of TAR and MTAR during the financial tsunami period. Furthermore, the Ljung-Box test was applied to test and perform the residual diagnostic for each model [32].
2.5. The HMTAR-GARCH Estimation Algorithm
Traditionally, Chan’s method [33] has been adopted to identify a single optimal threshold either in the TAR or MTAR model. This study modified Chan’s method to estimate two random thresholds simultaneously. The intrinsic problem of Chan’s method is that because the estimated residuals can be very close, they could result in over-simulation. Thus, this study designed a new grid search algorithm, as described the following section.
2.5.1. Estimating the GJR-GARCH model
Use Equations (9) and (10), and obtain residual series Find the maximum and minimum values of and as maxE, minE, maxDE, and minDE, respectively. Then, the HMTAR-GARCH model is applied for searching optimal double thresholds. In order to avoid extreme thresholds, multiply these four residual series by 70%. In practice, only the middle 70% of these series is tested for the threshold. The reason for this restriction is to keep an adequate amount of observations on each regime when estimating the threshold and the other parameters in the threshold-GARCH model [8,16,17,19].
2.5.2. Setting Double Thresholds Searching Intervals
Find the threshold increments of INC1 and INC2 by using (maxE−minE)/k for the TAR threshold () and (maxDE−minDE)/k for the MTAR threshold (), where “k” is simulating from 5 through 13, respectively. The improvement of result is limited when the values of k is higher than 11. Therefore, this study sets the parameter “k” equal to 11.
2.5.3. Finding Optimal Double Thresholds
Design a three-layered do-loop procedure of a searching algorithm and embed the estimation within the do-loop using RATS econometrics software programming language.
The first layer controls the threshold increments. The threshold increments, INC1 and INC2, are narrowed down to half distances on the next run. Based on the minimum Akaike information criterion (AIC) and Schwarz’s Bayesian criterion (SBC), as well as the maximum log-likelihood, the second and third layers in searching algorithm were designed for improving potential thresholds (i.e., and ). The best thresholds re kept each time until the end of the simulation [17,19,31,33].
3. Results
The sample in this study was the daily data from 3 January 2000 to 30 December 2016, and thus contains the low-volatility period as well as the high-volatility period [2,3,4,5]. In order to observe the variation of the gold return (RET) in different sorts of periods, the original time-series data set was divided into three periods (pre-financial tsunami, financial tsunami, and post-financial tsunami), as shown in Table 1.
Table 2 reports a summary of RET descriptive statistics over each sample period. During the financial tsunami period, the RET, in contrast to other periods, obviously displays a larger dispersion, ranging from a high of 10.7883 to a low of −6.9149, with a mean of 0.0921. The mean value is positive and approaches zero over time. These statistics are similar to other financial markets’ performance, with a standard deviation larger than the mean.
Furthermore, Table 3 reports a summary of statistics of the structural break test between the financial tsunami period and the non-financial tsunami period. The coefficient (=0.0732) is significantly positive, while the t-statistic of Chow test are significant at less than the 5% implying the beta difference between financial tsunami and non-financial tsunami periods. The total gold return volatility effect would be 0.0338 (i.e., ) during the financial tsunami period. This indicates the structural break exists during the financial tsunami periods [24,25].
The mean model extended from Equation (9) is as follows:
where is the dummy of the financial tsunami period.
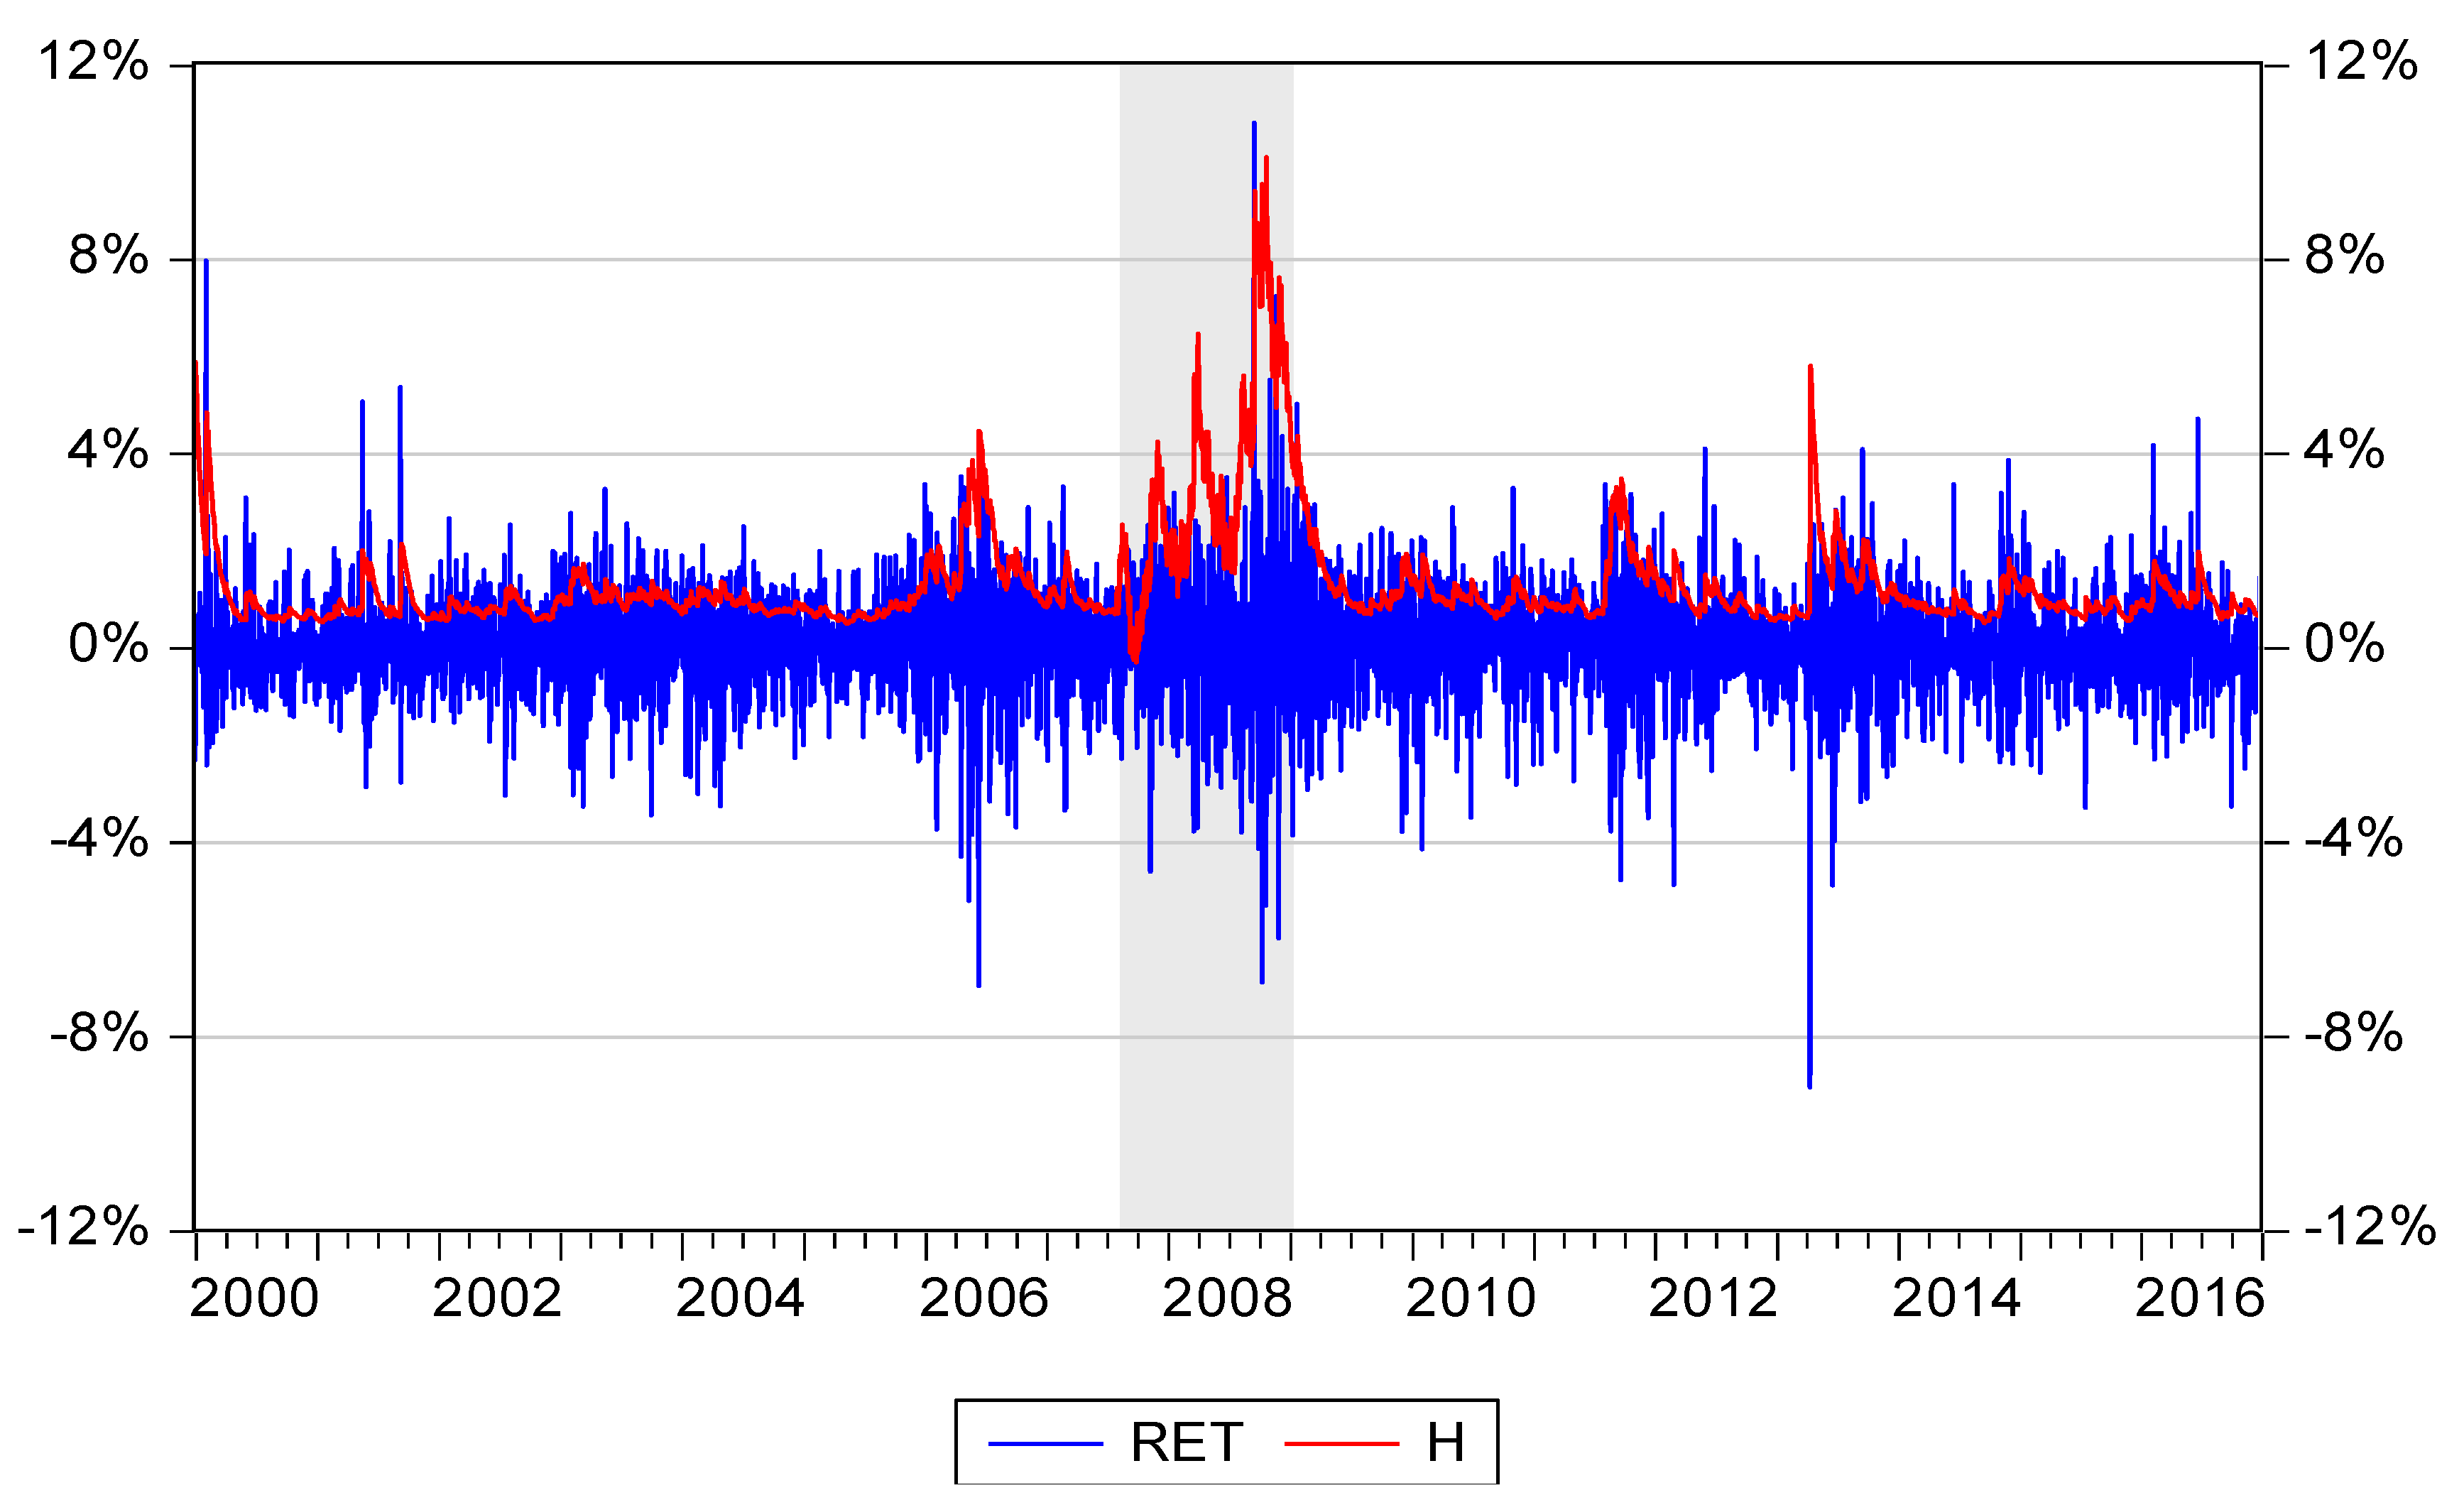
Figure 2 illustrates the daily gold return (RET) denominated in US$ over a 17 year period. Figure 3 shows the daily conditional volatility HMTAR-GARCH (1, 1) estimates of the gold return (H) denominated in US$ over a 17 year period. Figure 4 illustrates the gold return (RET) and the daily conditional volatility HMTAR-GARCH (1, 1) estimates of the gold return (H) denominated in US$ over a 17 year period.
As many financial variables are not stationary or are not residual stationary of regression and may lead to spurious regression, the ADF, PP, KPSS, and KSS unit root tests were conducted for the level of gold prices (GP) and the RET [26,27,28,29,30]. Table 4 shows the results of the ADF, PP, KPSS and KSS tests and concludes that GP is non-stationary.
Furthermore, Table 5 shows the results of the ADF, PP, KPSS and KSS tests and concludes that RET is stationary.
The presence of ARCH (autoregressive conditional heteroscedasticity) effects in the residuals was also checked. The test statistic is highly significant, as shown in Table 6, proving the existence of ARCH effects [19,21].
For comparison purposes, three models are proposed. Model 1 is the GARCH model without a threshold. Model 2 is GJR-GARCH (1,1), which is similar to the model with the TAR threshold () and the MTAR threshold () set to zero. Model 3 is the HMTAR-GARCH model, with random thresholds and .
Table 7 illustrates the results of our estimations between the gold return of current and previous trading days and demonstrates that the HMTAR-GARCH (1,1) model has the best minimum AIC, SBC, and maximum log-likelihood. In other words, Model 3 is better than Model 1 and Model 2. Table 7 also confirms the notion that a hybrid random threshold model might be superior to a zero threshold model.
Table 7 also provides the residual diagnostic and the p-values of the Ljung–Box test of autocorrelation in the standardized residuals with 5, 10, and 20 lags [32]. For all series, the null hypothesis of no autocorrelation left cannot be rejected at the 5% level, indicating that the HMTAR-GARCH specifications are successful in modeling the serial correlation in the conditional mean and variance. In addition, the four hypotheses of the study were verified as follows.
First, in the HMTAR-GARCH model, the coefficient of ) is positive and highly significant, showing that the gold return volatility is greater during the financial tsunami period (i.e., extreme market conditions) than the stable or tranquil regime.
Second, the coefficient (=−0.4359) is significantly negative, revealing that the effect on gold return volatility would be greater whenever the lagged residual falls below its threshold (=−0.8261) during the financial tsunami period. The gold return volatility model exhibits the TAR effect during a highly volatile period.
Third, the coefficient (=−0.7068) is significantly negative, denoting that the effect on gold return volatility would be greater whenever the first differencing of lagged residual falls below its momentum threshold during the financial tsunami period. This might imply that unexpected negative market shocks would tend to increase the gold return volatility. The gold return volatility model exhibits the MTAR effect during a highly volatile period.
Forth, to test whether the MTAR effect is even stronger than TAR effect (), the Wald Chi-square statistics for alternative H4a: is 3.0197 (p-value = 0.0411); and for alternative H4b: is 5.3393 (p-value = 0.0104), demonstrating statistically significant results. This might suggest that the MTAR dummy variable has a substantially greater impact on the conditional variance during the financial tsunami period and the MTAR specification could capture residual difference effects for measuring the incremental momentum (nonlinearity) during a highly volatile period.
Finally, the total TAR volatility effect would be −0.3530 (i.e., ) and the total MTAR volatility effect would be −0.7148 (i.e., ) during the financial tsunami period. By comparing the total volatility effects of both TAR and MTAR, this might imply that unexpected negative first difference in market shocks would tend to increase the gold return volatility even stronger.
The HMTAR-GARCH model is superior to the GJR-GARCH model and could better capture the asymmetric and nonlinear natures of gold return volatility. The empirical findings might contribute to gold return volatility forecasting for accurate hedging and arbitrage decisions, especially during severe market fluctuation periods. Traders of derivatives can be categorized three types: hedgers, speculators, or arbitrageurs. Hedgers and speculators are either betting a gold price that will go up or betting a gold price that will go down. Arbitrage involves locking in a riskless profit by entering simultaneously transactions in two or more markets including spot and future gold markets. Therefore, gold dealers, traders, and manufacturers could make better hedging and investing decisions by adopting the HMTAR-GARCH model into the risk management module of S-ERP systems [6,7,9,10,11,12,13,20].
On the other hand, this study estimated the TAR threshold () and the MTAR threshold () directly with other parameters instead of searching for each value (not reported here). The coefficients of the and are large and outside of the reasonable boundary. The result of the estimates does not match the practice of the gold market. A single optimal threshold either in the TAR or MTAR model is identified using Chan’s method. Chan [33] set the reasonable boundary and used the searching method to estimate or , constraining the feasible solutions over the possible range. Based on [33], this study modified and designed a new grid search algorithm not only to estimate two random thresholds ( and ) but also to improve the problem of over-estimated residuals.
Additionally, this study obtained alternative data from Reuters.com, which has daily gold spot prices from 3 January 2000 to 30 December 2016, including a total of 4427 observations. The results for the robustness test, given in Table 8, confirm the hypothesis above. Table 8 also provides the residual diagnostic and the p-values of the Ljung–Box test of autocorrelation in the standardized residuals with 5, 10, and 20 lags [32]. For all series, the null hypothesis of no autocorrelation left cannot be rejected at the 5% level, indicating that the HMTAR-GARCH specifications are successful in modeling the serial correlation in the conditional mean and variance.
4. Discussion and Conclusions
The contribution of this paper is its combination of TAR, MTAR, and GARCH for gold return volatility forecasting. This was a novel attempt to construct a hybrid momentum TAR/MTAR-GARCH econometric model by studying the gold return prediction and examining two issues. One issue was to integrate TAR and MTAR dummy interaction terms in the mean and variance equations to avoid a econometric problem of model misspecification, and the other was to expand the traditional GJR-GARCH model by designing two random thresholds for the TAR and MTAR components in the variance equation so that random threshold values other than zero could be traced. The algorithm for simulating two random thresholds was proposed and tested.
By estimating asymmetric threshold parameters, the HMTAR-GARCH model has more explanatory power than the GJR-GARCH model. Four major hypothetical tests were verified. First, the gold return volatility was found to be greater during the financial tsunami period (i.e., extreme market conditions) than non-financial tsunami period. Second, it was confirmed that the effect on gold return volatility would be greater whenever the lagged residual falls below its threshold during the financial tsunami period. Third, it was confirmed that the effect on gold return volatility would be greater whenever the first differencing of lagged residual falls below its momentum threshold during the financial tsunami period. Finally, it was shown that the MTAR effect is even stronger than the TAR effect during the financial tsunami period.
Our findings suggest that whenever there is a downtrend in the market, traders could earn extra profits by simultaneously holding a long position in the underlying gold spot and a short position in the gold options, futures, Exchange Traded Funds (ETFs), or other derivatives. Taken together, the above results demonstrate that our new HMTAR-GARCH model is superior to the GJR-GARCH model and can better capture the asymmetric and nonlinear natures of gold return volatility. The empirical findings contribute to gold return volatility forecasting for accurate hedging and arbitrage decisions, especially during severe market fluctuation periods.
On the financial market, the HMTAR-GARCH model helps dealers and traders make better speculation and arbitrage trading decisions, concerning options and futures, ETFs, etc. In terms of the physical gold demand and supply, the HMTAR-GARCH model could enable customers and suppliers to establish better hedging decisions to gain non-operating income from the financial trades, such as through total global jewelry fabrication and consumption, retail investment, industrial fabrication, government official sector, and mine production and scrap. Gold dealers, traders, and manufacturers could make better hedging and investing decisions by adopting the HMTAR-GARCH model into the risk management module of S-ERP systems.
Author Contributions
Y.H.L. prepared for the data collection, analyzing the data and writing of this study and Y.J.G. mainly organized and highlighted the central themes of this article.
Funding
This research received no external funding.
Acknowledgments
We thank Melinda Chen for data support and Professors Gwo-Hshiung Tzeng, Me-Chen Lin, Iee-Fung Wu and Shu-Kung Hu for encouraging technical development. Further, we thank the referees and editors for helpful comments and suggestions.
Conflicts of Interest
The authors declare no conflict of interest.
References
- Amendola, A.; Candila, V.; Gallo, G.M. On the asymmetric impact of macro–variables on volatility. Econ. Model. 2019, 76, 135–152. [Google Scholar] [CrossRef]
- Baur, D. The Structure and Degree of Dependence: A Quantile Regression Approach. J. Bank. Financ. 2013, 37, 786–798. [Google Scholar] [CrossRef]
- Baur, D.; Dimpfl, T.; Kuck, K. Bitcoin, gold and the US dollar—A replication and extension. Financ. Res. Lett. 2018, 25, 103–110. [Google Scholar] [CrossRef]
- Baur, D.; Kuck, K. The timing of the flight to gold: An intra-day analysis of gold and the S&P500. Financ. Res. Lett. 2019. [Google Scholar] [CrossRef]
- Baur, D.; McDermott, T. Is gold a safe haven? International evidence. J. Bank. Financ. 2010, 34, 1886–1898. [Google Scholar] [CrossRef]
- Chowdhry, B.; Davies, S.; Waters, B. Investing for Impact. Rev. Financ. Stud. 2019, 32, 864–904. [Google Scholar] [CrossRef]
- Dyck, A.; Lins, K.; Roth, L.; Wagner, H. Do Institutional Investors Drive Corporate Social Responsibility? International Evidence. J. Financ. Econ. 2019, 131, 693–714. [Google Scholar] [CrossRef]
- Ma, X.; Yang, R.; Zou, D.; Liu, R. Measuring Extreme Risk of Sustainable Financial System Using GJR-GARCH Model Trading Data-Based. Int. J. Inf. Manag. 2019. [Google Scholar] [CrossRef]
- Chofreh, A.G.; Goni, F.A.; Klemes, J.J. A roadmap for Sustainable Enterprise Resource Planning systems implementation (part III). J. Clean. Prod. 2018, 174, 1325–1337. [Google Scholar] [CrossRef]
- Chofreh, A.G.; Goni, F.A.; Klemes, J.J. Development of a roadmap for Sustainable Enterprise Resource Planning systems implementation (part II). J. Clean. Prod. 2017, 166, 425–437. [Google Scholar] [CrossRef]
- Chofreh, A.G.; Goni, F.A.; Klemes, J.J. Evaluation of a framework for sustainable Enterprise Resource Planning systems implementation. J. Clean. Prod. 2018, 190, 778–786. [Google Scholar] [CrossRef]
- Chofreh, A.G.; Goni, F.A.; Klemes, J.J. Sustainable enterprise resource planning systems implementation: A framework development. J. Clean. Prod. 2018, 198, 1345–1354. [Google Scholar] [CrossRef]
- Chofreh, A.G.; Goni, F.A.; Shaharoun, A.M.; Ismail, S.; Klemes, J.J. Sustainable enterprise resource planning: Imperatives and research directions. J. Clean. Prod. 2014, 71, 139–147. [Google Scholar] [CrossRef]
- Wang, X.; Liu, H.; Huang, S. Identification of the daily seasonality in gold returns and volatilities: Evidence from Shanghai and London. Resour. Policy 2019, 61, 522–531. [Google Scholar] [CrossRef]
- Bedoui, R.; Braiek, S.; Guesmi, K.; Chevallier, J. On the conditional dependence structure between oil, gold and USD exchange rates: Nested copula based GJR-GARCH model. Energy Econ. 2019, 80, 876–889. [Google Scholar] [CrossRef]
- Enders, W. Applied Econometric Time Series, 4th ed.; John Wiley and Sons: New York, NY, USA, 2015. [Google Scholar]
- Glosten, L.R.; Jagannathan, R.; Runkle, D.E. On the Relation between the Expected Value and the Volatility of the Nominal Excess Return on Stocks. J. Financ. 1993, 48, 1779–1801. [Google Scholar] [CrossRef]
- Enders, W.; Granger, C.W.J. Unit-Root Tests and Asymmetric Adjustment with an Example Using the Term Structure of Interest Rates. J. Bus. Econ. Stat. 1998, 16, 304–311. [Google Scholar]
- Hentschel, L. All in the Family Nesting Symmetric and Asymmetric GARCH Models. J. Financ. Econ. 1995, 39, 71–104. [Google Scholar] [CrossRef]
- Todorova, N. The asymmetric volatility in the gold market revisited. Econ. Lett. 2017, 150, 138–141. [Google Scholar] [CrossRef]
- Enders, W.; Siklos, P.L. Cointegration and Threshold Adjustment. J. Bus. Econ. Stat. 2001, 19, 166–176. [Google Scholar] [CrossRef] [Green Version]
- Lundbergh, S.; Teräsvirta, T. Evaluating GARCH Models. J. Econom. 2002, 110, 417–435. [Google Scholar] [CrossRef]
- Symitsi, E.; Chalvatzis, K.J. The economic value of Bitcoin: A portfolio analysis of currencies, gold, oil and stocks. Res. Int. Bus. Financ. 2019, 48, 97–110. [Google Scholar] [CrossRef]
- Chow, G.C. Tests of equality between sets of coefficients in two linear regressions. Econometrica 1960, 28, 591–605. [Google Scholar] [CrossRef]
- Hansen, B.E. The new econometrics of structural change: dating breaks in U. S. labor productivity. J. Econ. Perspect. 2001, 15, 117–128. [Google Scholar] [CrossRef]
- Dickey, D.A.; Fuller, W.A. Distribution of the Estimators for Autoregressive Time Series with a Unit Root. J. Am. Stat. Assoc. 1979, 74, 427–431. [Google Scholar]
- Dickey, D.A.; Fuller, W.A. Likelihood Ratio Statistics for Autoregressive Time Series with a Unit Root. Econometrica 1981, 49, 1057–1072. [Google Scholar] [CrossRef]
- Phillips, P.C.; Perron, P. Testing for a Unit Root in Time Series Regression. Biometrika 1988, 75, 335–346. [Google Scholar] [CrossRef]
- Kwiatkowski, D.; Phillips, P.C.B.; Schmidt, P.; Shin, Y. Testing the null hypothesis of stationarity against the alternative of a unit root: How sure are we that economic time series have a unit root? J. Econom. 1992, 54, 159–178. [Google Scholar] [CrossRef]
- Kapetanios, G.; Shin, Y.; Snell, A. Testing for a Unit Root in the Nonlinear STAR Framework. J. Econom. 2003, 112, 359–379. [Google Scholar] [CrossRef]
- Berndt, E.; Hall, B.; Hall, R.; Hausman, J. Estimation and Inference in Nonlinear Structural Models. Ann. Econ. Soc. Meas. 1974, 3, 653–665. [Google Scholar]
- Ljung, G.M.; Box, G.E.P. On a measure of lock of fit in time series models. Biometrika 1978, 65, 297–303. [Google Scholar] [CrossRef]
- Chan, K.S. Consistency and Limiting Distribution of the Least Squares Estimator of a Threshold Autoregressive Model. Ann. Stat. 1993, 21, 520–533. [Google Scholar] [CrossRef]
Figure 1.
Daily gold price data, 1980/1/2–2019/4/10.
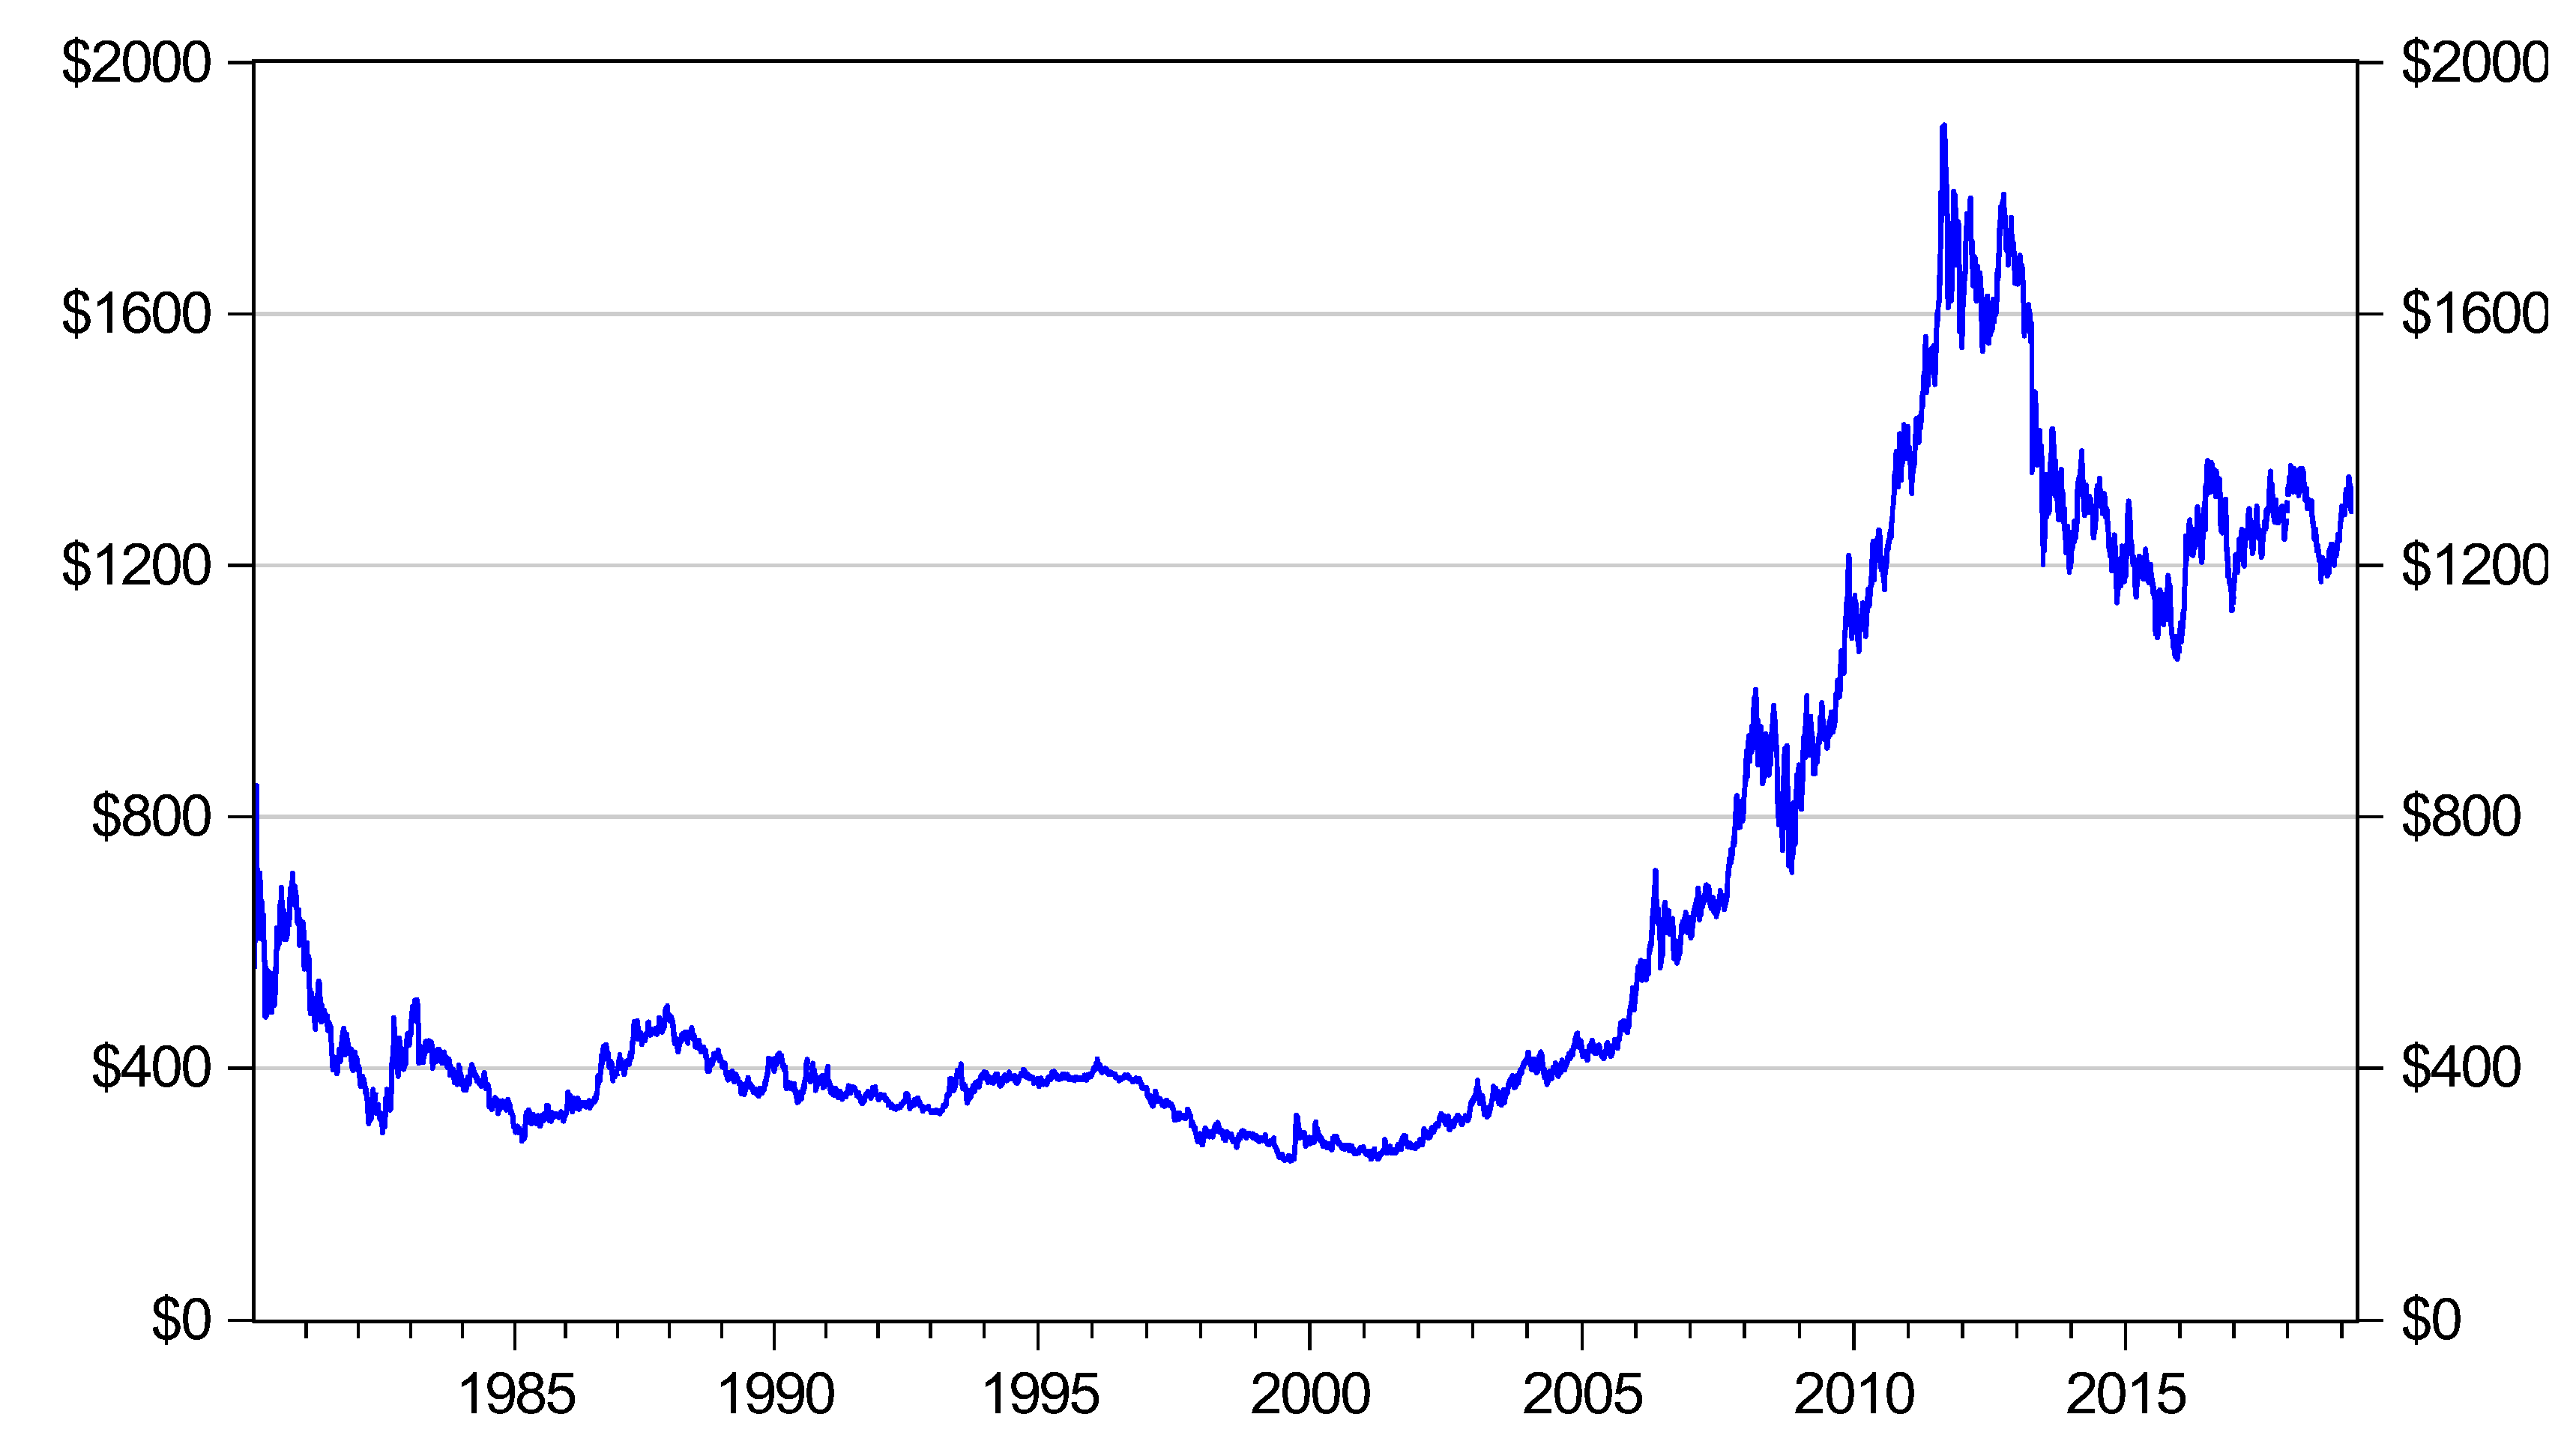
Figure 2.
Daily gold return (RET), 2000–2016.

Figure 3.
Daily gold return volatility (H), 2000–2016.

Figure 4.
Daily gold return (RET) and gold return volatility (H), 2000–2016.

Table 1.
Segmented periods from 3 January 2000 to 30 December 2016.
| Period | Trading Days | ||
|---|---|---|---|
| Pre-Financial Tsunami | 3 January 2000 | 31 July 2007 | 1977 |
| Financial Tsunami | 1 August 2007 | 31 December 2008 | 371 |
| Post-Financial Tsunami | 1 January 2009 | 30 December 2016 | 2084 |
| Overall Observed Time | 3 January 2000 | 30 December 2016 | 4432 |
Table 2.
Descriptive statistics of the gold return (RET) in each segmented period.
| Period | Mean | Standard Deviation | Maximum | Minimum |
|---|---|---|---|---|
| Pre-Financial Tsunami | 0.0474 | 1.0129 | 7.9492 | −6.9839 |
| Financial Tsunami | 0.0921 | 1.7744 | 10.7883 | −6.9149 |
| Post-Financial Tsunami | 0.0185 | 1.0780 | 4.9943 | −9.0737 |
| Overall Observed Time | 0.0375 | 1.1257 | 10.7883 | −9.0737 |
Table 3.
Estimated results of the structural break test (n = 4432).
| Variable | Coeff. | Std Error | t-Stat | p-Value |
|---|---|---|---|---|
| Constant | 0.0338 | 0.0177 | 1.9117 * | 0.0559 |
| −0.0394 | 0.0169 | 2.3375 ** | 0.0195 | |
| 0.0553 | 0.0611 | 0.9051 | 0.3655 | |
| 0.0732 | 0.0370 | 1.9772 ** | 0.0481 |
Note: *, **, and *** denote significance at the 10%, 5%, and 1% levels, respectively.
Table 4.
Unit root test results for the price of gold (GP).
| Linear test | Nonlinear test | |||
|---|---|---|---|---|
| Lags | ADF [26,27] t-Stat | PP [28] Adj. t-Stat | KPSS [29] Adj. t-Stat | KSS [30] t-Stat |
| 5 | −1.1765 | −1.1587 | 64.5504 *** | −1.9302 * |
| 10 | −1.1673 | −1.1569 | 35.2389 *** | −1.9205 * |
| 20 | −1.1651 | −1.1517 | 18.4887 *** | −1.9072 * |
Note: *, **, and *** denote significance at the 10%, 5%, and 1% levels, respectively.
Table 5.
Unit root test results for RET.
| Linear test | Nonlinear test | |||
|---|---|---|---|---|
| Lags | ADF [26,27] t-Stat | PP [28] Adj. t-Stat | KPSS [29] Adj. t-Stat | KSS [30] t-Stat |
| 5 | −27.9045 *** | −68.1695 *** | 0.2692 | −6.8297 *** |
| 10 | −21.0031 *** | −68.1866 *** | 0.2765 | −4.0304 *** |
| 20 | −14.8584 *** | −68.2477 *** | 0.2901 | −2.2109 ** |
Note: *, **, and *** denote significance at the 10%, 5%, and 1% levels, respectively.
Table 6.
Lagrange multiplier test results for ARCH effects.
| Heteroscedasticity Test | F-Statistic | Chi-Squared |
|---|---|---|
| ARCH (1) | 38.1646 *** | 37.8557 *** |
| ARCH (5) | 22.1434 *** | 108.1586 *** |
| ARCH (10) | 20.2930 *** | 194.4888 *** |
Note: *, **, and *** denote significance at the 10%, 5%, and 1% levels, respectively.
Table 7.
Estimated results of GARCH, GJR-GARCH, and HMTAR-GARCH models for RET (overall sample, n = 4432).
Table 7.
Estimated results of GARCH, GJR-GARCH, and HMTAR-GARCH models for RET (overall sample, n = 4432).
| RET | Model 1 (GARCH) | Model 2 (GJR-GARCH) | Model 3 (HMTAR-GARCH) | ||||||
|---|---|---|---|---|---|---|---|---|---|
| (No Threshold) | |||||||||
| Coeff. | t-Stat | Coeff. | t-Stat | Coeff. | t-Stat | ||||
| Mean Eq. | |||||||||
| Intercept | 0.0304 | 1.9947 | ** | 0.0766 | 2.7111 | *** | 0.0414 | 0.7831 | |
| −0.0288 | −1.8068 | * | 0.0035 | 0.1478 | −0.0295 | −1.2501 | |||
| – | −0.0273 | −0.6425 | −0.0075 | −0.1339 | |||||
| – | −0.0616 | −1.7474 | * | 0.0026 | 0.0654 | ||||
| 0.1121 | 1.4738 | 0.1363 | 1.1981 | 0.0993 | 0.5350 | ||||
| – | −0.3121 | −1.5110 | −0.0100 | −0.0468 | |||||
| – | 0.1961 | 0.9497 | 0.2068 | 1.1401 | |||||
| Variance Eq. | |||||||||
| Intercept | 0.0191 | 8.1659 | *** | 0.0432 | 4.7604 | *** | −0.0550 | −3.8915 | ***1 |
| 0.9457 | 275.5586 | *** | 0.9407 | 362.2307 | *** | 0.9394 | 356.7580 | *** | |
| 0.0358 | 17.8944 | *** | 0.0366 | 20.03830 | *** | 0.0477 | 17.1185 | *** | |
| () | – | 0.0333 | 3.8468 | *** | 0.0829 | 5.8403 | *** | ||
| () | – | −0.0735 | −5.3140 | *** | −0.0080 | −0.5657 | |||
| () | 0.0396 | 4.7641 | *** | 0.2647 | 2.1359 | ** | 0.6234 | 4.8043 | ***2 |
| () | – | −0.2490 | −2.5424 | ** | −0.4359 | −3.6431 | ***3 | ||
| () | – | −0.1965 | −1.0068 | −0.7068 | −4.0731 | ***3 | |||
| AIC | 4820.3388 | 4782.2706 | 4772.2533 | ||||||
| SBC | 4814.7350 | 4760.6668 | 4750.6460 | ||||||
| Log-likelihood | −2403.1694 | −2376.1353 | −2371.1266 | ||||||
| Hypothesis 4 | p-value | p-value | |||||||
| – | 0.09291 | 0.38025 | 3.01974 | 0.04113 | **3 | ||||
| – | 0.10078 | 0.37545 | 5.33930 | 0.01042 | **3 | ||||
| Ljung–Box test | Q-stat | p-value | Q-stat | p-value | Q-stat | p-value | |||
| Lags 5 | 1.922 | 0.8598 | 2.359 | 0.7976 | 1.937 | 0.8578 | |||
| Lags 10 | 14.403 | 0.1554 | 15.190 | 0.1253 | 14.340 | 0.1580 | |||
| Lags 20 | 22.865 | 0.2955 | 23.323 | 0.2732 | 22.845 | 0.2965 | |||
1 *, **, and *** denote significance at the 10%, 5%, and 1% levels, respectively. 2 Right-tailed test. 3 Left-tailed test.
Table 8.
Estimated results of GARCH, GJR-GARCH, and HMTAR-GARCH models for RET (overall sample, n = 4427).
Table 8.
Estimated results of GARCH, GJR-GARCH, and HMTAR-GARCH models for RET (overall sample, n = 4427).
| RET | Model 1 (GARCH) | Model 2 (GJR-GARCH) | Model 3 (HMTAR-GARCH) | ||||||
|---|---|---|---|---|---|---|---|---|---|
| (No Threshold) | |||||||||
| Coeff. | t-Stat | Coeff. | t-Stat | Coeff. | t-Stat | ||||
| Mean Eq.: | |||||||||
| Intercept | 0.0316 | 2.0492 | ** | 0.0557 | 2.0074 | ** | 0.0507 | 1.0071 | |
| −0.0247 | −1.5727 | −0.0055 | −0.2389 | −0.0202 | −0.8727 | ||||
| – | −0.0097 | −0.2276 | −0.0137 | −0.2503 | |||||
| – | −0.0355 | −1.0000 | −0.0256 | −0.5099 | |||||
| 0.1172 | 1.5327 | 0.2093 | 1.9563 | * | 0.0210 | 0.1246 | |||
| – | −0.2820 | −1.4464 | 0.1357 | 0.6750 | |||||
| – | 0.0523 | 0.2675 | 0.0329 | 0.1638 | |||||
| Variance Eq.: | |||||||||
| Intercept | 0.0197 | 8.1235 | *** | 0.0216 | 2.8025 | *** | −0.0480 | −4.2402 | ***1 |
| 0.9464 | 264.2475 | *** | 0.9494 | 465.4909 | *** | 0.9500 | 445.4965 | *** | |
| 0.0347 | 16.7985 | *** | 0.0317 | 19.2710 | *** | 0.0403 | 16.0253 | *** | |
| () | – | 0.0321 | 4.0517 | *** | 0.0700 | 5.8610 | *** | ||
| () | – | −0.0376 | −3.0801 | *** | −0.0117 | −0.8399 | |||
| () | 0.0371 | 4.4376 | *** | 0.0406 | 0.37408 | 0.4082 | 5.5212 | ***2 | |
| () | – | −0.2180 | −2.4410 | ** | −0.3071 | −4.6960 | ***3 | ||
| () | – | 0.2144 | 1.1563 | −0.5044 | −3.2524 | ***3 | |||
| AIC | 4837.7191 | 4785.1320 | 4774.6190 | ||||||
| SBC | 4832.1142 | 4763.5270 | 4753.0141 | ||||||
| Log-likelihood | −2411.8596 | −2377.5660 | −2372.3095 | ||||||
| Hypothesis 4 | p-value | p-value | |||||||
| – | 5.5219 | 0.0094 | *** | 1.5520 | 0.1064 | 3 | |||
| – | 3.9235 | 0.0238 | ** | 3.0543 | 0.0403 | **3 | |||
| Ljung–Box test | Q-stat | p-value | Q-stat | p-value | Q-stat | p-value | |||
| Lags 5 | 2.196 | 0.8215 | 2.786 | 0.7330 | 2.907 | 0.7144 | |||
| Lags 10 | 13.034 | 0.2218 | 13.981 | 0.1738 | 14.205 | 0.1638 | |||
| Lags 20 | 22.486 | 0.3147 | 23.128 | 0.2826 | 24.311 | 0.2291 | |||
1 *, **, and *** denote significance at the 10%, 5%, and 1% levels, respectively. 2 Right-tailed test. 3 Left-tailed test.
© 2019 by the authors. Licensee MDPI, Basel, Switzerland. This article is an open access article distributed under the terms and conditions of the Creative Commons Attribution (CC BY) license (http://creativecommons.org/licenses/by/4.0/).
Share and Cite
MDPI and ACS Style
Liao, Y.-H.; Goo, Y.-J. Do Higher Asymmetry Threshold Effects Exist on the Gold Return Volatility during Highly Fluctuating Periods? Sustainability 2019, 11, 4829. https://doi.org/10.3390/su11184829
AMA Style
Liao Y-H, Goo Y-J. Do Higher Asymmetry Threshold Effects Exist on the Gold Return Volatility during Highly Fluctuating Periods? Sustainability. 2019; 11(18):4829. https://doi.org/10.3390/su11184829
Chicago/Turabian StyleLiao, Yu-Hui, and Yeong-Jia Goo. 2019. "Do Higher Asymmetry Threshold Effects Exist on the Gold Return Volatility during Highly Fluctuating Periods?" Sustainability 11, no. 18: 4829. https://doi.org/10.3390/su11184829
Note that from the first issue of 2016, this journal uses article numbers instead of page numbers. See further details here.