Potential Ecological Risk and Health Risk Assessment of Heavy Metals and Metalloid in Soil around Xunyang Mining Areas

Abstract
:1. Introduction
2. Materials and Methods
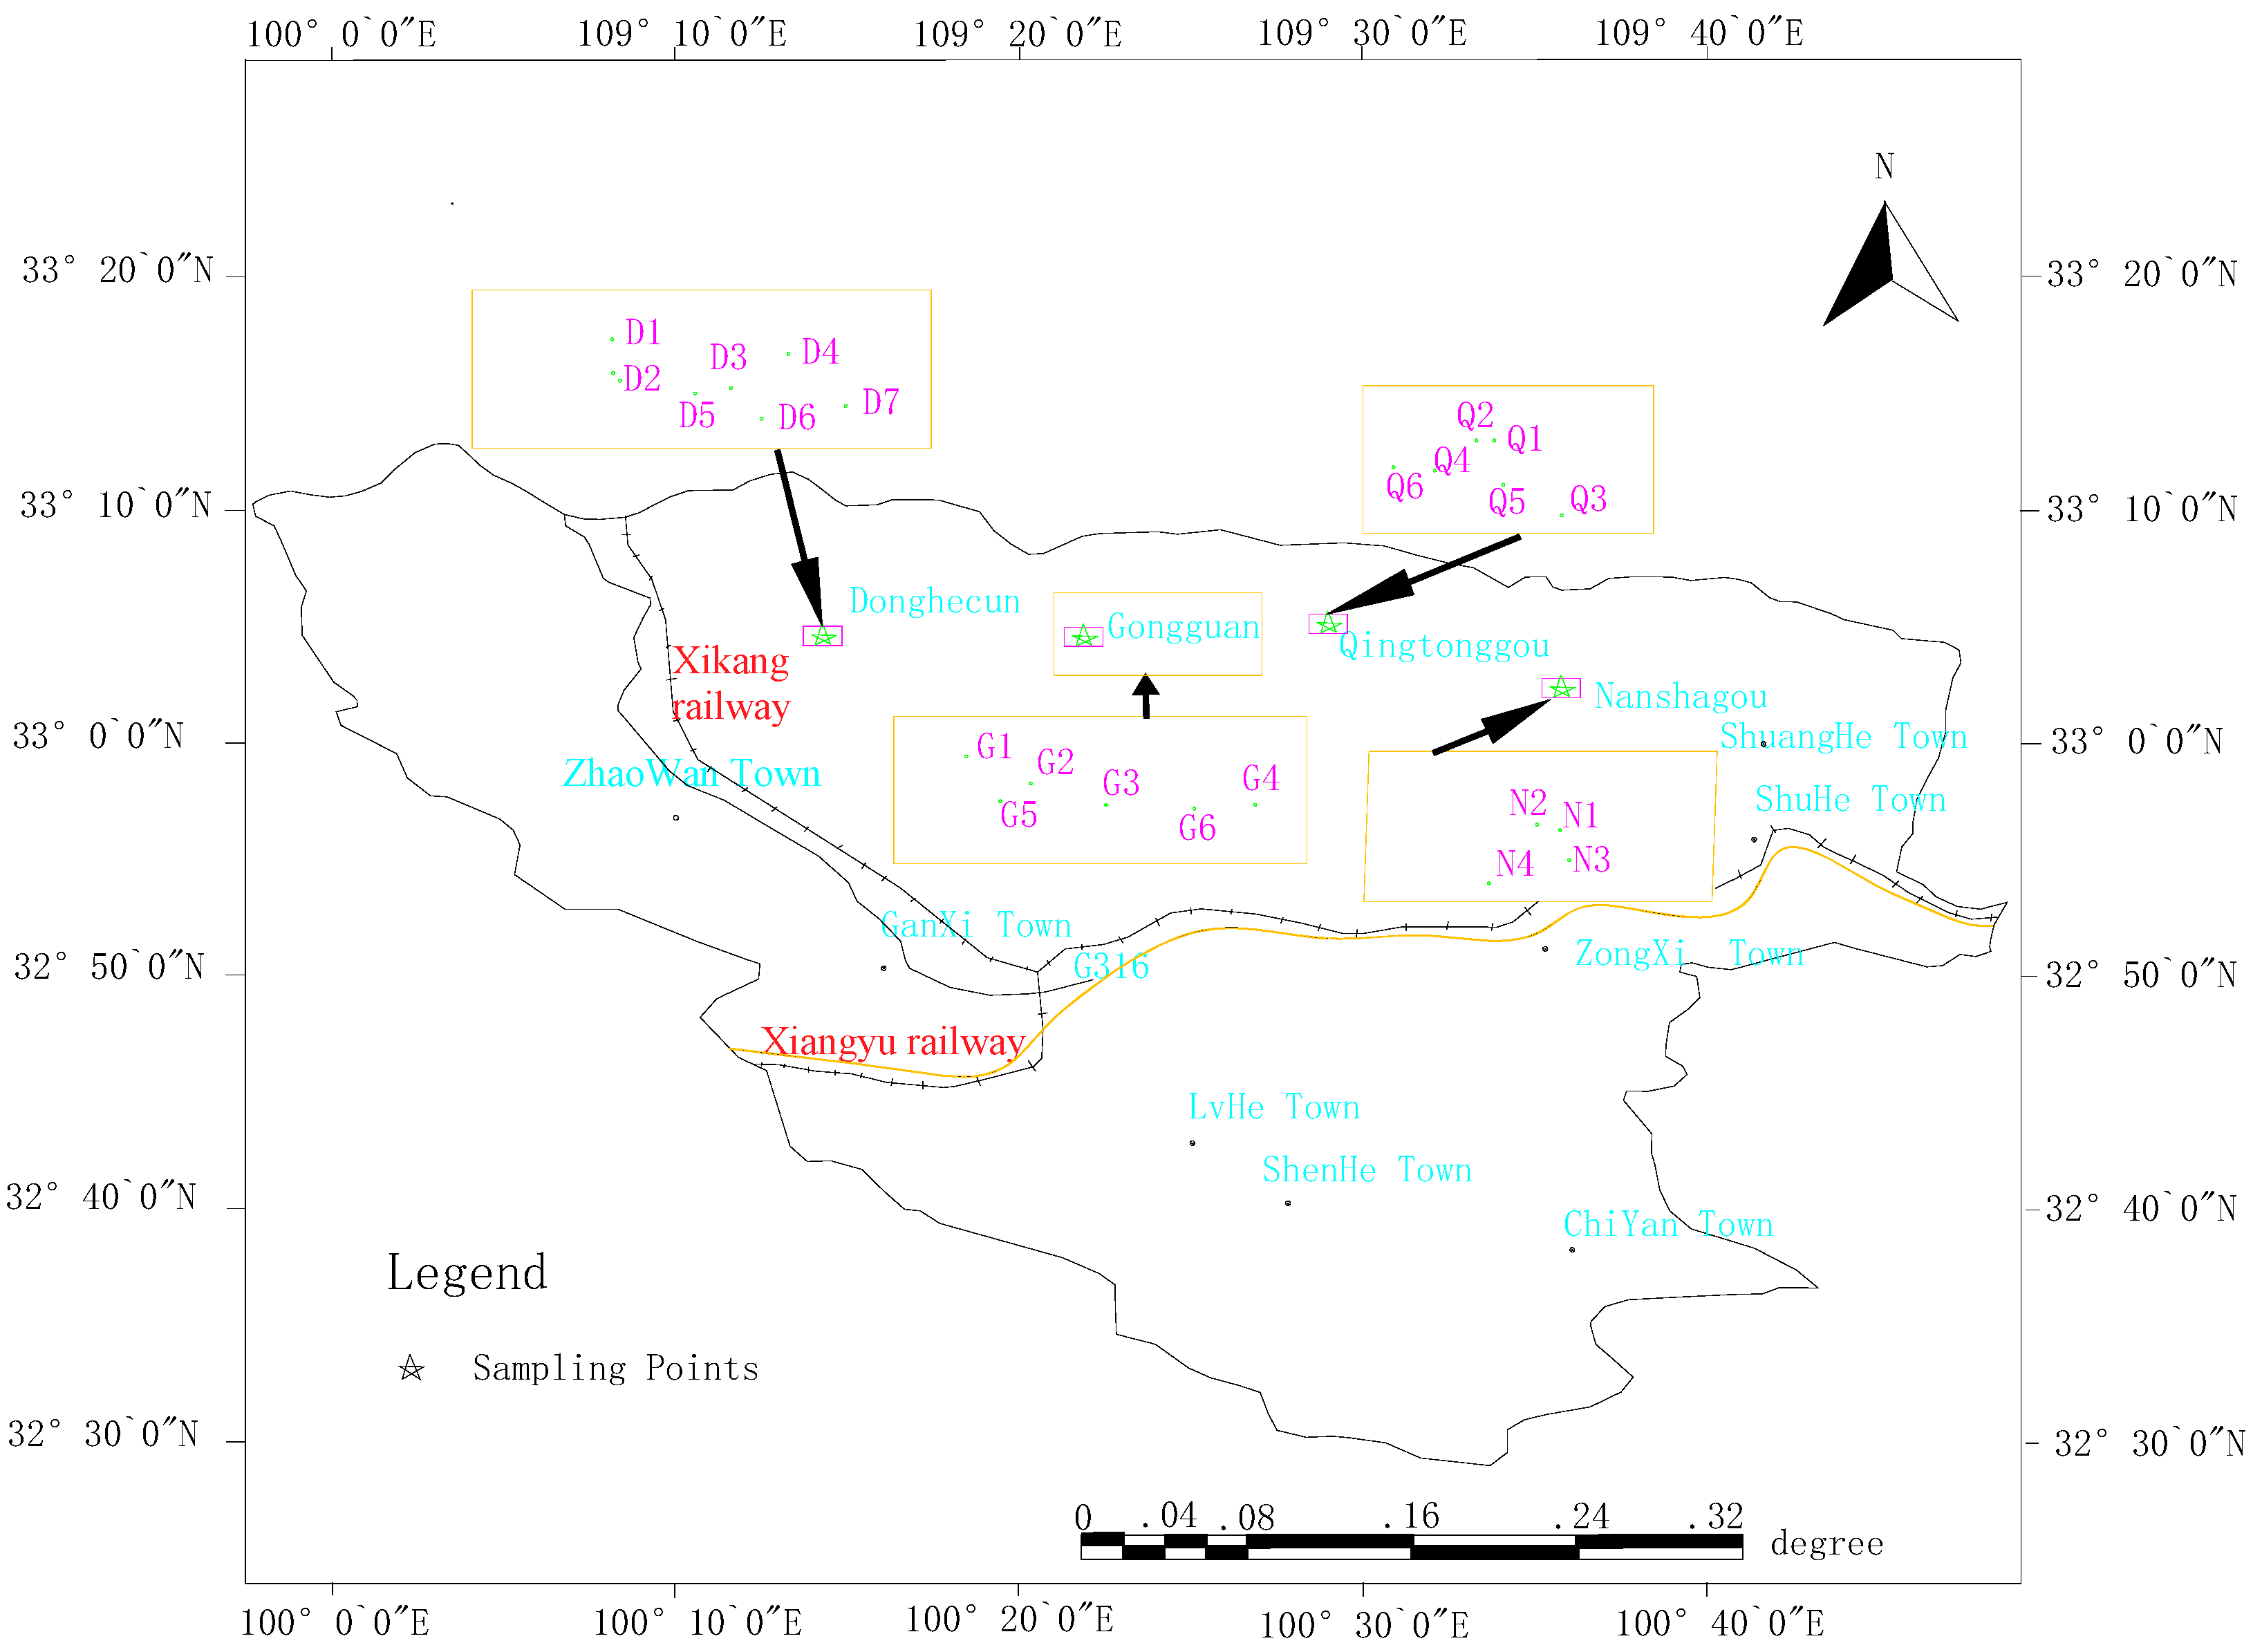
Sample Collection and Analysis
3. Evaluation Method
3.1. Ecological Risk Assessment Model
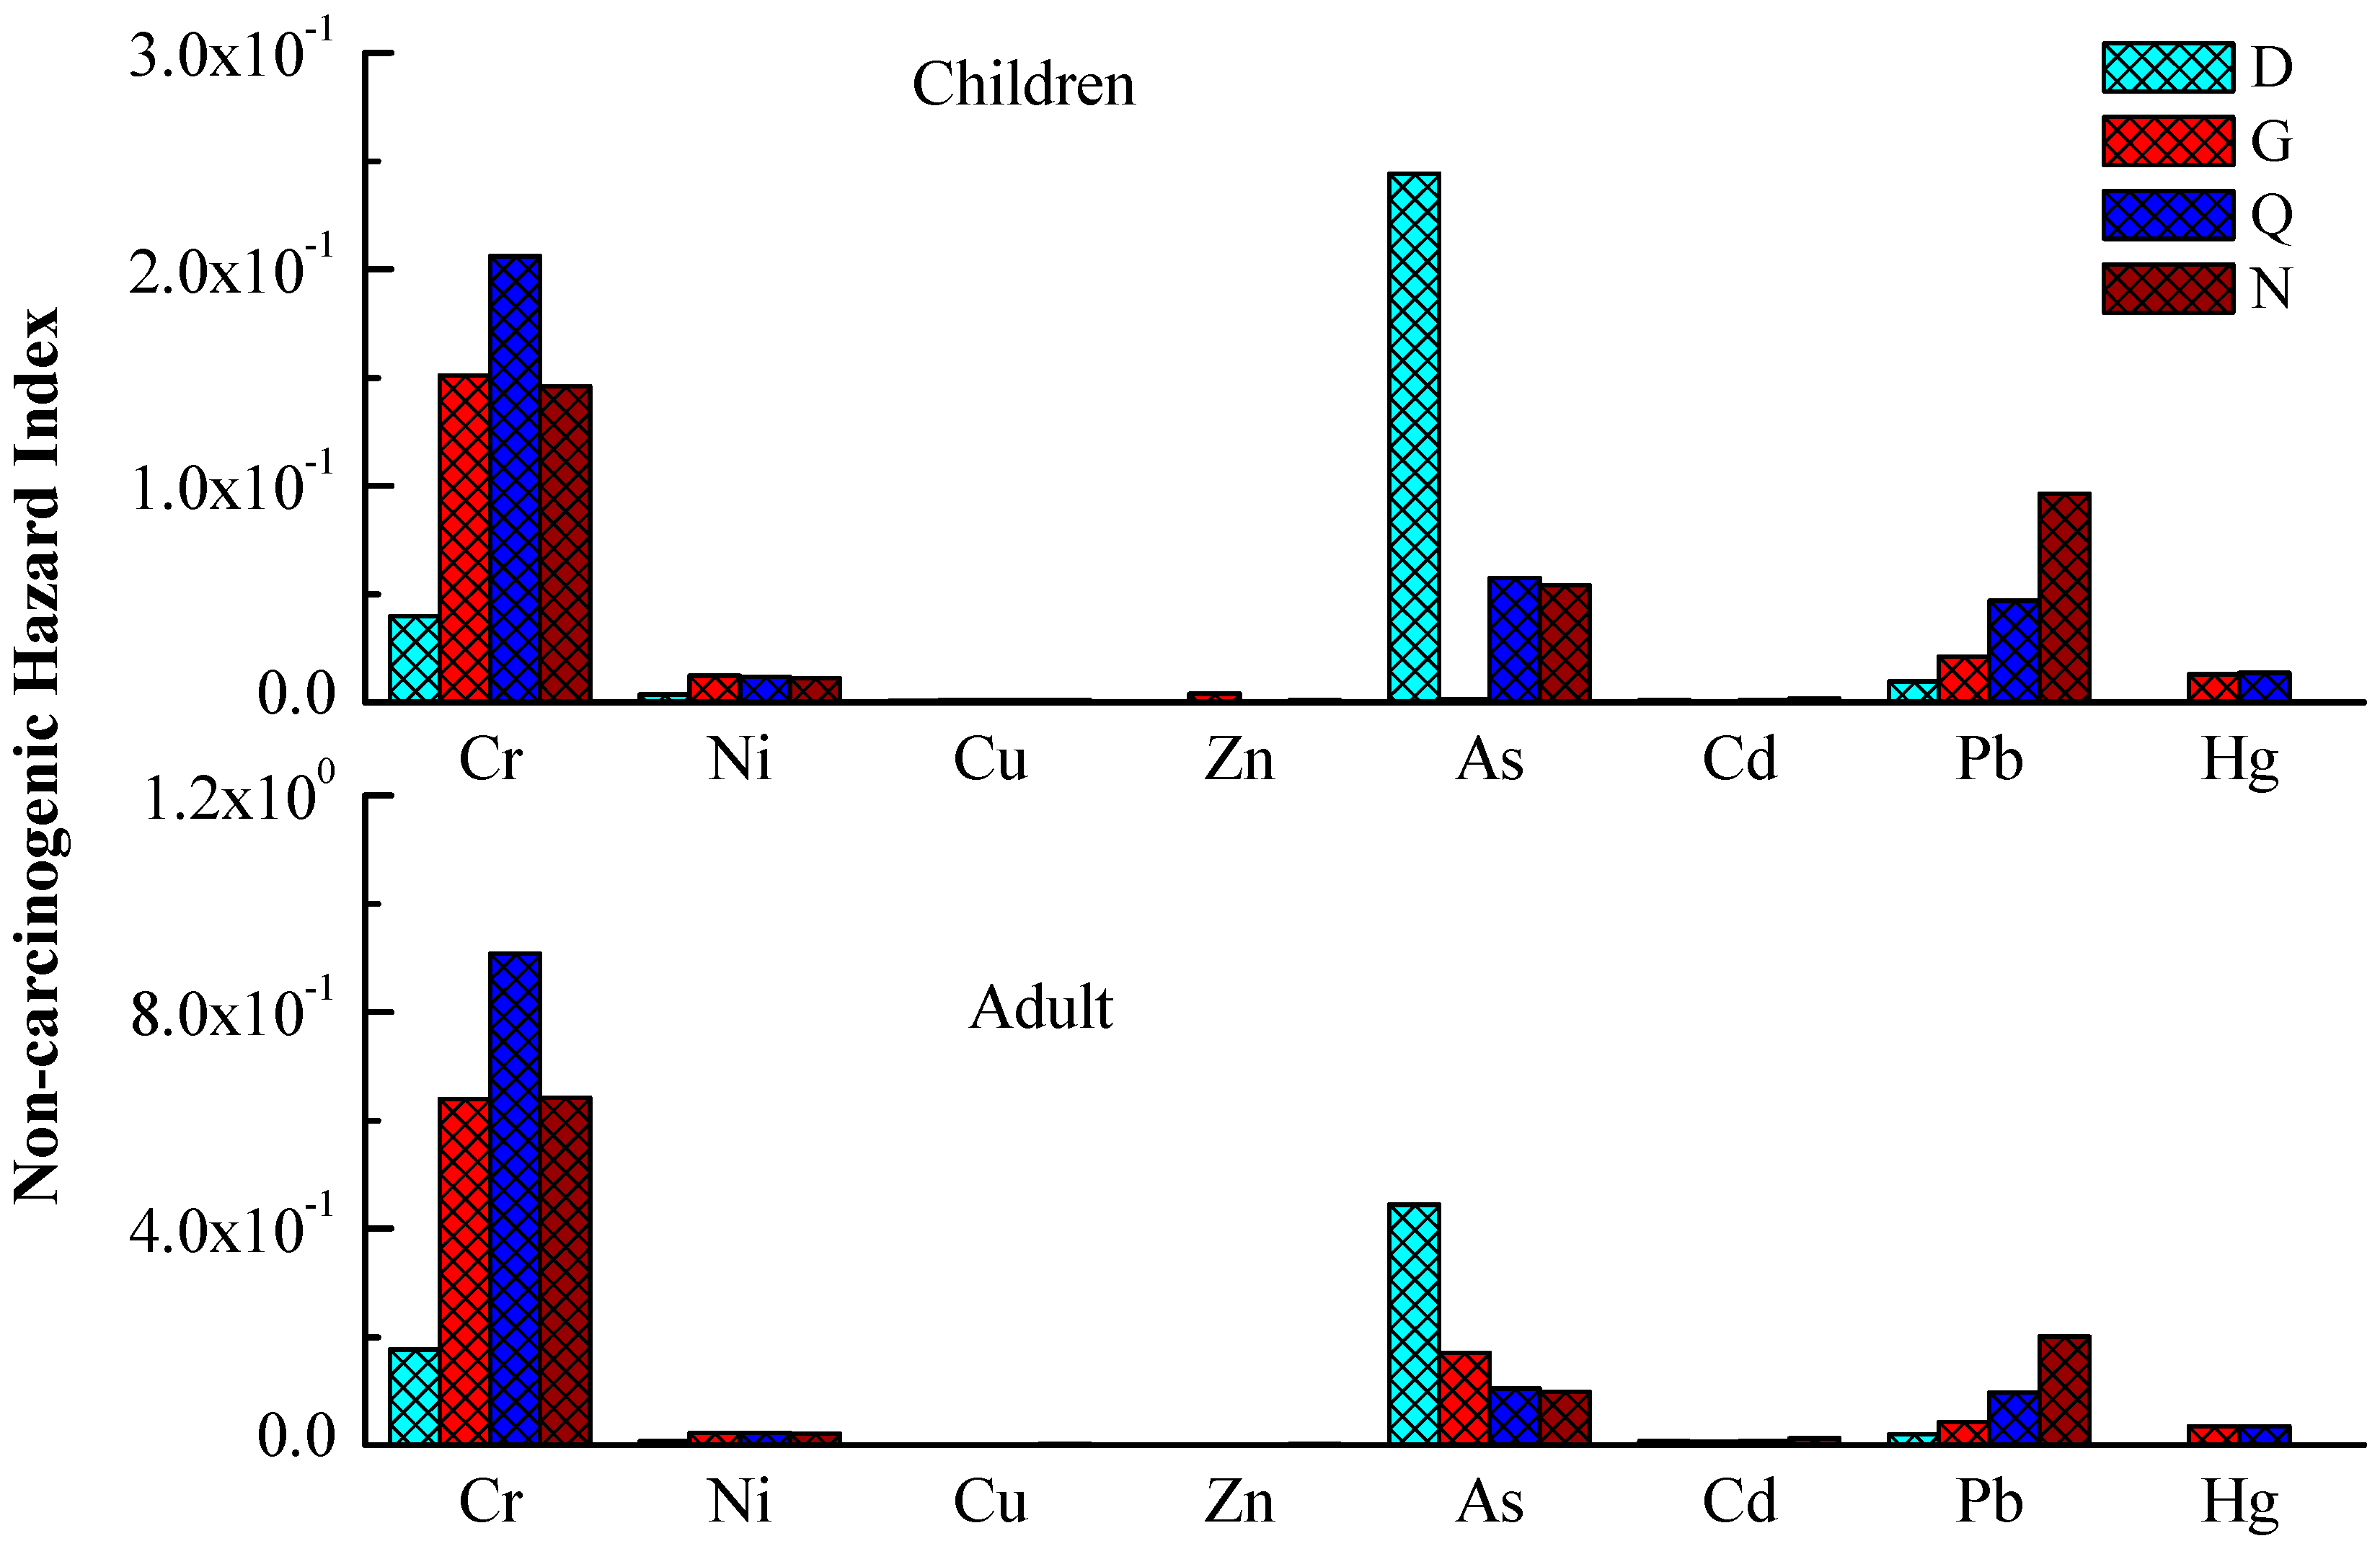
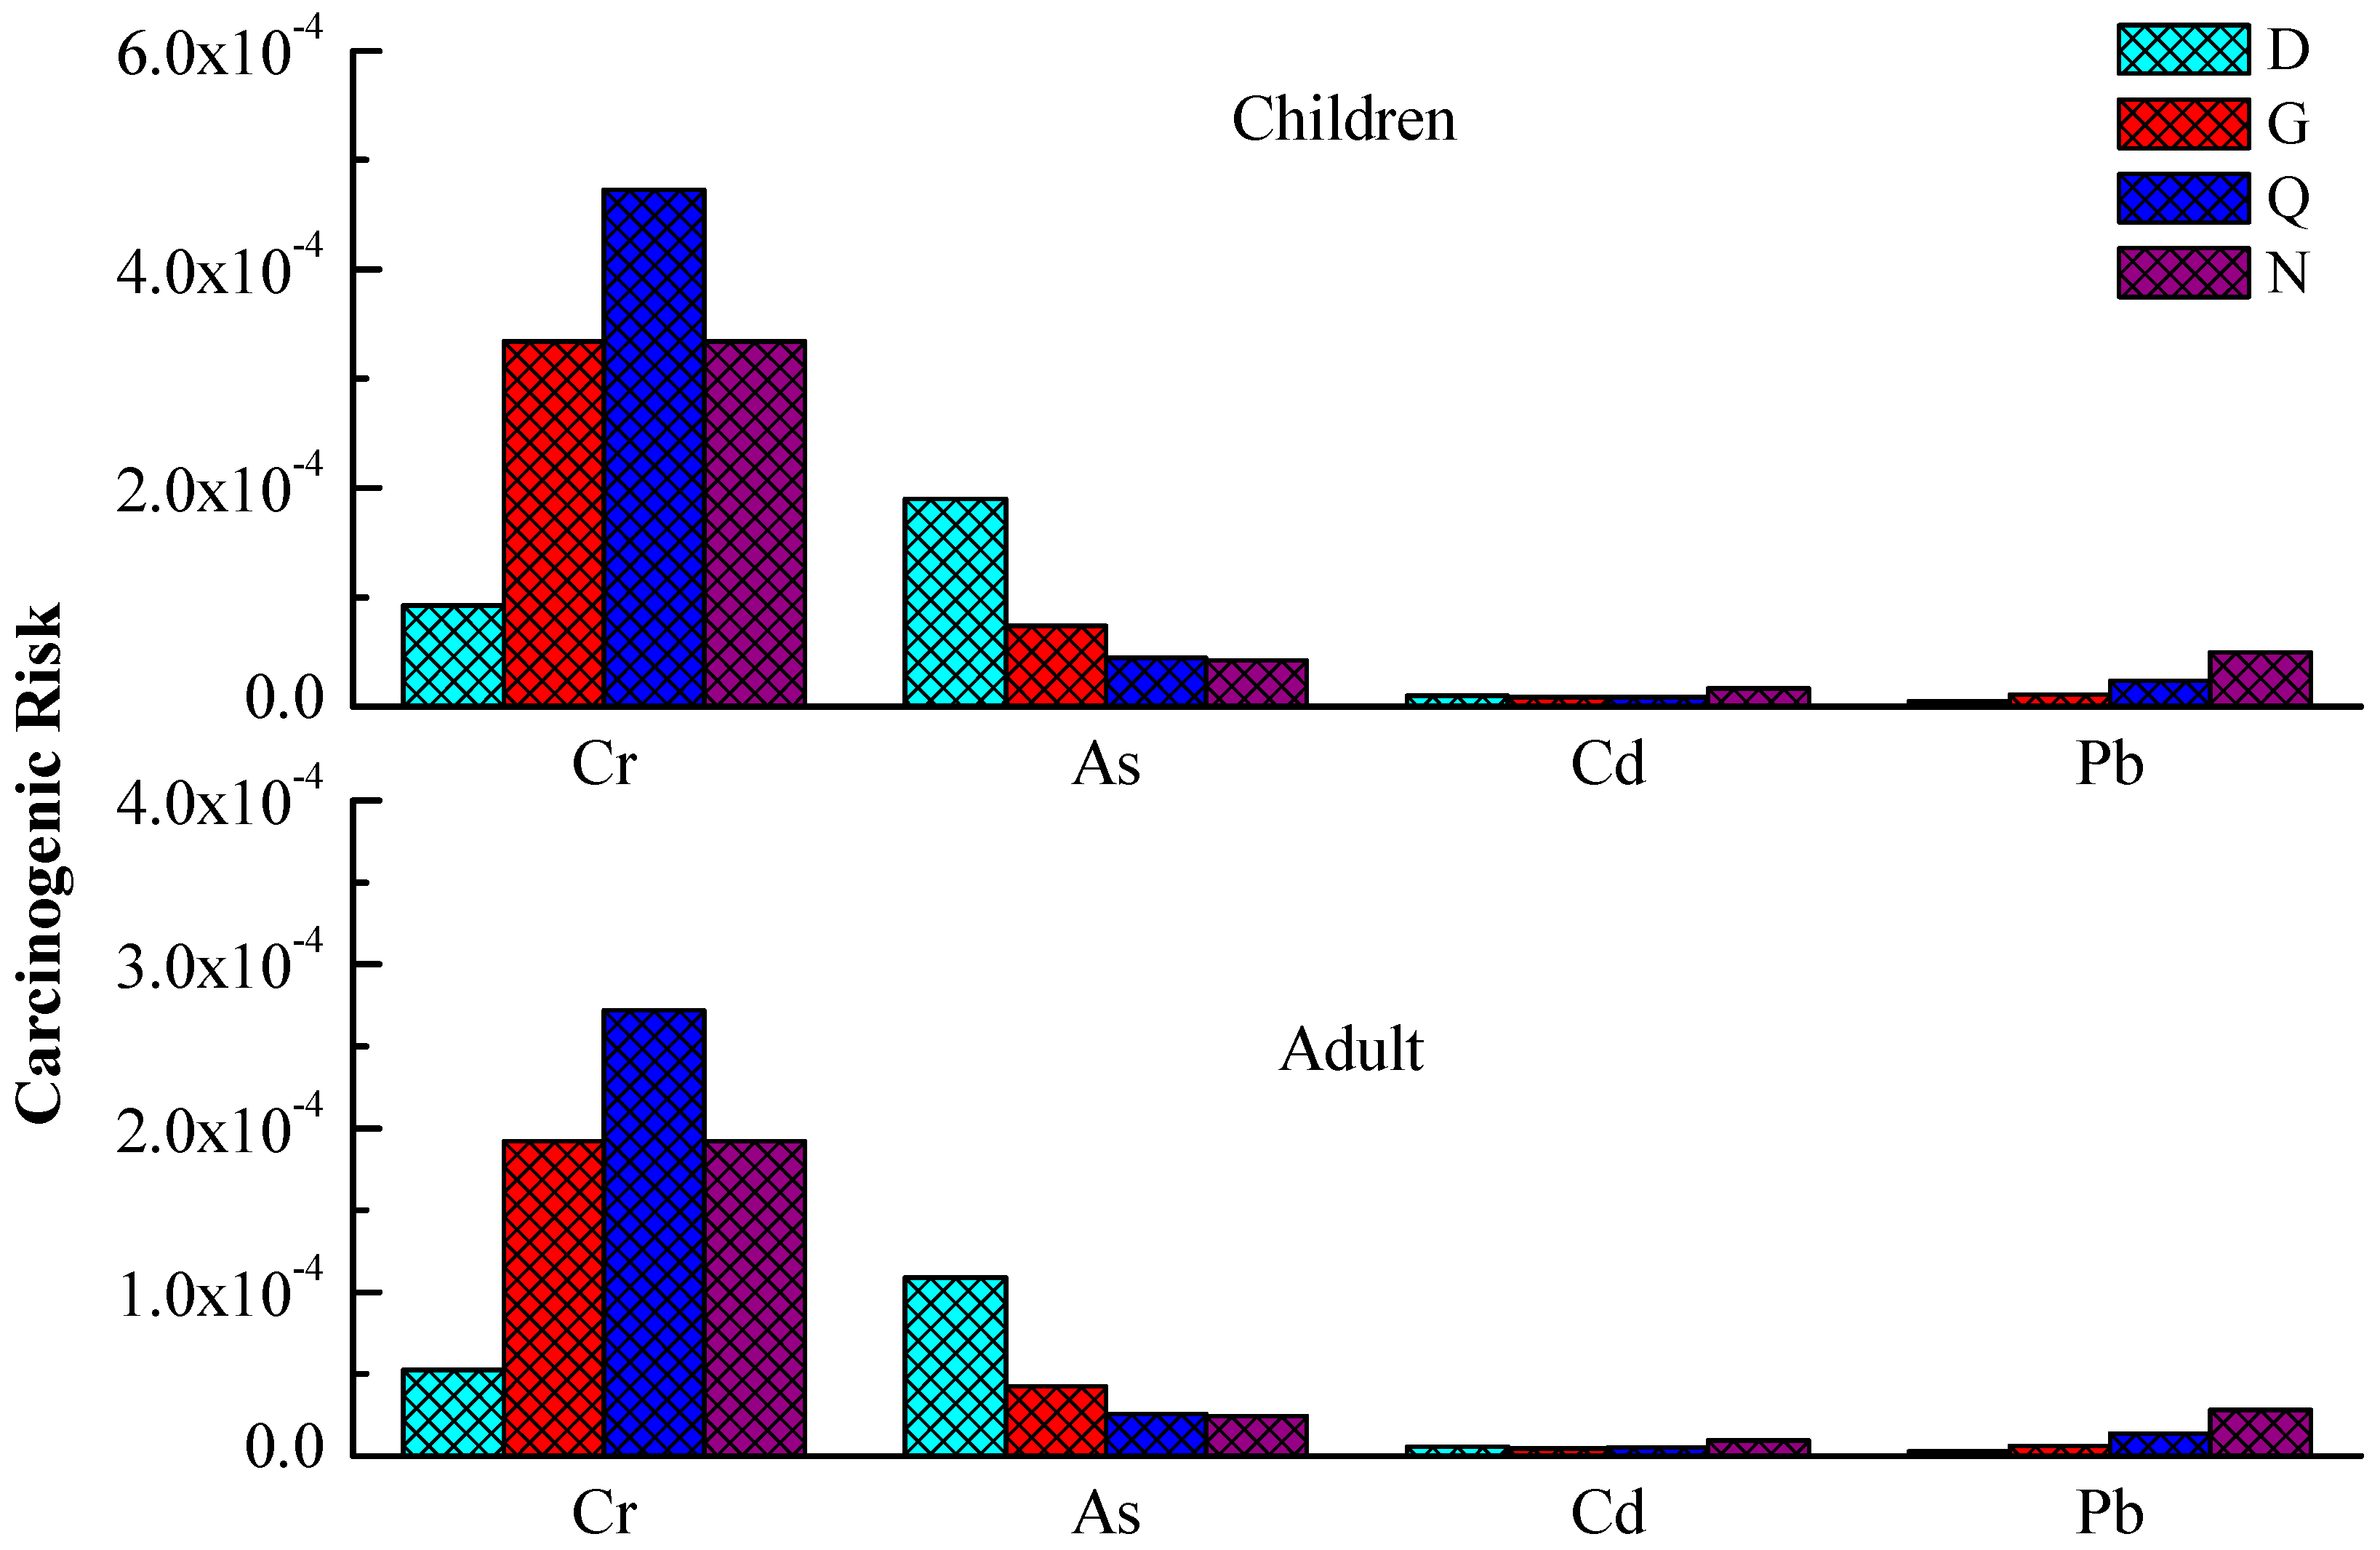
3.2. Health Risk Assessment Model
4. Results and Discussions
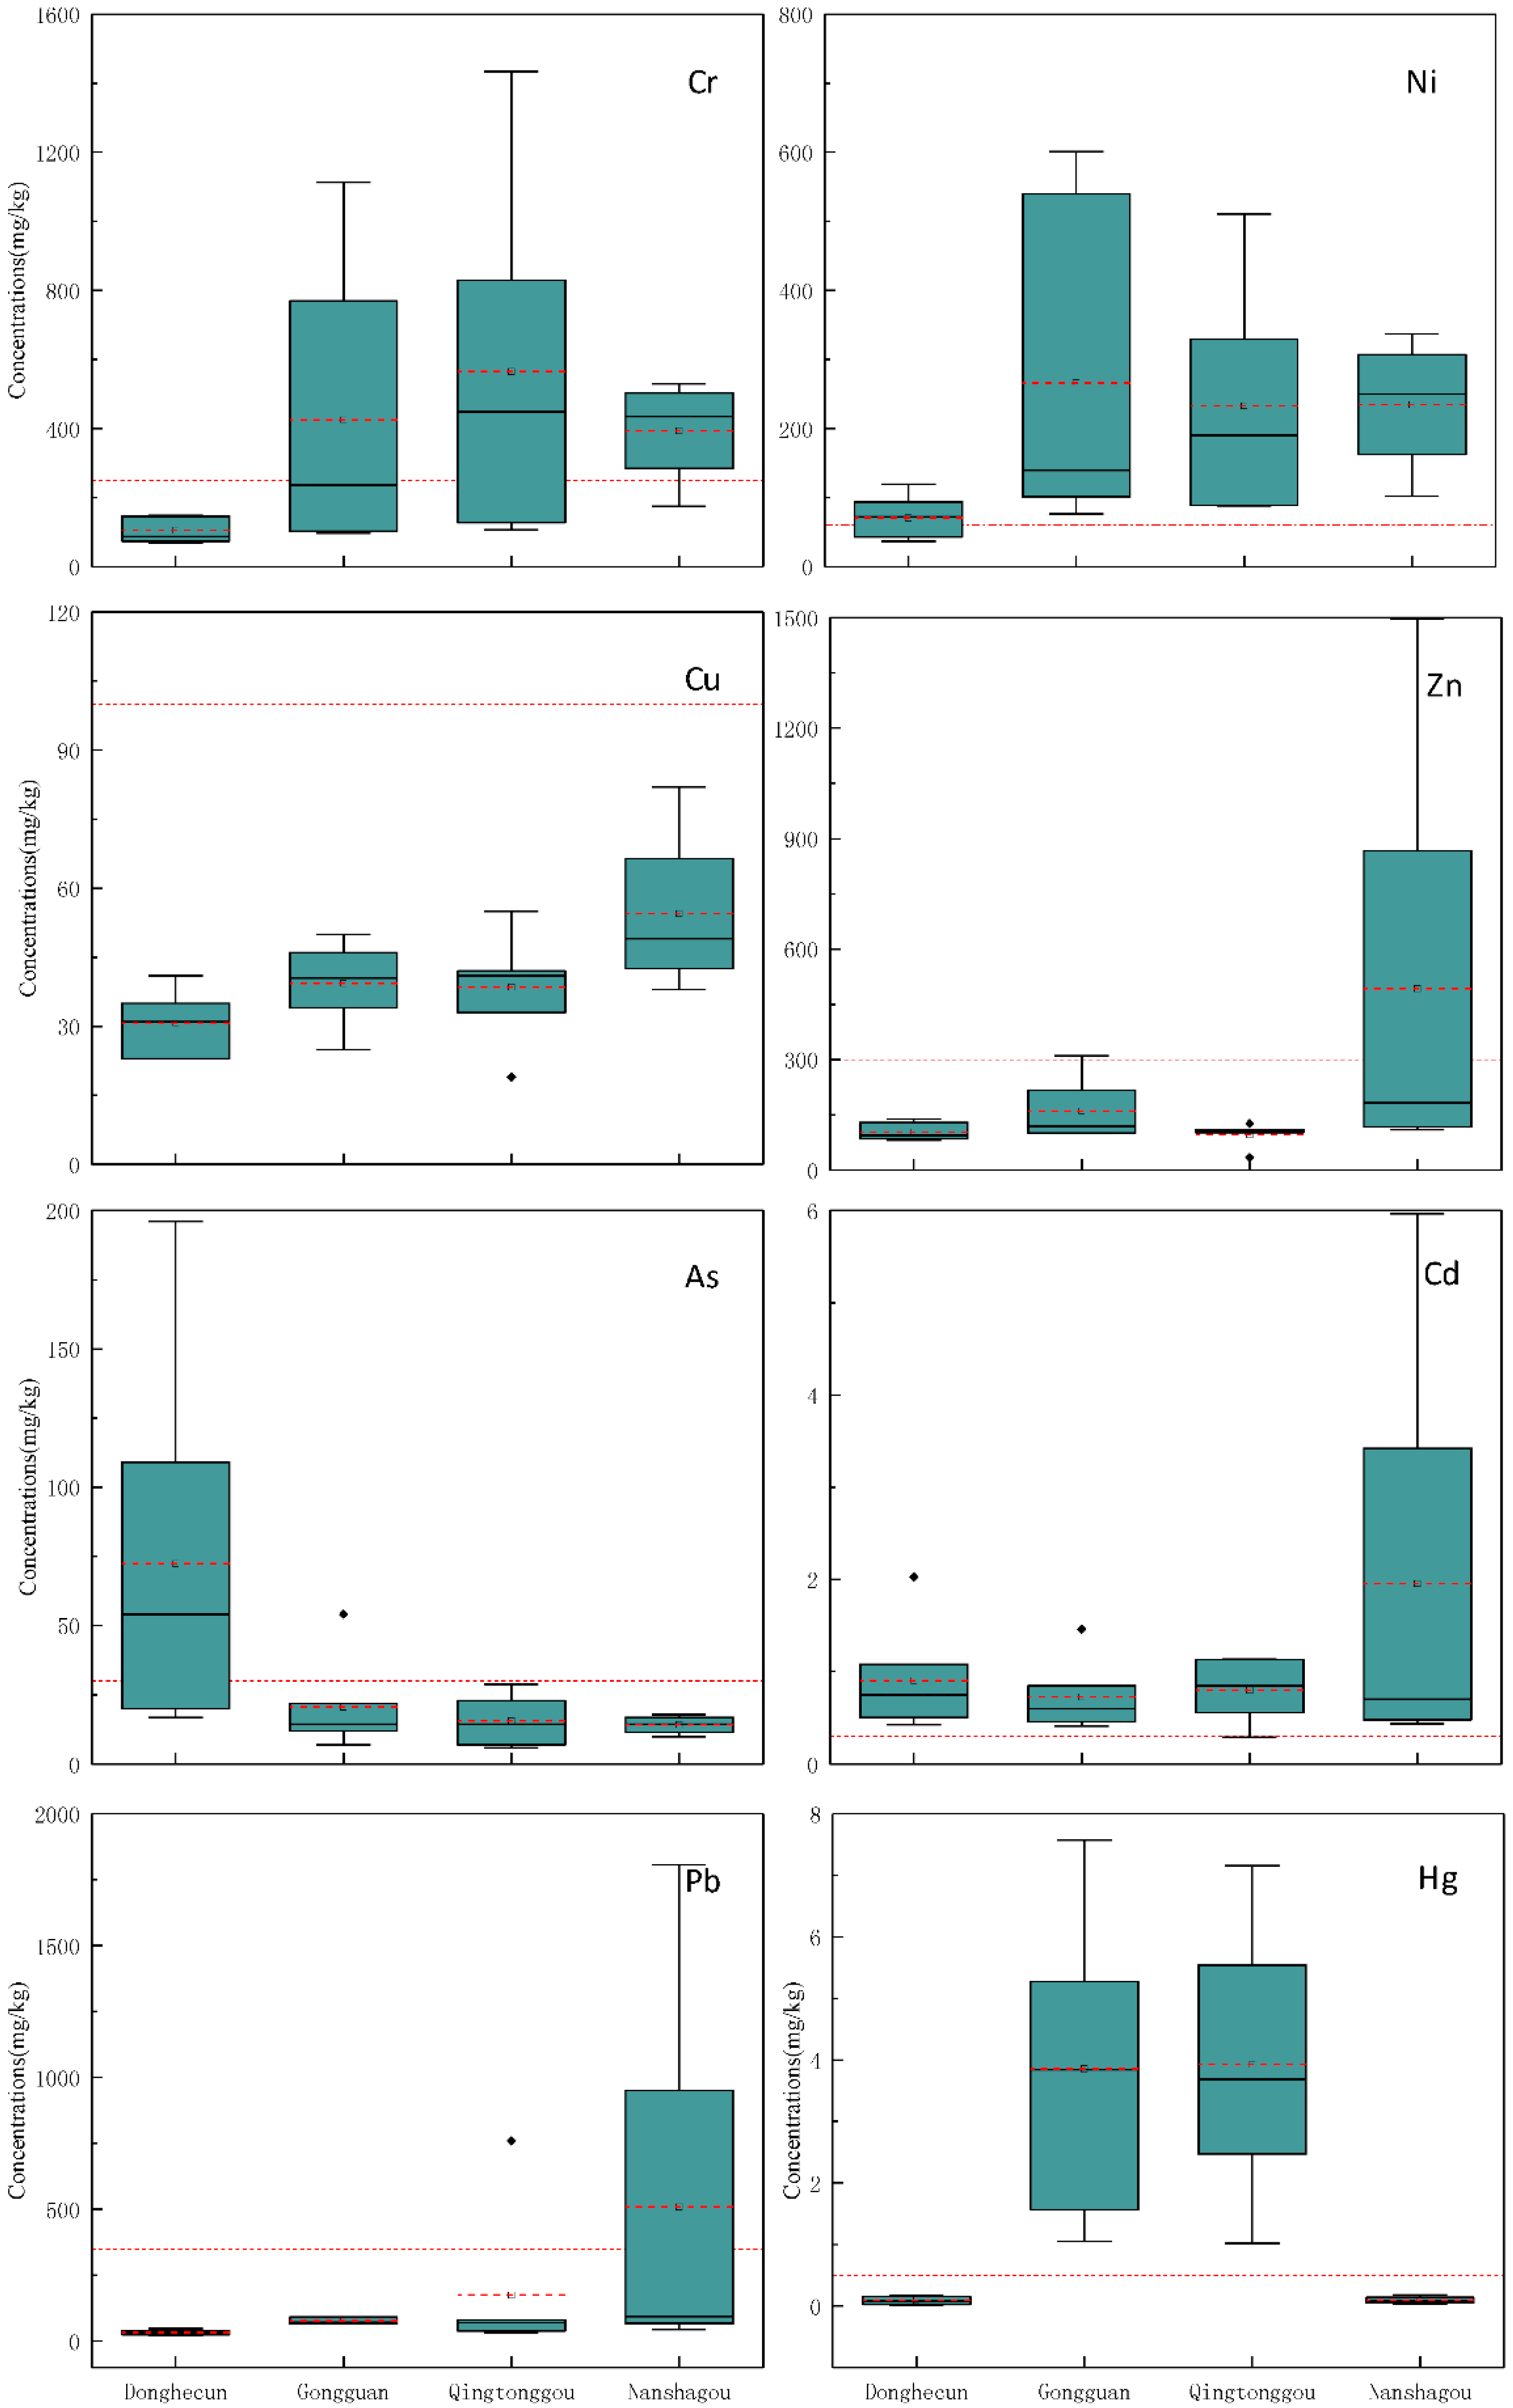
4.1. The Concentration of Heavy Metal
4.2. Geo-Accumulation Index (IGeo)
4.3. Potential Ecological Risk Index
4.4. Health Risk Assessment of Soil Heavy Metals
5. Conclusions
Author Contributions
Funding
Conflicts of Interest
References
- Chen, Y.Z.; Yang, H.; Zhang, Z.K.; Qin, M.Z.; Jin, F.; Lu, J.J. Application of Equilibrium Partitioning Approach to the Derivation of Sediment Quality Guidelines for Metals in Dianchi Lake. Pedosphere 2007, 17, 284–294. [Google Scholar] [CrossRef]
- Zhu, D.; Wei, Y.; Zhao, Y.; Wang, Q.; Han, J. Heavy Metal pollution and ecological risk assessment of the agriculture soil in Xunyang Mining Area, Shaanxi Province, Northwestern China. Bull. Environ. Contam. Toxicol. 2018, 101, 178–184. [Google Scholar] [CrossRef] [PubMed]
- Ministry of Environmental Protection of the People’s Republic of China (MEPPRC). Bulletin on National Survey of Soil Contamination; Ministry of Environmental Protection of the People’s Republic of China: Beijing, China, 2014. (In Chinese)
- Xiao, R.; Wang, S.; Li, R.; Wang, J.J.; Zhang, Z. Soil heavy metal contamination and health risks associated with artisanal gold mining in Tongguan, Shaanxi, China. Ecotoxicol. Environ. Saf. 2017, 141, 17–24. [Google Scholar] [CrossRef] [PubMed]
- Abad-Valle, P.; Álvarez-Ayuso, E.; Murciego, A.; Pellitero, E. Assessment of the use of sepiolite amendment to restore heavy metal polluted mine soil. Geoderma 2016, 280, 57–66. [Google Scholar] [CrossRef]
- Acosta, J.A.; Faz, A.; Martinez-Martinez, S.; Zornoza, R.; Carmona, D.M.; Kabas, S. Multivariate statistical and GIS-based approach to evaluate heavy metals behaviour in mine sites for future reclamation. J. Geochem. Explor. 2011, 109, 8–17. [Google Scholar] [CrossRef]
- Navarro, M.; Pérez-Sirvent, C.; Martínez-Sánchez, M.; Vidal, J.; Tovar, P.; Bech, J. Abandoned mine sites as a source of contamination by heavy metals: A case study in a semi-arid zone. J. Geochem. Explor. 2008, 96, 183–193. [Google Scholar] [CrossRef]
- Akar, T.; Tunali, S. Biosorption performance of Botrytis cinerea fungal by-products for removal of Cd(II) and Cu(II) ions from aqueous solutions. Miner. Eng. 2005, 18, 1099–1109. [Google Scholar] [CrossRef]
- Zhuang, P.; Zou, B.; Li, N.Y.; Li, Z.A. Heavy metal contamination in soils and food crops around Dabaoshan mine in Guangdong, China: Implication for human health. Environ. Geochem. Health 2009, 31, 707–715. [Google Scholar] [CrossRef]
- Obeng-Gyasi, E. Sources of lead exposure in various countries. Rev. Environ. Health 2019, 34, 25–34. [Google Scholar] [CrossRef]
- Garelick, H.; Jones, H.; Dybowska, A.; Valsamijones, E. Arsenic Pollution Sources. Rev. Environ. Contam. Toxicol. 2008, 197, 17–60. [Google Scholar]
- Giaccio, L.; Cicchella, D.; De Vivo, B.; Lombardi, G.; De Rosa, M. Does heavy metals pollution affects semen quality in men? A case of study in the metropolitan area of Naples (Italy). J. Geochem. Explor. 2012, 112, 218–225. [Google Scholar] [CrossRef]
- Olawoyin, R.; Oyewole, S.A.; Grayson, R.L. Potential risk effect from elevated levels of soil heavy metals on human health in the Niger delta. Ecotoxicol. Environ. Saf. 2012, 85, 120–130. [Google Scholar] [CrossRef] [PubMed]
- Järup, L. Hazards of heavy metal contamination. Br. Med. Bull. 2003, 68, 167–182. [Google Scholar] [CrossRef] [PubMed] [Green Version]
- Gulson, B.; Jameson, C.; Mahaffey, K.; Mizon, K.; Korsch, M.; Vimpani, G. Pregnancy increases mobilization of lead from maternal skeleton. J. Lab. Clin. Med. 1997, 130, 51–62. [Google Scholar] [CrossRef]
- Hu, H.; Tellez-Rojo, M.M.; Bellinger, D.; Smith, D.; Ettinger, A.S.; Lamadrid-Figueroa, H.; Schwartz, J.; Schnaas, L.; Mercado-García, A.; Hernandez-Avila, M. Fetal Lead Exposure at Each Stage of Pregnancy as a Predictor of Infant Mental Development. Environ. Health Perspect. 2006, 114, 1730–1735. [Google Scholar] [CrossRef] [PubMed]
- Reuben, A.; Caspi, A.; Belsky, D.W.; Broadbent, J.; Harrington, H.; Sugden, K.; Houts, R.M.; Ramrakha, S.; Poulton, R.; Moffitt, T.E. Association of childhood blood-lead levels with cognitive function and socioeconomic status at age 38 years and with IQ change and socioeconomic mobility between childhood and adulthood. JAMA 2017, 317, 1244–1251. [Google Scholar] [CrossRef] [PubMed]
- Lanphear, B.P.; Rauch, S.; Auinger, P.; Allen, R.W.; Hornung, R.W. Low-level lead exposure and mortality in US adults: A population-based cohort study. Lancet Public Health 2018, 3, e177–e184. [Google Scholar] [CrossRef]
- Obeng-Gyasi, E.; Armijos, R.X.; Weigel, M.M.; Filippelli, G.M.; Sayegh, M.A. Cardiovascular-Related Outcomes in U.S. Adults Exposed to Lead. Int. J. Environ. Res. Public Health 2018, 15, 759. [Google Scholar] [CrossRef] [PubMed]
- Harari, F.; Sallsten, G.; Christensson, A.; Petkovic, M.; Hedblad, B.; Forsgard, N.; Melander, O.; Nilsson, P.M.; Borné, Y.; Engström, G.; et al. Blood Lead Levels and Decreased Kidney Function in a Population-Based Cohort. Am. J. Kidney Dis. 2018, 72, 381–389. [Google Scholar] [CrossRef] [PubMed] [Green Version]
- Lin-Tan, D.T.; Yu, C.C.; Lin, J.L.; Hsu, K.H. Environmental Lead Exposure and Progression of Chronic Renal Diseases in Patients without Diabetes. N. Engl. J. Med. 2003, 348, 277–286. [Google Scholar] [CrossRef] [PubMed]
- Can, S.; Bagci, C.; Ozaslan, M.; Bozkurt, A.I.; Cengiz, B.; Cakmak, E.A.; Tarakçioglu, M. Occupational lead exposure effecton liver functions and biochemical parameters. Acta Physiol. Hung. 2008, 95, 395–403. [Google Scholar] [CrossRef] [PubMed]
- Driscoll, C.T.; Mason, R.P.; Chan, H.M.; Jacob, D.J.; Pirrone, N. Mercury as a Global Pollutant: Sources, Pathways, and Effects. Environ. Sci. Technol. 2013, 47, 4967–4983. [Google Scholar] [CrossRef] [PubMed]
- Li, Z.; Ma, Z.; van der Kuijp, T.J.; Yuan, Z.; Huang, L. A review of soil heavy metal pollution from mines in China: Pollution and health risk assessment. Sci. Total Environ. 2014, 468, 843–853. [Google Scholar] [CrossRef] [PubMed]
- Wu, Y.G.; Xu, Y.N.; Zhang, J.H.; Hu, S.H. Evaluation of ecological risk and primary empirical research on heavy metals in polluted soil over Xiaoqinling gold mining region, Shaanxi, China. Trans. Nonferrous Met. Soc. China 2010, 20, 688–694. [Google Scholar] [CrossRef]
- Li, Y.; Wang, H.; Wang, H.; Yin, F.; Yang, X.; Hu, Y. Heavy metal pollution in vegetables grown in the vicinity of a multi-metal mining area in Gejiu, China: Total concentrations, speciation analysis, and health risk. Environ. Sci. Pollut. Res. 2014, 21, 12569–12582. [Google Scholar] [CrossRef] [PubMed]
- Zhao, R.X.; Guo, W.; Sun, W.H.; Xue, S.L.; Gao, B.; Sun, W. Distribution Characteristic and Assessment of Soil Heavy Metal Pollution around Baotou Tailings in Inner Mongolia, China. Trans. Tech. Publ. 2012, 356, 2730–2736. [Google Scholar] [CrossRef]
- Zhang, L.; Jin, Y.; Lu, J.; Zhang, C. Concentration, distribution and bioaccumulation of mercury in the Xunyang mercury mining area, Shaanxi Province, China. Appl. Geochem. 2009, 24, 950–956. [Google Scholar] [CrossRef]
- Qiu, G.; Feng, X.; Meng, B.; Sommar, J.; Gu, C. Environmental geochemistry of an active Hg mine in Xunyang, Shaanxi Province, China. Appl. Geochem. 2012, 27, 2280–2288. [Google Scholar] [CrossRef]
- Chen, Y.Y.; Wang, J.; Gao, W.; Sun, X.J.; Xu, S.Y. Comprehensive analysis of heavy metals in soils from Baoshan District, Shanghai: A heavily industrialized area in China. Environ. Earth Sci. 2012, 67, 2331–2343. [Google Scholar] [CrossRef]
- Environmental Protection Agency (USEPA). Acid Digestion of Sludges, Solids and Soils. Available online: https://www.epa.gov/sites/production/files/2015-06/documents/epa-3050b.pdf (accessed on 19 February 2017).
- Lin, C.; He, M.; Zhou, Y.; Guo, W.; Yang, Z. Distribution and contamination assessment of heavy metals in sediment of the Second Songhua River, China. Environ. Monit. Assess. 2008, 137, 329–342. [Google Scholar] [CrossRef]
- Kusin, F.M.; Azani, N.N.M.; Hasan, S.N.M.S.; Sulong, N.A. Distribution of heavy metals and metalloid in surface sediments of heavily-mined area for bauxite ore in Pengerang, Malaysia and associated risk assessment. Catena 2018, 165, 454–464. [Google Scholar] [CrossRef]
- Zhao, L.; Hu, Y.M.; Zhou, W.; Liu, Z.H.; Pan, Y.C.; Shi, Z.; Wang, L.; Wang, G.X. Estimation Methods for Soil Mercury Content Using Hyperspectral Remote Sensing. Sustainability 2018, 10, 2474. [Google Scholar] [CrossRef]
- Lu, S.; Wang, Y.; Teng, Y.; Yu, X. Heavy metal pollution and ecological risk assessment of the paddy soils near a zinc—Lead mining area in Human. Environ. Monit. Assess. 2015, 187, 627. [Google Scholar] [CrossRef] [PubMed]
- Hakanson, L. An ecological risk index for aquatic pollution control: A sediment ecological approach. Water Res. 1980, 14, 975–1001. [Google Scholar] [CrossRef]
- Douay, F.; Pelfrêne, A.; Planque, J.; Fourrier, H.; Richard, A.; Roussel, H.; Girondelot, B. Assessment of potential health risk for inhabitants living near a former lead smelter, part 1: Metal concentrations in soils, agricultural crops, and homegrown vegetables. Environ. Monit. Assess. 2013, 185, 3665–3680. [Google Scholar] [CrossRef] [PubMed]
- Luo, X.S.; Ding, J.; Xu, B.; Wang, Y.J.; Li, H.B.; Yu, S. Incorporating bioaccessibility into human health risk assessments of heavy metals in urban park soils. Sci. Total Environ. 2012, 424, 88–96. [Google Scholar] [CrossRef] [PubMed]
- Gu, Y.G.; Gao, Y.P.; Lin, Q. Contamination, bioaccessibility and human health risk of heavy metals in exposed-lawn soils from 28 urban parks in southern China’s largest city, Guangzhou. Appl. Geochem. 2016, 67, 52–58. [Google Scholar] [CrossRef]
- US Environmental Protection Agency (USEPA). Integrated Risk Information System of the US Environmental Protection Agency; US Environmental Protection Agency (USEPA): Washington, DC, USA, 2012.
- US Environmental Protection Agency (USEPA). Supplemental Guidance for Developing Soil Screening Levels for Superfund Sites, OSWER 9355; Office of Emergency and Remedial Response: Washington, DC, USA, 2002.
- Yuswir, N.S.; Praveena, S.M.; Aris, A.Z.; Ismail, S.N.S.; Hashim, Z. Health Risk Assessment of Heavy Metal in Urban Surface Soil (Klang District, Malaysia). Bull. Environ. Contam. Toxicol. 2015, 95, 80–89. [Google Scholar] [CrossRef] [PubMed]
- Taylor, D. An outline of the geology of the Bukit Ibam orebody, Rompin, Pahang. Bull. Geol. Soc. Malays. 1971, 4, 71–89. [Google Scholar] [CrossRef]
- Benhaddya, M.L.; Hadjel, M. Spatial distribution and contamination assessment of heavy metals in surface soils of Hassi Messaoud, Algeria. Environ. Earth Sci. 2014, 71, 1473–1486. [Google Scholar] [CrossRef]
- Fantozzi, L.; Ferrara, R.; Dini, F.; Tamburello, L.; Pirrone, N.; Sprovieri, F. Study on the reduction of atmospheric mercury emissions from mine waste enriched soils through native grass cover in the Mt. Amiata region of Italy. Environ. Res. 2013, 125, 69–74. [Google Scholar] [CrossRef] [PubMed]
- Gray, J.E.; Theodorakos, P.M.; Fey, D.L.; Krabbenhoft, D.P. Mercury concentrations and distribution in soil, water, mine waste leachates, and air in and around mercury mines in the Big Bend region, Texas, USA. Environ. Geochem. Health 2015, 37, 35–48. [Google Scholar] [CrossRef]
- Tarras-Wahlberg, N. Environmental management of small-scale and artisanal mining: The Portovelo-Zaruma goldmining area, southern Ecuador. J. Environ. Manag. 2002, 65, 165–179. [Google Scholar] [CrossRef]
- Burges, A.; Epelde, L.; Garbisu, C. Impact of repeated single-metal and multimetal pollution events on soil quality. Chemosphere 2015, 120, 8–15. [Google Scholar] [CrossRef] [PubMed]
- Xu, Z.Q.; Ni, S.J.; Tuo, X.G.; Zhang, C.J. Calculation of heavy metals’ toxicity coefficient in the evaluation of potential ecological risk index. Environ. Sci. Technol. 2008, 31, 112–115. [Google Scholar]
- Liu, S.J.; Jiang, J.Y.; Wang, S.; Guo, Y.P.; Ding, H. Assessment of water-soluble thiourea-formaldehyde (WTF) resin for stabilization/solidification (S/S) of heavy metal contaminated soils. J. Hazard. Mater. 2018, 346, 167–173. [Google Scholar] [CrossRef] [PubMed]
- Chabukdhara, M.; Nema, A.K. Heavy metals assessment in urban soil around industrial clusters in Ghaziabad, India: Probabilistic health risk approach. Ecotoxicol. Environ. Saf. 2013, 87, 57–64. [Google Scholar] [CrossRef] [PubMed]
- Chen, H.; Teng, Y.; Lu, S.; Wang, Y.; Wu, J.; Wang, J. Source apportionment and health risk assessment of trace metals in surface soils of Beijing metropolitan, China. Chemosphere 2016, 144, 1002–1011. [Google Scholar] [CrossRef] [PubMed]
- Xiao, Q.; Zong, Y.; Lu, S. Assessment of heavy metal pollution and human health risk in urban soils of steel industrial city (Anshan), Liaoning, Northeast China. Ecotox. Environ. Saf. 2015, 120, 377–385. [Google Scholar]
- Yang, J.; Chen, T.; Lu, L.; Tang, Y. In Vitro Health Risk Assessment of Ingesting Metal-Enriched Soils and Dusts in a Chinese Mining City. Hum. Ecol. Risk Assess. Int. J. 2015, 21, 1–17. [Google Scholar] [CrossRef]
- Diami, S.M.; Kusin, F.M.; Madzin, Z. Potential ecological and human health risks of heavy metals in surface soils associated with iron ore mining in Pahang, Malaysia. Environ. Sci. Pollut. Res. 2016, 23, 21086–21097. [Google Scholar] [CrossRef] [PubMed]
- Jiang, Y.; Chao, S.; Zhang, A.; Cao, H.; Liu, J.; Yang, Y.; Chen, Y. Source apportionment and health risk assessment of heavy metals in soil for a township in Jiangsu Province, China. Chemosphere 2017, 168, 1658–1668. [Google Scholar] [CrossRef] [PubMed]
- Fryer, M.; Collins, C.D.; Ferrier, H.; Colvile, R.N.; Nieuwenhuijsen, M.J. Human exposure modelling for chemical risk assessment: A review of current approaches and research and policy implications. Environ. Sci. Policy 2006, 9, 261–274. [Google Scholar] [CrossRef]
- Ying, L.; Lei, S.; Chen, X. Assessment of heavy metal pollution and human health risk in urban soils of the coal mining city, Huainan, East China. Hum. Ecol. Risk Assess. Int. J. 2016, 22, 1359–1374. [Google Scholar] [CrossRef]


| IGeo | Classification | IGeo | Classification |
|---|---|---|---|
| IGeo < 0 | Uncontaminated | 2 ≤ IGeo< 3 | Moderately to strongly contaminated |
| 0 ≤ IGeo < 1 | Uncontaminated to moderately contaminated | 3 ≤ IGeo < 4 | Strongly contaminated |
| 1 ≤ IGeo < 2 | Moderately contaminated | 4 ≤ IGeo < 5 | Strongly to extremely contaminated |
| IGeo ≥ 6 | Extremely contaminated |
| Element | Cd | Cr | Hg | As | Pb | Cu | Zn | Ni |
|---|---|---|---|---|---|---|---|---|
| (mg/kg) | 0.76 | 62.5 | 0.063 | 11.1 | 21.4 | 21.4 | 69.4 | 28.8 |
| 30 | 2 | 40 | 10 | 5 | 5 | 1 | 5 |
| Ecological Risk | Low Risk(A) | Moderate Risk (B) | Considerable Risk (C) | High Risk(D) | Significantly High Risk (E) |
|---|---|---|---|---|---|
| <40 | 40–80 | 80–160 | 160–320 | >320 | |
| RI | <150 | 150–300 | 300–600 | ≥600 | -- |
| Parameter | Company | Value | |
|---|---|---|---|
| Children | Adult | ||
| IngR | mg/d | 200 | 100 |
| EF | d/year | 350 | 350 |
| ED | years | 6 | 25 |
| BW | kg | 15.9 | 56.8 |
| AT | days | 26,280 | 9125 |
| InhR | m3/d | 7.5 | 14.5 |
| PEF | m3/kg | 1.36 × 10⁹ | 1.36 × 10⁹ |
| SA | cm2 | 2800 | 5700 |
| SL | mg/cm2 | 0.2 | 0.07 |
| ABF | none | 0.001 | 0.01 |
| Elements | RfD (mg·(kg·d)−1) | ||
|---|---|---|---|
| Intake | Inhalation | Skin Contact | |
| Cd | 1.00 × 10⁻³ | 1.00 × 10⁻⁵ | 1.00 × 10⁻⁵ |
| Pb | 3.50 × 10⁻³ | 3.52 × 10⁻³ | 5.25 × 10⁻⁴ |
| Cr | 3.00 × 10⁻³ | 2.86 × 10⁻⁵ | 6.00 × 10⁻⁵ |
| Ni | 2.00 × 10⁻² | 2.06 × 10⁻² | 5.40 × 10⁻³ |
| Cu | 4.00 × 10⁻² | 4.02 × 10⁻³ | 1.20 × 10⁻² |
| Zn | 3.00 × 10⁻¹ | 3.00 × 10⁻¹ | 6.00 × 10⁻² |
| Hg | 3.00 × 10⁻⁴ | 8.57 × 10⁻⁵ | 2.10 × 10⁻⁵ |
| As | 3.00 × 10⁻⁴ | 1.23 × 10⁻⁴ | 1.23 × 10⁻⁴ |
| Site | D | G | Q | N | |
|---|---|---|---|---|---|
| Cr | 3.36 | 12.16 | 17.25 | 12.19 | |
| Level | A | A | A | A | |
| Ni | 12.33 | 41.32 | 40.63 | 38.37 | |
| Level | A | B | B | A | |
| Cu | 7.24 | 8.88 | 8.88 | 11.21 | |
| Level | A | A | A | A | |
| Zn | 1.48 | 2.19 | 1.51 | 4.71 | |
| Level | A | A | A | A | |
| Cd | 35.72 | 29.84 | 31.42 | 58.07 | |
| Level | A | A | A | B | |
| Pb | 7.68 | 16.45 | 37.4 | 77.03 | |
| Level | A | A | A | B | |
| As | 64.86 | 25.23 | 15.32 | 14.41 | |
| Level | B | A | A | A | |
| Hg | 59.05 | 2449.52 | 2492.7 | 62.22 | |
| Level | B | E | E | B | |
| RI | 134.54 | 2576.80 | 2667.19 | 340.83 | |
| ADDing | ADDinh | ADDderm | HQing | HQinh | HQderm | HI | ||
|---|---|---|---|---|---|---|---|---|
| Adult | ||||||||
| Cr | D | 1.05 × 10⁻⁴ | 2.91 × 10⁻¹⁵ | 2.96 × 10⁻⁷ | 3.50 × 10⁻² | 1.02 × 10⁻¹⁰ | 4.93 × 10⁻³ | 3.99 × 10⁻² |
| G | 3.82 × 10⁻⁴ | 1.05 × 10⁻¹⁴ | 1.07 × 10⁻⁶ | 1.34 × 10⁻¹ | 3.68 × 10⁻¹⁰ | 1.78 × 10⁻² | 1.51 × 10⁻¹ | |
| Q | 5.42 × 10⁻⁴ | 1.49 × 10⁻¹⁴ | 1.52 × 10⁻⁶ | 1.81 × 10⁻¹ | 5.22 × 10⁻¹⁰ | 2.53 × 10⁻² | 2.06 × 10⁻¹ | |
| N | 3.83 × 10⁻⁴ | 1.06 × 10⁻¹⁴ | 1.07 × 10⁻⁶ | 1.28 × 10⁻¹ | 3.69 × 10⁻¹⁰ | 1.79 × 10⁻² | 1.46 × 10⁻¹ | |
| Ni | D | 7.11 × 10⁻⁵ | 1.97 × 10⁻¹⁵ | 2.00 × 10⁻⁷ | 3.55 × 10⁻³ | 9.55 × 10⁻¹⁴ | 3.70 × 10⁻⁵ | 3.59 × 10⁻³ |
| G | 2.39 × 10⁻⁴ | 6.60 × 10⁻¹⁵ | 6.70 × 10⁻⁷ | 1.20 × 10⁻² | 3.20 × 10⁻¹³ | 1.24 × 10⁻⁴ | 1.21 × 10⁻² | |
| Q | 2.35 × 10⁻⁴ | 6.49 × 10⁻¹⁵ | 6.59 × 10⁻⁷ | 1.18 × 10⁻² | 3.15 × 10⁻¹³ | 1.22 × 10⁻⁴ | 1.19 × 10⁻² | |
| N | 2.22 × 10⁻⁴ | 6.13 × 10⁻¹⁵ | 6.22 × 10⁻⁷ | 1.11 × 10⁻² | 2.97 × 10⁻¹³ | 1.15 × 10⁻⁴ | 1.12 × 10⁻² | |
| Cu | D | 3.09 × 10⁻⁵ | 8.59 × 10⁻¹⁶ | 8.72 × 10⁻⁸ | 7.72 × 10⁻⁴ | 2.14 × 10⁻¹⁴ | 7.27 × 10⁻⁶ | 7.79 × 10⁻⁴ |
| G | 3.82 × 10⁻⁵ | 1.05 × 10⁻¹⁵ | 1.07 × 10⁻⁷ | 9.55 × 10⁻⁴ | 2.62 × 10⁻¹⁴ | 8.91 × 10⁻⁶ | 9.64 × 10⁻⁴ | |
| Q | 3.82 × 10⁻⁵ | 1.05 × 10⁻¹⁵ | 1.07 × 10⁻⁷ | 9.55 × 10⁻⁴ | 2.62 × 10⁻¹⁴ | 8.91 × 10⁻⁶ | 9.64 × 10⁻⁴ | |
| N | 4.82 × 10⁻⁵ | 1.33 × 10⁻¹⁵ | 1.35 × 10⁻⁷ | 1.21 × 10⁻³ | 3.31 × 10⁻¹⁴ | 1.13 × 10⁻⁵ | 1.22 × 10⁻³ | |
| Zn | D | 1.03 × 10⁻⁴ | 2.85 × 10⁻¹⁵ | 2.90 × 10⁻⁷ | 3.45 × 10⁻⁴ | 9.52 × 10⁻¹⁵ | 4.83 × 10⁻⁶ | 3.49 × 10⁻⁴ |
| G | 1.53 × 10⁻⁴ | 4.21 × 10⁻¹⁵ | 4.28 × 10⁻⁷ | 3.82 × 10⁻³ | 1.05 × 10⁻¹³ | 7.13 × 10⁻⁶ | 3.83 × 10⁻³ | |
| Q | 1.06 × 10⁻⁴ | 2.91 × 10⁻¹⁵ | 2.96 × 10⁻⁷ | 3.52 × 10⁻⁴ | 9.70 × 10⁻¹⁵ | 4.93 × 10⁻⁶ | 3.57 × 10⁻⁴ | |
| N | 3.29 × 10⁻⁴ | 9.06 × 10⁻¹⁵ | 9.20 × 10⁻⁷ | 1.10 × 10⁻³ | 3.02 × 10⁻¹⁴ | 1.53 × 10⁻⁵ | 1.11 × 10⁻³ | |
| As | D | 7.27 × 10⁻⁵ | 2.00 × 10⁻¹⁵ | 2.03 × 10⁻⁷ | 2.42 × 10⁻¹ | 1.62 × 10⁻¹¹ | 1.65 × 10⁻³ | 2.44 × 10⁻¹ |
| G | 2.81 × 10⁻⁵ | 7.76 × 10⁻¹⁶ | 7.88 × 10⁻⁸ | 9.38 × 10⁻⁴ | 6.31 × 10⁻¹² | 6.41 × 10⁻⁴ | 1.64 × 10⁻³ | |
| Q | 1.71 × 10⁻⁵ | 4.71 × 10⁻¹⁶ | 4.78 × 10⁻⁸ | 5.70 × 10⁻² | 3.83 × 10⁻¹² | 3.89 × 10⁻⁴ | 5.73 × 10⁻² | |
| N | 1.61 × 10⁻⁵ | 4.43 × 10⁻¹⁶ | 4.50 × 10⁻⁸ | 5.36 × 10⁻² | 3.61 × 10⁻¹² | 3.66 × 10⁻⁴ | 5.40 × 10⁻² | |
| Cd | D | 9.10 × 10⁻⁷ | 2.51 × 10⁻¹⁷ | 2.55 × 10⁻⁹ | 9.10 × 10⁻⁴ | 2.51 × 10⁻¹² | 2.55 × 10⁻⁴ | 1.16 × 10⁻³ |
| G | 7.60 × 10⁻⁷ | 2.10 × 10⁻¹⁷ | 2.13 × 10⁻⁹ | 2.53 × 10⁻⁴ | 2.10 × 10⁻¹² | 2.13 × 10⁻⁴ | 2.45 × 10⁻⁴ | |
| Q | 8.00 × 10⁻⁷ | 2.21 × 10⁻¹⁷ | 2.24 × 10⁻⁹ | 8.00 × 10⁻⁴ | 2.21 × 10⁻¹² | 2.24 × 10⁻⁴ | 1.02 × 10⁻³ | |
| N | 1.48 × 10⁻⁶ | 4.08 × 10⁻¹⁷ | 4.14 × 10⁻⁹ | 1.48 × 10⁻³ | 4.08 × 10⁻¹² | 4.14 × 10⁻⁴ | 1.89 × 10⁻³ | |
| Pb | D | 3.31 × 10⁻⁵ | 9.12 × 10⁻¹⁶ | 9.26 × 10⁻⁸ | 9.45 × 10⁻³ | 2.59 × 10⁻¹³ | 1.76 × 10⁻⁴ | 9.62 × 10⁻³ |
| G | 7.08 × 10⁻⁵ | 1.95 × 10⁻¹⁵ | 1.98 × 10⁻⁷ | 2.02 × 10⁻² | 5.54 × 10⁻¹³ | 3.77 × 10⁻⁴ | 2.10 × 10⁻² | |
| Q | 1.61 × 10⁻⁴ | 4.44 × 10⁻¹⁵ | 4.50 × 10⁻⁷ | 4.60 × 10⁻² | 1.26 × 10⁻¹² | 8.58 × 10⁻⁴ | 4.68 × 10⁻² | |
| N | 3.31 × 10⁻⁴ | 9.14 × 10⁻¹⁵ | 9.28 × 10⁻⁷ | 9.47 × 10⁻² | 2.60 × 10⁻¹² | 1.77 × 10⁻³ | 9.65 × 10⁻² | |
| Hg | D | 9.39 × 10⁻⁸ | 2.58 × 10⁻¹⁸ | 2.62 × 10⁻¹⁰ | 3.13 × 10⁻⁴ | 3.01 × 10⁻¹⁴ | 1.25 × 10⁻⁵ | 3.25 × 10⁻⁴ |
| G | 3.88 × 10⁻⁶ | 1.07 × 10⁻¹⁶ | 1.09 × 10⁻⁸ | 1.29 × 10⁻² | 1.25 × 10⁻¹² | 5.17 × 10⁻⁴ | 1.34 × 10⁻² | |
| Q | 3.95 × 10⁻⁶ | 1.09 × 10⁻¹⁶ | 1.10 × 10⁻⁸ | 1.32 × 10⁻² | 1.27 × 10⁻¹² | 5.26 × 10⁻⁴ | 1.37 × 10⁻² | |
| N | 9.85 × 10⁻⁸ | 2.72 × 10⁻¹⁸ | 2.76 × 10⁻¹⁰ | 3.28 × 10⁻⁴ | 3.17 × 10⁻¹⁴ | 1.31 × 10⁻⁵ | 3.41 × 10⁻⁴ | |
| Children | ||||||||
| Cr | D | 1.77 × 10⁻⁴ | 1.89 × 10⁻¹⁴ | 7.07 × 10⁻⁶ | 5.91 × 10⁻¹ | 6.61 × 10⁻¹⁰ | 1.18 × 10⁻¹ | 1.77 × 10⁻¹ |
| G | 6.42 × 10⁻⁴ | 6.69 × 10⁻¹⁴ | 2.56 × 10⁻⁵ | 2.14 × 10⁻¹ | 2.34 × 10⁻⁹ | 4.27 × 10⁻¹ | 6.41 × 10⁻¹ | |
| Q | 9.10 × 10⁻⁴ | 9.49 × 10⁻¹⁴ | 3.63 × 10⁻⁵ | 6.05 × 10⁻¹ | 3.32 × 10⁻⁹ | 3.03 × 10⁻¹ | 9.08 × 10⁻¹ | |
| N | 6.43 × 10⁻⁴ | 6.86 × 10⁻¹⁴ | 2.57 × 10⁻⁵ | 4.28 × 10⁻¹ | 2.40 × 10⁻⁹ | 2.14 × 10⁻¹ | 6.42 × 10⁻¹ | |
| Ni | D | 1.20 × 10⁻⁴ | 1.28 × 10⁻¹⁴ | 4.78 × 10⁻⁶ | 5.99 × 10⁻³ | 6.20 × 10⁻¹³ | 8.86 × 10⁻⁴ | 6.88 × 10⁻³ |
| G | 4.02 × 10⁻⁴ | 4.19 × 10⁻¹⁴ | 1.60 × 10⁻⁵ | 2.01 × 10⁻² | 2.03 × 10⁻¹² | 2.97 × 10⁻³ | 2.30 × 10⁻² | |
| Q | 3.95 × 10⁻⁴ | 4.12 × 10⁻¹⁴ | 1.58 × 10⁻⁵ | 1.98 × 10⁻² | 2.00 × 10⁻¹² | 2.92 × 10⁻³ | 2.27 × 10⁻² | |
| N | 3.73 × 10⁻⁴ | 3.98 × 10⁻¹⁴ | 1.49 × 10⁻⁵ | 1.87 × 10⁻² | 1.93 × 10⁻¹² | 2.76 × 10⁻³ | 2.14 × 10⁻² | |
| Cu | D | 5.23 × 10⁻⁵ | 5.58 × 10⁻¹⁵ | 2.09 × 10⁻⁶ | 1.31 × 10⁻³ | 1.39 × 10⁻¹³ | 1.74 × 10⁻⁴ | 1.48 × 10⁻³ |
| G | 6.42 × 10⁻⁵ | 6.69 × 10⁻¹⁵ | 2.56 × 10⁻⁶ | 1.60 × 10⁻³ | 1.66 × 10⁻¹³ | 2.13 × 10⁻⁴ | 1.80 × 10⁻³ | |
| Q | 6.42 × 10⁻⁵ | 6.69 × 10⁻¹⁵ | 2.56 × 10⁻⁶ | 1.60 × 10⁻³ | 1.66 × 10⁻¹³ | 2.13 × 10⁻⁴ | 1.82 × 10⁻³ | |
| N | 8.10 × 10⁻⁵ | 8.64 × 10⁻¹⁵ | 3.23 × 10⁻⁶ | 2.03 × 10⁻³ | 2.15 × 10⁻¹³ | 2.69 × 10⁻⁴ | 2.30 × 10⁻³ | |
| Zn | D | 1.74 × 10⁻⁴ | 1.85 × 10⁻¹⁴ | 6.94 × 10⁻⁶ | 5.80 × 10⁻⁴ | 6.18 × 10⁻¹⁴ | 1.16 × 10⁻⁴ | 6.95 × 10⁻⁴ |
| G | 2.57 × 10⁻⁴ | 2.68 × 10⁻¹⁴ | 1.02 × 10⁻⁵ | 8.55 × 10⁻⁴ | 6.66 × 10⁻¹³ | 1.71 × 10⁻⁴ | 1.00 × 10⁻³ | |
| Q | 1.77 × 10⁻⁴ | 1.85 × 10⁻¹⁴ | 7.07 × 10⁻⁶ | 5.91 × 10⁻⁴ | 6.16 × 10⁻¹⁴ | 1.18 × 10⁻⁴ | 7.09 × 10⁻⁴ | |
| N | 5.52 × 10⁻⁴ | 5.89 × 10⁻¹⁴ | 2.20 × 10⁻⁵ | 1.84 × 10⁻³ | 1.96 × 10⁻¹³ | 3.67 × 10⁻⁴ | 2.21 × 10⁻³ | |
| As | D | 1.22 × 10⁻⁴ | 1.30 × 10⁻¹⁴ | 4.85 × 10⁻⁶ | 4.05 × 10⁻¹ | 1.05 × 10⁻¹⁰ | 3.94 × 10⁻² | 4.45 × 10⁻¹ |
| G | 4.73 × 10⁻⁵ | 4.93 × 10⁻¹⁵ | 1.89 × 10⁻⁶ | 1.58 × 10⁻¹ | 4.01 × 10⁻¹¹ | 1.53 × 10⁻² | 1.70 × 10⁻¹ | |
| Q | 2.87 × 10⁻⁵ | 2.99 × 10⁻¹⁵ | 1.15 × 10⁻⁶ | 9.57 × 10⁻² | 2.43 × 10⁻¹¹ | 9.31 × 10⁻³ | 1.05 × 10⁻¹ | |
| N | 2.70 × 10⁻⁵ | 2.88 × 10⁻¹⁵ | 1.08 × 10⁻⁶ | 9.00 × 10⁻² | 2.34 × 10⁻¹¹ | 8.76 × 10⁻³ | 9.88 × 10⁻² | |
| Cd | D | 1.53 × 10⁻⁶ | 1.63 × 10⁻¹⁶ | 6.10 × 10⁻⁸ | 6.10 × 10⁻³ | 1.63 × 10⁻¹¹ | 1.53 × 10⁻³ | 7.62 × 10⁻³ |
| G | 1.28 × 10⁻⁶ | 1.33 × 10⁻¹⁶ | 5.09 × 10⁻⁸ | 5.09 × 10⁻³ | 1.33 × 10⁻¹¹ | 1.28 × 10⁻³ | 6.41 × 10⁻³ | |
| Q | 1.34 × 10⁻⁶ | 1.40 × 10⁻¹⁶ | 5.36 × 10⁻⁸ | 5.36 × 10⁻³ | 1.40 × 10⁻¹¹ | 1.34 × 10⁻³ | 6.71 × 10⁻³ | |
| N | 2.48 × 10⁻⁶ | 2.65 × 10⁻¹⁶ | 9.91 × 10⁻⁸ | 9.91 × 10⁻³ | 2.65 × 10⁻¹¹ | 2.48 × 10⁻³ | 1.24 × 10⁻² | |
| Pb | D | 5.55 × 10⁻⁵ | 5.92 × 10⁻¹⁵ | 2.22 × 10⁻⁶ | 1.59 × 10⁻² | 1.68 × 10⁻¹² | 4.22 × 10⁻³ | 2.01 × 10⁻² |
| G | 1.19 × 10⁻⁴ | 1.24 × 10⁻¹⁴ | 4.74 × 10⁻⁶ | 3.40 × 10⁻² | 3.52 × 10⁻¹² | 9.03 × 10⁻³ | 4.32 × 10⁻² | |
| Q | 2.70 × 10⁻⁴ | 2.82 × 10⁻¹⁴ | 1.08 × 10⁻⁵ | 7.72 × 10⁻² | 8.01 × 10⁻¹² | 2.05 × 10⁻² | 9.77 × 10⁻² | |
| N | 5.57 × 10⁻⁴ | 5.93 × 10⁻¹⁴ | 2.22 × 10⁻⁵ | 1.59 × 10⁻¹ | 1.69 × 10⁻¹¹ | 4.23 × 10⁻² | 2.01 × 10⁻¹ | |
| Hg | D | 1.57 × 10⁻⁷ | 1.67 × 10⁻¹⁷ | 6.26 × 10⁻⁹ | 5.23 × 10⁻⁴ | 1.95 × 10⁻¹³ | 2.98 × 10⁻⁴ | 8.22 × 10⁻⁴ |
| G | 6.51 × 10⁻⁶ | 6.79 × 10⁻¹⁶ | 2.60 × 10⁻⁷ | 2.17 × 10⁻² | 7.93 × 10⁻¹² | 1.24 × 10⁻² | 3.42 × 10⁻² | |
| Q | 6.63 × 10⁻⁶ | 6.91 × 10⁻¹⁶ | 2.64 × 10⁻⁷ | 2.21 × 10⁻² | 8.07 × 10⁻¹² | 1.26 × 10⁻² | 3.47 × 10⁻² | |
| N | 1.65 × 10⁻⁷ | 1.76 × 10⁻¹⁷ | 6.60 × 10⁻⁹ | 5.51 × 10⁻⁴ | 2.06 × 10⁻¹³ | 3.14 × 10⁻⁴ | 8.66 × 10⁻⁴ |
| Children | |||||
|---|---|---|---|---|---|
| Metal Element | Site | CRIng | CRInh | CRderm | LCR (HI) |
| Cr | D | 8.86 × 10⁻⁵ | 9.45 × 10⁻¹⁵ | 3.54 × 10⁻⁶ | 9.22 × 10⁻⁵ |
| G | 3.21 × 10⁻⁴ | 3.35 × 10⁻¹⁴ | 1.28 × 10⁻⁵ | 3.34 × 10⁻⁴ | |
| Q | 4.55 × 10⁻⁴ | 4.75 × 10⁻¹⁴ | 1.82 × 10⁻⁵ | 4.73 × 10⁻⁴ | |
| N | 3.22 × 10⁻⁴ | 3.43 × 10⁻¹⁴ | 1.28 × 10⁻⁵ | 3.34 × 10⁻⁴ | |
| As | D | 1.82 × 10⁻⁵ | 1.94 × 10⁻¹⁴ | 7.27 × 10⁻⁶ | 1.90 × 10⁻⁵ |
| G | 7.09 × 10⁻⁵ | 7.40 × 10⁻¹⁵ | 2.83 × 10⁻⁶ | 7.37 × 10⁻⁵ | |
| Q | 4.30 × 10⁻⁵ | 4.49 × 10⁻¹⁵ | 1.72 × 10⁻⁶ | 4.48 × 10⁻⁵ | |
| N | 4.05 × 10⁻⁵ | 4.32 × 10⁻¹⁵ | 1.62 × 10⁻⁶ | 4.21 × 10⁻⁵ | |
| Cd | D | 9.63 × 10⁻⁶ | 1.03 × 10⁻¹⁵ | 3.84 × 10⁻⁷ | 1.00 × 10⁻⁵ |
| G | 8.04 × 10⁻⁶ | 8.39 × 10⁻¹⁶ | 3.21 × 10⁻⁷ | 8.36 × 10⁻⁶ | |
| Q | 8.47 × 10⁻⁶ | 8.83 × 10⁻¹⁶ | 3.38 × 10⁻⁷ | 8.80 × 10⁻⁶ | |
| N | 1.56 × 10⁻⁵ | 1.67 × 10⁻¹⁵ | 6.24 × 10⁻⁷ | 1.63 × 10⁻⁵ | |
| Pb | D | 4.72 × 10⁻⁶ | 5.03 × 10⁻¹⁶ | 1.88 × 10⁻⁷ | 4.91 × 10⁻⁶ |
| G | 1.01 × 10⁻⁵ | 1.05 × 10⁻¹⁵ | 4.03 × 10⁻⁷ | 1.05 × 10⁻⁵ | |
| Q | 2.30 × 10⁻⁵ | 2.40 × 10⁻¹⁵ | 9.16 × 10⁻⁷ | 2.39 × 10⁻⁵ | |
| N | 4.73 × 10⁻⁵ | 5.04 × 10⁻¹⁵ | 1.89 × 10⁻⁶ | 4.92 × 10⁻⁵ | |
| Adults | |||||
| Metal Element | Site | CRIng | CRInh | CRderm | LCR (HI) |
| Cr | D | 5.25 × 10⁻⁵ | 1.46 × 10⁻¹⁵ | 1.48 × 10⁻⁷ | 5.26 × 10⁻⁵ |
| G | 1.91 × 10⁻⁴ | 5.27 × 10⁻¹⁵ | 5.35 × 10⁻⁷ | 1.92 × 10⁻⁴ | |
| Q | 2.71 × 10⁻⁴ | 7.47 × 10⁻¹⁵ | 7.58 × 10⁻⁷ | 2.72 × 10⁻⁴ | |
| N | 1.91 × 10⁻⁴ | 5.28 × 10⁻¹⁵ | 5.36 × 10⁻⁷ | 1.92 × 10⁻⁴ | |
| As | D | 1.09 × 10⁻⁵ | 2.99 × 10⁻¹⁵ | 3.04 × 10⁻⁷ | 1.09 × 10⁻⁵ |
| G | 4.22 × 10⁻⁵ | 1.16 × 10⁻¹⁵ | 1.18 × 10⁻⁷ | 4.23 × 10⁻⁵ | |
| Q | 2.56 × 10⁻⁵ | 7.07 × 10⁻¹⁶ | 7.18 × 10⁻⁸ | 2.57 × 10⁻⁵ | |
| N | 2.41 × 10⁻⁵ | 6.65 × 10⁻¹⁶ | 6.75 × 10⁻⁸ | 2.42 × 10⁻⁵ | |
| Cd | D | 5.73 × 10⁻⁶ | 1.58 × 10⁻¹⁶ | 1.60 × 10⁻⁸ | 5.75 × 10⁻⁶ |
| G | 4.79 × 10⁻⁶ | 1.32 × 10⁻¹⁶ | 1.34 × 10⁻⁸ | 4.80 × 10⁻⁶ | |
| Q | 5.04 × 10⁻⁶ | 1.39 × 10⁻¹⁶ | 1.41 × 10⁻⁸ | 5.05 × 10⁻⁶ | |
| N | 9.31 × 10⁻⁶ | 2.57 × 10⁻¹⁶ | 2.61 × 10⁻⁸ | 9.34 × 10⁻⁶ | |
| Pb | D | 2.81 × 10⁻⁶ | 7.75 × 10⁻¹⁷ | 7.87 × 10⁻⁹ | 2.82 × 10⁻⁶ |
| G | 6.01 × 10⁻⁶ | 1.66 × 10⁻¹⁶ | 1.68 × 10⁻⁸ | 6.03 × 10⁻⁶ | |
| Q | 1.37 × 10⁻⁵ | 3.77 × 10⁻¹⁶ | 3.83 × 10⁻⁸ | 1.37 × 10⁻⁵ | |
| N | 2.82 × 10⁻⁵ | 7.77 × 10⁻¹⁶ | 7.89 × 10⁻⁸ | 2.82 × 10⁻⁵ | |
© 2019 by the authors. Licensee MDPI, Basel, Switzerland. This article is an open access article distributed under the terms and conditions of the Creative Commons Attribution (CC BY) license (http://creativecommons.org/licenses/by/4.0/).
Share and Cite
Wang, N.; Han, J.; Wei, Y.; Li, G.; Sun, Y. Potential Ecological Risk and Health Risk Assessment of Heavy Metals and Metalloid in Soil around Xunyang Mining Areas. Sustainability 2019, 11, 4828. https://doi.org/10.3390/su11184828
Wang N, Han J, Wei Y, Li G, Sun Y. Potential Ecological Risk and Health Risk Assessment of Heavy Metals and Metalloid in Soil around Xunyang Mining Areas. Sustainability. 2019; 11(18):4828. https://doi.org/10.3390/su11184828
Chicago/Turabian StyleWang, Na, Jichang Han, Yang Wei, Gang Li, and Yingying Sun. 2019. "Potential Ecological Risk and Health Risk Assessment of Heavy Metals and Metalloid in Soil around Xunyang Mining Areas" Sustainability 11, no. 18: 4828. https://doi.org/10.3390/su11184828
APA StyleWang, N., Han, J., Wei, Y., Li, G., & Sun, Y. (2019). Potential Ecological Risk and Health Risk Assessment of Heavy Metals and Metalloid in Soil around Xunyang Mining Areas. Sustainability, 11(18), 4828. https://doi.org/10.3390/su11184828