Development of a Sustainability Index for an Energy Management System in Thailand

Division of Energy Management Technology, School of Energy, Environment and Materials, King Mongkut’s University of Technology Thonburi, 126 Pracha Uthit Road, Bang Mod, Thung Khru, Bangkok 10140, Thailand
*
Author to whom correspondence should be addressed.
Sustainability 2019, 11(17), 4587; https://doi.org/10.3390/su11174587
Submission received: 18 July 2019
/
Revised: 17 August 2019
/
Accepted: 20 August 2019
/
Published: 23 August 2019
(This article belongs to the Section Economic and Business Aspects of Sustainability)
Abstract
:The ISO 50001 energy management system (EnMS) standard was published in June 2011 and has been widely adopted by organizations from around the world, including Thailand. From 2014–2017, there was a continuous increase in the number of ISO 50001-certified companies in the East Asia and Pacific regions and, more broadly, the world, although this is not consistent with the number of companies that emerged during this period in Thailand. This information shows that the implementation of energy management in some companies may not be sustainable. This research offers a novel method for assessing the quality of energy management in the form of an energy management system sustainability index (EnMS SI) framework, presenting the economic, organizational, energy performance, and environmental aspects of sustainable energy management. Data collection, from a literature review of related research and the EnMS good practices, was implemented in order to select sustainability indicators and further develop a sustainability index for energy management. The analytic hierarchy process (AHP) and weighted arithmetic mean (WAM) were used to establish an EnMS SI. The study results were then assessed and validated using 31 ISO 50001-certified companies in Thailand. Direct interviews and questionnaires were used to obtain responses from energy management representatives. The studied data indicated that an EnMS SI framework can be used in qualitative analyses to effectively determine the sustainability of an EnMS. Significant sustainability indicators, consisting of continuous benefits, top management commitment, and long-term strategic planning, were found. The results also revealed that the EnMS in Thailand has been significantly economically weak. The EnMS SI framework is a tool for assessing energy management sustainability, which allows for the determination of an organization’s actual strengths and weaknesses. The benefits of this framework include the possibility of determining guidelines for correcting and improving the EnMS to achieve sustainability.
1. Introduction
An energy management system (EnMS) is an important tool adopted [1] in the industrial sector to improve efficiency [2] and to reduce costs such as in cement industy [3], the energy intensive industries in Turkey [4] and Taiwan [5], and in Serbian manufacturing [6], as well as in mitigating the environmental impact of climate change [7]. The use of fossil fuels for energy is still the major cause of environmental problems and climate change [8], especially in industrial production. The implementation of energy-efficient projects has had a direct impact on reducing costs in various industries, i.e., the cement industry in Colombia [3], China [9], and Taiwan [10], and pulp and paper [11], food [12], sugar [13], and foundry industries [14]. For example, operational guidelines associated with energy management, such as ANSI/MSE 2000:2008 [15], EN 16001 [16], and Carbon Trust (2011) [17], were employed to mobilize and improve energy efficiency. On 15 June 2011, the International Organization for Standardization (ISO) published ISO 50001 for energy management [18], which has since been widely adopted around the world [19]. With regard to energy management in Thailand, the Energy Conservation Promotion Act (No. 2) B.E.2550 (2007) [20] was issued to encourage energy efficiency in designated buildings [21] and designated factories [22] by the energy management procedure [23]. Information from a survey on the number of ISO 50001-certified organizations [19] is shown in Table 1. ISO 50001-certified organizations in Thailand were found to have increased from 10 in 2011 to 168 in 2014, although this figure subsequently decreased and increased alternately, which is inconsistent with the situation in the East Asia and Pacific regions and, more broadly, the world, which all show a continuous increase. This information indicates that, although a number of organizations are ISO 50001 certified each year, they do not maintain an effective energy management protocol or implement it sustainably. However, organizations with ISO 50001 certification are predicted to continually increase in the future [24].
There have been numerous studies on the significant barriers to energy efficiency in many countries. For example, a study on the main barriers to energy efficiency in Singapore-based industries revealed that a firm’s energy efficiency outcomes are not significantly related to its corporate social responsibility, regulatory compliance, and capacity to implement energy efficiency [25]. A study on the foundry industries of Finland, France, Germany, Italy, Poland, Spain, and Sweden revealed that almost half of these countries lacked a long-term energy strategy [26]. In Europe, numerous studies on the potential to implement long-term energy strategies revealed that the barriers to energy efficiency include a lack of information, procedural impediments, and lack of energy efficiency awareness [27]. In the Swedish iron and steel industry, the most important barriers relate to internal economics and behavior [28]. In Thailand, the most significant barrier to energy efficiency appears to be that management is more concerned with production and other matters, rather than energy efficiency [29]. However, it is quite difficult to ascertain which significant barrier actually causes some organizations in Thailand to stop adopting ISO 50001.
The first edition of the ISO 50001 standard [18] was published in 2011. Subsequently, in 2014, guidance for the implementation, maintenance, and improvement of an EnMS and the measurement and verification of energy performance (ISO 50004 [30], ISO 50006 [31] and ISO 50015 [32]) were introduced so that organizations could apply them effectively. The principle underlying these standards is the Plan–Do–Check–Act (PDCA) cycle. Many studies have proposed various guidelines to facilitate and develop an energy assessment methodology for ISO 50001 such as Chiu et al. (2012) [33], Gopalakrishnan et al. [34], and Kanneganti et al. [35]. In addition, an energy management maturity model [36] can be used to guide organizations in their energy management implementation efforts in order to incrementally achieve compliance with standards. The maturity model concept, introduced by Shewhart [37] and Crosby [38], uses grids for the economic control of quality [38]. A considerable number of studies have offered various guidelines for implementation, while the principles of the maturity model have been applied to assess the success of systems and processes, such as energy efficiency [39] and manufacturing [40]. An EnMS was applied to support implementation and assess success from the beginning of the process until certification (EMMM). O’Sullivan (2010) assumed that successful energy management could cause considerable savings in terms of energy, among other things, and provide future benefits, since the system would be rooted deeply in the process of business and operational management in an appropriate manner [41]. Later, Antunes et al. (2014) proposed an organizational guideline to allow energy management to be practiced, and measured the success by implementing the ISO 50001 standard [36]. Jovanovic and Fillipovic (2016) proposed a maturity model based on the PDCA cycle guideline, and integrated the requirements of ISO 50001 for energy management with the capability maturity model (CMMI), with the objective of using it as a tool to help organizations achieve a higher energy performance than the standard level (EMMM 50001) [42].
ISO 50001 is a process standard, not a performance standard [7]. Therefore, the assessment of certified energy management standards is considered the success of the process, according to the energy management requirements [43,44]. In the meantime, a study by Pham (2015) revealed that the adoption of ISO 50001 has quite a negative effect on the market. This result does not suggest that obtaining ISO 50001 is a bad investment [45]. To date, no guidelines can be used to measure the qualitative results of an EnMS and, thus, indicate its effectiveness and anticipated benefits in order to show the quality or sustainability levels of an organization’s EnMS. However, the second edition of ISO 50001 was published in August 2018 [46], based on the existing PDCA cycle guideline, but with a new clause arrangement, adding an analysis of the organizational context for consistency with ISO 9001 [47] and ISO 14001 [48]. This allows for a simple integration of management systems, in line with the organizational business strategy. However, this study does not include the implementation or adoption of the new version of the standard by organizations.
The concept of an EnMS sustainability index (SI) refers to “Our Common Future” published by the WECD, which offers a definition of sustainable development as that which “meets the needs of the present without compromising the ability of future generations to meet their own needs” [49]. This fundamental requirement was the starting point for developing concepts for the implementation of sustainability initiatives [50]. Sustainability is a paradigm, with different implementations and interpretations in various fields [51], such as the energy system [52], automotive industry [50], waste to energy system [53], renewable energy projects for energy and sanitation devices [54], and local communities [55].
In this context, the sustainability index is introduced as an agglomerated indicator for the measurement of quality in an EnMS [56]. This proposed criterion for EnMS sustainability reflects the economic, organizational, energy performance, and environmental aspects of sustainable energy management. Indicators are considered within activities, under the control of an organization [18,46], involving the relationship between the effectiveness of an EnMS, business strategy integration, and environmental connectivity [7]. The significant barriers to and drivers of the improvement of energy efficiency, such as a gap analysis between industrial needs and scientific literature [57], the driving forces for improved energy efficiency in the foundry industries [26], the barriers and drivers to energy management practice in the Swedish iron and steel [28] and foundry industries [58], indicate the sustainability of the qualitative criteria in the assessment of an EnMS, according to the following aspects, shown in Table 2.
• Economic Aspect
The internal economics [28] associated with energy efficiency, such as investment and returns [7], can be measured by their impact on competitive advantage, triggered by the related costs [25]—for example, the benefit uncertainty [1], the financial support for energy management activities [4], and the limited to access to capital [58].
• Organizational Aspect
An EnMs involves a top-down approach. Therefore, the commitment of top management [18,46], energy policy [59], and long-term strategic planning [58,59] are key indicators of its effectiveness and sustainability, and consideration should also be devoted to power delegation [4] and resource provision [18,46]. This will help to support an EnMS by reflecting the awareness culture [27], behavior [28], and participation of personnel [25,58] in the implementation of organizational energy efficiency for long-term sustainability.
• Energy Performance Aspect
The continuous improvement of energy performance is a required outcome of the ISO 50001 standard [18,46]. Thus, the qualitative efficiency of the process, including energy planning [18,31,46], implementation and operation [18,30,46], and performance evaluation [32,46], has a significant impact on organizational energy performance.
• Environmental Aspect
Tangible outcomes of the integration of the environmental [48,60] and energy management processes [61] are considered in terms of waste management, resource reduction for low carbon [62], and climate change mitigation [24]. The activities that come under the control of an organization, excluding product design [46], such as eco-design [63], are considered in this context.
This paper proposes the development of an EnMS SI framework for assessing the quality and sustainability of energy management. Indicators that have a direct impact on energy performance are applied, using the AHP method and then evaluating the EnMS SI of each organization. This enables the evaluator to predict the potential sustainability of a current organizational EnMS and analyze its strengths and weaknesses. Important information for strategic decision-making to improve these systems and achieve sustainability can then be obtained.
2. Methods
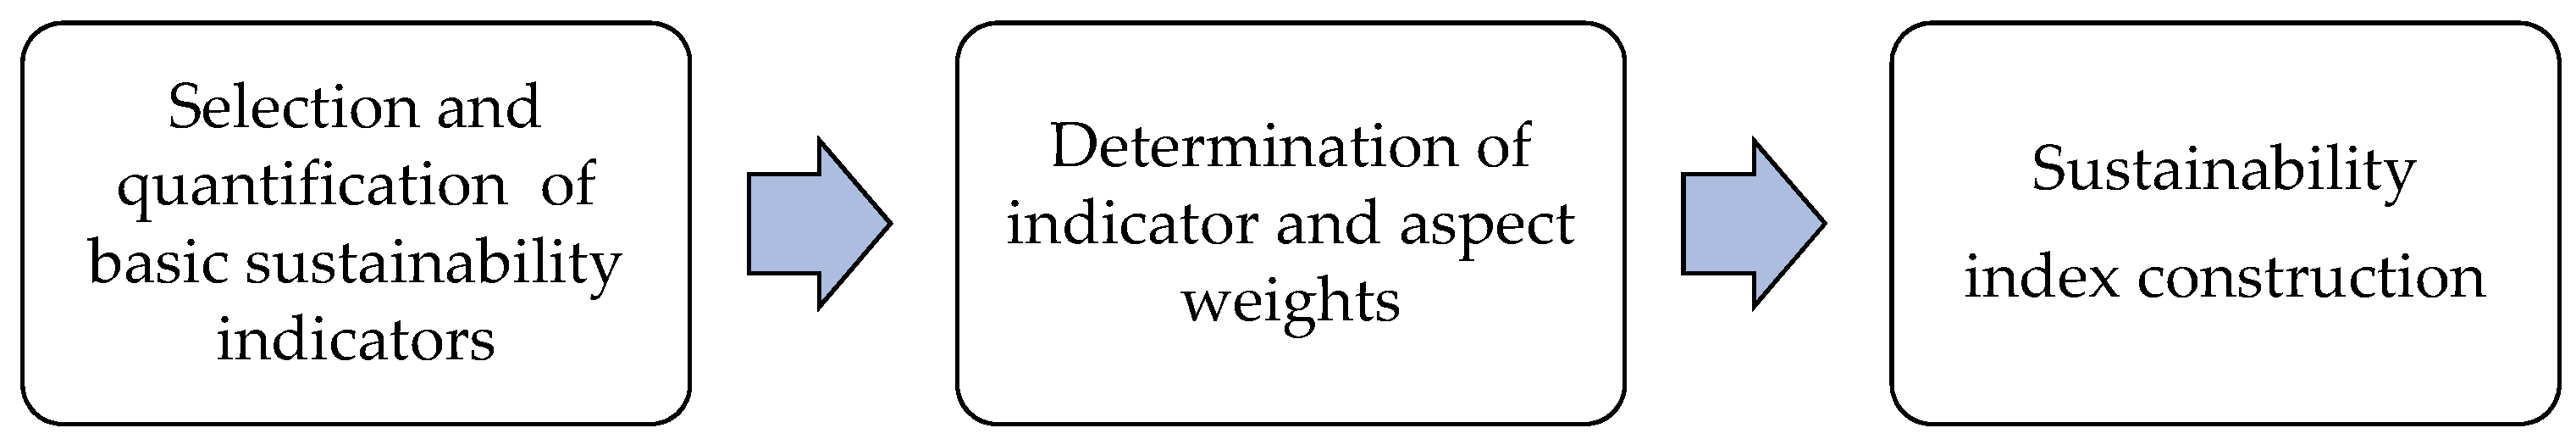
The establishment of an EnMS SI can be divided into two major parts: The development of an EnMS SI framework and the application of that framework to assess ISO 50001-certified industries in Thailand for more than one year. The main objective of an EnMS SI is to provide comprehensive and highly scalable information-driven architecture for assessment [64]. The process, used to develop an EnMS SI framework, is shown in Figure 1 [50,55,64].
2.1. Selection and Quantification of Basic Sustainability Indicators
The basic indicators of EnMS sustainability are the assessment tools for identifying its performance and trends, providing early warning information that supports decision-making [50]. The selection of sustainability indicators is based on the data collection of process factors and associated outcomes, which directly relate to organizational energy efficiency and EnMS effectiveness. The results of energy performance data analysis (Carbon Trust 2011 [17], ISO 50001 [18], ISO 50004 [30], ISO 50006 [31], ISO 50015 [32]) include those obtained from a literature review of related research on maturity model assessment [36,41,42] and study results concerning the impact of the main barriers and drivers on energy efficiency and energy management [1,4,25,26,27,28,29,57,58,59]. Both qualitative and quantitative indicators are available, as well as cover indicators, which can measure the qualitative results of the energy management process in organizations, starting with the input process indicator, work-in-process indicators, output process indicators, and outcome indicators.
Since the selected basic sustainability indicatiors (BSIs) have different dimensions, it is necessary to quantify them as non-dimension variables using the indicator value scale, 1, 2, 3 [64,65]. The qualitative value is assessed to obtain the quantitative value in the scoring of each indicator, and when the indicator values are in the same unit, normalization is not required. Here, the scoring criteria is determined using scales:
| Scale | Meaning |
| 3 | Strong/excellent/maximum |
| 2 | Good/satisfactory/medium |
| 1 | Weak/unsatisfactory/minimum |
2.2. Determination of the Indicator and Aspect Weights
In this paper, the analytic hierarchy process (AHP) methodology is used to obtain the indicator weights, and a case study, performed to illustrate the application of the suggested EnMS SI [50,64,66], is presented. The AHP method, developed by Saaty [67], involves the following steps.
- (1)
- Individual comparison matrices are collected from a questionnaire survey. The questionnaire survey is designed to produce individual comparison matrices by relevant experts in the field, as shown in Table 3.
- (2)
- After constructing the preference matrix, the weights can be calculated using the maximum eigenvalue vector method (MEVM) [64,68]. In order to validate the reliability of the AHP model, a consistency ratio is used to measure the comparison matrix. To calculate the consistency index (CI), the deviation from consistency is given as [64,68]:where λmax is the maximum eigenvalue of the comparison matrix, n. There are n rows and n columns in a comparison matrix.
- (3)
- The random index (RI) is identified for consistency. The RI is provided by Saaty [67].
- (4)
- The consistency ratio (CR) is calculated.
The CR is calculated by Equation (2). Saaty stated that a CR of less than 0.1 is acceptable [67].
2.3. Sustainability Index Construction
To establish the sustainability index in order to obtain a final numerical result [64], the weighted arithmetic mean (WAM) method is used to aggregate the indicators into the indices. A linear agglomeration function is given in Equation (3).
where qi is the value of the i-th indicator, and wi is the weight of the i-th indicator.
Q (q; w) = m∑ wiqi
i = 1
i = 1
A hierarchical scheme for the EnMS SI is shown in Figure 2. Figure 2 shows the economic (SI1), organizational (SI2), energy performance (SI3), and environmental (SI4) aspects, represented by the economic general indicators (GI1,1 … GI1,m) and basic indicators (BI11,1…. BI1m,n), organization general indicators (GI2,1 … GI2,m) and basic indicators (BI21,1…. BI2m,n), energy performance general indicators (GI3,1 … GI3,m) and basic indicators (BI31,1…. BI3m,n), and environmental general indicators (GI3,1 … GI3,n) and basic indicators (BI41,1…. BI4m,n) [50], respectively.
For each company (A), the values of the EnMS sustainability index (SIEnMS) is calculated by aggregating the corresponding basic indicators, general indicators, and each considered aspect, according to the following equations: Equations (5)–(7):
where:
- (GIi,m)A is the value of the general indicator m, according to the EnMS sustainability aspect i for company A;
- (BIim,n)A is the value of the basic indicator n, corresponding to the general indicator m and associated with the EnMS sustainability aspect i for company A; and
- WBim,n is the weight of the basic indicator n for the general indicator m, associated with the EnMS sustainability aspect i.
- (SIi)A is the value of the EnMS sustainability aspect i for company A;
- (GIi,m)A is the value of the general indicator m, corresponding to the EnMS sustainability aspect i for company A; and
- WGi,m is the weight of the basic indicator m, corresponding to the EnMS sustainability aspect i.
(SIEnMS)A = 4∑ Wi(SIi)A
i = 1
i = 1
2.4. Industry Sampling for Framework Validation
In order to verify the developed EnMS SI framework, questionnaires were used to assess the sustainability of indicators in the sampled companies (at least one year of certification with ISO 50001). The values obtained from the assessment were then calculated to achieve the EnMS SI of each company, with the outcomes analyzed and discussed accordingly.
3. Results
The implementation of the study outcomes and development of a framework in accordance with the process determined in Section 2 are shown below.
3.1. Selection and Quantification of the Basic Sustainability Indicators
The study and collection of the basic sustainability indicators follows the procedures mentioned earlier. Incidentally, a review of the process by eight specialists in the ISO 50001 field from public agencies, education institutions, professional associations, and the industrial sector, with direct experience of the ISO 50001 standard, was made possible by holding a focus group meeting to select 30 indicators for assessing EnMS SI, as detailed in Table 4.
3.2. Determination of Indicator Weights
The AHP model was employed to assess the level of significance or indicator weights that have an impact on the EnMS SI criteria and aspects [50,63,64,68]. Individual comparison matrices were collected from the questionnaire survey by 15 experts from selected ISO 50001-certified companies. The analysis results are shown in Table 5; Table 6. It can be seen that the significance or weight of the economic and organizational aspects are relevant, and they are found to have a high-level impact on EnMS sustainability, at 31% and 33%, respectively. This is followed by the energy performance aspect, at 23%, and the environmental aspect, at 13%. Considering the following analytic hierarchy, the continuous benefit is shown to be the most important economic aspect, with a weight as high as 56%. With regard to the organizational aspect, commitment is the most important factor, with a weight of 60%. As for the analytic hierarchy of the commitment criteria, significant indicators are top management commitment and long-term strategic planning, with relevant weights of 48% and 41%, respectively. In terms of the organizational criteria, culture, and behaviors, the significant indicators are embedding EnMS property into the business process and motivation and rewards, respectively. Energy planning is the most important factor of the energy performance aspect, with a weight of 55%. According to the analytic hierarchy, significant indicators in this group are the energy used, the energy audit program for SEUs, and the management review, monitoring, and analysis. In relation to the environmental aspect, the environmental standard is given the highest significance, with a weight of 55%, but considering the bigger picture, of all the indicator weights impacting on the EnMS, the most significant indicators are continuous benefits, top management commitment, and long-term strategic planning.
3.3. Survey and Assessment of Sustainability Indicators with a Sample
In order to employ the above-mentioned framework in assessing the sustainability index of each company, questionnaires were used for interviewing energy management representatives (EnMR) or other persons in companies related to energy management. The questionnaires for the qualitative assessment of basic indicators are shown in Table A1 of the Appendix A. The results obtained from workplace assessments are calculated in the EnMS SI.
The questionnaire and interview data were collected and analyzed from the end of 2017 to the beginning of 2019. The questionnaires were sent to 108 companies in Thailand that had held an ISO 50001 certification for at least one year. The assessment of qualitative score levels for each basic indicator requires the evaluator’s understanding and an appropriate amount of supportive data. As a result, a great deal of time was spent responding thoroughly to the questionnaires. The questionnaires from 31 companies were returned, accounting for 28% of the companies engaged. The questionnaires were distributed to the types of industries shown in Figure 3.
The data obtained from the primary survey of 31 companies indicate that the main drivers of the adoption of ISO 50001 in an organization were the requirement of top management to reduce energy costs, followed by increasing the organization’s competitive advantage, and the operation being in accordance with the company’s environmental mission. This is consistent with previous research studies, in that internal drivers are shown to have a greater influence on the motivation to adopt ISO 50001 than external drivers [1]. The scores for 30 indicators, from the assessment of 31 companies, are shown in Table A2 in the Appendix A.
3.4. Index Construction
The assessment results for 30 sustainability indicators in 31 companies, together with the indicator weights obtained through the AHP, were applied to evaluate the aggregate value of sustainability indicators using the weighted arithmetic mean (WAM) method. The mean of sustainability indicators for each aspect is shown in Figure 4, and the calculation results for the aggregate value of the four aspects and the EnMS SI are shown in Table A3 in the Appendix A. The broader context of the EnMS SI for 31 companies can be more clearly seen in Figure 5.
4. Discussion
The main objective of this research was to develop a new method for assessing the quality of energy management in the form of an EnMS SI, using qualitative score levels as sustainability indicators which directly impact on the energy performance of ISO 50001-certified companies. The framework proposed here can be used as a tool to assess the quality, sustainability, and impact of an organizational EnMS, and the results were applied to achieve sustainability and optimal benefits in business operations. The quality levels of 30 sustainability indicators are shown in Figure 4, enabling consideration to be devoted to the quality of each process or the current indicators of an organizational EnMS, which are presented, in this study, in the form of mean values for 31 companies. The indicators of the economic aspect range from 1.94–2.06, which is the lowest mean, followed by the culture and behavior criteria of the organization aspect, which range from 2.23–2.35. Considering the broader context and applying the assumption that all 31 companies meet the ISO 50001 standard for factories in Thailand, it can be concluded that the weak points of the EnMS ISO 50001 standard in Thailand are internal economics and the culture and behaviors, and this is in accordance with previous studies on energy efficiency projects in other countries [28,58,59].
The results concerning the quality score levels of the activities and processes based on each indicator are shown to be comparable to the Energy Management Maturity Model (EM3) and the Energy Management Maturity Model based on ISO 50001 (EMMM50001) [36,41,42]. The assessment results, which are in accordance with EMMM50001, show an increase in the score levels during each EnMS process, based on the PDCA cycle guideline, from the EnMS establishment to the energy management review. The scores ranged from 1 to 5, depending on the advancement levels of the process (Level 1: Initial to Level 5: Optimized), provided that the levels of importance of the processes were equal [42]. However, the EnMS SI framework provides a more in-depth assessment of the quality and effectiveness of the indicators in each process of energy management and related areas (reducing the environmental impact, waste, and resources), thereby affecting organizational energy performance. From Figure 5, it can be seen that the EnMS SI obtained from the quality assessment of indicators, in conjunction with the aggregate weight values, has a significant impact on energy management sustainability, when considering the current status of each company. Seven companies have a sustainability index lower than 2.0, with company 18 exhibiting the lowest. Among these, companies 13, 15, 18, and 21 have quite a low score level in terms of the economic aspect. In contrast, nine companies have a sustainability index higher than 2.5, and company 16 has the highest. Based on the score levels for each aspect, the findings indicate that all companies in this group have a significantly high score for the economic aspect.
While the EnMS SI framework seems to have a positive bias when applied to assess energy-intensive industries, these industries are considered to have a greater need for energy management implementation than others due to the effect of cost-based competition. Conversely, in industries such as hospitality, the EnMS SI framework is designed within the context of ISO 50001-certified organizations. Therefore, these differences are mostly compensated by the certification process of energy management [43,44]. However, ISO 50001 is a process standard, not a performance standard [7], and confirms the effectiveness of successful energy management and its intended outcomes [46], for which the EnMS SI framework already proposes outcome indicators, such as continuous benefits, long-term strategic planning, participation in energy-saving activities, etc. The limitations of this study involve the deviation of results, including the understanding and knowledge of the evaluators, as well as the weak economic conditions of the organizations involved, and the fact that this framework can only be applied to ISO 50001-certified companies in Thailand.
5. Conclusions
The EnMS SI framework proposed in this study can be applied to—and confer benefits on—all organizations in both the industrial and service sectors through the self-assessment of the EnMS quality aspects using the BSI questionnaire, as shown in Table A1. The scale (1, 2, 3) of each BSI is used to evaluate the quality of the EnMS SI in each organization. In this regard, evaluators can predict the current sustainability potential of an EnMS and analyze its strengths and weaknesses. Additionally, they can employ this important information in the process of strategic decision-making for improvement and sustainability. In the future, the developed index could be promoted by constructing a decision support system (DSS) to increase the impact of sustainable energy management [70]. This framework would enhance any companies adopting ISO 50001 in Thailand, increase their number and maintain sustainability. The high quality of ISO 50001 will help organizations to achieve a continuous energy performance improvement and return the benefits to companies, interested parties, and the world. It will also reduce the environmental impact, carbon dioxide emissions, and the problems caused by climate change [7,24,61,62].
While a second addition of ISO 50001 was published in August 2018 [46], the EnMS SI framework can still be applied, since the standard requirements and PDCA process remain the same. The new edition requires that organizations implement and operate their energy management and business process consistently and apply the analyzed results to energy planning. In a case where the second edition of ISO 50001 has been applied for a while, and an organization decides to stop implementing the standard, it is essential to examine the main reasons for such a decision. This is because, in addition to the internal economic problems identified in this study, there may be other causes that have a significant effect on decision-making, and guidelines on formulating a policy to promote energy management in Thailand in the future are needed.
Author Contributions
V.N. and K.K. were involved in the data collection and pre-processing phase, focus group meeting, model construction, empirical research, results analysis and discussion, and manuscript preparation. All authors have approved the final manuscript.
Funding
This research received no external funding.
Acknowledgments
The researchers would like to thank King Mongkut’s University of Technology Thonburi for the eight experts who contributed to the focus group meeting and the EnMR of 31 companies in Thailand for supporting this research.
Conflicts of Interest
The authors declare no potential conflicts of interest with respect to the research, authorship, and/or publication of this article.
Appendix A

Table A1.
Questionnaire of 30 basic indicators used in the evaluation of an EnMS (ISO 50001-certified company).
Table A1.
Questionnaire of 30 basic indicators used in the evaluation of an EnMS (ISO 50001-certified company).
| Basic Indicators | Evaluation | Scale |
|---|---|---|
| Continuous benefits | Level of satisfaction regarding continuous benefits from the energy management project | |
| 1 | |
| 2 | |
| 3 | |
| Energy cost proportion | Assessment of the impact on the cost of energy for the organizational competitive advantage | |
| 1 | |
| 2 | |
| 3 | |
| EE project investment | Percentage of investment in energy-saving projects, compared to all organizational investments per year | |
| 1 | |
| 2 | |
| 3 | |
| EE investment procedure | Criteria used when considering investment in energy conservation projects | |
| 1 | |
| 2 | |
| 3 | |
| Top management commitment | Tangible commitment by top management to implementing energy efficiency to achieve success | |
| 1 | |
| 2 | |
| 3 | |
| Long-term strategic planning | Preparation of long-term strategic planning associated with energy performance and management | |
| 1 | |
| 2 | |
| 3 | |
| Energy policy | Organizational energy policies and energy targets | |
| 1 | |
| 2 | |
| 3 | |
| EnMS properly embedded into the business process | Connectivity exists between energy management and the organizational business process | |
| 1 | |
| 2 | |
| 3 | |
| Energy management and power delegation | Authorized energy management delegates or delegates with the power to implement energy management in an effective manner | |
| 1 | |
| 2 | |
| 3 | |
| Resource provision | Provision of the essential resources for the implementation of organizational energy management | |
| 1 | |
| 2 | |
| 3 | |
| The efficiency of the performance of staff in handling energy management | Proportion of staff assigned to take responsibility for considering energy performance and its significant effect on energy consumption characteristics | |
| 1 | |
| 2 | |
| 3 | |
| Motivation and rewards | Motivational activities and rewards for enhancing participation in the implementation of energy management | |
| 1 | |
| 2 | |
| 3 | |
| Participation in energy-saving activities | Staff participation in energy-saving activities | |
| 1 | |
| 2 | |
| 3 | |
| Innovation for energy conservation | Implementation or innovation activities related to energy conservation | |
| 1 | |
| 2 | |
| 3 | |
| Communication and internal networking | Communication and networking or participatory activities related to energy management or energy conservation within the organization | |
| 1 | |
| 2 | |
| 3 | |
| Significant energy use | Proportion of significant energy use, compared to the total energy consumption | |
| 1 | |
| 2 | |
| 3 | |
| Energy audit program for SEUs | Work plans and an assessment of the energy efficiency of the process and machines of SEU | |
| 1 | |
| 2 | |
| 3 | |
| Energy performance improvement procedures | Procedures for improving energy performance | |
| 1 | |
| 2 | |
| 3 | |
| Effective EnPIs | Energy performance indicators for SEUs | |
| 1 | |
| 2 | |
| 3 | |
| Preventive maintenance for SEUs | The implementation of preventive maintenance in relation to energy performance and the characteristics of significant energy consumption | |
| 1 | |
| 2 | |
| 3 | |
| Operational control procedure for energy saving | Implementation procedures for controlling operations in relation to energy performance | |
| 1 | |
| 2 | |
| 3 | |
| Regulatory compliance | Implementation in relation to energy laws and other requirements, with which organizations must conform | |
| 1 | |
| 2 | |
| 3 | |
| Staff engagement and competence training | Necessity for competence training in relation to energy management and performance | |
| 1 | |
| 2 | |
| 3 | |
| Design and procurement procedures | Design and procurement procedures that indicate energy performance | |
| 1 | |
| 2 | |
| 3 | |
| Management review | The review of energy efficiency by top management | |
| 1 | |
| 2 | |
| 3 | |
| Monitoring and analysis | Monitoring and analysis of key energy characteristics and performance in organizations | |
| 1 | |
| 2 | |
| 3 | |
| Verification procedure for energy performance | Effective verification of energy saving | |
| 1 | |
| 2 | |
| 3 | |
| Environmental standard | Adopting and putting an environmental management standard into practice within an organization | |
| 1 | |
| 2 | |
| 3 | |
| Waste management | Waste management within the organization in relation to production and energy consumption | |
| 1 | |
| 2 | |
| 3 | |
| Resource reduction | The implementation of resource reduction within the organization | |
| 1 | |
| 2 | |
| 3 |
Table A2.
Scores for 30 basic indicators in the assessment of 31 companies.
| Company | 1 | 2 | 3 | 4 | 5 | 6 | 7 | 8 | 9 | 10 | 11 | 12 | 13 | 14 | 15 | 16 | 17 | 18 | 19 | 20 | 21 | 22 | 23 | 24 | 25 | 26 | 27 | 28 | 29 | 30 | 31 | ||
|---|---|---|---|---|---|---|---|---|---|---|---|---|---|---|---|---|---|---|---|---|---|---|---|---|---|---|---|---|---|---|---|---|---|
| Sustainability Indicator | Scale 1, 2 and 3. | Mean | Std. Deviation | ||||||||||||||||||||||||||||||
| Continuous benefits | 1 | 2 | 2 | 2 | 2 | 2 | 2 | 2 | 2 | 2 | 2 | 3 | 1 | 3 | 1 | 3 | 2 | 1 | 1 | 3 | 1 | 2 | 3 | 1 | 3 | 2 | 3 | 1 | 2 | 3 | 2 | 2.00 | 0.73 |
| Energy cost proportion | 2 | 2 | 3 | 2 | 3 | 1 | 2 | 1 | 3 | 2 | 2 | 1 | 1 | 3 | 1 | 3 | 2 | 1 | 2 | 2 | 1 | 1 | 1 | 3 | 2 | 3 | 3 | 2 | 1 | 2 | 2 | 1.94 | 0.77 |
| EE project investment | 1 | 2 | 3 | 2 | 3 | 3 | 2 | 3 | 1 | 2 | 3 | 1 | 1 | 3 | 1 | 3 | 1 | 2 | 2 | 3 | 2 | 2 | 1 | 3 | 1 | 3 | 2 | 3 | 1 | 3 | 1 | 2.06 | 0.85 |
| EE investment procedure | 3 | 3 | 1 | 2 | 2 | 2 | 2 | 2 | 2 | 2 | 2 | 1 | 1 | 2 | 1 | 2 | 2 | 3 | 2 | 1 | 1 | 2 | 3 | 2 | 2 | 3 | 3 | 2 | 2 | 2 | 3 | 2.03 | 0.66 |
| Top management commitment | 3 | 3 | 2 | 2 | 3 | 2 | 3 | 2 | 2 | 2 | 3 | 3 | 2 | 3 | 3 | 3 | 3 | 2 | 3 | 3 | 2 | 2 | 2 | 3 | 3 | 3 | 2 | 3 | 3 | 3 | 3 | 2.61 | 0.50 |
| Long-term strategy plan | 2 | 2 | 1 | 2 | 2 | 2 | 3 | 3 | 1 | 1 | 2 | 3 | 3 | 2 | 1 | 3 | 2 | 1 | 2 | 3 | 2 | 2 | 3 | 3 | 3 | 3 | 2 | 3 | 2 | 3 | 2 | 2.23 | 0.72 |
| Energy policy | 2 | 3 | 3 | 2 | 3 | 2 | 3 | 3 | 3 | 2 | 3 | 3 | 2 | 3 | 3 | 3 | 3 | 3 | 3 | 3 | 3 | 2 | 2 | 3 | 3 | 3 | 3 | 3 | 3 | 3 | 3 | 2.77 | 0.43 |
| EnMS properly embedding in to business process | 3 | 3 | 3 | 3 | 3 | 2 | 3 | 3 | 2 | 3 | 3 | 3 | 3 | 3 | 2 | 3 | 3 | 2 | 2 | 3 | 2 | 2 | 3 | 3 | 3 | 3 | 2 | 2 | 2 | 2 | 2 | 2.61 | 0.50 |
| Energy manager and power delegation | 3 | 3 | 3 | 3 | 3 | 3 | 3 | 3 | 2 | 2 | 3 | 3 | 3 | 3 | 3 | 3 | 3 | 3 | 3 | 3 | 3 | 2 | 2 | 3 | 3 | 3 | 3 | 3 | 3 | 3 | 3 | 2.87 | 0.34 |
| Resource provision | 3 | 2 | 2 | 3 | 2 | 2 | 3 | 3 | 2 | 1 | 3 | 3 | 3 | 3 | 3 | 3 | 3 | 1 | 2 | 3 | 3 | 2 | 3 | 3 | 3 | 3 | 2 | 3 | 3 | 3 | 2 | 2.58 | 0.62 |
| Performance of staff in handling energy management | 1 | 1 | 3 | 1 | 3 | 3 | 3 | 3 | 2 | 2 | 3 | 2 | 1 | 2 | 1 | 3 | 3 | 1 | 2 | 3 | 2 | 1 | 3 | 3 | 2 | 3 | 1 | 1 | 1 | 3 | 1 | 2.06 | 0.89 |
| Motivation and rewards | 2 | 1 | 1 | 3 | 3 | 2 | 3 | 3 | 2 | 1 | 3 | 3 | 1 | 2 | 3 | 3 | 3 | 1 | 2 | 3 | 2 | 2 | 2 | 2 | 3 | 2 | 2 | 3 | 2 | 3 | 3 | 2.29 | 0.74 |
| Energy-saving activities participation | 2 | 1 | 3 | 3 | 3 | 3 | 3 | 3 | 2 | 2 | 3 | 3 | 1 | 2 | 3 | 3 | 3 | 2 | 2 | 3 | 1 | 1 | 2 | 2 | 3 | 3 | 1 | 1 | 2 | 3 | 2 | 2.29 | 0.78 |
| Innovation for energy conservation | 2 | 1 | 2 | 1 | 2 | 2 | 2 | 3 | 1 | 2 | 3 | 2 | 2 | 3 | 3 | 2 | 3 | 2 | 2 | 3 | 2 | 2 | 2 | 2 | 3 | 3 | 2 | 3 | 2 | 3 | 2 | 2.23 | 0.62 |
| Communication and internal networking | 2 | 1 | 2 | 3 | 3 | 2 | 3 | 2 | 2 | 2 | 3 | 2 | 2 | 2 | 2 | 3 | 2 | 2 | 2 | 3 | 3 | 2 | 3 | 2 | 3 | 3 | 2 | 3 | 3 | 2 | 2 | 2.35 | 0.55 |
| Significant energy use | 1 | 3 | 3 | 3 | 3 | 1 | 2 | 1 | 3 | 2 | 2 | 1 | 1 | 3 | 1 | 3 | 3 | 2 | 3 | 1 | 2 | 2 | 2 | 3 | 3 | 3 | 2 | 3 | 2 | 3 | 3 | 2.26 | 0.82 |
| Energy Audit program for SEUs | 2 | 3 | 3 | 3 | 3 | 2 | 3 | 3 | 2 | 3 | 3 | 3 | 3 | 3 | 3 | 3 | 3 | 2 | 3 | 3 | 2 | 2 | 2 | 3 | 3 | 3 | 3 | 3 | 3 | 3 | 3 | 2.77 | 0.43 |
| Energy performance improvement procedure | 2 | 3 | 3 | 3 | 3 | 2 | 3 | 3 | 2 | 3 | 3 | 2 | 2 | 3 | 3 | 3 | 3 | 2 | 2 | 3 | 2 | 2 | 3 | 3 | 3 | 3 | 3 | 3 | 2 | 3 | 3 | 2.68 | 0.48 |
| Effective EnPIs | 2 | 3 | 2 | 3 | 3 | 1 | 3 | 3 | 2 | 2 | 2 | 2 | 2 | 3 | 3 | 2 | 3 | 2 | 2 | 3 | 3 | 2 | 2 | 2 | 3 | 3 | 2 | 3 | 2 | 3 | 2 | 2.42 | 0.56 |
| Preventive Maintenance for SEU | 3 | 2 | 3 | 3 | 3 | 1 | 3 | 3 | 1 | 3 | 2 | 2 | 2 | 3 | 3 | 3 | 3 | 2 | 2 | 3 | 3 | 2 | 2 | 2 | 3 | 3 | 2 | 3 | 3 | 3 | 3 | 2.55 | 0.62 |
| Operational control procedure for energy-saving | 2 | 2 | 2 | 3 | 3 | 2 | 3 | 3 | 1 | 3 | 3 | 2 | 2 | 3 | 3 | 3 | 3 | 2 | 2 | 3 | 3 | 2 | 2 | 3 | 3 | 3 | 2 | 3 | 3 | 3 | 3 | 2.58 | 0.56 |
| Regulatory Compliance | 3 | 3 | 3 | 3 | 3 | 3 | 3 | 3 | 3 | 3 | 3 | 3 | 2 | 3 | 3 | 3 | 3 | 3 | 3 | 3 | 3 | 3 | 3 | 3 | 3 | 3 | 3 | 3 | 3 | 3 | 3 | 2.97 | 0.18 |
| Staff engagement and competence training | 2 | 3 | 3 | 3 | 3 | 2 | 3 | 3 | 2 | 3 | 3 | 3 | 2 | 3 | 3 | 3 | 3 | 2 | 2 | 3 | 3 | 2 | 2 | 3 | 3 | 3 | 3 | 3 | 3 | 3 | 3 | 2.74 | 0.44 |
| Design and procurement procedure | 1 | 3 | 2 | 3 | 3 | 1 | 3 | 3 | 1 | 3 | 2 | 3 | 3 | 2 | 3 | 2 | 3 | 2 | 2 | 3 | 2 | 2 | 3 | 3 | 3 | 3 | 3 | 3 | 3 | 2 | 2 | 2.48 | 0.68 |
| Management review | 2 | 2 | 2 | 3 | 3 | 3 | 2 | 2 | 2 | 3 | 2 | 2 | 2 | 2 | 2 | 3 | 3 | 2 | 2 | 2 | 2 | 2 | 3 | 2 | 2 | 2 | 2 | 2 | 3 | 2 | 2 | 2.26 | 0.44 |
| Monitoring and Analysis | 1 | 3 | 3 | 3 | 3 | 2 | 2 | 3 | 2 | 3 | 3 | 3 | 2 | 3 | 3 | 3 | 3 | 3 | 2 | 3 | 3 | 2 | 2 | 2 | 3 | 3 | 3 | 3 | 3 | 3 | 3 | 2.68 | 0.54 |
| Verification procedure for Energy performance | 2 | 3 | 3 | 3 | 3 | 3 | 3 | 3 | 2 | 3 | 3 | 3 | 2 | 3 | 2 | 3 | 3 | 2 | 2 | 3 | 2 | 2 | 3 | 3 | 3 | 2 | 3 | 3 | 2 | 3 | 3 | 2.68 | 0.48 |
| Environment standard | 3 | 3 | 2 | 2 | 2 | 3 | 2 | 3 | 1 | 3 | 3 | 3 | 3 | 3 | 3 | 3 | 3 | 3 | 2 | 2 | 3 | 3 | 3 | 3 | 3 | 3 | 3 | 3 | 3 | 3 | 3 | 2.74 | 0.51 |
| Waste management | 2 | 1 | 3 | 3 | 3 | 3 | 2 | 3 | 2 | 3 | 2 | 1 | 2 | 2 | 1 | 2 | 3 | 2 | 2 | 3 | 1 | 2 | 2 | 3 | 3 | 3 | 3 | 3 | 1 | 3 | 2 | 2.29 | 0.74 |
| Resource reduction | 2 | 2 | 3 | 3 | 3 | 3 | 3 | 3 | 1 | 2 | 2 | 3 | 2 | 3 | 3 | 2 | 3 | 2 | 2 | 2 | 3 | 3 | 3 | 3 | 3 | 3 | 3 | 3 | 3 | 3 | 2 | 2.61 | 0.56 |
Table A3.
EnMS SI and the four aspects in 31 companies.
| Company | Economic | Organizational | Energy Performance | Environmental Dimension | EnMS SI |
|---|---|---|---|---|---|
| Company 1 | 0.43 | 0.81 | 0.43 | 0.33 | 2.00 |
| Company 2 | 0.64 | 0.75 | 0.63 | 0.30 | 2.32 |
| Company 3 | 0.72 | 0.64 | 0.62 | 0.32 | 2.31 |
| Company 4 | 0.62 | 0.76 | 0.69 | 0.32 | 2.39 |
| Company 5 | 0.74 | 0.89 | 0.69 | 0.32 | 2.63 |
| Company 6 | 0.57 | 0.70 | 0.43 | 0.39 | 2.08 |
| Company 7 | 0.62 | 0.98 | 0.61 | 0.29 | 2.50 |
| Company 8 | 0.57 | 0.89 | 0.58 | 0.39 | 2.43 |
| Company 9 | 0.67 | 0.59 | 0.48 | 0.16 | 1.91 |
| Company 10 | 0.62 | 0.56 | 0.63 | 0.36 | 2.17 |
| Company 11 | 0.65 | 0.91 | 0.58 | 0.33 | 2.48 |
| Company 12 | 0.66 | 0.97 | 0.51 | 0.33 | 2.46 |
| Company 13 | 0.31 | 0.74 | 0.47 | 0.33 | 1.85 |
| Company 14 | 0.91 | 0.84 | 0.66 | 0.36 | 2.77 |
| Company 15 | 0.31 | 0.78 | 0.57 | 0.33 | 1.99 |
| Company 16 | 0.91 | 0.98 | 0.67 | 0.33 | 2.89 |
| Company 17 | 0.59 | 0.90 | 0.69 | 0.39 | 2.57 |
| Company 18 | 0.38 | 0.56 | 0.49 | 0.33 | 1.76 |
| Company 19 | 0.45 | 0.79 | 0.56 | 0.26 | 2.06 |
| Company 20 | 0.81 | 0.99 | 0.58 | 0.29 | 2.67 |
| Company 21 | 0.34 | 0.70 | 0.54 | 0.33 | 1.92 |
| Company 22 | 0.53 | 0.63 | 0.47 | 0.36 | 2.00 |
| Company 23 | 0.69 | 0.80 | 0.53 | 0.36 | 2.38 |
| Company 24 | 0.57 | 0.92 | 0.61 | 0.39 | 2.50 |
| Company 25 | 0.76 | 0.98 | 0.66 | 0.39 | 2.80 |
| Company 26 | 0.76 | 0.96 | 0.66 | 0.39 | 2.76 |
| Company 27 | 0.90 | 0.67 | 0.57 | 0.39 | 2.53 |
| Company 28 | 0.48 | 0.91 | 0.66 | 0.39 | 2.44 |
| Company 29 | 0.50 | 0.81 | 0.60 | 0.33 | 2.24 |
| Company 30 | 0.83 | 0.96 | 0.66 | 0.39 | 2.83 |
| Company 31 | 0.61 | 0.82 | 0.64 | 0.33 | 2.39 |
| Mean | 0.62 | 0.81 | 0.59 | 0.34 | 2.36 |
| Std. deviation | 0.17 | 0.13 | 0.08 | 0.05 | 0.32 |
| Minimum | 0.91 | 0.99 | 0.69 | 0.39 | 2.89 |
| Maximum | 0.31 | 0.56 | 0.43 | 0.16 | 1.76 |
References
- Marimon, F.; Casadesús, M. Reasons to Adopt ISO 50001 Energy Management System. Sustainability 2017, 9, 1740. [Google Scholar] [CrossRef]
- Khattak, S.H.; Oates, M.; Greenough, R. Towards Improved Energy and Resource Management in Manufacturing. Energies 2018, 11, 1006. [Google Scholar] [CrossRef]
- Gonzalez, A.J.; Castrillón, R.; Quispe, E.C. Energy efficiency improvement in the cement industry through energy management. In Proceedings of the 2012 IEEE-IAS/PCA 54th Cement Industry Technical Conference, San Antonio, TX, USA, 14–17 May 2012. [Google Scholar]
- Ates, A.S.; Durakbasa, M.N. Evaluation of corporate energy management practices of energy intensive industries in Turkey. Energy 2012, 45, 81–91. [Google Scholar] [CrossRef]
- Chan, D.; Huang, C.; Lin, W.; Hong, G. Energy efficiency benchmarking of energy-intensive industries in Taiwan. Energy Convers. Manag. 2014, 77, 216–220. [Google Scholar] [CrossRef]
- Jovanović, B.; Filipović, J.; Bakić, V. Energy management system implementation in Serbian manufacturing—Plan-Do-Check-Act cycle approach. J. Clean. Prod. 2017, 162, 1144–1156. [Google Scholar] [CrossRef]
- Bottcher, C.; Müller, M. Insights on the impact of energy management systems on carbon and corporate performance. An empirical analysis with data from German automotive suppliers. J. Clean. Prod. 2016, 137, 1449–1457. [Google Scholar] [CrossRef]
- International Energy Agency (IEA). Key Energy World Statistics. 2015. Available online: https://www.iea.org/publications/freepublications/publication/KeyWorld_Statistics_2015.pdf (accessed on 12 February 2016).
- Madlool, N.; Saidur, R.; Hossain, M.; Rahim, N. A critical review on energy use and savings in the cement industries. Renew. Sustain. Energy Rev. 2011, 15, 2042–2060. [Google Scholar] [CrossRef]
- Su, T.L.; Chan, D.Y.L.; Hung, C.Y.; Hong, G.B. The status of energy conservation in Taiwan’s cement industry. Energy Policy 2013, 60, 481–486. [Google Scholar] [CrossRef]
- Thollander, P.; Ottosson, M. An energy efficient Swedish pulp and paper industry—Exploring barriers to and driving forces for cost-effective energy efficiency investments. Energy Effic. 2008, 1, 21–34. [Google Scholar] [CrossRef]
- Ma, C.-M.; Chen, M.-H.; Hong, G.-B. Energy conservation status in Taiwanese food industry. Energy Policy 2012, 50, 458–463. [Google Scholar] [CrossRef]
- Prodanic, B.B.; Jokic, A.I.; Zavargo, Z.Z. Rationalization of energy consumption of sugar industry in Republic of Serbia. Termotehnika 2009, 1, 29–35. [Google Scholar]
- Thollander, P.; Karlsson, M.; Söderström, M.; Creutz, D. Reducing industrial energy costs through energy efficiency measures in a liberalized European electricity market—Case study of a Swedish iron foundry. Appl. Energy 2005, 81, 115–126. [Google Scholar] [CrossRef]
- ANSI. ANSI/MSE 2000:2008—A Management System for Energy; ANSI: Washington, DC, USA, 2008. [Google Scholar]
- European Energy Management. EN 16001. Available online: http://www.bsigroup.com/en/Assessment-and-certification-services/management-systems/Standards-andSchemes/EN-16001-Energy-Management/ (accessed on 19 June 2018).
- CarbonTrust. Energy Management—A Comprehensive Guide to Controlling Energy Use; CarbonTrust: London, UK, 2011. [Google Scholar]
- International Organization for Standardization. ISO 50001 Energy Management System—Requirements with Guidance for Use; International Organization for Standardization: Geneva, Switzerland, 2011. [Google Scholar]
- International Organization for Standardization. ISO Survey. 2017. Available online: https://www.iso.org/iso/iso-survey (accessed on 15 October 2018).
- Department of Alternative Energy Development and Energy Conservation Ministry of Energy. Energy Conservation Promotion Act (No. 2). 2007. Available online: http://www.dede.go.th/more_news.php?cid=59 (accessed on 11 February 2018).
- Royal Decree on Designated Building 1995 (B.E.2538). Available online: http://weben.dede.go.th/webmax/content/requirement-designated-building (accessed on 9 June 2019).
- The Royal Decree on Designated Factory 1997 (B.E.2540). Available online: http://weben.dede.go.th/webmax/content/requirements-designated-factory (accessed on 9 June 2019).
- Ministerial Regulation Prescribing Standard, Criteria, and Energy Management Procedures in Designated Factories and Buildings B.E. 2552. Available online: http://www2.dede.go.th/km_berc/downloads/menu4/กฎหมายพลังงาน/english/06%20กฎกระทรวง%20กำหนดมาตรฐาน%20หลักเกณฑ์%20และวิธีการจัดการพลังงานฯ.pdf (accessed on 9 June 2019).
- McKane, A.; Therkelsen, P.; Scodel, A.; Rao, P.; Aghajanzadeh, A.; Hirzel, S.; Zhang, R.; Prem, R.; Fossa, A.; Lazarevska, A.M.; et al. Predicting the quantifiable impacts of ISO 50001 on climate change mitigation. Energy Policy 2017, 107, 278–288. [Google Scholar] [CrossRef]
- Chai, K.; Baudelair, C. Understanding the energy efficiency gap in Singapore: A Motivation, Opportunity, and Ability perspective. J. Clean. Prod. 2015, 100, 224–234. [Google Scholar] [CrossRef]
- Thollander, P.; Backlunda, S.; Triannib, A.; Cagnob, E. Beyond barriers—A case study on driving forces for improved energy efficiency in the foundry industries in Finland, France, Germany, Italy, Poland, Spain, and Sweden. Appl. Energy 2013, 111, 636–643. [Google Scholar] [CrossRef]
- Palm, J.; Thollander, P. An interdisciplinary perspective on industrial energy efficiency. Appl. Energy 2010, 87, 3255–3261. [Google Scholar] [CrossRef] [Green Version]
- Brunke, J.-C.; Johansson, M.; Thollander, P. Empirical investigation of barriers and drivers to the adoption of energy conservation measures, energy management practices and energy services in the Swedish iron and steel industry. J. Clean. Prod. 2014, 84, 509–525. [Google Scholar] [CrossRef] [Green Version]
- Hasanbeigi, A.; Menke, C.; du Pont, P. Barriers to energy efficiency improvement and decision-making behavior in Thai industry. Energy Effic. 2010, 3, 33–52. [Google Scholar] [CrossRef]
- International Organization for Standardization. ISO 50004 Energy Management Systems—Guidance for the Implementation, Maintenance and Improvement of an Energy Management System; International Organization for Standardization: Geneva, Switzerland, 2014. [Google Scholar]
- International Organization for Standardization. ISO 50006 Energy management systems—Measuring Energy Performance Using Energy Baselines (EnB) and Energy Performance Indicators (EnPI)—General Principles and Guidance; International Organization for Standardization: Geneva, Switzerland, 2014. [Google Scholar]
- International Organization for Standardization. ISO 50015 Energy Management Systems—Measurement and Verification of Energy Performance of Organization—Genral Principle and Guidance; International Organization for Standardization: Geneva, Switzerland, 2014. [Google Scholar]
- Chiu, T.-Y.; Lo, S.-L.; Tsai, Y.-Y. Establishing an Integration-Energy-Practice Model for Improving Energy Performance Indicators in ISO 50001 Energy Management Systems. Energies 2012, 5, 5324–5339. [Google Scholar] [CrossRef] [Green Version]
- Gopalakrishnan, B.; Ramamoorthy, K.; Crowe, E.; Chaudhari, S.; Latif, H. A structured approach for facilitating the implementation of ISO 50001 standard in the manufacturing sector. Sustain. Energy Technol. Assess. 2014, 7, 154–165. [Google Scholar] [CrossRef]
- Kanneganti, H.; Gopalakrishnan, B.; Crowe, E.; Al-Shebeeb, O.; Yelamanchi, T.; Nimbarte, A.; Currie, K.; Abolhassani, A. Specification of energy assessment methodologies to satisfy ISO 50001 energy management standard. Sustain. Energy Technol. Assess. 2017, 23, 121–135. [Google Scholar] [CrossRef] [Green Version]
- Antunes, P.; Carreira, P.; Da Silva, M.M. Towards an energy management maturity model. Energy Policy 2014, 73, 803–814. [Google Scholar] [CrossRef]
- Shewhart, W.A. Economic Control of Quality of Manufactured Product; Martino Fine Books: Eastford, CT, USA, 1931. [Google Scholar]
- Crosby, P.B. Quality Is Free: The Art of Making Quality Certain; McGraw-Hill: New York, NY, USA, 1979. [Google Scholar]
- Prashar, A. Energy efficiency maturity (EEM) assessment framework for energy-intensive SMEs: Proposal and evaluation. J. Clean. Prod. 2017, 166, 1187–1201. [Google Scholar] [CrossRef]
- Ngai, E.W.; Chau, D.; Poon, J.; To, C. Energy and utility management maturity model for sustainable manufacturing process. Int. J. Prod. Econ. 2013, 146, 453–464. [Google Scholar] [CrossRef]
- O’Sullivan, J. Energy Management Maturity Model (EM3). 2010. Available online: http://www.seai.ie/News_Events/Previous_SEAI_events/Creating_the_Right_Environment_for_ISO_50001/John%20O%20Sullivan.pdf (accessed on 29 February 2016).
- Jovanović, B.; Filipović, J. ISO 50001 standard-based energy management maturity model—Proposal and validation in industry. J. Clean. Prod. 2016, 112, 2744–2755. [Google Scholar] [CrossRef]
- International Organization for Standardization. ISO/IEC 17021—Requirements for Bodies Providing Audit and Certification of Management Systems—Part 1: Requirements; International Organization for Standardization: Geneva, Switzerland, 2015. [Google Scholar]
- International Organization for Standardization. ISO 19011—Guidelines for Auditing Management Systems; International Organization for Standardization: Geneva, Switzerland, 2018. [Google Scholar]
- Pham, T.H.H. Energy management systems and market value: Is there a link? Econ. Model. 2015, 46, 70–78. [Google Scholar] [CrossRef] [Green Version]
- International Organization for Standardization. ISO 50001 Energy Management System—Requirements with Guidance for Use; International Organization for Standardization: Geneva, Switzerland, 2018. [Google Scholar]
- International Organization for Standardization. ISO 9001 Quality Management System—Requirements; International Organization for Standardization: Geneva, Switzerland, 2015. [Google Scholar]
- International Organization for Standardization. ISO 14001 Environmental Management Systems—Requirements with Guidance for Use; International Organization for Standardization: Geneva, Switzerland, 2015. [Google Scholar]
- World Commission on Environment and Development (WCED). Report of the World Commission on Environment and Development: Our Common Future; Oxford University Press: Oxford, UK, 1987. [Google Scholar]
- Salvado, F.M.; Azevedo, S.G.; Matias, J.C.O.; Ferreira, L.M. Proposal of a Sustainability Index for the Automotive Industry. Sustainability 2015, 7, 2113–2144. [Google Scholar] [CrossRef] [Green Version]
- Deif, A.M. A system model for green manufacturing. J. Clean. Prod. 2011, 19, 1553–1559. [Google Scholar] [CrossRef] [Green Version]
- Afgan, N.H.; Carvalho, M.G.; Hovanov, N.V.; Carvalho, M.D.G. Energy system assessment with sustainability indicators. Energy Policy 2000, 28, 603–612. [Google Scholar] [CrossRef]
- Chong, Y.T.; Teo, K.M.; Tang, L.C. A lifecycle-based sustainability indicator framework for waste-to-energy systems and a proposed metric of sustainability. Renew. Sustain. Energy Rev. 2016, 56, 797–809. [Google Scholar] [CrossRef]
- Lillo, P.; Ferrer-Martí, L.; Fernández-Baldor, Á.; Ramirez, B. A new integral management model and evaluation method to enhance sustainability of renewable energy projects for energy and sanitation services. Energy Sustain. Dev. 2015, 29, 1–12. [Google Scholar] [CrossRef] [Green Version]
- Reed, M.S.; Fraser, E.D.; Dougill, A.J. An adaptive learning process for developing and applying sustainability indicators with local communities. Ecol. Econ. 2006, 59, 406–418. [Google Scholar] [CrossRef]
- Afgan, N.H. Sustainability Paradigm: Intelligent Energy System. Sustainability 2010, 2, 3812–3830. [Google Scholar] [CrossRef] [Green Version]
- Bunse, K.; Vodicka, M.; Schonsleben, P.; Brulhart, M.; and Ernst, F. Integrating energy efficiency performance in production management a gap analysis between industrial needs and scientific literature. J. Clean. Prod. 2011, 19, 667–679. [Google Scholar] [CrossRef]
- Rohdin, P.; Thollander, P.; Solding, P. Barriers to and drivers for energy efficiency in the Swedish foundry industry. Energy Policy 2007, 35, 672–677. [Google Scholar] [CrossRef] [Green Version]
- Finnerty, N.; Sterling, R.; Contreras, S.; Coakley, C.; Keane, M. Defining corporate energy policy and strategy to achieve carbon emissions reduction targets via energy management in non-energy intensive multi-site manufacturing organisations. Energy 2018, 151, 913–929. [Google Scholar] [CrossRef] [Green Version]
- Martínez-Perales, S.; Ortiz-Marcos, I.; Ruiz, J.J.; Lázaro, F.J. Using Certification as a Tool to Develop Sustainability in Project Management. Sustainability 2018, 10, 1408. [Google Scholar] [CrossRef]
- Uriarte-Romero, R.; Gil-Samaniego, M.; Valenzuela-Mondaca, E.; Ceballos-Corral, J. Methodology for the Successful Integration of an Energy Management System to an Operational Environmental System. Sustainability 2017, 9, 1304. [Google Scholar] [CrossRef]
- De Sousa Jabbour, A.B.L.; Júnior, S.A.V.; Jabbour, C.J.C.; Filho, W.L.; Campos, L.S.; De Castro, R. Toward greener supply chains: Is there a role for the new ISO 50001 approach to energy and carbon management? Energy Effic. 2017, 10, 777–785. [Google Scholar] [CrossRef]
- Issa, I.I.; Pigosso, D.C.; McAloone, T.C.; Rozenfeld, H.; Pigosso, D.C.A. Leading product-related environmental performance indicators: A selection guide and database. J. Clean. Prod. 2015, 108, 321–330. [Google Scholar] [CrossRef]
- Liu, G. Development of a general sustainability indicator for renewable energy systems: A review. Renew. Sustain. Energy Rev. 2014, 31, 611–621. [Google Scholar] [CrossRef]
- Goldrathn, T.; Ayalon, O.; Shechter, M. A combined sustainability index for electricity efficiency measures. Energy Policy 2015, 86, 574–584. [Google Scholar] [CrossRef]
- Yang, Y.; Li, B.; Yao, R. A method of identifying and weighting indicators of energy efficiency assessment in Chinese residential buildings. Energy Policy 2010, 38, 7687–7697. [Google Scholar] [CrossRef]
- Saaty, T.L. The Analytic Hierarchy Process: Planning, Priority Setting, Resource Allocation; McGraw-Hill: New York, NY, USA, 1990; ISBN 0070543712. [Google Scholar]
- Tonsirimongkol, V. AHP—The Most Popular Decision Making Process in the World; Graphic and printing center: Bangkok, Thailand, 1999; ISBN 9748707369. [Google Scholar]
- Laskurain, I.; Ibarloza, A.; Larrea, A.; Allur, E. Contribution to Energy Management of the Main Standards for Environmental Management Systems: The Case of ISO 14001 and EMAS. Energies 2017, 10, 1758. [Google Scholar] [CrossRef]
- Kazak, J.K.; Van Hoof, J. Decision support systems for a sustainable management of the indoor and built environment. Indoor Built Environ. 2018, 27, 1303–1306. [Google Scholar] [CrossRef] [Green Version]
Figure 1.
Development strategies for an EnMS sustainability index (SI).

Figure 2.
Hierarchical scheme for the EnMS SI.

Figure 3.
Proportion of companies, categorized by the type of industry.

Figure 4.
The mean of the basic sustainability indicators from 31 companies.

Figure 5.
Score levels for the four aspects and the EnMS SI of 31 companies.

Table 1.
The number of organizations in Thailand with ISO 50001 certification from 2011–2017.
| Year | 2011 | 2012 | 2013 | 2014 | 2015 | 2016 | 2017 |
|---|---|---|---|---|---|---|---|
| The World | 459 | 2236 | 4826 | 6765 | 11,985 | 20,216 | 21,501 |
| East Asia and the Pacific | 49 | 191 | 478 | 693 | 1035 | 2086 | 2516 |
| Thailand | 10 | 41 | 132 | 168 | 138 | 255 | 216 |
Table 2.
Energy management system (EnMS) conceptual sustainability aspects.
| Aspect | Economic | Organizational | Energy Performance | Environmental |
|---|---|---|---|---|
| Criteria | Investment and returns | Commitment | Energy planning | Environment impact |
| Organizing ability | Implementation and operation | |||
| Culture and behaviors | Performance evaluation |
Table 3.
Pairwise comparison of the analytic hierarchy process (AHP).
| Criteria | A | B | C | D |
|---|---|---|---|---|
| A | 1 | X12 | X13 | X14 |
| B | 1/X12 | 1 | X23 | X24 |
| C | 1/X13 | 1/X23 | 1 | X34 |
| D | 1/X14 | 1/X24 | 1/X34 | 1 |
A, B, C, and D are the indicators, and X12, X13, and X14 are compared to the value of the pairs AB, AC, and AD, respectively. The value is obtained from a basic range of absolute numbers in order to capture human perceptions regarding qualitative and quantitative attributes. The questionnaire is designed using the nine-point method, recommended by Saaty [67], and conforms to the paired comparison requirement of the AHP method, based on the final indicator list [64,66]. The values refer to the nine-point method, recommended by Saaty [67].
Table 4.
Basic EnMS sustainability indicators.
| Aspect | General Indicator | Basic Indicator | Definition |
|---|---|---|---|
| Economic | Investment and returns [4,25,28,29] | BI11,1 Continuous benefit | Continuous benefit of an energy efficiency project. |
| BI11,2 Energy cost proportion | Proportion of energy costs, reflecting the competitive advantage of an organization. | ||
| BI11,3 Energy efficiency project investment | Proportion of investment in an energy efficiency project, compared to the total investment of an organization. | ||
| BI11,4 EE investment procedure | Procedure and criteria for decision-making relating to investing in an energy efficiency project. | ||
| Organizational | Commitment [18,25,26,29,30,46,58,59] | BI21,1 Top management commitment | Tangible top management commitment to implementing an EnMS. |
| BI21,2 Long-term strategic planning | Long-term strategic planning for efficient energy management. | ||
| BI21,3 Energy policy | Policies and targets for organizational energy management. | ||
| Organizing ability [4,18,27,30,46,57] | BI22,1 EnMS properly embedded into the business process | Relation and connectivity of energy management systems and the business operation process of organizations. | |
| BI22,2 Energy management and power delegation | Authorizing an energy manager or energy delegate to operate energy management in an effective manner. | ||
| BI22,3 Resource provision | Preparation of the resources necessary for the operation of organizational energy management. | ||
| BI22,4 Staff can perform efficiently in handling energy management | Proportion of employees assigned to take responsibility for the operation in order to create an impact on energy performance in the SEU area. | ||
| Culture and behaviors [18,25,27,28,30,46,58,59] | BI23,1 Motivation and rewards | Motivational activities and rewards that support participation in the implementation and operation of energy management. | |
| BI23,2 Participation in energy-saving activities | Employee participation in activities associated with energy saving. | ||
| BI23,3 Innovation for energy conservation | Innovation associated with energy conservation in an organization. | ||
| BI23,4 Communication and internal networking | Communication and network building or participatory activities in energy management or energy conservation within an organization. | ||
| Energy performance | Energy planning [18,26,30,31,46] | BI31,1 Significant energy use(SEU) | Proportional energy consumption of SEU, compared to the total. |
| BI31,2 Energy Audit program for SEUs | Energy performance auditing program of processes and machines for SEU. | ||
| BI31,3 Energy performance improvement procedure | Procedure and criteria for energy performance improvement. | ||
| BI31,4 Effective EnPIs | Determination of energy performance indicators (EnPIs) that appropriately and comprehensively cover significant energy consumption characteristics. | ||
| Implementation and operation [18,30,46] | BI32,1 Preventive maintenance for SEU | Implementation of preventive maintenance associated with energy performance in the SEU area. | |
| BI32,2 Operational control procedure for energy saving | Implementation process for the operational control associated with energy performance. | ||
| BI32,3 Regulatory compliance | Implementation associated with legal issues and other energy requirements applicable in an organization. | ||
| BI32,4 Staff engagement and competence training | Competency-based training associated with energy management and performance. | ||
| BI32,5 Design and procurement procedure | Design and purchasing process of energy in consideration of energy performance. | ||
| Performance evaluation [18,32,46] | BI33,1 Management review | Review of the energy management system by top management. | |
| BI33,2 Monitoring and analysis | Monitoring and analysis of the key characteristics of organizational energy performance. | ||
| BI33,3 Verification procedure for energy performance | Verification procedure for energy saving and effective energy performance. | ||
| Environmental | Environment impact [7,48,69] | BI41,1 Environmental standard | Bringing environmental management standards into practice in an organization. |
| BI41,2 Waste management | Organizational waste management associated with energy production and consumption from waste. | ||
| BI41,3 Resource reduction | Implementation and operation of an energy management system to minimize organizational resources. |
Table 5.
Determination of the weight of the four aspects of EnMS sustainability by the AHP model.
| Aspect | Statistics | Aspect | Statistics |
|---|---|---|---|
| AHP Model | Weight | AHP Model | Weight |
| W1, Economic | 0.31 | ||
| W2, Organizational | 0.33 | ||
| W3, Energy performance | 0.23 | ||
| W4, Environmental | 0.13 | ||
| Eigenvalue(λ)—average value | 4.08 | ||
| Consistency ratio (CR) | 0.03 | ||
| Organizational aspect | Weight | Energy performance aspect | Weight |
| WG21, Commitment | 0.6 | WG31, Energy planning | 0.55 |
| WG22, Organizing ability | 0.2 | WG32, Implementation and operation | 0.24 |
| WG23, Culture and behaviors | 0.2 | WG31, Performance evaluation | 0.21 |
| Eigenvalue(λ)—average value | 3 | Eigenvalue(λ)—average value | 3.02 |
| Consistency ratio (CR) | 0 | Consistency ratio (CR) | 0.01 |
Table 6.
Determination of the weight of the EnMS sustainability indicators by the AHP model.
| Aspect | Statistics | Aspect | Statistics |
|---|---|---|---|
| Economic—investment and returns | Weight | Organizational—commitment | Weight |
| WB11,1,, Continuous benefit | 0.56 | WB21,1,Top management commitment | 0.48 |
| WB11,2,, Proportional energy cost | 0.28 | WB21,2, Long-term strategic planning | 0.41 |
| WB11,3,, EE project investment | 0.11 | WB21,3, Energy policy | 0.11 |
| WB11,4, EE investment procedure | 0.06 | Eigenvalue(λ)—average value | 3.03 |
| Eigenvalue(λ)—average value | 4.09 | Consistency ratio (CR) | 0.03 |
| Consistency ratio (CR) | 0.03 | ||
| Organizational—organizing | Weight | Organizational—culture and behaviors | Weight |
| WB22,1,, EnMS properly embedded into the business process | 0.42 | WB23,1, Motivation and rewards | 0.46 |
| WB22,2, Energy management and power delegation | 0..22 | WB23,2, Participation in energy-saving activities | 0.31 |
| WB22,3, Resource provision | 0.25 | WB23,3, Innovation for energy conservation | 0.12 |
| WB22,4, The efficiency of the performance of staff in handling energy management | 0.11 | WB23,4, Communication and internal networking | 0.11 |
| Eigenvalue(λ)—average value | 4.05 | Eigenvalue(λ)—average value | 4.05 |
| Consistency ratio (CR) | 0.02 | Consistency ratio (CR) | 0.02 |
| Energy performance—energy planning | Weight | Energy performance—implementation and operation | Weight |
| WB31,1, Significant energy use | 0.33 | WB32,1, Preventive maintenance for SEU | 0.29 |
| WB31,2, Energy audit program for SEUs | 0.36 | WB32,2, Operational control procedure for energy saving | 0.29 |
| WB31,3, Energy performance improvement procedure | 0.16 | WB32,3, Regulatory compliance | 0.22 |
| WB31,4, Effective EnPIs | 0.15 | WB32,4, Staff engagement and competence training | 0.13 |
| Eigenvalue(λ)—average value | 4.02 | WB32,5, Design and procurement procedure | 0.08 |
| Consistency ratio (CR) | 0.01 | Eigenvalue(λ)—average value | 5.17 |
| Consistency ratio (CR) | 0.04 | ||
| Energy performance—monitoring and verification | Weight | Environmental—environment impact | Weight |
| WB33,1, Monitoring and analysis | 0.30 | WB41,1, Environmental standard | 0.55 |
| WB33,2, Verification procedure for energy performance | 0.16 | WB41,2, Waste management | 0.24 |
| WB33,3, Management review | 0.54 | WB41,3, Resource reduction | 0.21 |
| Eigenvalue(λ)—average value | 3.01 | Eigenvalue(λ)—average value | 3.02 |
| Consistency ratio (CR) | 0.01 | Consistency ratio (CR) | 0.02 |
© 2019 by the authors. Licensee MDPI, Basel, Switzerland. This article is an open access article distributed under the terms and conditions of the Creative Commons Attribution (CC BY) license (http://creativecommons.org/licenses/by/4.0/).
Share and Cite
MDPI and ACS Style
Nakthong, V.; Kubaha, K. Development of a Sustainability Index for an Energy Management System in Thailand. Sustainability 2019, 11, 4587. https://doi.org/10.3390/su11174587
AMA Style
Nakthong V, Kubaha K. Development of a Sustainability Index for an Energy Management System in Thailand. Sustainability. 2019; 11(17):4587. https://doi.org/10.3390/su11174587
Chicago/Turabian StyleNakthong, Vichan, and Kuskana Kubaha. 2019. "Development of a Sustainability Index for an Energy Management System in Thailand" Sustainability 11, no. 17: 4587. https://doi.org/10.3390/su11174587
Note that from the first issue of 2016, this journal uses article numbers instead of page numbers. See further details here.