A Systemic Approach to City Image Building. The Case of Katowice City


1
Department of Public Management and Social Sciences, Faculty of Economics, University of Economics in Katowice, ul. 1 Maja 50, 40-287 Katowice, Poland
2
Department of Operational Research, Faculty of Informatics and Communication, University of Economics in Katowice, ul. 1 Maja 50, 40-287 Katowice, Poland
*
Author to whom correspondence should be addressed.
†
These authors contributed equally to this work.
Sustainability 2019, 11(16), 4470; https://doi.org/10.3390/su11164470
Submission received: 21 March 2019
/
Revised: 8 August 2019
/
Accepted: 9 August 2019
/
Published: 18 August 2019
Abstract
:Making long-term decisions and developing successful policy is always a challenge for a governing body. Within the framework of causal mapping, we evolved a model for the problem of creating and reinforcing a city’s image. Then, the model was enhanced into a quantitative form and processed with a novel approach: the extended form of the Weighted Influence Non-linear Gauge System (WINGS). A real-life case study of the city of Katowice showed that the presented approach can be helpful for city authorities. It reinforces the understanding of the problem, facilitates choosing policy options, and supports sustainable city development.
1. Introduction
The image (picture) is one of the crucial issues in marketing, place marketing, and place branding [1,2,3,4,5,6,7,8,9,10,11,12,13,14,15,16]. The contemporary culture of images affects every aspect of social and economic life [17,18,19,20,21,22], including, perhaps above all, regional development [22,23]. The activities that used to be typical for business are now successfully practiced in place marketing and branding by administrative and self-government units [2,24,25,26,27,28]. Creating and managing a city image has recently become one of the key practices of place governance to encourage tourists, attract investors, and integrate residents within a particular place [2]. Emphasizing uniqueness, but also indicating the added value of the site, the image allows getting to know the qualities of the city and its “products” [29]. Moreover, sociologists, anthropologists, and other researchers have begun to appreciate image and visual communication [30,31] as a way to explore the relationships between visual culture and people’s behavior.
More and more, cities and countries are investing in the process of image building to be competitive in the national and even global market [32,33], to create a reputation that helps visitors to better understand a community and a place [34], to integrate the local community [2], to stimulate the economic success of a city or region [17,35], and to rehabilitate urban space [33]. Because the image is built from many elements derived from an image subject and an image bearer, it is sometimes an outcome of conflicting messages sent by the city and many other sources of information, e.g., social media. It is formed in the mind of each individual receiver of these messages separately [7]. Place marketing is a strategic, systematic, planned activity [36] and requires tools that help to reach the target and reduce risks.
As Philip Kotler and co-writers emphasized in the classic book “Marketing Places” [36], there are four broad strategies to attract visitors and residents that may be introduced by the cities and their authorities: image marketing, attractions marketing, infrastructure marketing, and people marketing. In the presented article, the authors focus on the first one, which requires research on the strengths and weaknesses of the place, examination of the city’s identity features, and elaboration on the message that is going to be communicated to the chosen stakeholders [36] (p. 37). The other strategies mostly concentrate on investing in the attractions, infrastructure, and people of a city.
City image is an example of a destination image, which has been a popular topic since 1970 [27,37]. Among a number of research themes, there are: factors influencing the destination image [38,39], destination image measurement, the image building process [37,40,41,42,43], the influence of the destination image on the tourism industry [44,45], interrelations between the destination image and tourists’ satisfaction [39], and the correlation between the architecture and city image [46]. To the best knowledge of the authors, there is no comprehensive study that has developed a systemic model of the city image supporting the decision process of policy makers.
The article tries to fill a gap in the field of place’s image management related to the decision-making process of public entities. Place marketing and place branding research mostly study these subjects across different disciplines [47,48,49], build theories that explain processes and phenomena [7,20,50], build models of place branding management [51,52], or discuss different case studies [7,9,52,53]. At the same time, cities (places) across the world apply marketing strategies to reach new clients (residents, investors, tourists) and to develop their potentials. What is more, the observation of the practice, as well as the analysis of place branding research show that there is widely-acknowledged gap between place branding theory and practice [54]. One of the policies practiced currently is city image improvement. Places are perceived as brands [55] especially in tourism marketing [56]. Brands generate images [57], which comprise two dimensions: functional, which consists of tangible attributes, and emotional, consisting of intangible attributes [55]. Knowing the range of place’s image attributes allows public authorities and other bodies responsible for a place’s growth to communicate an appropriate identity of a particular destination. A place’s image is crucial to its marketing success [57,58] and to its touristic, economic, and residential attractiveness [57,59].
The main aim of this study is to construct a model supporting decisions made by local authorities when preparing and implementing a city image improvement strategy. The study differs from other studies dealing with the place’s images, place marketing, and place branding by focusing on a decision-making method. In this case, it is less important what the place’s image attributes are, but rather how the city’s authority might consider those attributes, while undertaking attempts to improve the city image in the target groups’ minds. It could be argued that city image building needs a complex management system, as it is one of the elements of city branding [51]. The study tries to answer two questions:
- Is it possible to employ a systemic approach to help local authorities in the creation of the right image of the city?
- Can the process of destination’s image building be improved by the novel decision-making methods, which take into account many elements impacting the city image?
To cover the research gap, we developed a systemic model of the city image. The procedure, based on a novel approach, the extended WINGS method [60] (in fact, the extended WINGS approach was originally developed along with this research project, but by coincidence, the later application described in [60] was published earlier), aims at better understanding the problem and helping the city officials to rationalize their activities towards improving the city image.
Katowice is the capital city of Upper Silesia Voivodship and the tenth largest city in Poland with about 300,000 citizens. It lies in the South of Poland, about 75 km from the border with the Czech Republic. Upper Silesia is an industrial district with a high-density population. Katowice with it 13 surrounding minor cities forms the Upper Silesia Agglomeration, which with its over two million citizens, is a unique population center in Poland and in Europe. In turn, this agglomeration is the center of a larger cluster of cities that counts over three million people and is the largest metropolitan area in Poland. Being previously dominated by heavy industry, now Katowice has transformed into a service and sales center (http://www.portal.katowice.pl). Katowice has been one of the leading cities of the European integration and was awarded with the Honour Flag of the Council of Europe (1998), the Council of Europe Plaque (2000), and the Europe Award (2008). Katowice applied also for the title of the European Youth Capital 2015 and the UNESCO Creative City of Culture in 2015+.
Katowice and its image were chosen for the analysis because the city has its own developed and implemented promotional strategy that is additionally evaluated and examined every other year. This allowed making comparisons and assumptions about the interdependencies among factors influencing the city image. Another reason to choose Katowice was its promotional strategy, consequently applied and evaluated since 2012, which included intensive efforts on the part of the local authorities to change the city image from an industrial one to a “progressive, people-oriented and transforming city” (https://www.katowice.eu/miasto/o-mieście/strategia-promocji-miasta).
Taking into account the semi-quantitative character of the model, the WINGS output appeared to be consistent enough with existing data from the subsequent surveys. The results of our research give a deeper insight into the problem of building and reinforcing city image. They can be used by the city authority as a guide helpful in determining the directions of city promotion. Images understood as visual pictures are major elements of contemporary civilization. Although place branding as the major city management instrument focuses mostly on the conceptualization of a specific place as a brand [3], it should be emphasized that in this multidimensional construct, consisting of functional, emotional, relational, and strategic elements [48], images are particular qualities influencing the perception of places, and at the same time, they have a motivational impact on consumers’ (visitors, tourists, investors, residents) decisions. Places are visited because of images that may encourage consumers to make a comparison with reality or are so exciting that they motivate a visit.
The remaining part of the paper is organized as follows: The next section (Section 2) is devoted to presenting the research background and literature review. The first part (Section 2.1) presents the theoretical background of the term “image”. It also contains a general discussion of the theory of image in five different disciplines, as each of them adds different factors to deepen the understanding of a place image and its significance for the territorial governance. The second part (Section 2.2) sketches the research background of the WINGS method and its position among the other similar techniques. The new extended version of WINGS is introduced in Section 3. Section 4 presents a systemic model for the creation of Katowice’s image, as well as a discussion of its results. It begins with an outline of the issue of creating and strengthening the image of Katowice (Section 4.1). The paper concludes with a discussion of the advantages and limitations of the proposed approach (Section 5).
2. Research Background and Literature Review
2.1. Image
The term “image” is commonly known, which does not mean that it is universally understood [61,62,63,64]. It varies across academic disciplines and depending on the focus of scholarly research [61]. Moreover, it has raised controversy and discussion, and one of the greatest public relations researchers, James E. Grunig, had not used it for many years because, in his opinion, it was unnatural and invoked many negative connotations [65]. The image of an organization, according to David Bernstein’s classic definition, is the result of experience, beliefs, feelings, knowledge, and impressions that people have about an organization, person, or place [66,67]. The definition of the image emphasizes that it is a picture created as a result of cognitive processes that persist in the minds of people [68,69]. It gives rise to the experience of “seeing”, although there is no stimulation of the eye [61]. Therefore, the process of image building and the tools used to construct it are related to the cognitive processes of an individual and are subject to cognitive psychology, which is practiced, in discipline-specific ways, in both public relations and marketing. Probably because of the connotation, both the term “image” and the process of its construction raise much controversy among researchers [70]. An image is not a static construct, but, rather, its opposite: a dynamic phenomenon, changing under the influence of stimuli from the environment (social system). Organizations have as many images as social relationships in which they participate. The social system in which they operate through the communication process creates these images [71]. Taking into account cognitive processes, social system theory, and communication theory, one can integrate the image into the communication process, thus revealing the specificity of the image.
Grahame Dowling believes that an image is influenced by many factors, such as organizational culture, corporate identity, policies, publicity, and others, all of which influence people’s perception of an organization [72]. Since the 1950s, the issue of the image has been included in newly-emerging literature on branding [73], because it was assumed that the main role of a brand is to create so-called “positives images” in the consumers’ minds [74]. Images were perceived as sets of associations with both tangible and intangible features of a product [75]. The role of images is also noticeable for human geographers who discern interactions between people and places that built up images from people’s perception and cognition [76]. Images play a special function in tourism, and this is why much literature is devoted to that issue [42,64,77]. Destination image is classified in various ways, as a cognitive, affective, overall, cognitive-affective, and self-congruity image [64]. The theory of place marketing and place branding notes the importance of the image in the process of creating, communicating, and managing a territorial brand [3,26,27,36,59,78,79,80]. This study does not deal with an image’s impact on the socio-economic environment and on image measurement methods, but it focuses on a practical solution aiding decision making. We expect that such a tool can help the city authorities to improve the city image and to overcome past stereotypes and biases.
The various interpretations of the term “image” [77] allowed us to conclude that it is a phenomenon that is neither simple nor obvious. There are at least five essential concepts of image understanding ([81] p. 15): (1) as a literally meaningful image (pictures, graphics, sculptures), (2) as an optical object (e.g., mirror image), (3) as a perceptual phenomenon (sensory data), (4) as a verbal account (metaphors and descriptions), and (5) as a mental phenomenon. The last one is not just about memories or ideas, but also about dreams and fantasies (imaginative products). As Kampschulte concluded: “The image of the city is best described as the link between real, objective space and its perception” [82].
The image as an analytical term is still controversial due to its role that is attributed to this phenomenon in the research, theory, and practice of place marketing. As image-building was typical for place marketing activities in the 1980s, the idea of place branding was pioneered in the 1990s, and currently, it is one of the major instruments for city management [11,17]. Place branding strategies require longer-term commitment [11], while image-building requires primarily public relations activities, which although are also focused on long-term goals, primarily use the tools of current importance. In the case study, chosen for the presented analysis, the authors focus on image-building, because such an image-building strategy had been chosen for Katowice city due to its stereotypes being deeply incorporated in people’s minds.
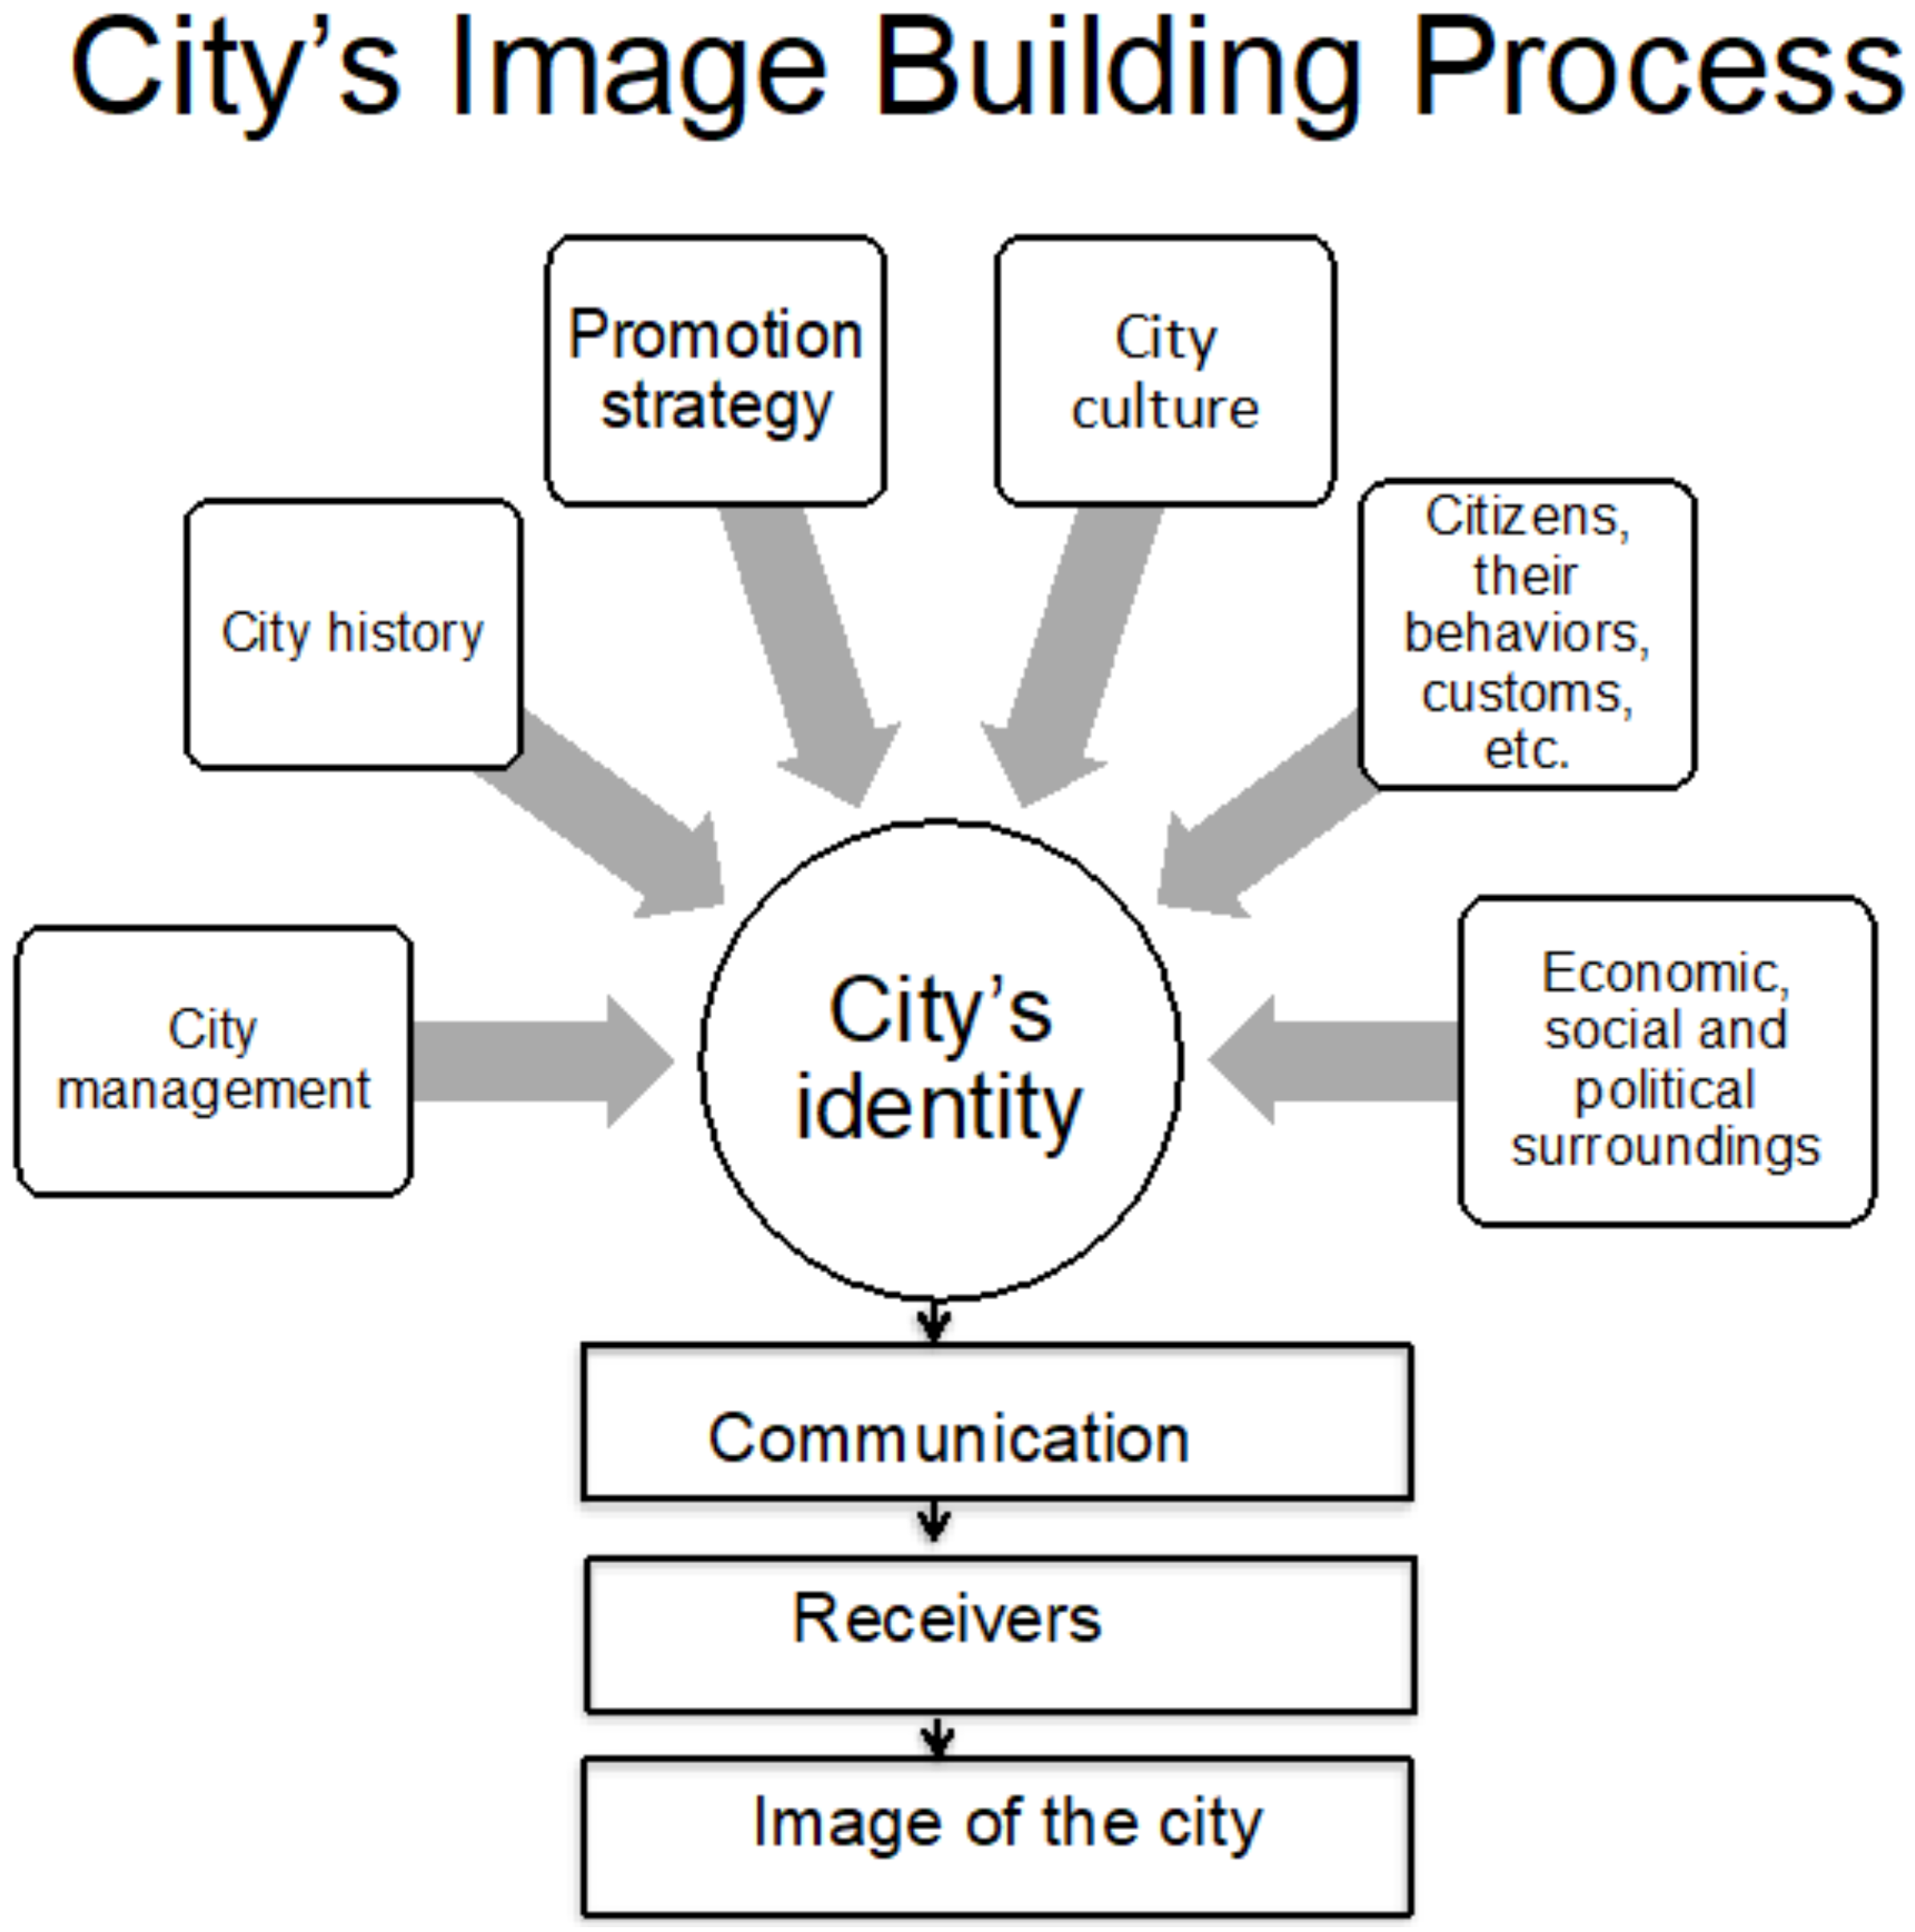
There are many features influencing a city’s image [8]. One of the most crucial is the identity of the particular place [83]. The city’s identity is displayed (communicated) through the following components: structural (location, history, monuments), semi-static (city size, physical appearance, buildings, mentality of residents), and “coloring” ones, such as symbols, behaviors, forms of communication between the city (culture), and the surroundings [84,85,86].
The image of the city is influenced by many determinants. It is grounded into cultural, social, and political contexts [47]; it depends on promotion strategy and events [40]; it is dependent on the trends in the market [29]; it is influenced by many conflicting messages sent by the city [7]; the place image is formed internally by residents and externally by visitors [87]. Keeping in mind all of these determinants, the image of the city needs to be planned [69] and consequently marketed [7].
To sum up, the image of a city is a complex phenomenon [38,88]. Considering all the features and characteristics above, one may propose a more advanced model of the image-building process (Figure 1).
The concept of place image is based on several disciplines [2], some of which have been mentioned in this article. Numerous approaches permit a more in-depth understanding of the city image and of the process of its construction, management, and communication. It is communicated not only through promotion, but also through other marketing measures [17,89], as well as by various members of a social system where it appears [17]. As Kavaratzis stressed, the image of the city is communicated by three types of communication: primary (particular features of the place), secondary (public relations and advertisements activities), and tertiary (“word of mouth”) [90]. The first two can be managed and controlled, and this is why to some extent, the city image can be planned by bodies responsible for place marketing or branding strategy.
2.2. Modeling Methodology
The use of graphical representations in a systemic approach to social sciences attracted the attention of researchers in the early 1970s, when two research projects were initiated in Batelle. As a result, two approaches using graphical tools for problem analysis were developed: Interpretive Structural Modeling (ISM) [91] and the DEcision MAking Trial and Evaluation Laboratory (DEMATEL) [92,93]. The original WINGS method [94] was inspired by DEMATEL, which can be regarded as its direct precursor. About a decade earlier, Forrester introduced System Dynamics (SD) to study the dynamics of complex systems [95]. Since then, system dynamics has been successfully applied to model social systems and to develop strategies, with a focus on business and public policy applications [96]. However, it has its limitations, as many problems that appear in social systems cannot be structured in a stock-and-flow framework of quantitative SD [97].
The causal (or cognitive) mapping is a helpful tool in structuring complex problems and evaluating potential options. It is regarded as a relatively easy and understandable technique also for inexperienced users. However, due to its qualitative nature, it suffers from indetermination and indistinction [98,99]. Those problems have caused researchers to develop quantitative approaches built on the base of cognitive maps.
Allowing a quantitative analysis, Fuzzy Cognitive Maps (FCM), introduced by Kosko [100], overcome the above-mentioned drawbacks of causal maps. They have gained an important position in the systems research community [101]. In their review Papageorgiou and Salmeron [102], the authors reported a substantial increase in studies on FCM in 2000–2010. FCM was widely used in participatory modeling (e.g., [97,103]). It can be helpful in supporting planning decisions in engineering and technology management [104] and in scenario building [105,106]. FCM seems to be also a valuable tool in future studies [107].
The main drawback of FCM lies in its arbitrary choice of the threshold function. As Penn et al. [103] stated: “ …it is clear that the functional form of the mapping may make an equal or even greater difference to the results than the scenarios themselves.” Despite the differences in the assumptions and formalism, the modified WINGS method can be used for the same purposes as FCM. As WINGS has some advantages over FCM, we believe that it can be suitable for quantitative analysis of social systems and become a valuable alternative approach.
3. The Extended WINGS Method
Since its introduction in 2013, the WINGS method has been found useful for solving various decision problems. It was applied to: the analysis of key competencies for a position in a medium-sized automotive company [108], the choice of an investment option in a healthcare unit [109], identifying possible relationships among factors measuring Customer Relationship Management (CRM) performance [110]. industry risk assessment [111], choosing a Public Relations (PR) strategy during a reputation crisis [112], supporting decision making in civil engineering [113,114], innovation project selection [115], classification of multi-market investment funds [116], and prioritization of stock investment funds [117].
Recently, the extended form of WINGS was introduced [60]. Below, we present a brief description of this novel approach. It consists of three main stages: (1) qualitative analysis, (2) quantitative evaluation, and (3) calculations (technical stage). The procedure is led by an analyst (called also the modeler), who works independently of or in cooperation with experts and/or stakeholders. For convenience, an analyst or a group of people who carry out the procedure are hereafter referred to as “a user”.
3.1. Qualitative Analysis
The first stage is devoted to the structuring of the problem. During this phase, the user builds a causal map of the system under study. Formally, a causal map is a digraph whose nodes represent system components (concepts) and arrows represent their mutual influences. Then, the user chooses a linguistic scale for the evaluation of the components of the map. It may have three points, e.g., weak/low, medium, strong/high, or more. It is advised to use a limited number of points on the scale (e.g., 3–5); however, this is a matter of user preferences. Using the selected scale, the user assesses:
- The initial state of each node (In general, this attribute can play different roles depending on the type of system, relations, and the component itself. It can serve as a qualitative assessment of physical size, cardinality, political power, importance, or any other relevant qualitative characteristics [60].). This attribute can have also a value of zero (none).
- A level of influence that is attributed to each arrow.
3.2. Quantitative Evaluation
The essence of the WINGS approach is to enhance the limited capability of quantitative analysis based on causal mapping. This is achieved thanks to assigning numerical values to verbal evaluations set up in the previous stage. The natural way is to assign a value one to the lowest non-zero verbal mark (e.g., weak/low or very weak/very low). Then, the higher values (e.g., 2, 3, …) are assigned by comparison to the lowest level. Formally, the causal map labeled with all estimated values is translated into an adjacency matrix, as is described in detail in the next subsection. With quantitative evaluations, WINGS allows carrying out the semi-quantitative evaluation of the system development and drawing valuable conclusions about its behavior. It is achieved by calculating the effects of the interactions along paths of any length and adding them together.
3.3. Technical Stage: Calculation of Output
The technical stage consists of the following steps [60]:
- All numbers are inserted into the direct strength-influence matrix , which is an matrix with elements (n is the number of components in the system), where: = initial state of component i, and = influence of component i on component j.
- The matrix is scaled according to the following formula:where is the scaled strength-influence matrix, and the scaling factor is defined as the sum of absolute values of all elements of , i.e.:
- The total strength-influence matrix is calculated from the following formula (with the scaling defined in Equation (1), the series below converges, and thus, is well defined; the proof is given in [60]):Matrix represents the sum of influences along all possible paths in the WINGS digraph. If the initial state has a non-zero value, a self-loop of arbitrary length occurs in the digraph, even if it does not contain loops. However, it should be noted that due to scaling, the contribution becomes lower with the path length.
- For each element in the system, the row sum and the column sum of are calculated:
- For each element in the system, the row sum and the column sum of are calculated:where are the elements of .
The core WINGS output for each component i consists of two groups of numerical indicators. The first group comprises the relative (net) impact, receptivity, involvement, and role:
- : the relative total impact represents the net (algebraic sum of positive and negative items) influence of component i on all other components in the system,
- : the relative total receptivity represents the net influence of all other components in the system on component i,
- : the relative total involvement represents the sum of all net influences exerted on and received by component i,
- indicates the net role (position) of component i in the system; if it is positive, component i belongs to the net influencing (cause) group; if it is negative, component i belongs to the net influenced (result) group.
The addends in Equation (4) can be positive or negative; hence, their algebraic sum reflects the relative levels of total impact and receptivity. As a result, both relative total impact and receptivity can be positive or negative. We define the relative total involvement and role as the sum and difference of absolute values, because the compensation between and would distort the meaning of involvement and role.
The second group comprises absolute impact, receptivity, involvement, and role:
- : the absolute total impact represents the absolute influence of component i on all other components in the system,
- : the absolute total receptivity represents the absolute influence of all other components in the system on component i,
- : the absolute total involvement represents the sum of all absolute influences exerted on and received by component i,
- : the absolute role (position); if it is positive, component i belongs to the absolute influencing (cause) group; if it is negative, component i belongs to the absolute influenced (result) group.
According to Equation (5), the absolute total impact and receptivity are defined by the sum of the absolute values of the elements of . There is no compensation in this sum; hence, they represent the absolute power of exerted and received influences. The combination of relative and absolute measures provides a comprehensive evaluation of the system components.
4. Systemic Model of the Katowice Image
4.1. Image of Katowice: The Industrial City in Poland
The city of Katowice (as the subject of analysis) was chosen for two reasons. First, the promotion strategy developed by the local government to change its image is relatively new (2012). Second, a consistent implementation of this promotion strategy allows analyzing the decisions made by the city authorities.
The promotion strategy of Katowice was created in 2011–2012 and is evaluated every other year, which helps to perform comparisons and measure its outcomes. The city authorities invited the inhabitants of Katowice, representatives of the cultural and business institutions, and the regional media to participate actively in the process. During the discussion, a number of strengths and weaknesses of the city were identified (https://www.katowice.eu/miasto/o-mieście/strategia-promocji-miasta). Some of them are listed below.
- I.
- Main strengths of Katowice:
- It is located in the central part of the Silesian Province, concentrates large capital, and constitutes a large market (for instance, the Silesia City Center shopping mall has 13 million visitors annually).
- It is a vital city that keeps increasing its potential in the process of economic transformations.
- It is a regional, educational, research and development, cultural, health, and sports and recreation center.
- Its urban space, industrial centers, modernist, and post-industrial architecture, favors modern, non-commercial, and independent culture and art. Cultural events and festivals are often organized in its public space.
- It has a high number of students in relation to the number of inhabitants, which enhances its attractiveness for investors. It is a also a good job market.
- Its many investment projects have a crucial influence on its desired image.
- The local community is hospitable and open to visitors.
- Its residents are aware of its metropolitan functions.
- Its residents are very receptive to promotional activities aimed at redefining its image.
- Its residents have been very receptive to the changes occurring during the last decade.
- II.
- Main weaknesses of Katowice:
- Declining population: In nation-wide surveys, it is not perceived as a “good place to live”.
- Low attractiveness of its central district.
- Low level of environmental responsibility of the local population.
- Lack of messages conveying Katowice’s position as the capital of the Silesian metropolitan area.
- Low attractiveness as a cultural center.
- Weak tourist offerings.
- Poor quality of city life (in the opinion of investors).
- Lack of comprehensive solutions for public transport.
- Inadequate promotion of its characteristic heritage (Silesian, multicultural, industrial).
Two features were identified as the basic characteristics of Katowice’s identity (called “real image” in the Katowice Promotion Strategy): its metropolitan character and its historical, cultural, and industrial heritage. The authors of the promotion strategy identified three key attributes that characterize Katowice’s multi-dimensional changes: metropolitan character, heritage, and transformation (Visual Identity System of Katowice, 2012, https://www.katowice.eu/miasto/o-mieście/strategia-promocji-miasta).
The authorities of Katowice examine the implemented promotion strategy every other year. Its overall purpose is to create a city image that would allow Katowice to be perceived as: “a good place to live an economic center, a meeting center, a culture and entertainment center, and a higher education center”.
In 2011, 2014, and 2015, just before and during the implementation of the Promotion Strategy, opinion polls, commissioned by the self-government of the city of Katowice, were conducted. They showed that Katowice was perceived as a city of the mining industry by respondents in all the representative samples studied: nation-wide, in the Silesia region, and in Katowice itself (Katowice Image Diagnosis, 2016). Respondents did not perceive Katowice as a rich, developing city. Only 1% of the city’s inhabitants perceived it as modern. However, it should also be stressed that the city’s inhabitants more and more like their city.
Respondents recognized the changes that have taken place in Katowice since the 1990s. Katowice is seen as a city of “great events”. Respondents in all surveyed groups perceived its great potential, but they believed that it is not fully used. People from outside the Silesia Region do not want to live here. Hence, Katowice has not built an image of a good place to live, despite many social and economic indicators favoring it.
Large-scale events (sports, entertainment, and cultural) organized in Katowice confirm its image as a “great event city”, created 20 years ago. It should be mentioned that the activities of the local authorities to promote the new image have not produced the expected results so far. Numerous events, festivals, concerts, shows, and sporting events reinforce its image formed in the 1990s, although the authorities would prefer to create a new image. This generates a cognitive dissonance, but more in-depth research is needed to understand its sources.
The results of the surveys suggested that the old image (including stereotypes) of Katowice still exists in the minds of the inhabitants of Poland, the Silesia Province, and the city itself. This is why it might be worthwhile to make a quantitative evaluation of Katowice’s image and its development using the systemic approach.
4.2. Quantitative Evaluations of Katowice Image: Forecasting the System Development
A causal map was built by the team consisting of four members. One co-author (J.M.) played the role of analyst. Two other co-authors (A.A-M. and G.P.) served as the experts. A representative of the city authorities was the forth member of the team (Collaboration of researchers and practitioners in building the causal map gave the best results. In our case, the involvement of more practitioners would be desirable, but this unfortunately did not happen. In future studies, a team consisting of 4–6 members with a larger share of practitioners can enhance the quality of the model.). After a few session’s the single version of the map was agreed upon by all members of the team. In the next step, the analyst asked the other team members to assess the power of influence for each of the links existing in the map. For this task and also for the evaluation of the initial states, the five-point verbal scale was used. Where available, the initial states of the concepts were extracted from the public survey. In other cases, the team members provided their opinion. After mapping the verbal evaluations to the numerical scale, we were able to use the WINGS method to compute the final states of the concepts.
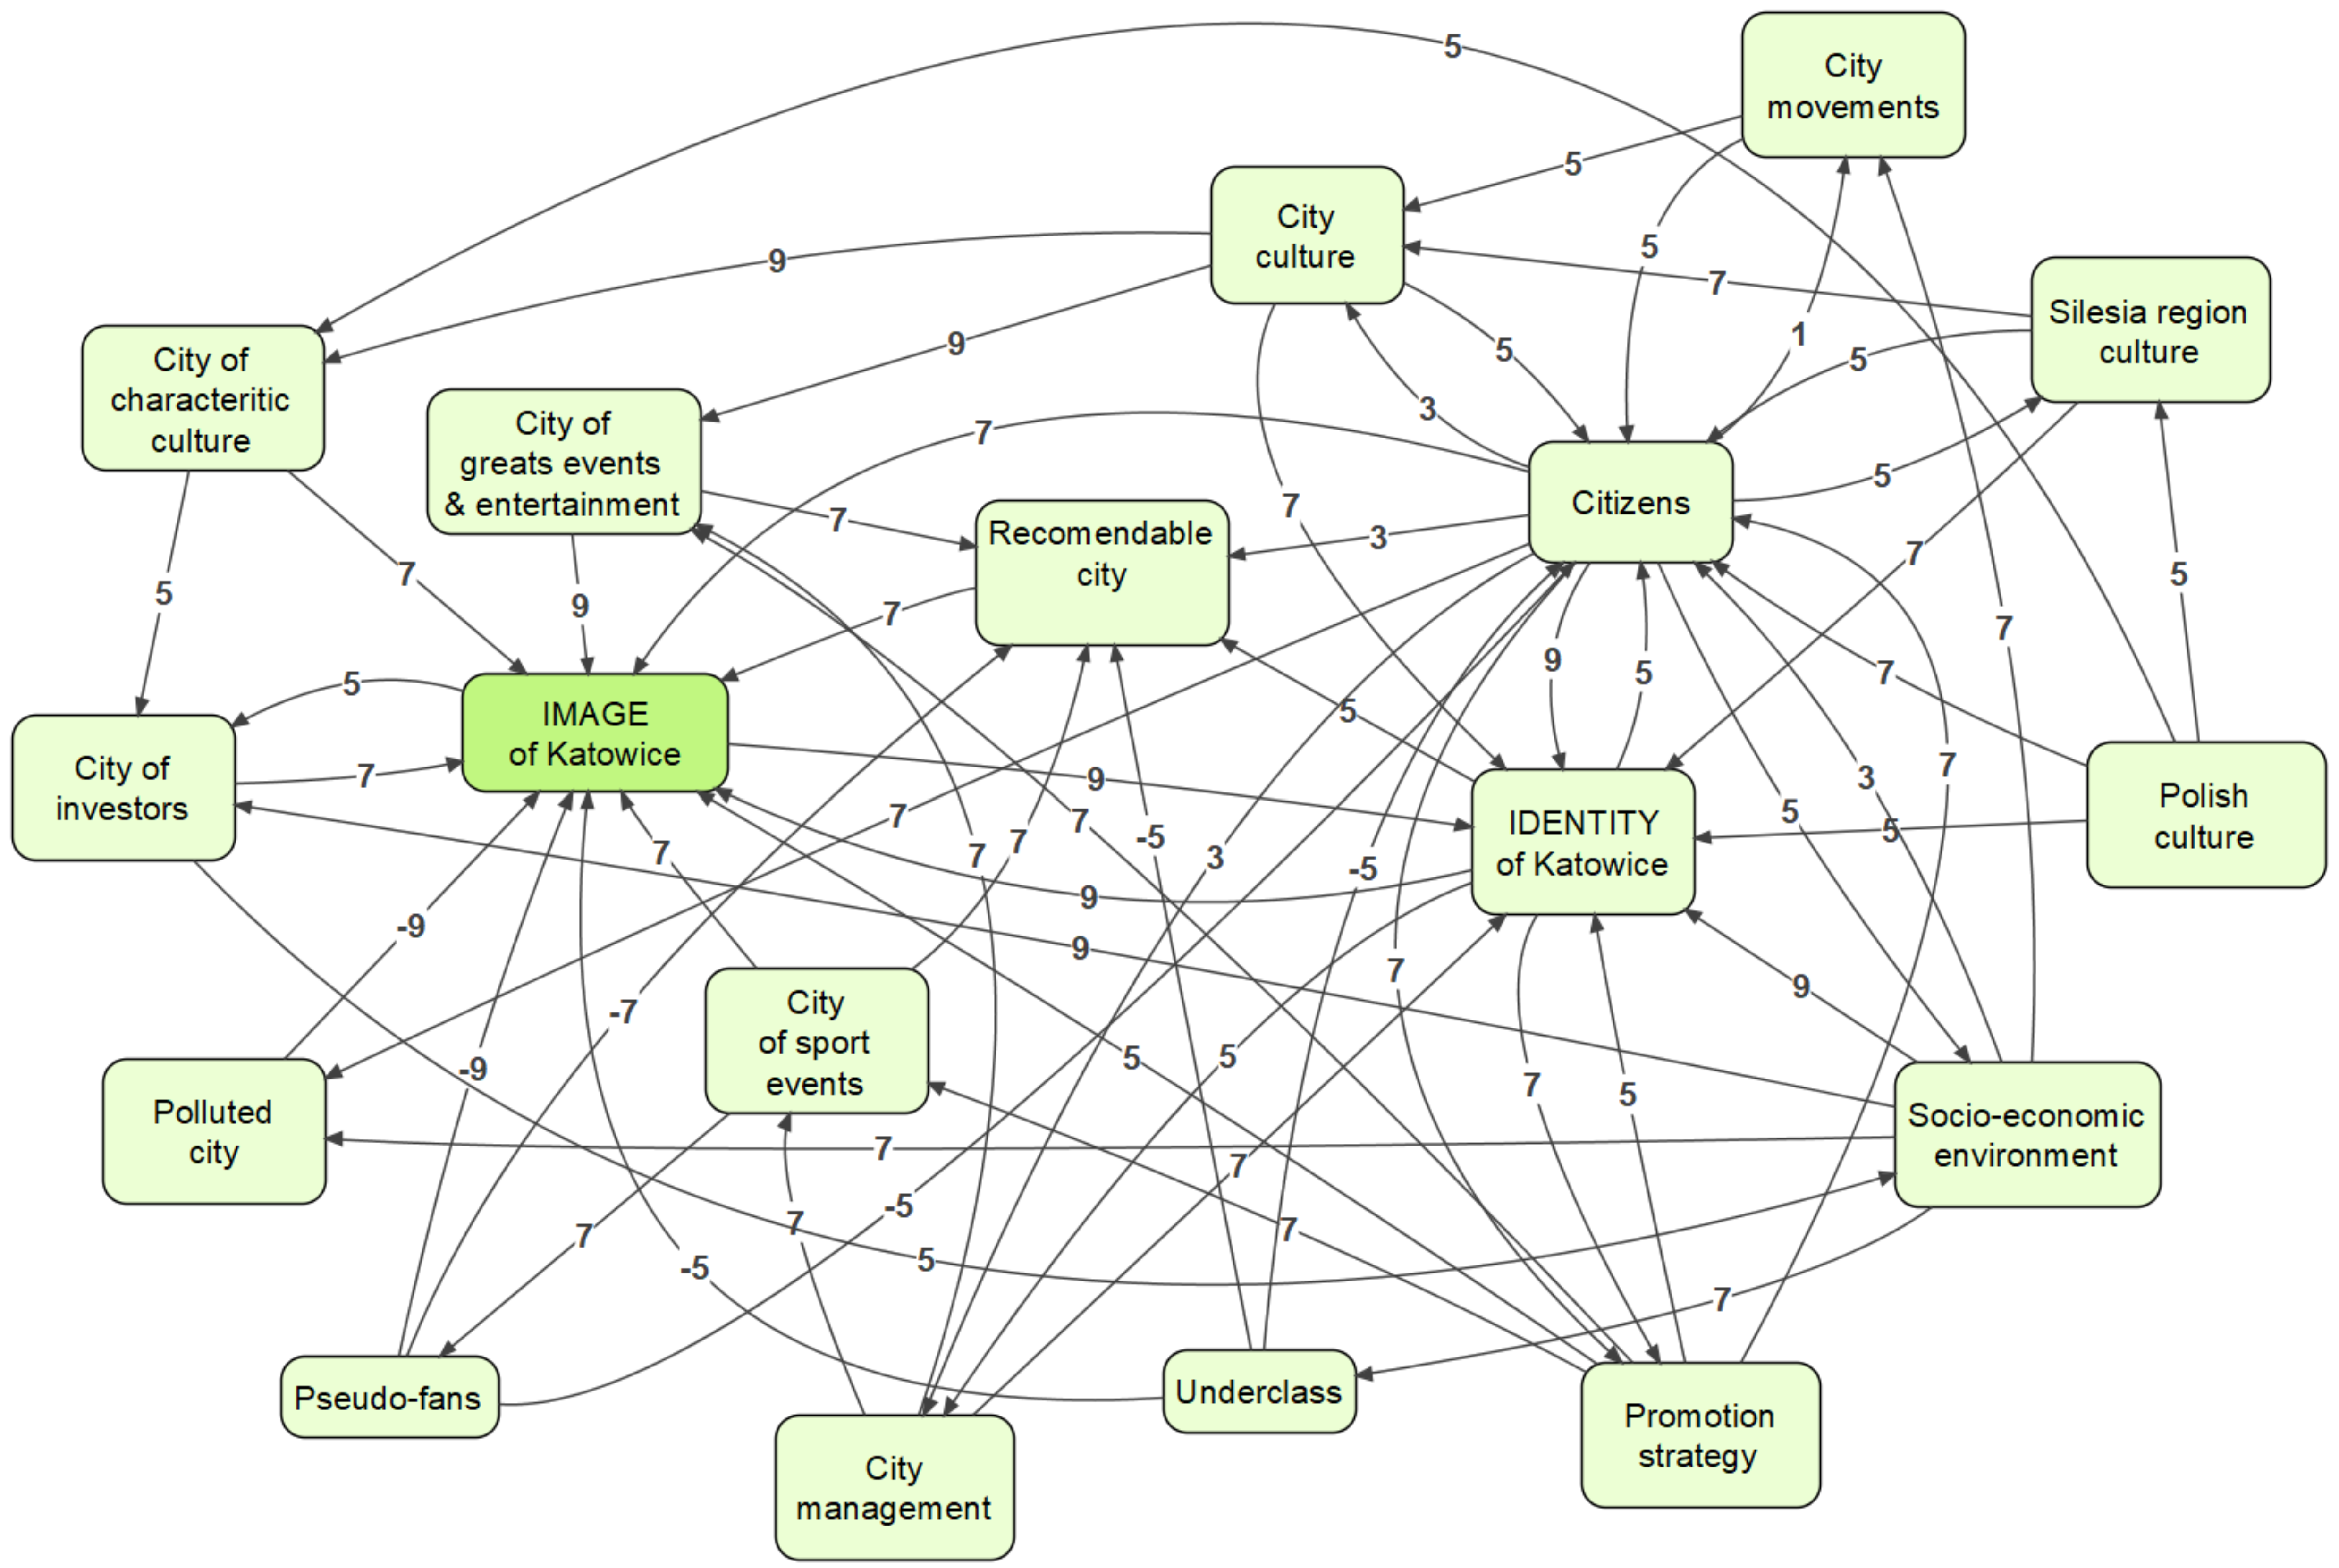
The list of factors, including the “image of Katowice” itself, consisted of 18 items. The team, mentioned above, evaluated their impact and power of influence on the following scale (for both positive and negative influence): 1, very weak; 3, weak; 5, medium; 7, strong; 9, very strong; (intermediate points: 2, 4, 6, 8 can be used if needed for a more precise assessment). The resulting network is presented in Figure 2.
The initial states of six factors: polluted city, city for investors, city of characteristic culture, city of great events and entertainment, recommendable city, and city of sport events were taken from Katowice Image Diagnosis. The mapping of the data (from a survey conducted on a group of 1000 Polish citizens) onto the values representing the initial states is explained in the following example. The percentage of respondents that agreed that “Katowice is a good place for investing” was divided by 10 and placed on the main diagonal of the direct strength-influence matrix for the factor “city for investors” (the actual value was 6.9). The values of other factors were determined in the same way. The strength of “city movements” was estimated by the percentage of the inhabitants of Katowice who voted in the participatory budgeting process (also divided by 10). These data were not available for 2011 (there was no participatory budgeting that year, so the initial strength was set close to zero, namely 0.1). The initial state values for all the remaining factors were estimated by the experts according to their knowledge (on the same scale of 0–10). The complete initial data are presented in Table 1.
In Table 2, were compare the relative levels calculated from the model with those extracted from the survey report: Katowice Promotion Strategy, 2012). In general, the model agreed with the survey results. We observed that our model substantially underestimated the strength of “city movements” in both 2014 and 2015. The underestimation in 2014 may be caused by a lack of data in 2011 and by the arbitrary value of the initial state, that is 0.1.
Taking into account that the model is a semi-quantitative approach rather than an exact quantitative forecast and that it is obviously a simplified picture of a real system, we can state that it generally mirrors the real system behavior. We can expect even better results if we carry out additional tuning of the experts’ evaluation.
4.3. Discussion
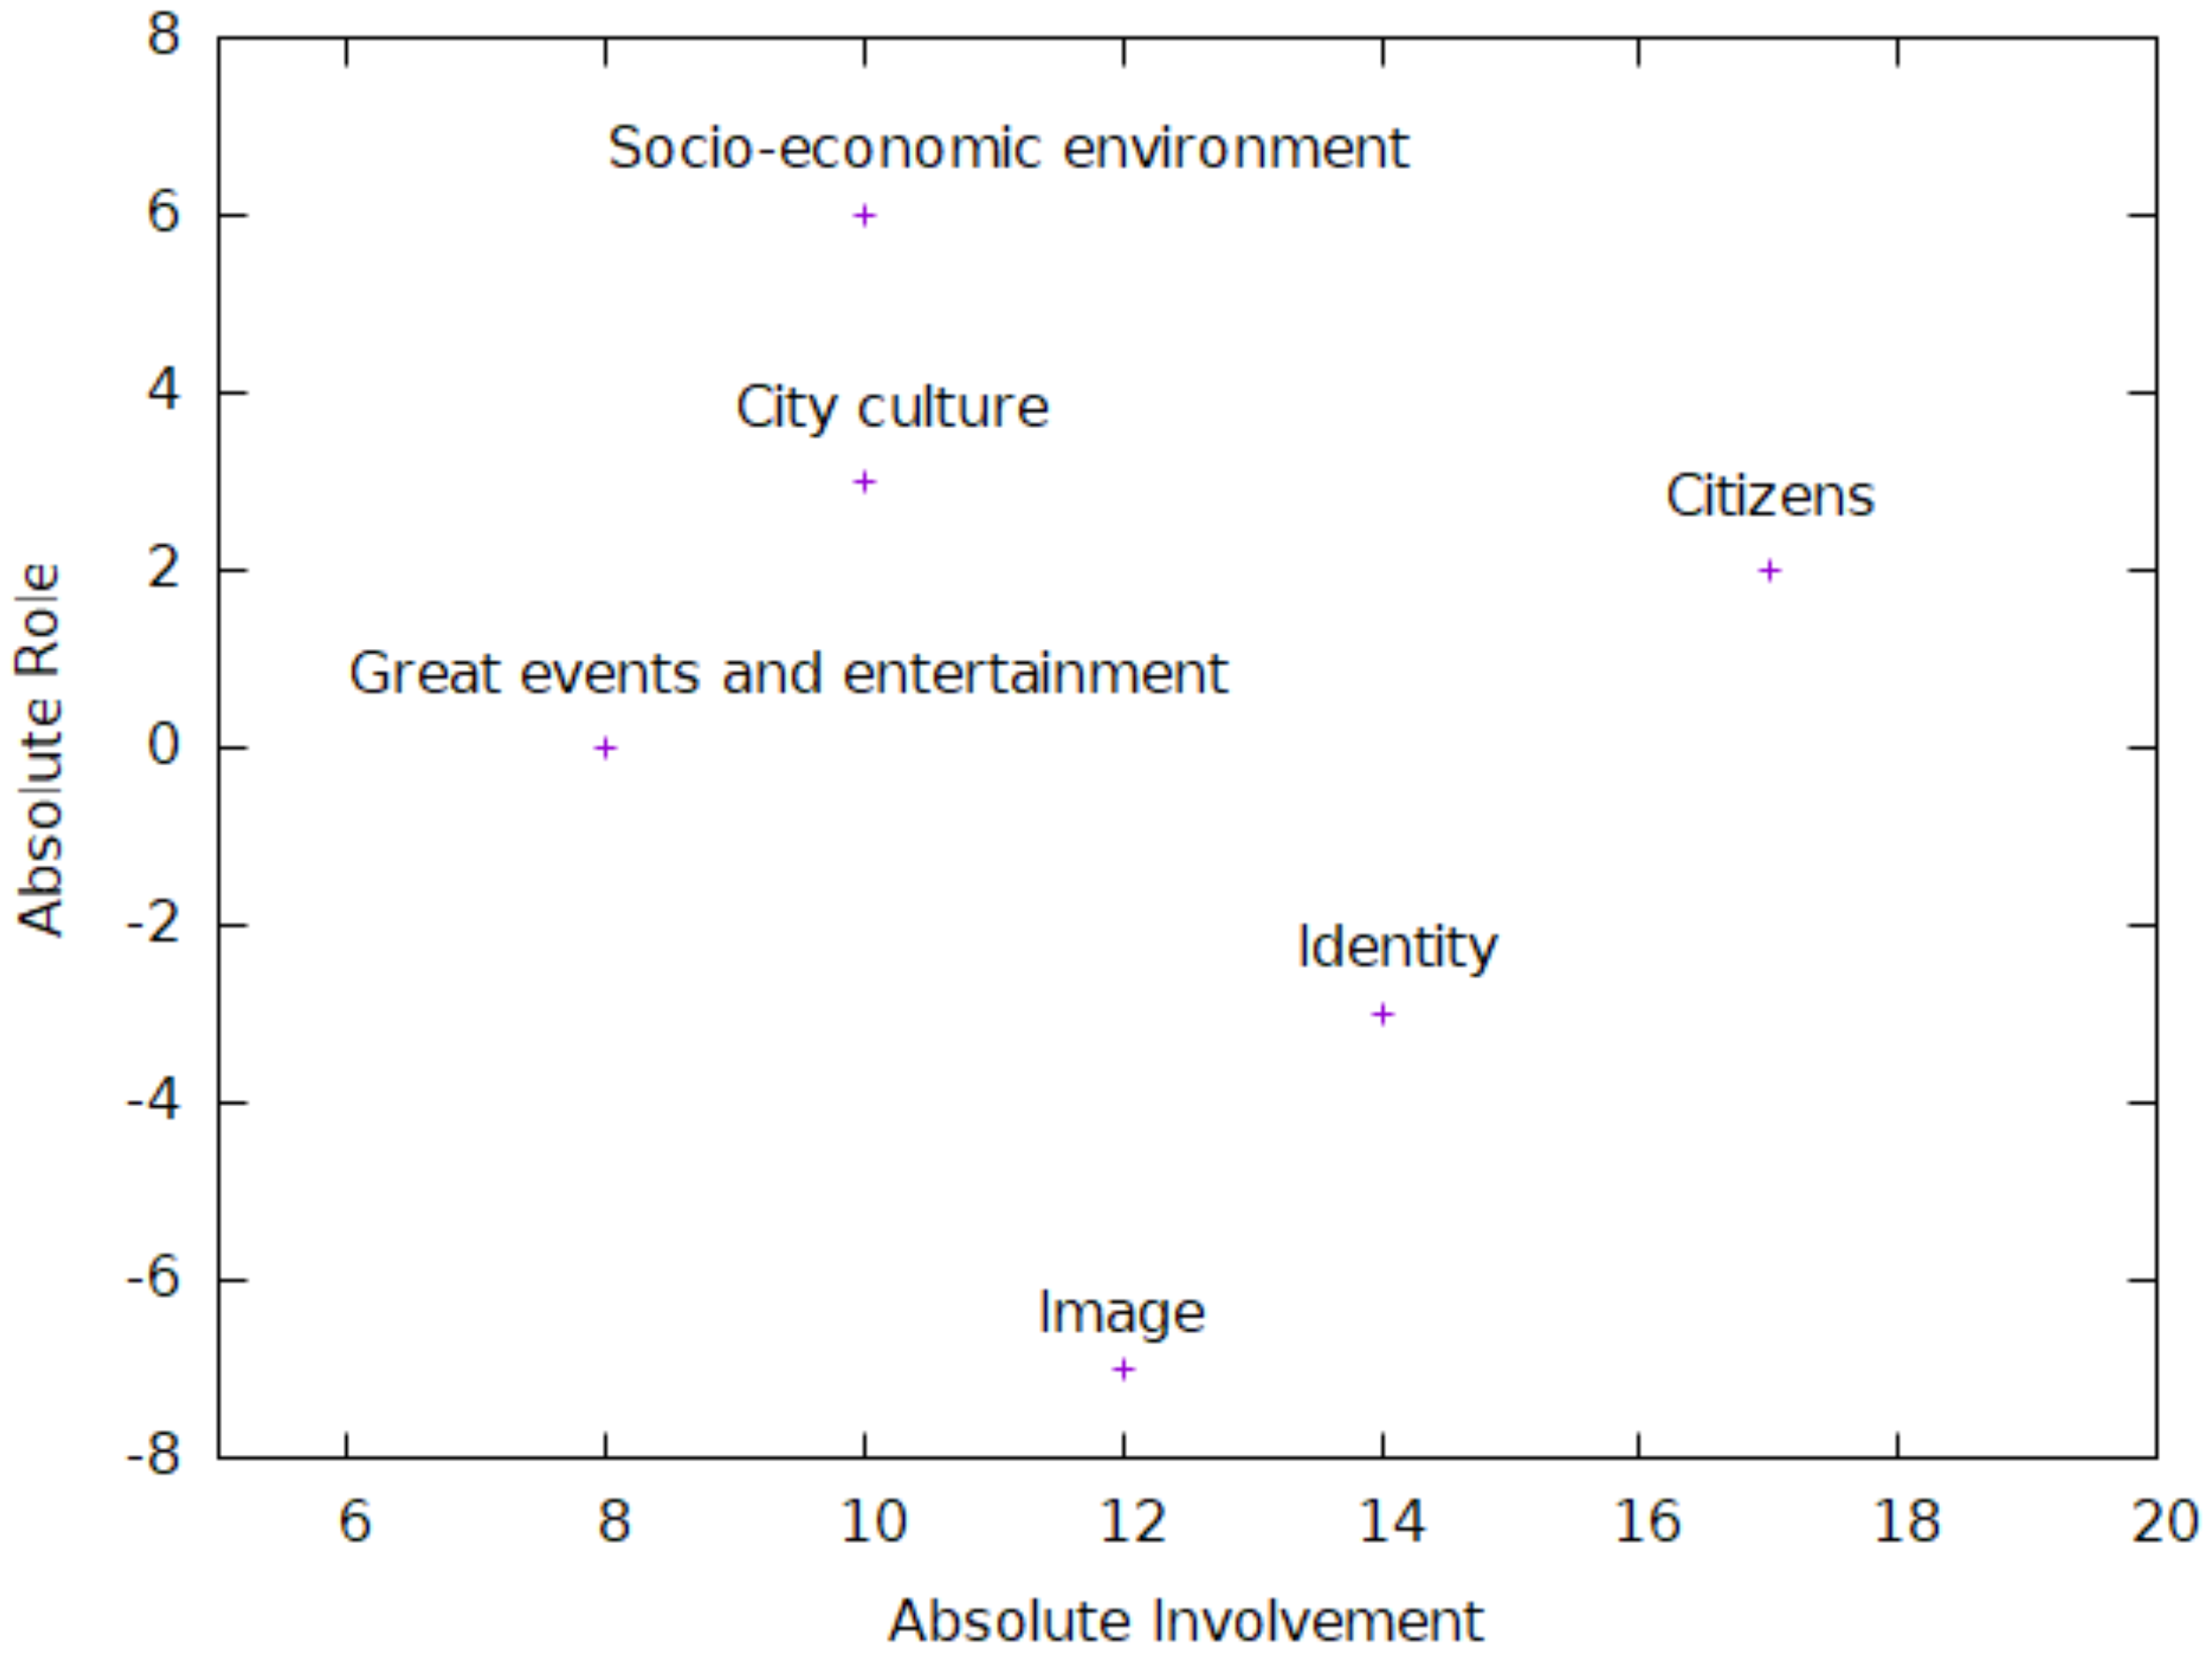
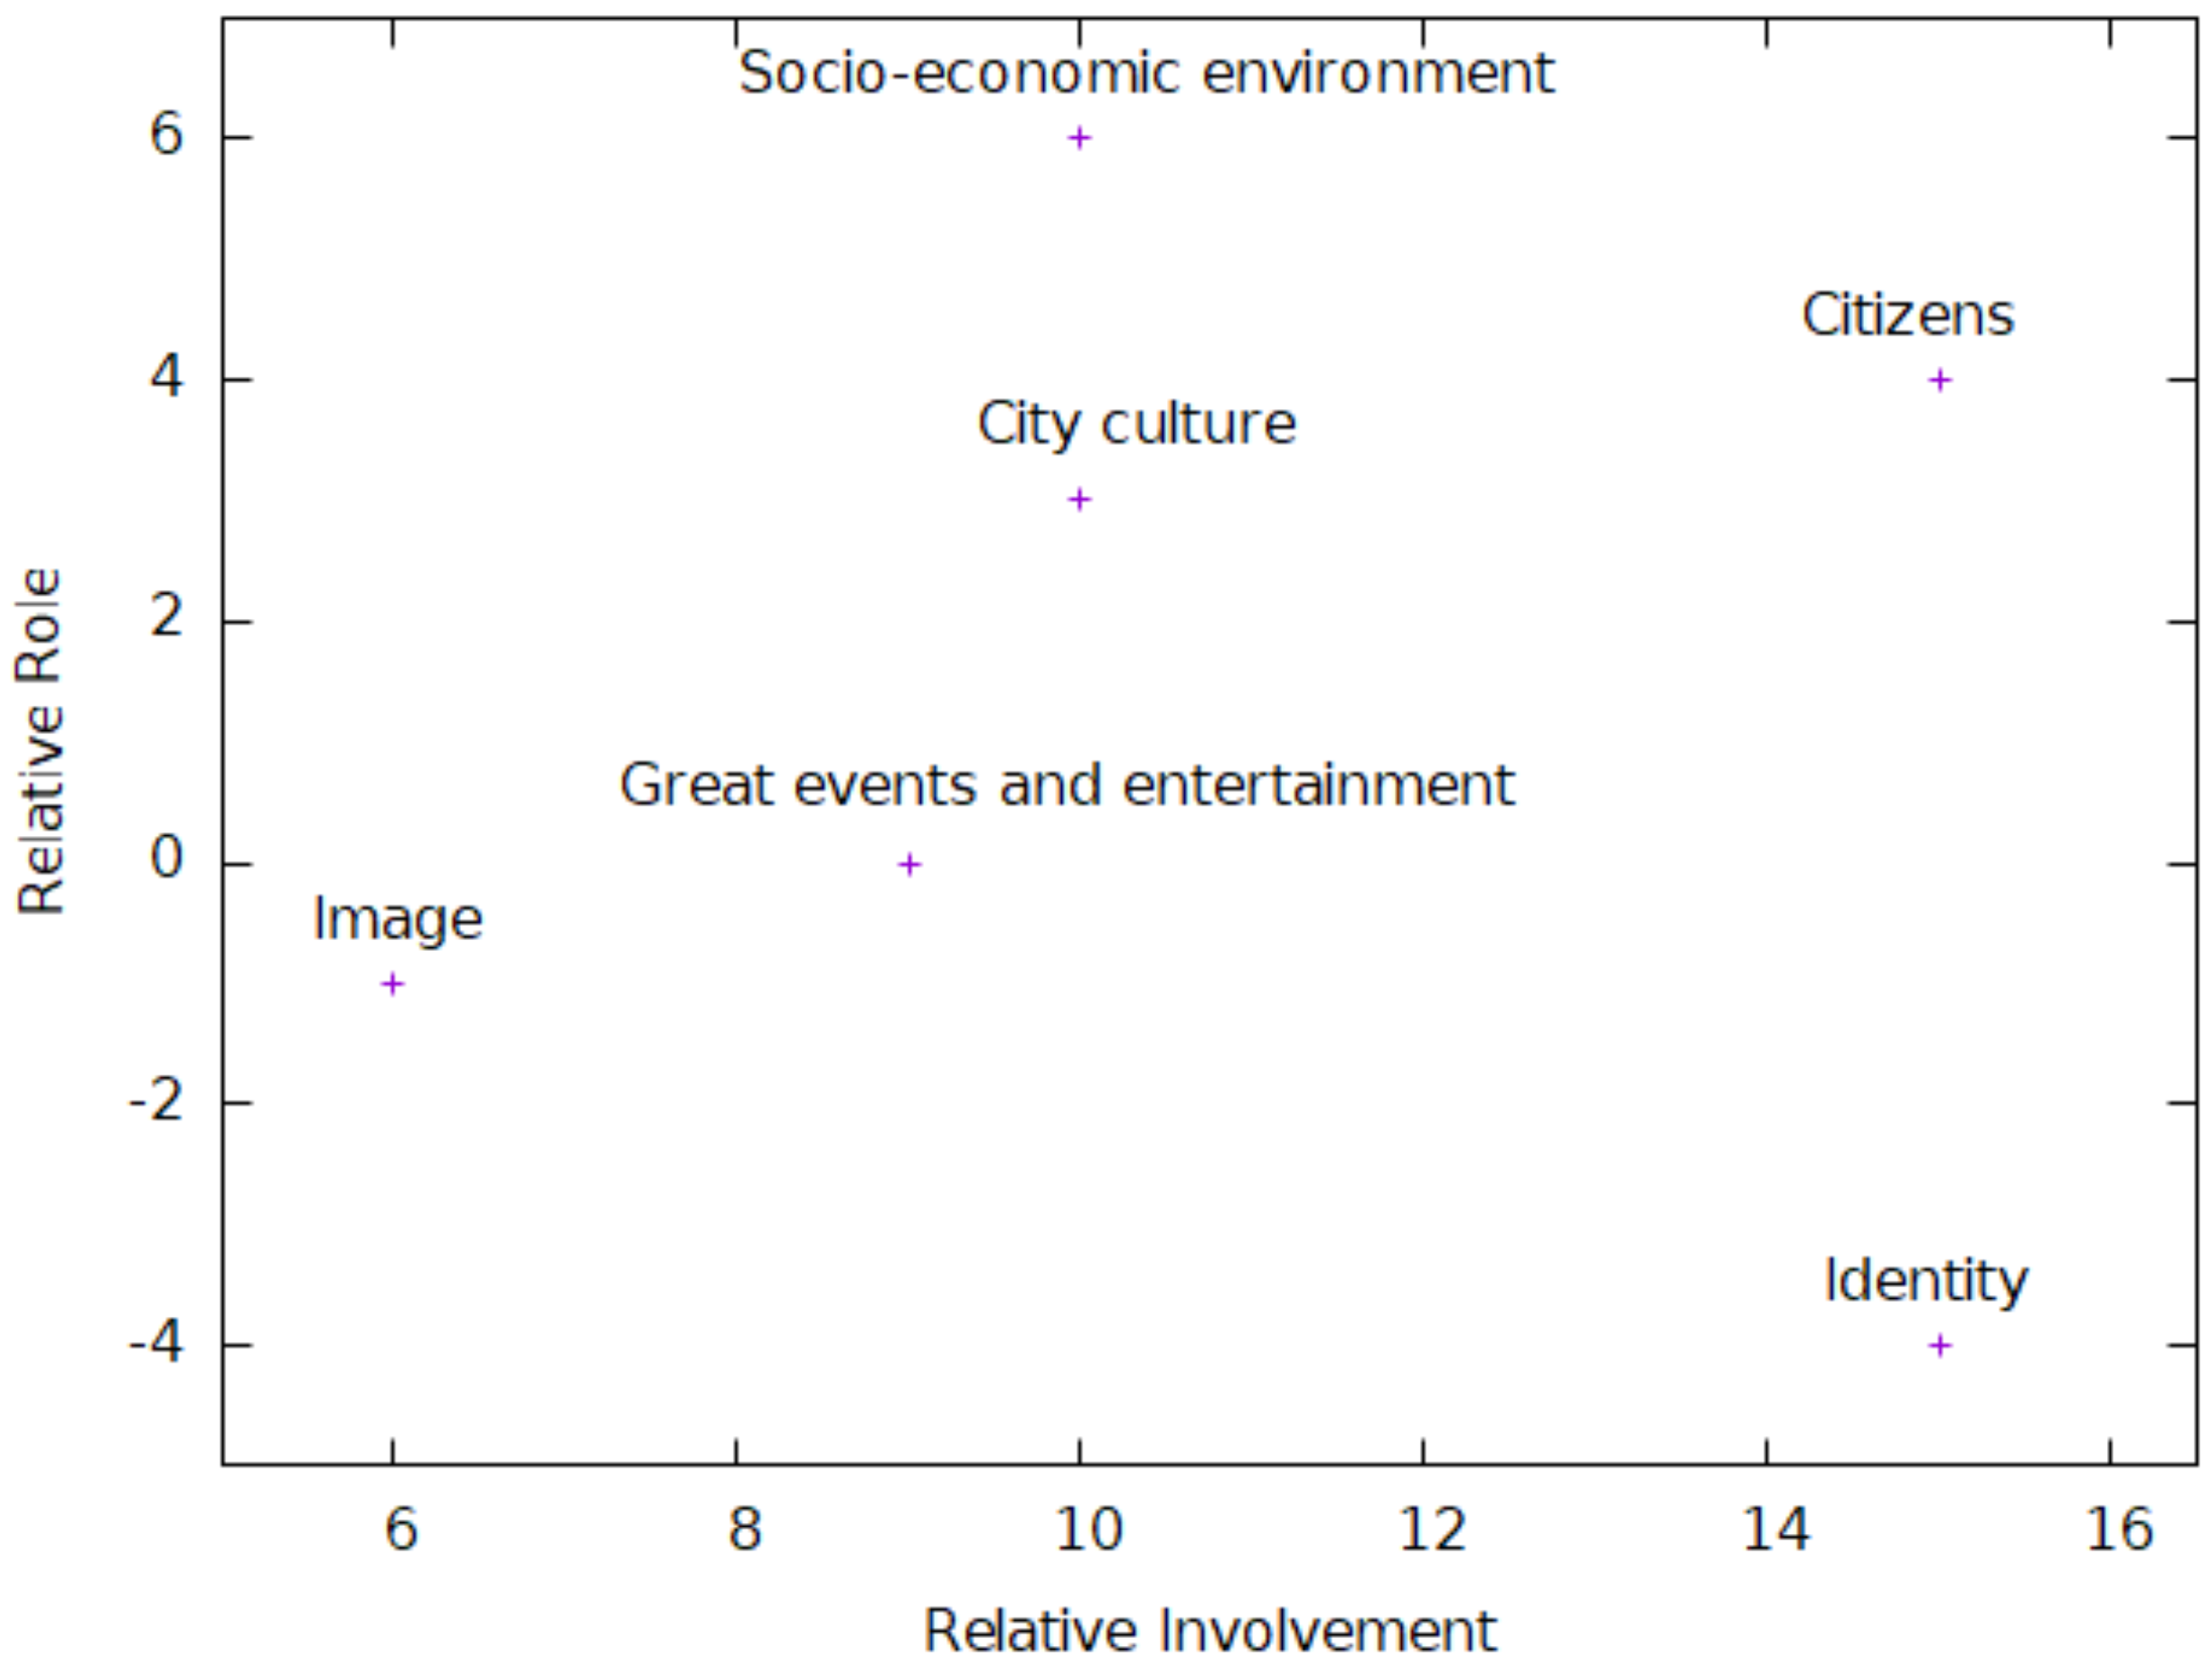
The output of the model is presented in Table 3 and Table 4 and in Figure 3 and Figure 4. It includes two sets of indicators: absolute and relative (they are all defined in Section 3.3). In each of them, there are four indicators characterizing the interaction of a given concept with the other concepts in the system. The absolute indicators represent the status and strength of interrelations calculated from the absolute input data. That means they do not take into account the negative couplings. The relative indicators are calculated from the original input data, so they are the net measures of concept relations. The analysis of indicators and their comparisons gave a deep insight into the importance and role of system components.
In both rankings, the highest six positions were occupied by the same concepts. Two of them were central concepts, “image” and “identity”, and in both cases, they belonged to the influenced group. “Image” is a subject of more negative influences than “identity”, so its position in Figure 4 is closer to point than in Figure 3. The role of “city of great events and entertainment” was close to zero (positive in absolute terms and negative in relative ones). It is an important factor, but its active and passive roles were in balance. The other three concepts: citizens, socio-economic environment, and city culture represent the influencing group. The highest values of involvement (both absolute and relative) were achieved by citizens, which confirms the utmost importance of the local community in creating the city image. This position is confirmed by citizens’ relative role: the second highest and positive in the system. In both rankings, “socio-economic environment” was a leader in terms of the role. Although its involvement was lower than that of “citizens”, the difference between its impact and receptivity was the highest. This shows its high potential in creating the city image.
There were three factors with a negative impact: “underclass”, “pseudo-fans”, and “polluted city”. among them, pseudo-fans had the highest negative relative impact and the highest relative involvement and was the only influencing negative factor. Although the absolute involvement of pseudo-fans was moderate in comparison with the others factors, its role in weakening the city image was substantial.
The above observations that resulted from the WINGS output gave clear tips on what to do to strengthen the image of the city of Katowice. They suggested what actions should get the highest priority. Obviously, among them are:
- Make appropriate corrections (extensions, shifts, new initiatives) in policies focusing on the local community.
- Intensify the efforts in strengthening the socio-economic environment.
- Enrich the cultural offer.
- Undertake the number of actions that minimize the negative impact of pseudo-fans.
Specific actions will result from comprehensive analysis of the current strategy for the city.
5. Conclusions
In this paper, we presented a novel approach, the extended WINGS method, that can be widely used in the analysis of complex social systems. WINGS facilitates understanding the behavior of a studied system and the formulation of appropriate actions.
The proposed approach has many advantages that make it a useful tool in the analysis of social systems:
- The procedure supports the user in better understanding a system under study and the underlying problem.
- The methodology combines in a single, natural way two kinds of attributes of each concept: its internal state (or strength) and its impacts on other components in the system.
- The calculation of the final output is straightforward and does not introduce any additional arbitrary elements (e.g., functions and parameters) that are difficult to determine and that can distort the result.
To demonstrate the practical usefulness of the extended WINGS method, we applied it to image building on the example of the city of Katowice. In cooperation with practitioners, a network of dependencies was built to represent the image of the city, its identification, and 16 other factors that also influence the city image. Part of the data pertaining to the initial state of the system (data from 2011) was assessed on the basis of the surveys of the image of Katowice, commissioned by the city office in 2011. The experts estimated the remaining states and impacts in the network. The results of the calculations were compared with data from the subsequent surveys (2014, 2015), which allowed assessing the correctness of experts’ estimation and the quality of the model. The model also helps in determining the strongest factors that have a positive or negative impact on the image of the city. Thanks to that, this method can become a valuable tool in planning of the activities leading to the improvement of the city image and in such a way remove the imbalance between the image and the reality.
The results of the study were based on a number of simplifying assumptions, observational studies, and a single case study. They were therefore subject to biases and confounding factors that may have influenced our conclusions. There were several issues regarding the methodological limitations. First, the study was a preliminary one in which the authors applied the method to the case with available data. As such, the model should be verified on a more general basis. Second, place marketing and place branding are interdisciplinary concepts that demand an interdisciplinary approach to any of the related issues. That is why earlier research studies assumed by the authors to be relevant to their research might be also limited.
The study has implications for those who deal with city brand and image, and more generally, for policymakers and their approach to communication. A city is a socio-economic complex that, on the one hand, provides living conditions for its inhabitants, but on the other, it competes with the others for measures ensuring these conditions. An examination of previous studies has disclosed that research hardly focuses on the decision-making process of those who are responsible for the city change and progress. City image is one of the many factors determining the process of city development. What is more, it appears that “universal models” of city image management are locally made [118]. This paper attempts to supplement the model of city image building by drawing attention to the process of making decisions of policy makers, rather that focusing only on the process of creating the image itself. It also endeavors for a more thorough understanding of the concept of city image by emphasizing the main factors and their strengths influencing the decisions on how to build, change, or rebuild the place image.
6. Web Page
Author Contributions
Conceptualization, A.A.-M. and J.M.; formal analysis, J.M.; funding acquisition, A.A.-M., J.M., and G.P.; investigation, A.A.-M., J.M., and G.P.; methodology, A.A.-M., J.M., and G.P.; project administration, A.A.-M. and J.M.; resources, A.A.-M.; software, J.M.; supervision, J.M.; validation, A.A.-M., J.M., and G.P.; writing, original draft preparation, A.A.-M., J.M., and G.P.; writing, review and editing, A.A.-M., J.M., and G.P.
Funding
This research was funded partly (J.M.) by the National Science Centre, Poland, under Decision No. DEC-2013/09/B/HS4/01102.
Conflicts of Interest
The authors declare no conflict of interest. The funders had no role in the design of the study; in the collection, analyses, or interpretation of data; in the writing of the manuscript; nor in the decision to publish the results.
References
- Anholt, S. Anholt City Brand Index–How the World Views Its Cities, 2nd ed.; Global Market Insight: Bellevue, WA, USA, 2006. [Google Scholar]
- Ashworth, G.; Kavaratzis, M. Beyond the logo: Brand management for cities. J. Brand Manag. 2009, 16, 520–531. [Google Scholar] [CrossRef]
- Ashworth, G.; Kavaratzis, M. (Eds.) Towards Effective Place Brand Management: Branding European Cities and Regions; Edward Elgar Pub: Cheltenham, UK; Northampton, MA, USA, 2010. [Google Scholar]
- Braun, E. Putting city branding into practice. J. Brand Manag. 2012, 19, 257–267. [Google Scholar] [CrossRef]
- Braun, E.; Kavaratzis, M.; Zenker, S. My city–my brand: The different roles of residents in place branding. J. Place Manag. Dev. 2013, 6, 18–28. [Google Scholar] [CrossRef]
- Gertner, D. A (tentative) meta-analysis of the ‘place marketing’ and ‘place branding’ literature. J. Brand Manag. 2011, 19, 112–131. [Google Scholar] [CrossRef]
- Kavaratzis, M. From city marketing to city branding: Towards a theoretical framework for developing city brands. Place Brand. 2004, 1, 58–73. [Google Scholar] [CrossRef]
- Larsen, H.G. A hypothesis of the dimensional organization of the city construct. A starting point for city brand positioning. J. Destin. Mark. Manag. 2015, 4, 13–23. [Google Scholar] [CrossRef]
- Lucarelli, A.; Berg, P.O. City branding: A state-of-the-art review of the research domain. J. Place Manag. Dev. 2011, 4, 9–27. [Google Scholar] [CrossRef]
- Richards, G.; Wilson, J. The Impact of Cultural Events on City Image: Rotterdam, Cultural Capital of Europe 2001. Urban Stud. 2004, 41, 1931–1951. [Google Scholar] [CrossRef]
- Roig, A.; Pritchard, A.; Morgan, N. Place-making or place branding? Case studies of catalonia and wales. In Towards Effective Place Brand Management: Branding European Cities and Regions; Edward Elgar: Cheltenham, UK, 2010; pp. 116–135. [Google Scholar]
- Smith, A. Reimaging the City: The Value of Sport Initiatives. Ann. Tour. Res. 2005, 32, 217–236. [Google Scholar] [CrossRef]
- Smith, A. Assessing the contribution of flagship projects to city image change: A quasi-experimental technique. Int. J. Tour. Res. 2006, 8, 391–404. [Google Scholar] [CrossRef]
- Lee, T.H. A Structural Model to Examine How Destination Image, Attitude, and Motivation Affect the Future Behavior of Tourists. Leis. Sci. 2009, 31, 215–236. [Google Scholar] [CrossRef]
- Vanolo, A. The image of the creative city: Some reflections on urban branding in Turin. Cities 2008, 25, 370–382. [Google Scholar] [CrossRef]
- Zenker, S.; Beckmann, S.C. Measuring brand image effects of flagship projects for place brands: The case of Hamburg. J. Brand Manag. 2013, 20, 642–655. [Google Scholar] [CrossRef]
- Ashworth, G.J.; Voogd, H. Selling the City: Marketing Approaches in Public Sector Urban Planning; Belhaven Press: London UK; New York, NY, USA, 1991. [Google Scholar]
- Olsson, K.; Berglund, E. City marketing: The role of the citizens. In Place Reinvention: Northern Perspectives; Nyseth, T., Viken, A., Eds.; Ashgate: Surrey, UK, 2009; pp. 127–144. [Google Scholar]
- Paddison, R. City Marketing, Image Reconstruction and Urban Regeneration. Urban Stud. 1993, 30, 339–349. [Google Scholar] [CrossRef]
- Rainisto, S. Success Factors of Place Marketing: A Study of Place Marketing Practices in Northern Europe and the United States. Ph.D. Thesis, Helsinki University of Technology, Helsinki, Finland, 2003. [Google Scholar]
- Smyth, H. Marketing the City: The Role of Flagship Projects in Urban Regeneration; E & FN Spon: London, UK, 1994. [Google Scholar]
- Ward, S. Selling Places: The Marketing and Promotion of Towns and Cities 1850–2000; Routledge: London, UK; New York, NY, USA, 1998. [Google Scholar]
- Urry, J. Mobilities; Polity Press: Cambridge, UK, 2007. [Google Scholar]
- Avraham, E.; Ketter, E. Media Strategies for Marketing Places in Crisis; Routledge: London, UK, 2012. [Google Scholar]
- Kavaratzis, M. Cities and their brands: Lessons from corporate branding. Place Brand. Public Dipl. 2009, 5, 26–37. [Google Scholar] [CrossRef]
- Dinnie, K. Nation Branding: Concepts, Issues, Practice; Routledge, Taylor & Francis Group: London, UK; New York, NY, USA, 2014. [Google Scholar]
- Anttiroiko, A.V. The Political Economy of City Branding, 1st ed.; Routledge: London, UK; New York, NY, USA, 2014. [Google Scholar]
- Joo, Y.M.; Seo, B. Transformative city branding for policy change: The case of Seoul’s participatory branding. Environ. Plan. C Politics Space 2018, 36, 239–257. [Google Scholar] [CrossRef]
- Caldwell, N.; Freire, J.R. The differences between branding a country, a region and a city: Applying the Brand Box Model. J. Brand Manag. 2004, 12, 50–61. [Google Scholar] [CrossRef]
- Magala, S. Antropologia wizualna. In Badania Jakościowe. Podejście i Teorie; Jemielniak, D., Ed.; Wydawnictwo Naukowe PWN: Warszawa, Poland, 2012; Volume 1. [Google Scholar]
- Francesconi, S. Reading Tourism Texts: A Multimodal Analysis; Channel View Publications: Bristol, UK, 2014. [Google Scholar]
- Anholt, S. From nation branding to competitive identity-the role of brand management as a component of national policy. In Nation Branding-Concepts, Issues, Practice; Dinnie, K., Ed.; Butterworth-Heinemann: Oxford, UK, 2008. [Google Scholar]
- Avraham, E.; Ketter, E. Media Strategies for Marketing Places in Crisis: Improving the Image of Cities, Countries and Tourist Destinations, 1st ed.; Butterworth-Heinemann: Amsterdam, The Netherlands, 2008. [Google Scholar]
- Yates, M. Chapter 18-Project Phoenix: A Benchmark for Reputation Management in Travel and Tourism. In Tourism in Turbulent Times; Wilks, J., Pendergast, D., Leggat, P., Eds.; Advances in Tourism Research; Elsevier: Oxford, UK, 2006; pp. 263–276. [Google Scholar]
- Cleave, E.; Arku, G.; Sadler, R.; Gilliland, J. The role of place branding in local and regional economic development: Bridging the gap between policy and practicality. Reg. Stud. Reg. Sci. 2016, 3, 207–228. [Google Scholar] [CrossRef]
- Kotler, P.; Haider, D.; Rein, I. Marketing Places; Free Press: New York, NY, USA, 1993. [Google Scholar]
- Pike, S.; Page, S.J. Destination Marketing Organizations and destination marketing: A narrative analysis of the literature. Tour. Manag. 2014, 41, 202–227. [Google Scholar] [CrossRef] [Green Version]
- Beerli, A.; Martín, J.D. Factors influencing destination image. Ann. Tour. Res. 2004, 31, 657–681. [Google Scholar] [CrossRef]
- Ramseook-Munhurrun, P.; Seebaluck, V.N.; Naidoo, P. Examining the Structural Relationships of Destination Image, Perceived Value, Tourist Satisfaction and Loyalty: Case of Mauritius. Procedia Soc. Behav. Sci. 2015, 175, 252–259. [Google Scholar] [CrossRef] [Green Version]
- Cai, L.A. Cooperative branding for rural destinations. Ann. Tour. Res. 2002, 29, 720–742. [Google Scholar] [CrossRef]
- Echtner, C.M.; Ritchie, J.R.B. The meaning and measurement of destination image: [Reprint of original article published in v.2, no.2, 1991: 2-12.]. J. Tour. Stud. 2003, 14, 37. [Google Scholar]
- Pike, S. Destination image analysis—A review of 142 papers from 1973 to 2000. Tour. Manag. 2002, 23, 541–549. [Google Scholar] [CrossRef]
- Pike, S.D. Destination Marketing: An Integrated Marketing Communication Approach; Butterworth-Heinemann: Burlington, MA, USA, 2008. [Google Scholar]
- Gunn, C.A. Vacationscape: Designing Tourist Regions, 2nd ed.; Van Nostrand Reinhold: New York, NY, USA, 1988. [Google Scholar]
- Melewar, T.; Seidenfuss, K.U.; Dinnie, K.; Musa, G. Nation branding and integrated marketing communications: An ASEAN perspective. Int. Mark. Rev. 2010, 27, 388–403. [Google Scholar]
- Dai, T.; Zhuang, T.; Yan, J.; Zhang, T. From Landscape to Mindscape: Spatial Narration of Touristic Amsterdam. Sustainability 2018, 10, 2623. [Google Scholar] [CrossRef]
- Dinnie, K. Place branding: Overview of an emerging literature. Place Brand. 2004, 1, 106–110. [Google Scholar] [CrossRef]
- Kavaratzis, M.; Ashworth, G.J. City Branding: An Effective Assertion of Identity or a Transitory Marketing Trick? Tijdschr. Voor Econ. Soc. Geogr. 2005, 96, 506–514. [Google Scholar] [CrossRef]
- Vuignier, R. Place branding & place marketing 1976–2016: A multidisciplinary literature review. Int. Rev. Public Nonprofit Mark. 2017, 14, 447–473. [Google Scholar]
- Hankinson, G. The management of destination brands: Five guiding principles based on recent developments in corporate branding theory. J. Brand Manag. 2007, 14, 240–254. [Google Scholar] [CrossRef]
- Zenker, S.; Braun, E. Questioning a “one size fits all” city brand. J. Place Manag. Dev. 2017, 10, 270–287. [Google Scholar] [CrossRef]
- Florek, M. Application of the concept of destination brand equity: The example of two Polish cities. Int. J. Tour. Cities 2015, 1, 152–161. [Google Scholar] [CrossRef]
- Balakrishnan, M.S. Dubai—A star in the east. J. Place Manag. Dev. 2008, 1, 62–91. [Google Scholar]
- Kavaratzis, M. Place branding scholars and practitioners: “Strangers in the night”? J. Place Manag. Dev. 2015, 8, 266–270. [Google Scholar] [CrossRef]
- Hankinson, G. Destination brand images: A business tourism perspective. J. Serv. Mark. 2005, 19, 24–32. [Google Scholar] [CrossRef]
- Walmsley, D.; Young, M. Evaluative Images and Tourism: The Use of Personal Constructs to Describe the Structure of Destination Images. J. Travel Res. 1998, 36, 65–69. [Google Scholar] [CrossRef]
- Hankinson, G. The brand images of tourism destinations: A study of the saliency of organic images. J. Prod. Brand Manag. 2004, 13, 6–14. [Google Scholar] [CrossRef]
- Leisen, B. Image segmentation: The case of a tourism destination. J. Serv. Mark. 2001, 15, 49–66. [Google Scholar] [CrossRef]
- Eshuis, J.; Edwards, A. Branding the City: The Democratic Legitimacy of a New Mode of Governance. Urban Stud. 2013, 50, 1066–1082. [Google Scholar] [CrossRef]
- Banaś, D.; Michnik, J. Evaluation of the Impact of Strategic Offers on the Financial and Strategic Health of the Company—A Soft System Dynamics Approach. Mathematics 2019, 7, 208. [Google Scholar] [CrossRef]
- Foroudi, P.; Akarsu, T.N.; Ageeva, E.; Foroudi, M.M.; Dennis, C.; Melewar, T.C. Promising the Dream: Changing destination image of London through the effect of website place. J. Bus. Res. 2018, 83, 97–110. [Google Scholar] [CrossRef]
- Lyman, B. An experiential theory of emotion: A partial outline with implications for research. J. Ment. Imag. 1984, 8, 77–86. [Google Scholar]
- Poiesz, T.B.C. The image concept: Its place in consumer psychology. J. Econ. Psychol. 1989, 10, 457–472. [Google Scholar] [CrossRef]
- Zhang, H.; Fu, X.; Cai, L.A.; Lu, L. Destination image and tourist loyalty: A meta-analysis. Tour. Manag. 2014, 40, 213–223. [Google Scholar] [CrossRef]
- Grunig, J.E. Image and substance: From symbolic to behavioral relationships. Public Relat. Rev. 1993, 19, 121–139. [Google Scholar] [CrossRef]
- Bernstein, D. Company Image and Reality: A Critique of Corporate Communications, 1st ed.; Holt, Rinehart & Winston Ltd.: London, UK, 1985. [Google Scholar]
- Hatch, M.J.; Schultz, M. Relations between organizational culture, identity and image. Eur. J. Mark. 1997, 31, 356–365. [Google Scholar] [CrossRef]
- Grunig, J.E. Furnishing the Edifice: Ongoing Research on Public Relations As a Strategic Management Function. J. Public Relat. Res. 2006, 18, 151–176. [Google Scholar] [CrossRef]
- Vermeulen, M. The Netherlands, holiday country. In City Branding: Image Building & Building Images; Patteeuw, V., Affairs, U., Eds.; NAi Uitgevers: Rotterdam, The Netherlands, 2002. [Google Scholar]
- Christensen, L.T.; Askegaard, S. Corporate identity and corporate image revisited—A semiotic perspective. Eur. J. Mark. 2001, 35, 292–315. [Google Scholar] [CrossRef]
- Luhmann, N. Social Systems; Stanford University Press: Palo Alto, CA, USA, 1995. [Google Scholar]
- Dowling, G. Creating Corporate Reputations: Identity, Image, and Performance; Oxford University Press: Oxford, UK; New York, NY, USA, 2001. [Google Scholar]
- Hankinson, G. Place branding theory: A cross-domain literature review from a marketing perspective. In Towards Effective Place Brand Management. Branding European Cities and Regions; Ashworth, G.J., Kavaratzis, M., Eds.; Edward Elgar Publishing: Cheltenham, UK; Northampton, MA, USA, 2010. [Google Scholar]
- Boulding, K.E. The Image: Knowledge in Life and Society; University of Michigan Press: Ann Arbor, MI, USA, 1956. [Google Scholar]
- Chernatony, L.D.; Riley, F.D. Defining A “Brand”: Beyond The Literature With Experts’ Interpretations. J. Mark. Manag. 1998, 14, 417–443. [Google Scholar] [CrossRef]
- Holloway, L. People and Place: The Extraordinary Geographies of Everyday Life/Lewis Holloway and Phil Hubbard. Holloway: People and Geographyssp/Lewis Holloway and Phil Hubbard; Prentice Hall: Harlow, UK, 2001. [Google Scholar]
- Stepchenkova, S.; Mills, J.E. Destination Image: A Meta-Analysis of 2000–2007 Research. J. Hosp. Mark. Manag. 2010, 19, 575–609. [Google Scholar] [CrossRef]
- Hosany, S.; Ekinci, Y.; Uysal, M. Destination image and destination personality: An application of branding theories to tourism places. J. Bus. Res. 2006, 59, 638–642. [Google Scholar] [CrossRef]
- Moingeon, B.; Soenen, G. The five facets of collective identities. In Corporate and Organizational Identities: Integrating Strategy, Marketing, Communication and Organizational Perspective; Routledge: London, UK, 2003. [Google Scholar]
- Jokela, S. The development of Helsinki’s city brand. Hels. Q. 2018. Available online: https://www.kvartti.fi/en/articles/development-helsinkis-city-brand (accessed on 18 August 2019).
- Bateman, J. Text and Image: A Critical Introduction to the Visual/Verbal Divide; Routledge: London, UK, 2014. [Google Scholar]
- Kampschulte, A. “Image” as an instrument of urban management. Geogr. Helv. 1999, 54, 229–241. [Google Scholar] [CrossRef]
- Balmer, J.M.T. Corporate identity, corporate branding and corporate marketing-Seeing through the fog. Eur. J. Mark. 2001, 35, 248–291. [Google Scholar] [CrossRef]
- Glińska, E. Budowanie Marki Miasta. Koncepcje, Warunki, Modele; Wolters Kluwer: Alphen aan den Rijn, The Netherlands, 2016. [Google Scholar]
- Govers, R.; Go, F. Place Branding-Glocal, Virtual and Physical Identities, Constructed, Imagined and Experienced|R. Govers|Palgrave Macmillan; Palgrave Macmillan: Basingstoke, UK, 2009. [Google Scholar]
- Govers, R. Imaginative Communities: Admired Cities, Regions and Countries, 1st ed.; Reputo Press: Antwerp, Belgium, 2018. [Google Scholar]
- Allen, G. Place Branding: New Tools for Economic Development. Des. Manag. Rev. 2007, 18, 60–68. [Google Scholar] [CrossRef]
- Khan, M.J.; Chelliah, S.; Ahmed, S. Factors influencing destination image and visit intention among young women travellers: Role of travel motivation, perceived risks, and travel constraints. Asia Pac. J. Tour. Res. 2017, 22, 1139–1155. [Google Scholar] [CrossRef]
- Ashworth, G.J. The Communication of the Brand Images of Cities; Springer: Valencia, Spain, 2001. [Google Scholar]
- Kavaratzis, M.; Ashworth, G. Place marketing: How did we get here and where are we going? J. Place Manag. Dev. 2008, 1, 150–165. [Google Scholar] [CrossRef]
- Warfield, J.N. Societal Systems: Planning, Policy and Complexity, 1st ed.; John Wiley & Sons Inc.: New York, NY, USA, 1976. [Google Scholar]
- Gabus, A.; Fontela, E. Perceptions of the World Problematic: Communication Procedure, Communicating with Those Bearing Collective Responsibility; DEMATEL 1; Battelle Geneva Research Centre: Geneva, Switzerland, 1973. [Google Scholar]
- Fontela, E.; Gabus, A. The DEMATEL Observer; DEMATEL 1976; Battelle Geneva Research Centre: Geneva, Switzerland, 1976. [Google Scholar]
- Michnik, J. Weighted Influence Non-linear Gauge System (WINGS)—An analysis method for the systems of interrelated components. Eur. J. Oper. Res. 2013, 228, 536–544. [Google Scholar] [CrossRef]
- Forrester, J.W. Ind. Dyn; M.I.T. Press: Cambridge, MA, USA, 1961. [Google Scholar]
- Sterman, J. Business Dynamics: Systems Thinking and Modeling for a Complex World; Irwin/McGraw-Hill: New York, NY, USA, 2000. [Google Scholar]
- Mendoza, G.A.; Prabhu, R. Participatory modeling and analysis for sustainable forest management: Overview of soft system dynamics models and applications. For. Policy Econ. 2006, 9, 179–196. [Google Scholar] [CrossRef]
- Eden, C. Analyzing cognitive maps to help structure issues or problems. Eur. J. Oper. Res. 2004, 159, 673–686. [Google Scholar] [CrossRef]
- Montibeller, G.; Belton, V. Causal maps and the evaluation of decision options—A review. J. Oper. Res. Soc. 2006, 57, 779–791. [Google Scholar] [CrossRef]
- Kosko, B. Fuzzy cognitive maps. Int. J. Man-Mach. Stud. 1986, 24, 65–75. [Google Scholar] [CrossRef]
- Glykas, M. (Ed.) Fuzzy Cognitive Maps: Advances in Theory, Methodologies, Tools and Applications; Springer Science & Business Media: London, UK, 2010. [Google Scholar]
- Papageorgiou, E.I.; Salmeron, J.L. A Review of Fuzzy Cognitive Maps Research During the Last Decade. IEEE Trans. Fuzzy Syst. 2013, 21, 66–79. [Google Scholar] [CrossRef]
- Penn, A.S.; Knight, C.J.K.; Lloyd, D.J.B.; Avitabile, D.; Kok, K.; Schiller, F.; Woodward, A.; Druckman, A.; Basson, L. Participatory Development and Analysis of a Fuzzy Cognitive Map of the Establishment of a Bio-Based Economy in the Humber Region. PLoS ONE 2013, 8, e78319. [Google Scholar] [CrossRef]
- Jetter, A. Fuzzy Cognitive Maps for Engineering and Technology Management: What Works in Practice? In Proceedings of the 2006 Technology Management for the Global Future-PICMET 2006 Conference, Istanbul, Turkey, 8–13 July 2006; pp. 498–512. [Google Scholar]
- Jetter, A.; Schweinfort, W. Building scenarios with Fuzzy Cognitive Maps: An exploratory study of solar energy. Futures 2011, 43, 52–66. [Google Scholar] [CrossRef]
- Mourhir, A.; Papageorgiou, E.I.; Kokkinos, K.; Rachidi, T. Exploring Precision Farming Scenarios Using Fuzzy Cognitive Maps. Sustainability 2017, 9, 1241. [Google Scholar] [CrossRef]
- Jetter, A.J.; Kok, K. Fuzzy Cognitive Maps for futures studies—A methodological assessment of concepts and methods. Futures 2014, 61, 45–57. [Google Scholar] [CrossRef]
- Kashi, K.; Franek, J. Application of Multiple Attribute Decision Making Methods in Human Resources. In Proceedings of the 7th International Scientific Conference Managing and Modeling of Financial Risks, Ostrava, Czech Republic, 8–9 September 2014. [Google Scholar]
- Michnik, J.; Frączkiewicz-Wronka, A. Wspomaganie decyzji w zarządzaniu podmiotem leczniczym. Stud. Ekon. Zesz. Nauk. UE Katow. 2014, 199, 205–217. [Google Scholar]
- Pechová, H.; Staňková, Š. Application of WINGS method in CRM performance measurement. In Proceedings of the IDIMT 2015: Information Technology and Society-Interaction and Interdependence-23rd Interdisciplinary Information Management Talks, Vienna, Austria, 13–14 December 2015; pp. 391–398. [Google Scholar]
- Rego Mello, B.B.; Gomes, L.F.A.M. Industry Risk Assessment in Brazil with the WINGS Method. In Proceedings of the 23rd International Conference on Multiple Criteria Decision Making MCDM 2015—Bridging Disciplines, Hamburg, Germany, 2–7 August 2015. [Google Scholar]
- Michnik, J.; Adamus-Matuszyńska, A. Structural analysis of problems in public relations. Mult. Criteria Decis. Mak. UE Katow. 2015, 10, 105–123. [Google Scholar]
- Radziszewska-Zielina, E.; Śladowski, G. Assessment of the Conditions that Determine the Reclaiming of Stone Materials and Their Use in the Revalorisation of Historical Buildings; EDP Sciences: Les Ulis, France, 2017. [Google Scholar]
- Radziszewska-Zielina, E.; Śladowski, G. Supporting the selection of a variant of the adaptation of a historical building with the use of fuzzy modeling and structural analysis. J. Cult. Herit. 2017, 26, 53–63. [Google Scholar] [CrossRef]
- Michnik, J. The WINGS method with multiple networks and its application to innovation projects selection. Int. J. Appl. Manag. Sci. 2018, 10, 105–126. [Google Scholar] [CrossRef]
- Sallum, F.S.V.; Gomes, L.F.A.M.; Machado, M.A.S. A dematel-topsis-wings approach to the classification of multi-market investment funds. Indep. J. Manag. Prod. 2018, 9, 1203–1234. [Google Scholar] [CrossRef]
- Sallum, F.S.V.; Gomes, L.F.A.M.; Machado, M.A.S. A multicriteria approach to the prioritisation of stock investment funds. Int. J. Bus. Syst. Res. 2018, 13, 120–134. [Google Scholar] [CrossRef]
- Czarniawska, B. The European Capital of the 2000s: On Image Construction and Modeling. Corp. Reput. Rev. 2000, 3, 202–217. [Google Scholar] [CrossRef]
Figure 1.
City’s Image Building Process. Source: the authors’ own elaboration.

Figure 2.
The Weighted Influence Non-linear Gauge System (WINGS) network model of image building for Katowice city. Source: the authors’ own elaboration.
Figure 2.
The Weighted Influence Non-linear Gauge System (WINGS) network model of image building for Katowice city. Source: the authors’ own elaboration.

Figure 3.
Absolute involvement vs. absolute role (six concepts with the highest absolute involvement). Source: the authors’ own elaboration.
Figure 3.
Absolute involvement vs. absolute role (six concepts with the highest absolute involvement). Source: the authors’ own elaboration.

Figure 4.
Relative involvement vs. relative role (six concepts with highest relative involvement). Source: the authors’ own elaboration.
Figure 4.
Relative involvement vs. relative role (six concepts with highest relative involvement). Source: the authors’ own elaboration.


Table 1.
Initial states of system components.
| No. | Factor | Initial State |
|---|---|---|
| 1 | Image | 0.1 |
| 2 | Identity | 6.0 |
| 3 | City movements | 0.1 |
| 4 | City culture | 7.7 |
| 5 | Silesian region culture | 1.9 |
| 6 | Polish culture | 3.0 |
| 7 | Socio-economic environment | 5.2 |
| 8 | Promotion strategy | 0.1 |
| 9 | City management | 2.2 |
| 10 | Underclass | 5.5 |
| 11 | Pseudo-fans | 5.1 |
| 12 | Polluted city | 6.7 |
| 13 | City of investors | 6.9 |
| 14 | City of characteristic culture | 7.8 |
| 15 | City of great events and entertainment | 7.7 |
| 16 | Recommendable city | 7.1 |
| 17 | City of sport events | 6.8 |
| 18 | Citizens | 4.3 |
Source: the authors’ own elaboration.
Table 2.
Forecasted and actual states of selected concepts.
| Factors Determining the City’s Image | 2014 | 2015 | ||
|---|---|---|---|---|
| Concept | Forecast | Actual | Forecast | Actual |
| City movements | 0.11 | 0.40 | 0.41 | 0.70 |
| Underclass | 5.57 | 4.60 | 4.64 | 4.10 |
| Polluted city | 6.80 | 6.70 | 6.80 | 7.30 |
| City of investors | 7.18 | 6.40 | 6.66 | 6.40 |
| City of characteristic culture | 7.93 | 7.90 | 8.03 | 7.80 |
| City of great events and entertainment | 7.83 | 7.30 | 7.41 | 7.70 |
| Recommendable city | 7.21 | 7.30 | 7.42 | 7.70 |
| City of sport events | 6.90 | 7.10 | 7.21 | 6.70 |
Source: the authors’ own elaboration.
Table 3.
Model output for 2011 data: absolute indicators.
| No. | Concept | Impact | Receptivity | Involvement | Role |
|---|---|---|---|---|---|
| 1 | Image | 2.60 | 10.00 | 12.60 | |
| 2 | Identity | 5.21 | 9.12 | 14.33 | |
| 3 | City movements | 1.94 | 1.12 | 3.07 | 0.82 |
| 4 | City culture | 7.04 | 3.15 | 10.19 | 3.89 |
| 5 | Silesian region culture | 3.95 | 1.67 | 5.62 | 2.28 |
| 6 | Polish culture | 4.68 | 0.40 | 5.08 | 4.28 |
| 7 | Socio-economic environment | 8.55 | 2.16 | 10.72 | 6.39 |
| 8 | Promotion strategy | 5.79 | 2.13 | 7.92 | 3.67 |
| 9 | City management | 4.28 | 1.51 | 5.79 | 2.77 |
| 10 | Underclass | 3.78 | 1.71 | 5.49 | 2.07 |
| 11 | Pseudo-fans | 4.80 | 1.67 | 6.46 | 3.13 |
| 12 | Polluted city | 2.83 | 2.94 | 5.77 | |
| 13 | City of investors | 3.47 | 3.67 | 7.15 | |
| 14 | City of characteristic culture | 4.58 | 3.01 | 7.59 | 1.57 |
| 15 | City of great events and entertainment | 4.29 | 4.26 | 8.55 | 0.03 |
| 16 | Recommendable city | 2.53 | 5.79 | 8.32 | |
| 17 | City of sport events | 4.97 | 2.86 | 7.83 | 2.12 |
| 18 | Citizens | 10.00 | 7.80 | 17.80 | 2.20 |
Source: the authors’ own elaboration.
Table 4.
Model output for 2011 data, relative indicators.
| No. | Concept | Impact | Receptivity | Involvement | Role |
|---|---|---|---|---|---|
| 1 | Image | 2.60 | 4.16 | 6.75 | −1.56 |
| 2 | Identity | 5.21 | 10.00 | 15.21 | |
| 3 | City movements | 1.94 | 1.25 | 3.19 | 0.69 |
| 4 | City culture | 7.04 | 3.50 | 10.55 | 3.54 |
| 5 | Silesian region culture | 3.95 | 1.84 | 5.79 | 2.11 |
| 6 | Polish culture | 4.68 | 0.45 | 5.13 | 4.24 |
| 7 | Socio-economic environment | 8.54 | 2.39 | 10.93 | 6.16 |
| 8 | Promotion strategy | 5.79 | 2.33 | 8.12 | 3.46 |
| 9 | City management | 4.28 | 1.67 | 5.95 | 2.61 |
| 10 | Underclass | 1.91 | 3.75 | ||
| 11 | Pseudo-fans | 1.86 | |||
| 12 | Polluted city | 3.24 | 3.70 | ||
| 13 | City of investors | 3.47 | 4.03 | 7.51 | -0.56 |
| 14 | City of characteristic culture | 4.58 | 3.36 | 7.95 | 1.22 |
| 15 | City of great events and entertainment | 4.29 | 4.76 | 9.05 | |
| 16 | Recommendable city | 2.53 | 2.80 | 5.33 | |
| 17 | City of sport events | 4.95 | 3.19 | 8.14 | 1.75 |
| 18 | Citizens | 10.00 | 5.67 | 15.67 | 4.33 |
Source: the authors’ own elaboration.
© 2019 by the authors. Licensee MDPI, Basel, Switzerland. This article is an open access article distributed under the terms and conditions of the Creative Commons Attribution (CC BY) license (http://creativecommons.org/licenses/by/4.0/).
Share and Cite
MDPI and ACS Style
Adamus-Matuszyńska, A.; Michnik, J.; Polok, G. A Systemic Approach to City Image Building. The Case of Katowice City. Sustainability 2019, 11, 4470. https://doi.org/10.3390/su11164470
AMA Style
Adamus-Matuszyńska A, Michnik J, Polok G. A Systemic Approach to City Image Building. The Case of Katowice City. Sustainability. 2019; 11(16):4470. https://doi.org/10.3390/su11164470
Chicago/Turabian StyleAdamus-Matuszyńska, Anna, Jerzy Michnik, and Grzegorz Polok. 2019. "A Systemic Approach to City Image Building. The Case of Katowice City" Sustainability 11, no. 16: 4470. https://doi.org/10.3390/su11164470
Note that from the first issue of 2016, this journal uses article numbers instead of page numbers. See further details here.