Article

Flexural-Fatigue Properties of Sustainable Pervious Concrete Pavement Material Containing Ground Tire Rubber and Silica Fume

1
College of Transportation, Jilin University, Changchun 130025, China
2
College of Logistics and Transportation, East China Jiaotong University, Nanchang 330013, China
*
Author to whom correspondence should be addressed.
Sustainability 2019, 11(16), 4467; https://doi.org/10.3390/su11164467
Submission received: 23 July 2019 / Revised: 11 August 2019 / Accepted: 15 August 2019 / Published: 18 August 2019
(This article belongs to the Special Issue Sustainable Pavement Materials, Design and Construction)

Abstract

:
With the development of urbanization, pervious concrete has been increasingly used in urban road pavement structures. The objective of this paper was to investigate the effect of stress levels and modifier (ground tire rubber and silica fume) on the fatigue life of pervious concrete and establish the fatigue equations with different survival probabilities. In order to improve the deformability of pervious concrete without sacrificing its strength, ground tire rubber and silica fume were added into pervious concrete. Two kinds of pervious concrete, control pervious concrete and ground tire rubber and silica fume modified pervious concrete, were made in the laboratory. The pervious concrete beam specimens of 100 × 100 × 400 mm were casted, and the static flexural strength and flexural strain of the two kinds of pervious concrete were tested. The fatigue lives of two pervious concretes were tested using MTS fatigue testing machine under four different stress levels (0.85, 0.80, 0.75, and 0.70). The fatigue life was analyzed by two-parameter Weibull distribution. The parameters of Weibull distribution were determined by graphical method, maximum likelihood method and moment method. The Kolmogorov–Smirnov test was used to test the Weibull distribution and the fatigue equations under different survival probabilities were established. The results showed that ground tire rubber and silica fume modified pervious concrete had better deformability while ensuring strength compared to control pervious concrete. The addition of ground tire rubber and silica fume improved the fatigue life of pervious concrete. The two-parameter Weibull distribution was suitable to characterize the fatigue characteristics and predict the fatigue life of pervious concrete. Fatigue equations with different survival probabilities were a good guide for pervious concrete design.

1. Introduction

Most of the earth’s surface in modern cities is covered by impervious pavement structure, which has led to many urban problems, such as floods, groundwater decline, and urban heat island effects [1,2,3]. The recent torrential rains, rising temperatures, and depletion of water resources around the world are good examples [4,5,6,7]. All these problems have triggered people’s thinking about modern urban diseases. The pervious concrete pavement structure has been widely studied and applied as a feasible solution [8]. Due to the porous structure of pervious concrete, it can realize the function of water permeability and ventilation [9,10]. It has a very positive effect on solving urban water logging, replenishing groundwater, mitigating surface temperature and realizing urban ecosystem circulation [11,12,13,14]. Compared with traditional concrete, pervious concrete generally contains no or little sand, and the gradation of coarse aggregate is generally single. Its strength is generally not very high, and can only be used for pavement structures with low-medium traffic loads or non-traffic loads, such as parking lots, sidewalks, parks, etc. [8,15,16,17].
At present, research on pervious concrete mainly focuses on mix design, strength characterization, permeability property, and internal pore structure [18,19,20,21,22]. There are relatively few studies on the fatigue performance of pervious concrete. This is mainly because the fatigue test itself is time-consuming and costly, and there are many other factors affecting the fatigue test, factors from the material itself (gradation, porosity, raw material properties, etc.), factors from the fatigue test conditions (fatigue test mode, stress level, load frequency, load type, etc.) [8,17]. As an aspect of the durability of pavement materials, fatigue is a major factor causing structural damage and has an important impact on the structure life [23]. A lot of research has been carried out on the fatigue problem of traditional concrete. The research on the fatigue performance of pervious concrete was limited, and it needs comprehensive and in-depth research.
Chandrappa and Biligiri [24] studied the effect of stress level and loading frequency on the flexural-fatigue characteristic of pervious concrete and established the laboratory fatigue model. The results indicated that the stress level and stiffness were significant in affecting the fatigue life, and the loading frequency has little impact on fatigue life. The three-parameter Weibull distribution was suitable for the fatigue life fitting of pervious concrete. Zhou et al. [25] studied the flexural fatigue behavior of polymer-modified single-sized aggregate pervious concrete under different stress levels (0.65, 0.70, 0.75, 0.80, and 0.85) and stress ratios (0.08, 0.2, and 0.5) with two-parameter Weibull distribution. The results indicated that the fatigue life decreased with the increase of stress level and stress ratio. When the stress level and stress ratio were the same, the fatigue life increased with the decreasing aggregate sizes. Chandrappa and Biligiri [26] also studied the effect of the pore size and porosity on the fatigue of pervious concrete and established the stiffness reduction model for pervious concrete. It concluded that the porosity at the fractural face was more influential than the volumetric porosity on the fatigue and stiffness reduction. The large pore size has more significant effect on the fatigue life than the small pore size. Pindado et al. [27] conducted compressive-fatigue experiments on polymer-modified porous concrete with cylinder specimens. The addition of polymer significantly improved the fatigue behavior at the high stress level, but the improvement decreased when the stress level was relatively low. Chen et al. [28] studied the flexural-fatigue of continuous gradation pervious concrete with different stress ratios. The fatigue equations under different stress levels and equivalent stress levels were established. Based on the established fatigue equations, the load fatigue stress coefficient and tensile strength structural coefficient were obtained.
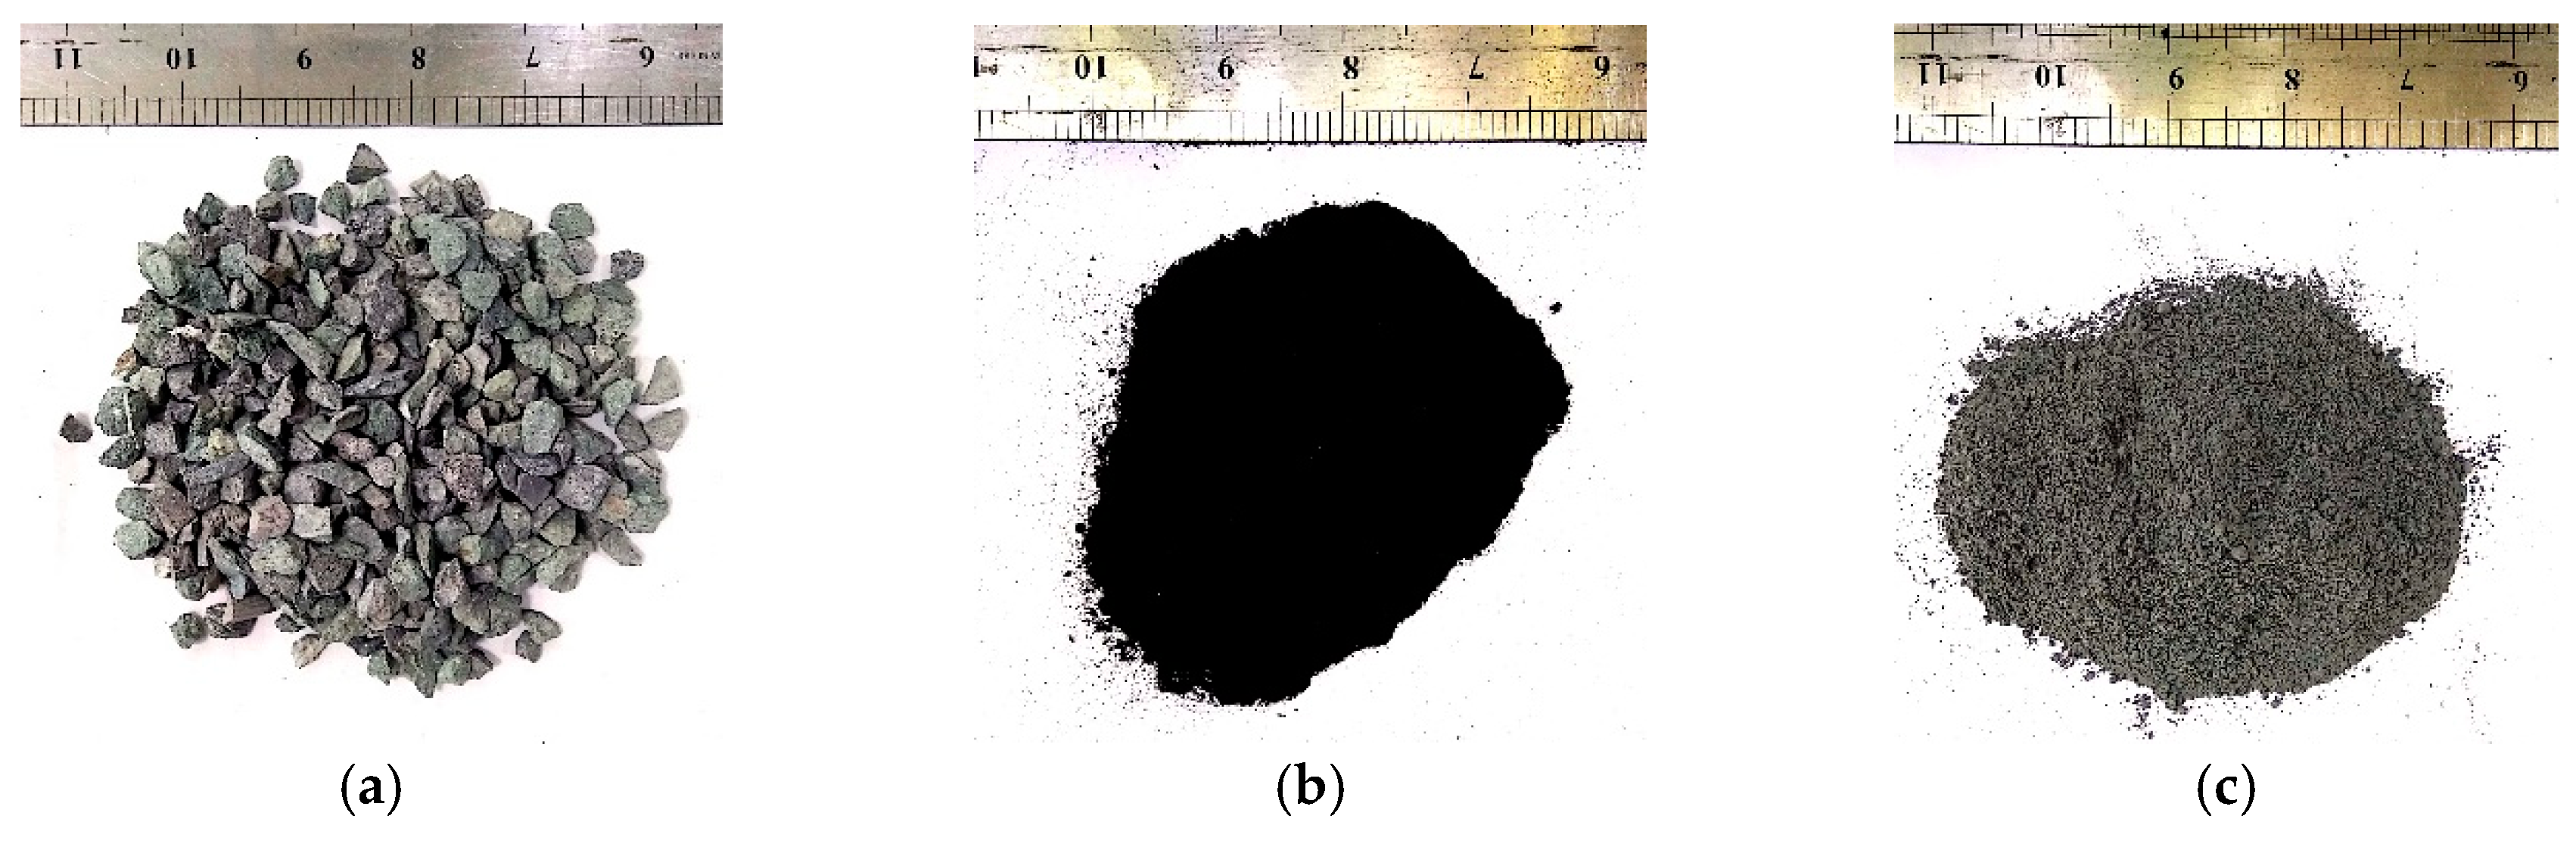
Fatigue is a complex problem for concrete materials. Compared to conventional concrete, the porous structure of pervious concrete makes its fatigue behavior different from that of conventional concrete. In order to improve fatigue properties, some modifiers, such as polymers and fiber, have been added. In our previous research, it was found that the ground tire rubber, as an elastic material, significantly improved the flexural strain and deformability of pervious concrete. However, it reduced the strength of pervious concrete, especially at the high dosage [29]. Silica fume, as an excellent supplementary cementitious material, was a by-product of iron alloys in the smelting of ferrosilicon and industrial silicon and usually used to improve the mechanical properties of pervious concrete [
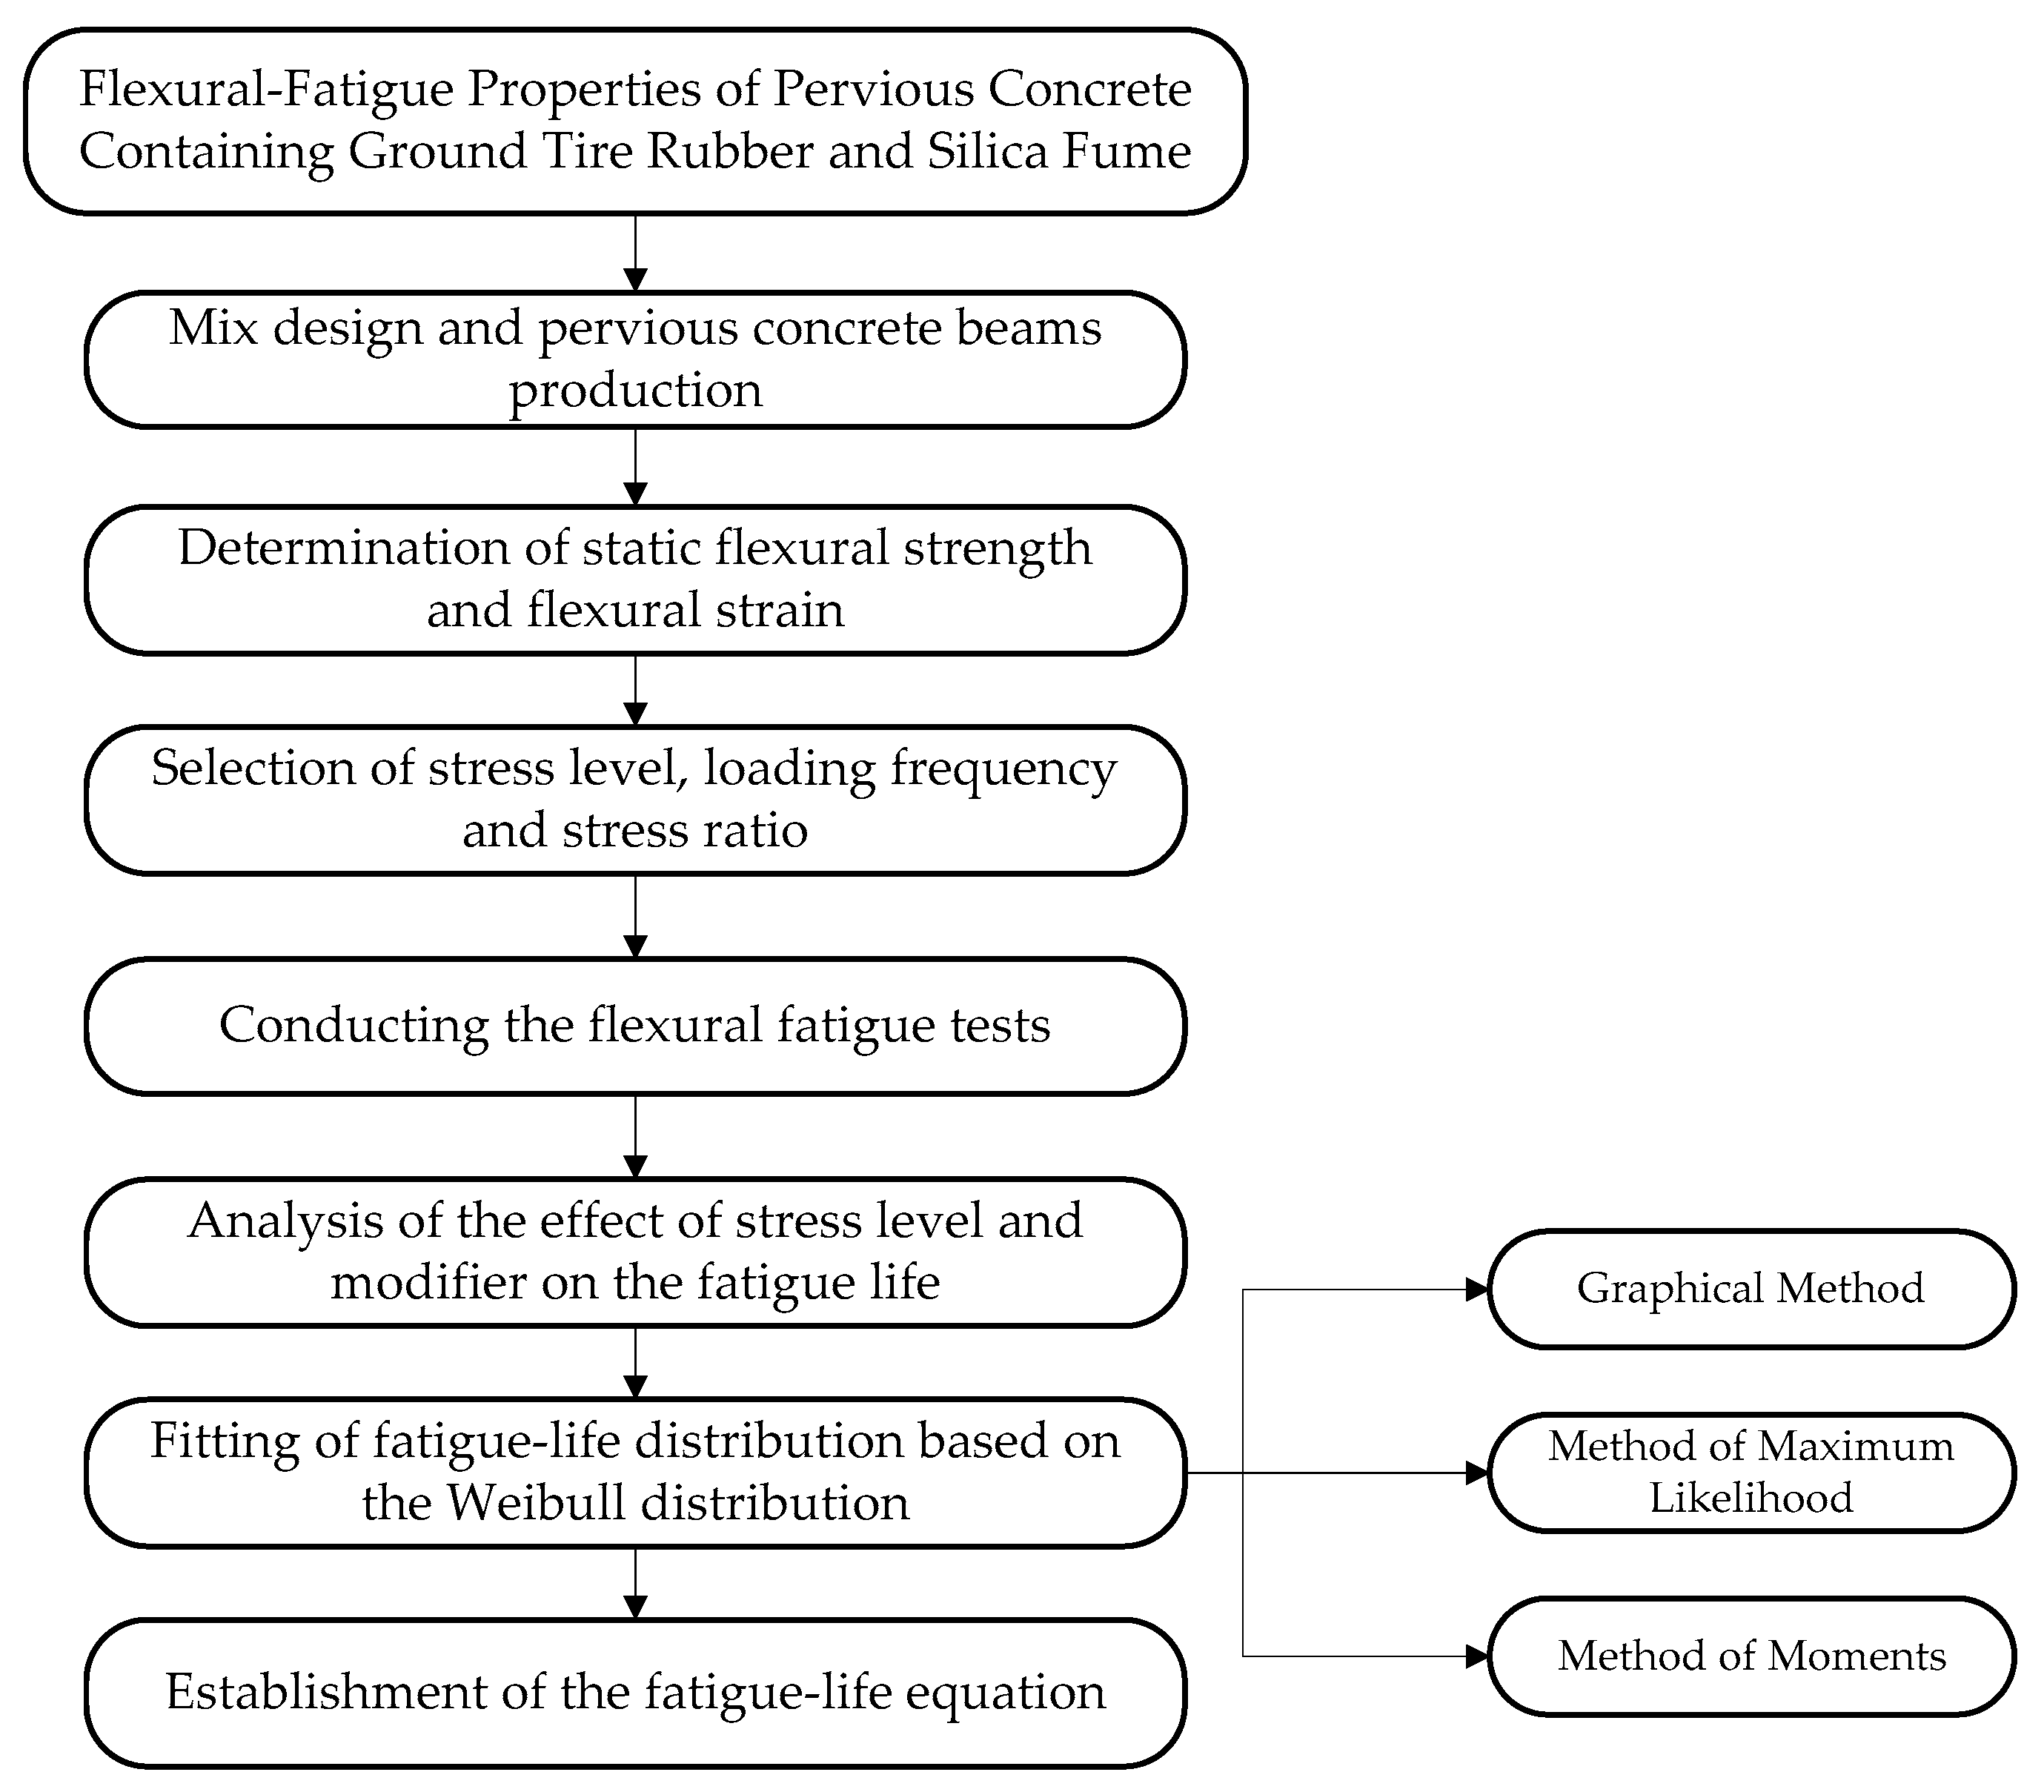
30]. The addition of ground tire rubber and silica fume into pervious concrete can not only achieve waste utilization and reduce cement consumption, but also reduce environmental pollution and obtain economical ways to utilize them. If the ground tire rubber and silica fume are incorporated into pervious concrete at the same time, will the fatigue performance of the pervious concrete be improved with sacrificing the strength? So, in this paper, in order to verify the effect of ground tire rubber and silica fume on the performance of pervious concrete, especially on the flexural fatigue of pervious concrete under different stress levels, the ground tire rubber and silica fume were added into pervious concrete. The static flexural strength tests and flexural-fatigue tests were conducted. The Weibull distribution was adopted to analyze the fatigue data and the fatigue equations were established for pervious concrete. The research outline (shown in Figure 1) of the study are as follows:
  • Mix design and pervious concrete beams production for two mixes with same aggregate size, porosity, and water-to-binder ratio
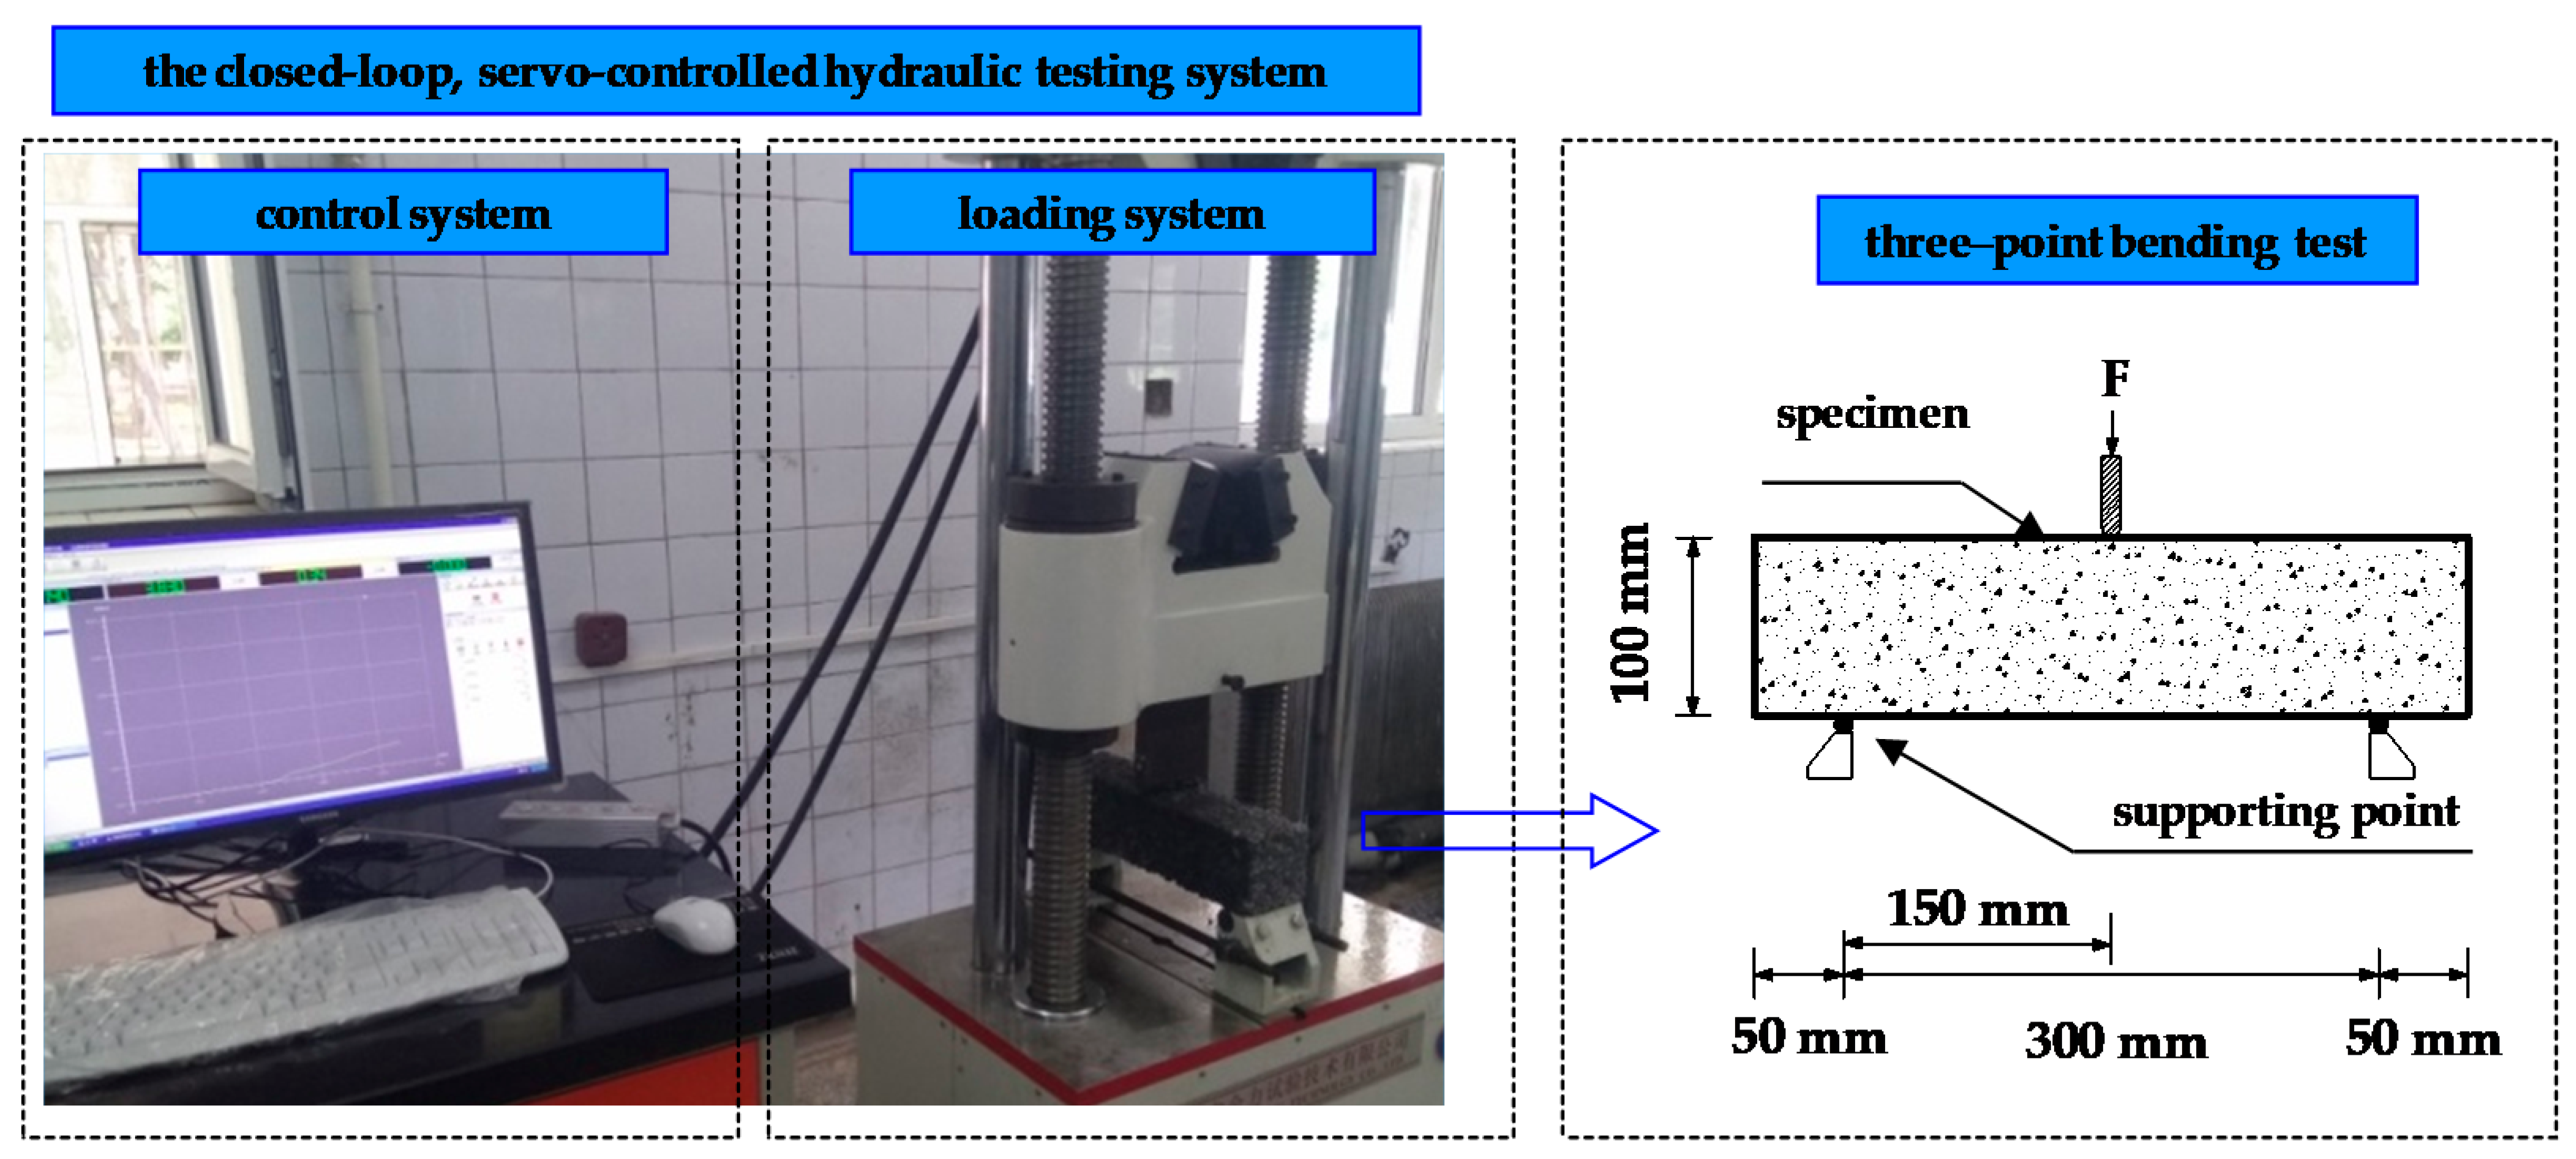
  • Conducting the static flexural tests and determination of the static flexural strength and flexural strain of two kinds of pervious concrete beams
  • Selection of the stress level, loading frequency and stress ratio for flexural-fatigue tests
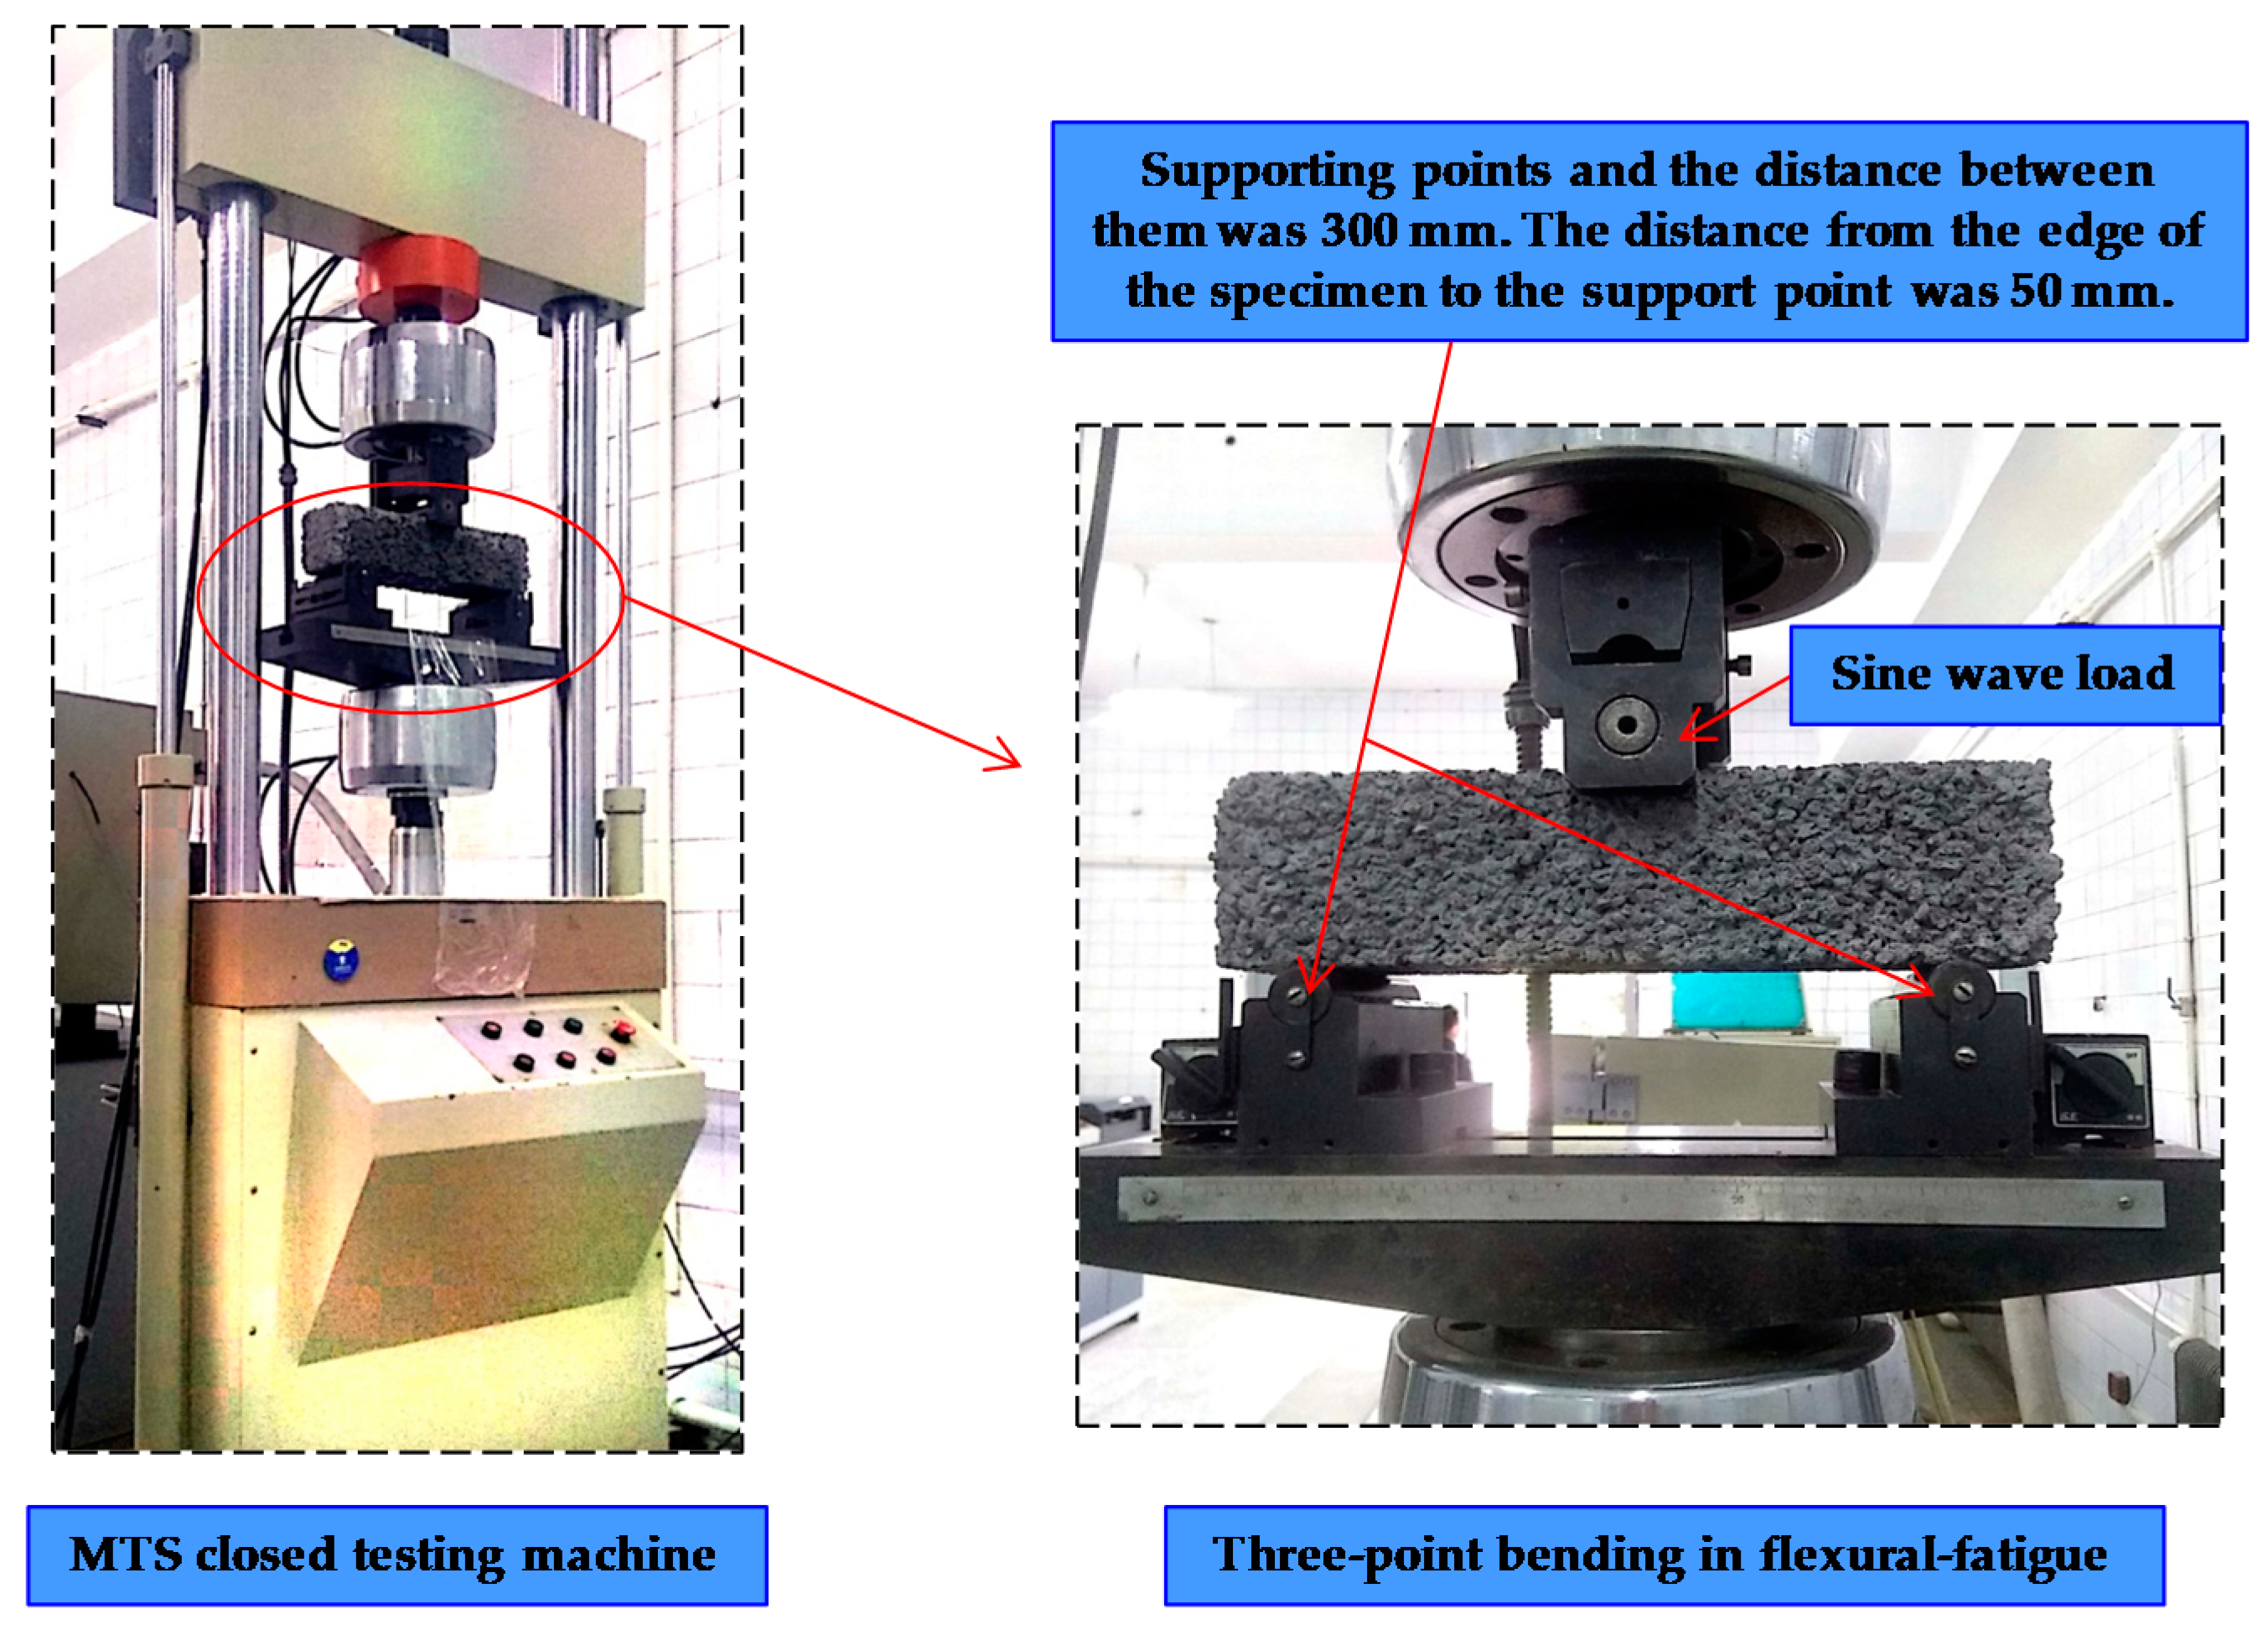
  • Conducting the flexural-fatigue tests of two kinds of pervious concrete under different stress levels
  • Analysis of the effect of stress level and modifier on the fatigue property of pervious concrete
  • Fitting of fatigue-life distribution based on the Weibull distribution and conducting good-of-fit test
  • Establishment of the fatigue-life equation

2. Materials and Methods

2.1. Materials and Mix Design

Cement and coarse aggregate were used in the tests and their main properties have been introduced in our previous researches [31]. In order to improve the workability of pervious concrete, the polycarboxylic acid superplasticizer produced by Shanxi Qinfen Building Material Co., Ltd. (Shanxi, China), was used. Ground tire rubber with particle size of 40 mesh and silica fume with average particle size of 0.1–0.3 μm, were added as modifier, shown in Figure 2. Silica fume was obtained from Changchun Siao Technology Co., Ltd. (Jilin, China), its density is 2178 kg/m3 and the SiO2 content is 93.3%. The mechanical properties and freeze–thaw durability of ground tire rubber modified pervious concrete and silica fume modified pervious concrete at different modifier levels have been researched by our group [29,30]. Based on the results, comprehensive consideration of strength, freeze–thaw resistance and deformation performance, in this test, silica fume was added at 12% to partially replace the cement with equivalent volume method, ground tire rubber was incorporated at 6% by the weight of cementitious materials. According to the Chinese national standard CJJ/T 135–2009 [32], control pervious concrete (CPC) and ground tire rubber and silica fume modified pervious concrete (GTRSFPC) with the same target strength were designed with coarse aggregate size of 4.75–9.5 mm, porosity of 15%, and water-to-binder ratio of 0.30. The mix proportions are shown in Table 1.

2.2. Specimen Preparation and Experiment Program

The pervious concrete was mixed with cement encapsulating aggregate method and the specimens were moulded with layered rodding method. The specific procedures are as follows: (1) coarse aggregate was put into concrete mixer; (2) half the water was added and stirred for 30 s; (3) ground tire rubber was put into the mixer and stirred for 40 s; (4) cementitious material (cement and silica fume) was added and mixed for 40 s; (5) the superplasticizer and the rest of the water were added and stirred for 50 s; (6) specimens were casted with layered rodding method, the specimen casting was divided into three layers and each layer was one-third of the height of the mould, each layer was inserted about 20 times from the periphery to the center. There were 25 pervious concrete beams with dimension of 100 × 100 × 400 mm in each group; among them, 5 were used to determine the static flexural strength, 20 were used to conduct flexural-fatigue experiments. In order to reduce the deviation caused by uneven strength in flexural-fatigue tests, the standard curing room controlled by a temperature and humidity regulating system was adopted to place specimens. All specimens were cured for 150 days with relative humidity 95% and temperature 20 ± 2 °C in the curing room. The experiment program was as follows: (a) prepare and group the specimens; (b) measure the static flexural strength; (c) determinate the maximum and minimum load at each stress level based on the static flexural strength; (d) conduct the flexural-fatigue tests and record fatigue life.

2.3. Determination of Flexural Strength and Flexural Stain

The flexural strength test was conducted with a closed-loop, servo-controlled hydraulic testing system, which is shown in Figure 3. The three-point bending test was adopted to determine the flexural strength. The static flexural strength and flexural strain were determined using Equations (1) and (2).
f = 3 2 × F L b h 2
ε = 6 h Δ L 2
where f = flexural strength (MPa); F = failure load (N); L = span length (mm); b = width of the specimen (mm); h = height of the specimen (mm); ε = failure strain; ∆ = mid-span displacement corresponding to failure load (mm).

2.4. Flexural-Fatigue Tests

The flexural-fatigue tests were conducted on an MTS closed testing machine, which is shown in Figure 4. The support of three-point bending in flexural-fatigue was the same as for static flexural strength test. The stress levels S (ratio of maximum stress to failure stress) for fatigue experiments were 0.70, 0.75, 0.80, and 0.85. The stress ratio (ratio of minimum stress to maximum stress) was 0.15. Sine wave load was applied and the frequency was 10 Hz. Stress control was selected as the load mode. Since the fatigue test was expensive and time-consuming, the following two were selected as the termination conditions, whichever occurred earlier: (a) complete failure of specimen; (b) the number of cycles reached 1 million. The failure mode of a beam after static flexural test and flexural fatigue test are shown in Figure 5.

3. Results and Analysis

3.1. Experimental Results

3.1.1. Static Flexural Strength

The static flexural strength for CPC and GTRSFPC is shown in Table 2. The flexural strength of GTRSFPC is a little higher than CPC, but it is higher than ground tire rubber modified pervious concrete and lower than silica fume modified pervious concrete, which had been studied in our previous researches [29,30].

3.1.2. Flexural Strain

In order to obtain better deformability and higher strength for pervious concrete, ground tire rubber and silica fume were added to enhance the deformability and strength of pervious concrete. The flexural strain of CPC and GTRSFPC are shown in Table 3. Table 3 indicates that the GTRSFPC has higher flexural strain than that of CPC. The qualitative analysis was conducted on a secant modulus of two mixes based on the load-displacement curves. The results reveal that GTRSFPC has a smaller secant modulus than CPC, which means that the stiffness of GTRSFPC is lower. That is why the flexural strain of GTRSFPC is higher. The flexural strain results indicate that the deformability of GTRSFPC is better than CPC.

3.1.3. Flexural-Fatigue Life

Table 4 summarizes the flexural-fatigue life (number of cycles to failure, N) data of CPC and GTRSFPC at different fatigue stress levels. The data are arranged in ascending order. The fatigue lives of CPC and GTRSFPC are decreased with the increasing stress level. The average fatigue life ratios of GTRSPC to CPC under different stress levels are shown in Figure 6. The values of all ratios are greater than 1. It indicates that, when the stress level is the same, the fatigue life of GTRSFPC is higher than that of CPC, which reveals that the addition of ground tire rubber and silica fume improves the fatigue property of pervious concrete.

3.2. Fitting of Fatigue-Life Distribution

The fatigue tests indicate that the fatigue-life data are very different from each other, even at the same stress level, which is caused by the uncertainty of the fatigue behavior of the concrete. Probabilistic reliability theory is an effective method to deal with uncertainty problems. First, a suitable mathematical model is needed to use probabilistic reliability theory for fatigue analysis. ASTM [33] proposes three fatigue analysis models, normal distribution model, lognormal distribution model, and Weibull distribution model. The Weibull distribution model is considered to be the most suitable model for describing the fatigue life distribution.
The probability density function f ( N ) and the cumulative distribution function F ( N ) of the three-parameter Weibull distribution are shown in Equations (3) and (4), respectively,
f ( N ) = α u N 0 ( N N 0 u N 0 ) α 1 exp [ ( N N 0 u N 0 ) α ]
F ( N ) = 1 exp [ ( N N 0 u N 0 ) α ]
where α = shape parameter, its value determines the shape of the density function curve; u = scale parameter, it is related to the flatness of the density function curve; N0 = location parameter or minimum life, it determines the starting position of the curve on the horizontal axis of the coordinate. Generally, in fatigue analysis for concrete, the location parameter or minimum life N0 is considered to be 0, thus the Weibull distribution can be written as Equations (5) and (6):
f ( N ) = α u ( N u ) α 1 exp [ ( N u ) α ]
F ( N ) = 1 exp [ ( N u ) α ]
The next work is to determine the Weibull distribution parameters α and u based on fatigue life data. The graphical method, method of maximum likelihood, and method of moments are adopted in the study to calculate the Weibull distribution parameters.

3.2.1. Graphical Method

The survivorship function L ( N ) can be defined as Equation (7):
L ( N ) = 1 F ( N )
Take Equation (6) into Equation (7), then the survivorship function L ( N ) can be written as Equation (8):
L ( N ) = exp [ ( N u ) a ]
Take twice logarithms of both sides of Equation (8), then it can obtain Equation (9):
ln [ ln ( 1 L ( N ) ) ] = α ln ( N ) α ln ( u )
At a certain stress level, the survivorship function L ( N ) for each fatigue data can be calculated by Equation (10):
L ( N ) = 1 i k + 1
where i = the order of the fatigue data; k = total numbers of the fatigue data. Then the regression analysis is applied for each fatigue stress level and the values of α and u can be obtained. Table 5 shows α and u values at different stress levels.

3.2.2. Method of Maximum Likelihood

Introduce parameter t into Equation (5) and make t = u α , the Equation (5) can be written as Equation (11):
f ( N ) = α t N α 1 exp [ N α t ]
The likelihood function can be written as Equation (12):
L ( α , t | N 1 , N 2 , , N k ) = i = 1 k f ( N i | α , t )
Take Equation (11) into Equation (12), it can obtain Equation (13):
L ( α , t | N 1 , N 2 , , N k ) = ( α t ) k i = 1 k N i α 1 exp [ 1 t i = 1 k N i α ]
Take logarithms of both sides of Equation (13), Equation (14) can be obtained:
ln [ L ( α , t | N 1 , N 2 , , N k ) ] = k ( ln α ln t ) + ( α 1 ) i = 1 k ln N i 1 t i = 1 k N i α
Take the partial derivative for the Equation (14) with respect to α and t, it can obtain Equations (15) and (16):
ln L t = k t + 1 t 2 i = 1 k N i α
ln L α = k α + i = 1 k ln N i 1 t i = 1 k N i α ln N i
Set the Equations (15) and (16) equal to zero and then Equations (17) and (18) can be obtained as follows:
t = 1 k i = 1 k N i α
i = 1 k N i α l n N i i = 1 k N i α 1 α = 1 k i = 1 k l n N i
The parameter α can be obtained from Equation (18), then take α into Equation (17) and parameter t can be determined. The parameter u can be calculated by t = u α .
Table 6 shows α and u values calculated by method of maximum likelihood at different stress levels.

3.2.3. Method of Moments

The relationship between the parameters α and u of the two-parameter Weibull distribution and the first-order origin moment and the second-order origin moment of the sample is as Equations (19) and (20):
E ( N x ) = u Γ ( 1 + 1 α )
E ( N x 2 ) = u 2 Γ ( 1 + 2 α )
where Γ ( x ) is the gamma function, E ( N x ) = μ , E ( N x 2 ) = μ 2 + σ 2 , μ , σ are the mean and variance of the sample.
The f cov (coefficient of variation) of the sample can be written as Equation (21):
f cov = σ μ = Γ ( 1 + 2 α ) Γ 2 ( 1 + 1 α ) 1
The parameter α can be obtained from Equation (21), it only can be calculated by assumptions and is inefficient. So it can be solved approximately with Equation (22).
α = f c o v 1.08
Then the parameter u is calculated by Equation (23):
u = μ Γ ( 1 + 1 α )
Table 7 shows α and u values calculated by method of moments at different stress levels.
In order to reduce the error caused by different methods, the average values of α and u calculated by the three methods are used as the parameters of the Weibull distribution, which is shown in Table 8. With the increase of the stress level, the shape parameter α increases and scale parameter u decreases. The scale parameter is able to characterize fatigue life; the larger the scale parameter, the greater the fatigue life. Under the given stress levels, GTRSFPC has the larger scale parameter, which means that the fatigue life of GTRSFPC is higher. On the whole, the parameter α and u values of GTRSFPC are higher than that of CPC.

3.3. Goodness-of-Fit Test

Based on the Weibull distribution model, the shape parameter and scale parameter of the Weibull distribution has been obtained by three methods in Section 3.2, but whether the actual fatigue life is consistent with the Weibull distribution and whether the parameters of the distribution function can be used to characterize the actual fatigue performance, it is necessary to conduct a goodness-of-fit test for fatigue life. The Kolmogorov–Smirnov test is used in the study and the test equation was as Equation (24):
D = m a x i = 1 k [ | F * ( N i ) F ( N i ) | ]
where F * ( N i ) = i / k , i is the order number of the data point, k is the total number of the data points at given stress level; F ( N i ) is the cumulative distribution function calculated by Equation (6).
The Kolmogorov–Smirnov test results at stress level 0.70 for CPC are shown in Table 9. The maximum difference D at other stress levels for CPC and GTRSFPC is listed in Table 10. The critical value Dc for k = 5 and 5% significance level is 0.563 based on the Kolmogorov–Smirnov test table. All D values at different stress levels for CPC and GTRSFPC are less than critical value Dc, which indicates that the applied Weibull distribution model for fatigue life is acceptable at 5% significance level and can be used to establish the fatigue life equation.

3.4. Fatigue-Life Distribution

The cumulative distribution function and probability density function of the Weibull distribution at different stress levels for CPC and GTRSFPC are shown in Figure 7, Figure 8, Figure 9 and Figure 10.
Based on Figure 7, Figure 8, Figure 9 and Figure 10, it can be concluded that, when the cumulative distribution function value is the same, the fatigue life of CPC and GTRSFPC all increase with the decrease of stress level, GTRSFPC expresses the higher fatigue life than CPC at all given stress levels. In the probability density function, as the stress level decreases, the peak of the probability density function gradually decreases and the curve becomes flat, the probability density function of GTRSFPC exhibits lower peak and shapes to right offset than the CPC at all given stress levels. The Weibull distribution function indicates that GTRSFPC shows better fatigue characteristics than CPC.

3.5. Establishment of Fatigue-Life Equation

The fatigue equation for the pervious concrete can be expressed as Equation (25):
l n   S = b l n   N + l n   c
where S = stress level, N = fatigue life, b and c are undetermined coefficients.
Based on the parameters of Weibull distribution shown in Table 8 at different stress levels for CPC and GTRSFPC, the survivorship function (Equation (8)) can be obtained. Make the survivorship function L ( N ) = 0.95 , 0.90 , , 0.50 , then the fatigue life N at different stress levels for CPC and GTRSFPC can be acquired. Table 11 shows the fatigue life under different survival probabilities.
Based on the fatigue data in Table 11, the fatigue equations under different survival probabilities are established and the regression coefficients are shown in Table 12. The correlation coefficients for all fatigue equations are higher than 0.99. The fatigue equations with a survival probability of 50% are as follows:
CPC :   l n   S = 0.0379   l n   N + l n   1.0961
GTRSFPC :   l n   S = 0.0369   l n   N + l n 1.0956
Figure 11 shows the fatigue equations of CPC and GTRSFPC when the survival probability is 50%. When the stress level is the same, the fatigue life of GTRSFPC is higher than CPC, which indicates that the addition of a modifier improves the fatigue properties of pervious concrete. The fatigue equations under the other survival probabilities also show the same law.

4. Conclusions

The ground tire rubber and silica fume modified pervious concrete (GTRSFPC) and control pervious concrete (CPC) were prepared and researched in the lab. The static flexural strength, flexural strain, and the flexural-fatigue life under different stress levels were tested. The two-parameter Weibull distribution was used to characterize the fatigue behavior of the pervious concrete. Based on test results, the following conclusions can be drawn.
  • The static flexural tests indicate that the addition of ground tire rubber and silica fume improves the deformability of pervious concrete without sacrificing strength.
  • The flexural-fatigue tests indicate that the fatigue life decreases with the increasing stress level. The fatigue life of GTRSFPC is higher than that of CPC at the same stress level, which shows that the addition of ground tire rubber and silica fume improves the fatigue life of pervious concrete.
  • The Kolmogorov–Smirnov test results show that the two-parameter Weibull distribution is suitable for the fatigue data fitting. The graphical method, maximum likelihood method and moment method can be used to determine the Weibull distribution parameters. With the increase of the stress level, the shape parameter α increases while the scale parameter u decreases. In general, the parameters α and u of GTRSFPC are higher than that of CPC at the same stress level.
  • Based on the Weibull distribution, the fatigue equations with different survival probabilities for CPC and GTRSFPC are established. The fatigue equations indicate that the relationship of stress level S and fatigue life N better accords with ln-linear law. When the survival probability is the same, GTRSFPC has higher fatigue life.
  • Compared with CPC, GTRSFPC not only performs well in terms of deformability and fatigue performance, but also plays an important role in waste utilization, environmental protection and sustainable development.

Author Contributions

Conceptualization: H.L. and P.Z.; Investigation: G.L., H.W., and W.L.; Formal Analysis: G.L., H.W., and D.Y.; Writing (original draft): G.L. and H.W.; Writing (review and editing): P.Z.; Fund Acquisition: H.L. and P.Z.

Funding

This research was funded by the Science Technology Development Program of Jilin Province (grant number 20180201026SF) and the National Natural Science Foundation of China (grant number 11702108).

Acknowledgments

The authors would like to appreciate anonymous reviewers for their constructive suggestions and comments to improve the quality of the paper.

Conflicts of Interest

The authors declare no conflict of interest.

References

  1. Wei, T.; Wijesiri, B.; Jia, Z.L.; Li, Y.X.; Goonetilleke, X. Re-thinking classical mechanistic model for pollutant build-up on urban impervious surfaces. Sci. Total Environ. 2019, 651, 114–121. [Google Scholar] [CrossRef] [PubMed]
  2. Richards, D.R.; Edwards, P.J. Using water management infrastructure to address both flood risk and the urban heat island. Int. J. Water Resour. Dev. 2017, 34, 490–498. [Google Scholar] [CrossRef]
  3. Shariat, R.; Roozbahani, A.; Ebrahimian, A. Risk analysis of urban stormwater infrastructure systems using fuzzy spatial multi-criteria decision making. Sci. Total Environ. 2019, 647, 1468–1477. [Google Scholar] [CrossRef] [PubMed]
  4. Byun, K.; Chiu, C.M.; Hamlet, A.F. Effects of 21st century climate change on seasonal flow regimes and hydrologic extremes over the Midwest and Great Lakes region of the US. Sci. Total Environ. 2019, 650, 1261–1277. [Google Scholar] [CrossRef] [PubMed]
  5. Leonard, B.; Costello, C.; Libecap, G.D. Expanding water markets in the western United States: Barriers and lessons from other natural resource markets. Rev. Environ. Econ. Policy 2019, 13, 43–61. [Google Scholar] [CrossRef]
  6. Al-Bakri, J.T.; Salahat, M.; Suleiman, A.; Suifan, M.; Hamdan, M.R.; Khresat, S.; Kandakji, T. Impact of climate and land use changes on water and food security in Jordan: Implications for transcending “the tragedy of the commons”. Sustainability 2013, 5, 724–748. [Google Scholar] [CrossRef]
  7. Chithra, S.V.; Nair, M.V.H.; Amarnath, A.; Anjana, N.S. Impacts of impervious surfaces on the environment. Int. J. Eng. Sci. Invent. 2015, 4, 27–31. [Google Scholar]
  8. Singh, R.; Goel, R. Pervious concrete—A review on its properties and applications. Sustain. Eng. Lect. Notes Civ. Eng. 2019, 30, 157–165. [Google Scholar]
  9. Yang, J.; Jiang, G.L. Experimental study on properties of pervious concrete pavement materials. Cem. Concr. Res. 2003, 33, 381–386. [Google Scholar] [CrossRef]
  10. Welker, A.L.; Barbis, J.D.; Jeffers, P.A. A side-by-side comparison of pervious concrete and porous asphalt. J. Am. Water Resour. Assoc. 2012, 48, 809–819. [Google Scholar] [CrossRef]
  11. Kabagire, K.D.; Yahia, A. Modelling the properties of pervious concrete using a full-factorial design. Road Mater. Pavement 2016, 19, 1–17. [Google Scholar] [CrossRef]
  12. Jennifer, M.; Terry, L. Practical review of pervious pavement designs. Clean-Soil Air Water 2014, 42, 111–124. [Google Scholar]
  13. Huang, B.S.; Wu, H.; Shu, X.; Burdette, E.G. Laboratory evaluation of permeability and strength of polymer-modified pervious concrete. Constr. Build. Mater. 2010, 24, 818–823. [Google Scholar] [CrossRef]
  14. Yeih, W.; Fu, T.C.; Chang, J.L.; Huang, R. Properties of pervious concrete made with air-cooling electric arc furnace slag as aggregates. Constr. Build. Mater. 2015, 93, 737–745. [Google Scholar] [CrossRef]
  15. Gaedicke, C.; Torres, A.; Huynh, K.C.T.; Marines, A. A method to correlate splitting tensile strength and compressive strength of pervious concrete cylinders and cores. Constr. Build. Mater. 2016, 125, 271–278. [Google Scholar] [CrossRef]
  16. Chandrappa, A.K.; Biligiri, K.P. Influence of mix parameters on pore properties and modulus of pervious concrete: An application of ultrasonic pulse velocity. Mater. Struct. 2016, 49, 5255–5271. [Google Scholar] [CrossRef]
  17. Chen, Y.; Wang, K.J.; Wang, X.H.; Zhou, W.F. Strength, fracture and fatigue of pervious concrete. Constr. Build. Mater. 2013, 42, 97–104. [Google Scholar] [CrossRef]
  18. Lian, C.; Zhuge, Y.; Beecham, S. The relationship between porosity and strength for porous concrete. Constr. Build. Mater. 2011, 25, 4294–4298. [Google Scholar] [CrossRef]
  19. Nguyen, D.H.; Sebaibi, N.; Boutouil, M.; Leleyter, L.; Baraud, F. A modified method for the design of pervious concrete mix. Constr. Build. Mater. 2014, 73, 271–282. [Google Scholar] [CrossRef]
  20. Torres, A.; Hu, J.; Ramos, A. The effect of the cementitious paste thickness on the performance of pervious concrete. Constr. Build. Mater. 2015, 95, 850–859. [Google Scholar] [CrossRef]
  21. Chang, J.J.; Yeih, W.; Chung, T.J.; Huang, R. Properties of pervious concrete made with electric arc furnace slag and alkali-activated slag cement. Constr. Build. Mater. 2016, 109, 34–40. [Google Scholar] [CrossRef]
  22. Brake, N.A.; Allahdadi, H.; Adam, F. Flexural strength and fracture size effects of pervious concrete. Constr. Build. Mater. 2016, 113, 536–543. [Google Scholar] [CrossRef]
  23. Mohammadi, Y.; Kaushik, S.K. Flexural Fatigue-life distributions of plain and fibrous concrete at various stress levels. J. Mater. Civ. Eng. 2005, 17, 650. [Google Scholar] [CrossRef]
  24. Chandrappa, A.K.; Biligiri, K.P. Flexural-fatigue characteristics of pervious concrete: Statistical distributions and model development. Constr. Build. Mater. 2017, 153, 1–15. [Google Scholar] [CrossRef]
  25. Zhou, J.L.; Zheng, M.L.; Wang, Q.; Yang, J.G.; Lin, T.F. Flexural fatigue behavior of polymer-modified pervious concrete with single sized aggregates. Constr. Build. Mater. 2016, 124, 897–905. [Google Scholar] [CrossRef]
  26. Chandrappa, A.K.; Biligiri, K.P. Effect of pore structure on fatigue of pervious concrete. Road Mater. Pavement Des. 2018, 21, 1–23. [Google Scholar] [CrossRef]
  27. Pindado, M.A.; Aguado, A.; Josa, A. Fatigue behavior of polymer-modified porous concretes. Cem. Concr. Res. 1999, 29, 1077–1083. [Google Scholar] [CrossRef] [Green Version]
  28. Chen, S.F.; Zheng, M.L.; Wang, B.G. Formulation and application of fatigue equation for porous cement concrete. J. Chin. Ceram. Soc. 2005, 33, 827. [Google Scholar]
  29. Liu, H.B.; Luo, G.B.; Gong, Y.F.; Wei, H.B. Mechanical properties, permeability, and freeze-thaw resistance of pervious concrete modified by waste ground tire rubbers. Appl. Sci. 2018, 8, 1843. [Google Scholar] [CrossRef]
  30. Liu, H.B.; Luo, G.B.; Wang, L.H.; Wang, W.S.; Li, W.J.; Gong, Y.F. Laboratory evaluation of eco-friendly pervious concrete pavement material containing silica fume. Appl. Sci. 2019, 9, 73. [Google Scholar] [CrossRef]
  31. Liu, H.B.; Luo, G.B.; Wei, H.B.; Yu, H. Strength, permeability, and freeze-thaw durability of pervious concrete with different aggregate sizes, porosities, and water-binder ratios. Appl. Sci. 2018, 8, 1217. [Google Scholar] [CrossRef]
  32. Ministry of Housing and Urban-Rural Construction of the People’s Republic of China. Technical Specification for Pervious Cement Concrete Pavement; Ministry of Housing and Urban-Ural Construction of the People’s Republic of China: Beijing, China, 2009. (In Chinese)
  33. American Society for Testing and Materials (ASTM). A Guide for Fatigue Testing and the Statistical Analysis of Fatigue Data; ASTM Special Publication 91-A: Philadelphia, PA, USA, 1963. [Google Scholar]
Figure 1. Research outline
Sustainability 11 04467 g001
Figure 2. Materials: (a) coarse aggregate, (b) ground tire rubber, and (c) silica fume.
Sustainability 11 04467 g002
Figure 3. Flexural strength test.
Sustainability 11 04467 g003
Figure 4. MTS closed testing machine for flexural-fatigue test.
Sustainability 11 04467 g004
Figure 5. The failure mode of a beam after static flexural test and flexural fatigue test: (a) failure mode of a beam after static flexural test; (b) failure mode of a beam after flexural-fatigue test.
Sustainability 11 04467 g005
Figure 6. The average fatigue life ratios of GTRSPC to CPC under different stress levels.
Sustainability 11 04467 g006
Figure 7. The Weibull distribution at stress levels of 0.85 for CPC and GTRSFPC: (a) The cumulative distribution function; (b) The probability density function.
Sustainability 11 04467 g007
Figure 8. The Weibull distribution at stress levels of 0.80 for CPC and GTRSFPC: (a) The cumulative distribution function; (b) The probability density function.
Sustainability 11 04467 g008
Figure 9. The Weibull distribution at stress levels of 0.75 for CPC and GTRSFPC: (a) The cumulative distribution function; (b) The probability density function.
Sustainability 11 04467 g009
Figure 10. The Weibull distribution at stress levels of 0.70 for CPC and GTRSFPC: (a) The cumulative distribution function; (b) The probability density function.
Sustainability 11 04467 g010
Figure 11. The fatigue equations of CPC and GTRSFPC with the survival probability of 50%.
Sustainability 11 04467 g011
Table 1. Mix proportions of pervious concrete (in kg/m3).
Mix ID.Coarse AggregateCementGround Tire RubberSilica FumeWaterSuperplasticizer
CPC 11503.3479.900144.03.84
GTRSFPC 21503.3413.028.256.3140.83.75
1 CPC: Control pervious concrete; 2 GTRSFPC: ground tire rubber and silica fume modified pervious concrete.
Table 2. Static flexural strength (in MPa).
Mix IDStatic Flexural Strength
12345AverageStandard Deviation
CPC4.394.354.854.594.474.530.20
GTRSFPC4.914.884.214.764.584.670.29
Table 3. Flexural strain.
Mix IDStatic Flexural Stain
12345AverageStandard Deviation
CPC0.51%0.49%0.36%0.48%0.39%0.45%0.06%
GTRSFPC0.60%0.63%0.45%0.49%0.59%0.55%0.07%
Table 4. Flexural-fatigue life (number of cycles to failure, N) of pervious concrete at different fatigue stress levels.
TypeStress Level S
0.700.750.800.85
CPC37,11563541350340
75,47312,8522248579
156,63119,4573600879
214,75932,65654791187
337,46250,56077781642
GTRSFPC51,62195891721398
84,79718,7523284625
193,30632,1474576970
267,85745,42374521240
435,77972,78097851793
Table 5. The α and u values at different stress levels (graphical method).
Stress Level SCPCGTRSFPC
αuαu
0.851.43811106 1.50581197
0.801.26974901 1.28886454
0.751.097129,192 1.126642,975
0.701.0096198,569 1.0157248,441
Table 6. The α and u values at different stress levels (method of maximum likelihood).
Stress Level SCPCGTRSFPC
αuαu
0.852.1761 1049 2.2235 1140
0.801.8780 4630 1.9622 6074
0.751.6138 27,331 1.6831 40,186
0.701.5686 183,266 1.5319 230,273
Table 7. The α and u values at different stress levels (method of moments).
Stress Level SCPCGTRSFPC
αuαu
0.851.89681043 1.93511133
0.801.64374574 1.72066016
0.751.423526,813 1.486839,545
0.701.4165180,579 1.3705225,971
Table 8. The α and u values at different stress levels (the average obtained by three methods).
Stress Level SCPCGTRSFPC
αuαu
0.851.8370 1066 1.8881 1157
0.801.5971 4702 1.6572 6181
0.751.3781 27,779 1.4322 40,902
0.701.3316 187,471 1.3060 234,895
Table 9. Kolmogorov–Smirnov test results at stress level 0.70 for CPC.
Stress Level S i N i F F | F F |
0.70137,1150.2000 0.1093 0.0907
275,4730.4000 0.2575 0.1425 *
3156,6310.6000 0.5449 0.0551
4214,7590.8000 0.6983 0.1017
5337,4621.0000 0.8878 0.1122
* The maximum difference D at given stress level.
Table 10. Maximum difference D at different stress levels for CPC and GTRSFPC.
Stress Level SD
CPCGTRSFPC
0.700.14250.1677
0.750.14220.1209
0.800.13510.1447
0.850.12190.1315
Table 11. The fatigue life (number of cycles to failure, N) under different survival probabilities.
Survival ProbabilityStress Level S
CPCGTRSFPC
0.850.800.750.700.850.800.750.70
0.95212 732 3219 20,147 240 1030 5141 24,164
0.90313 1149 5427 34,593 351 1590 8499 41,932
0.85396 1507 7432 47,901 442 2065 11,502 58,434
0.80471 1838 9355 60,777 523 2500 14,352 74,488
0.75541 2155 11,248 73,551 598 2914 17,137 90,483
0.70608 2466 13,147 86,437 670 3318 19,913 106,672
0.65674 2775 15,077 99,603 741 3718 22,718 123,261
0.60740 3088 17,062 113,202 811 4121 25,589 140,443
0.55806 3407 19,125 127,395 881 4532 28,559 158,418
0.50873 3738 21,292 142,363 953 4955 31,667 177,417
Table 12. The regression coefficients of fatigue equation under different survival probabilities.
Survival ProbabilityCPCGTRSFPC
bcbc
0.95−0.04251.0624−0.04191.0700
0.90−0.04111.0725−0.04041.0778
0.85−0.04041.0783−0.03951.0821
0.80−0.03981.0824−0.02891.0852
0.75−0.03941.0856−0.03841.0876
0.70−0.03901.0883−0.03801.0896
0.65−0.03871.0906−0.03771.0913
0.60−0.03841.0926−0.03741.0929
0.55−0.03821.0945−0.03711.0943
0.50−0.03791.0961−0.03691.0956

