Article

A Boundary Plane Approach to Map Hotspots for Achievable Soil Carbon Sequestration and Soil Fertility Improvement

1
Agroecosystems and Sustainable Landscapes (ASL) Research Area, International Center for Tropical Agriculture (CIAT), Nairobi 00100, Kenya
2
Department of Soil and Environment, Swedish University of Agricultural Sciences, 532 23 Skara, Sweden
3
Agriculture and Land Use Change, WWF Deutschland, 10117 Berlin, Germany
4
International Center for Tropical Agriculture—CIAT, ASL Research Area, Cali 760001, Colombia
5
Department of Plant Science and Crop Protection, College of Agriculture and Veterinary Sciences, University of Nairobi, Kangemi 00625, Kenya
6
World Agroforestry Center (ICRAF), Nairobi 00100, Kenya
7
Department of Soil and Environment, Swedish University of Agricultural Sciences, 750 07 Uppsala, Sweden
8
International Center for Tropical Agriculture—CIAT, ASL Research Area, Addis Ababa 1000, Ethiopia
*
Author to whom correspondence should be addressed.
Sustainability 2019, 11(15), 4038; https://doi.org/10.3390/su11154038
Submission received: 10 June 2019 / Revised: 21 July 2019 / Accepted: 22 July 2019 / Published: 25 July 2019
(This article belongs to the Section Sustainable Agriculture)

Abstract

:
Soil organic carbon (SOC) sequestration is important in the global carbon cycle and an integral part of many initiatives and policies to mitigate climate change. For efficient targeting of measures leading to SOC sequestration, it is necessary to know the actual SOC content (%) and a realistic target SOC content (in contrast to the saturation content, which may not be easily achievable) under local biophysical and socioeconomic conditions. We developed a new method for the practical assessment of achievable SOC sequestration concerning soil texture based on a non-linear boundary plane approach, also applicable for mapping of SOC sequestration hotspots. The method was tested at two spatial scales (a 125 km2 catchment and a 4 km2 sub-area of that catchment) in a region in Western Kenya characterized by smallholder farming. Moreover, we assessed the associated benefits of increasing the SOC content from a crop production perspective and found significant correlations between SOC and other soil properties (pH, cation exchange capacity, and various plant-available macro- and micronutrients). This indicates a possible improvement in soil fertility when the SOC content is raised to the modeled target levels, which should be attainable without major changes in land use or agricultural systems.

1. Introduction

Soils are dynamic systems, consisting of mineral particles, organic materials, air, and water. Soil organic matter (SOM) is formed from living organisms (plants, animals, and fungi) together with dead organic material at all stages of decomposition [1]. The soil organic carbon (SOC) content is generally considered to be a fixed percentage of the SOM.
New organic matter is continually being added to soil in the form of litter and growing plant roots, and in the form of compost and manure. At the same time, there is a continuous breakdown of organic material by soil fauna and microbes [1]. When the addition of organic matter equals the decomposition rate, the SOC pool is said to be in steady-state. It can take decades to centuries for a soil system to reach a new SOC steady state after a change in environmental conditions or management practices [2,3].
Sequestration of SOC occurs when the balance between organic matter inputs and decomposition is altered such that a new steady state is eventually reached at a higher SOC level. Several factors influence the SOC content at steady state, including agricultural management practices that farmers can control (e.g., whether and how to till, which crop to grow, whether to irrigate, and in which form and amount the nutrients are applied) and other factors that cannot be controlled (e.g. soil texture and mineralogy, soil temperature, and rainfall) [4].
On a global scale, SOC levels are largely governed by temperature and precipitation, while at smaller spatial scales, other factors come into play, where, e.g., soil structure (aggregation) and texture (particle size distribution) can have a significant impact on SOC content [4]. The SOC stabilization or protective capacity can be physical (organic matter can be protected within soil aggregates) or chemical (organic molecules can bind to mineral particles and form organo-mineral complexes) [5].
Soil organic matter contains the largest pool of carbon in terrestrial ecosystems [4,6], and increasing the total amount of carbon stored in soils is widely considered a way to alleviate the anthropogenic increase in CO2 in the atmosphere [7,8,9]. In addition to national commitments on SOC sequestration, there are a multitude of international initiatives to increase SOC, e.g., the 4 per 1000 initiative on Soil for Food Security and Climate launched by the French Ministry of Agriculture at the United Nations Framework Convention for Climate Change Conference of the Parties (UNFCCC COP 21), and the Land Degradation Neutrality program run by the United Nations Convention to Combat Desertification (UNCCD).
Several concepts, with very similar definitions, have been used to describe the maximum amount of SOC that can be stabilized/protected by the fine soil particles (clay + silt, or only certain fractions of silt). These include SOC saturation [5,10,11,12], SOC stabilization capacity [13,14], and SOC protection capacity [15]. The difference between this upper limit and the observed SOC content (also denoted existing or actual SOC content) is referred to as the SOC saturation deficit (ibid). In soils where the saturation SOC content has been reached (SOC saturation deficit = 0), any additional SOC deposited in the soil is not protected by the mineral matrix but forms part of a labile SOC pool with faster turnover [10,12]. In the present study, we use the term target SOC to indicate a practically achievable level of SOC that is determined empirically. Thus, the target SOC content is not the same as the biophysical protection/stabilization SOC content. We use the term achievable SOC sequestration to indicate the gap between this target SOC content and the observed SOC content.
Target SOC content can be empirically determined based on the fraction of fine mineral particles (clay + silt) in a soil sample dataset by methods, such as linear regression [15], boundary line modeling [11], and quantile regression [14]. However, as pointed out by Feng et al. [11] and McNally et al. [14], the linear method severely underestimates the upper limit of SOC for soil texture. Beare et al. [13] modeled target SOC content based on specific surface area (which is strongly dependent on the fraction of fine particles), pH, and extractable aluminum (Al) by multivariate quantile regression. Feng et al. [11] compared their empirical boundary line modeling with simple mechanistic modeling (also based on specific surface area) and found that, for best accuracy, the mechanistic modeling required mineralogy-specific parameterization, while the boundary line analysis worked irrespective of mineralogy, probably because the boundary lines were parameterized locally.
In boundary line analyses, the upper limit of one variable in relation to another variable is empirically identified [16]. In the study by Feng et al. [11], boundary lines were fitted to the 90th percentile of SOC values for discrete classes of the fine mineral particle content in the soil. However, when analyzing soil particle size distribution, the results are commonly reported as fractions of clay, silt, and sand. To make the most use of all soil texture data, an interesting extension of the approach by Feng et al. [11] could be to model target SOC in relation to two-dimensional (2D) soil texture data by parameterizing a boundary plane, representing target SOC as a function of the 2D coordinates of the soil texture triangle. Soil texture is generally reported as fractions of three particle size classes (clay, silt, and sand), although the particle size class limits differ between classifications. The soil texture triangle is a ternary plot of the fractions of clay, silt, and sand, first published by Davis and Bennett [17]. In an orthogonal 3D coordinate system with sand on the x-axis, silt on the y-axis, and clay on the z-axis, the soil texture triangle is the plane described by the plane clay + silt + sand = 100%. Thus, soil texture is characterized by three particle size classes but still plotted in two dimensions (the two dimensions of the planar triangle).
From a crop production perspective, organic matter has many positive effects on soil properties. Organic particles hold soil aggregates together and give the soil a better structure, with less mechanic resistance to root growth and better aeration [1]. Organic matter also increases water infiltration and water holding capacity of the soil and stores nutrient elements in a form accessible for plant roots, as cations adhere to the negatively charged organic particles (ibid.). Recently, many studies estimating the potential of SOC sequestration at global, continental, national, and regional spatial scales have been published [18,19,20,21,22]. However, few of these studies report the expected associated benefits from a production perspective. While the former is often targeting a policy level audience, the latter is especially of interest to actors close to agricultural production. This type of knowledge gap might be of high relevance when policies are to be implemented in practice.
This study aimed to:
  • Introduce the concept of achievable SOC sequestration and describe it in contrast to the concept of SOC sequestration potential.
  • Describe a boundary plane approach for mapping target SOC content and achievable SOC sequestration, based on datasets from soil sample analyses of texture and SOC.
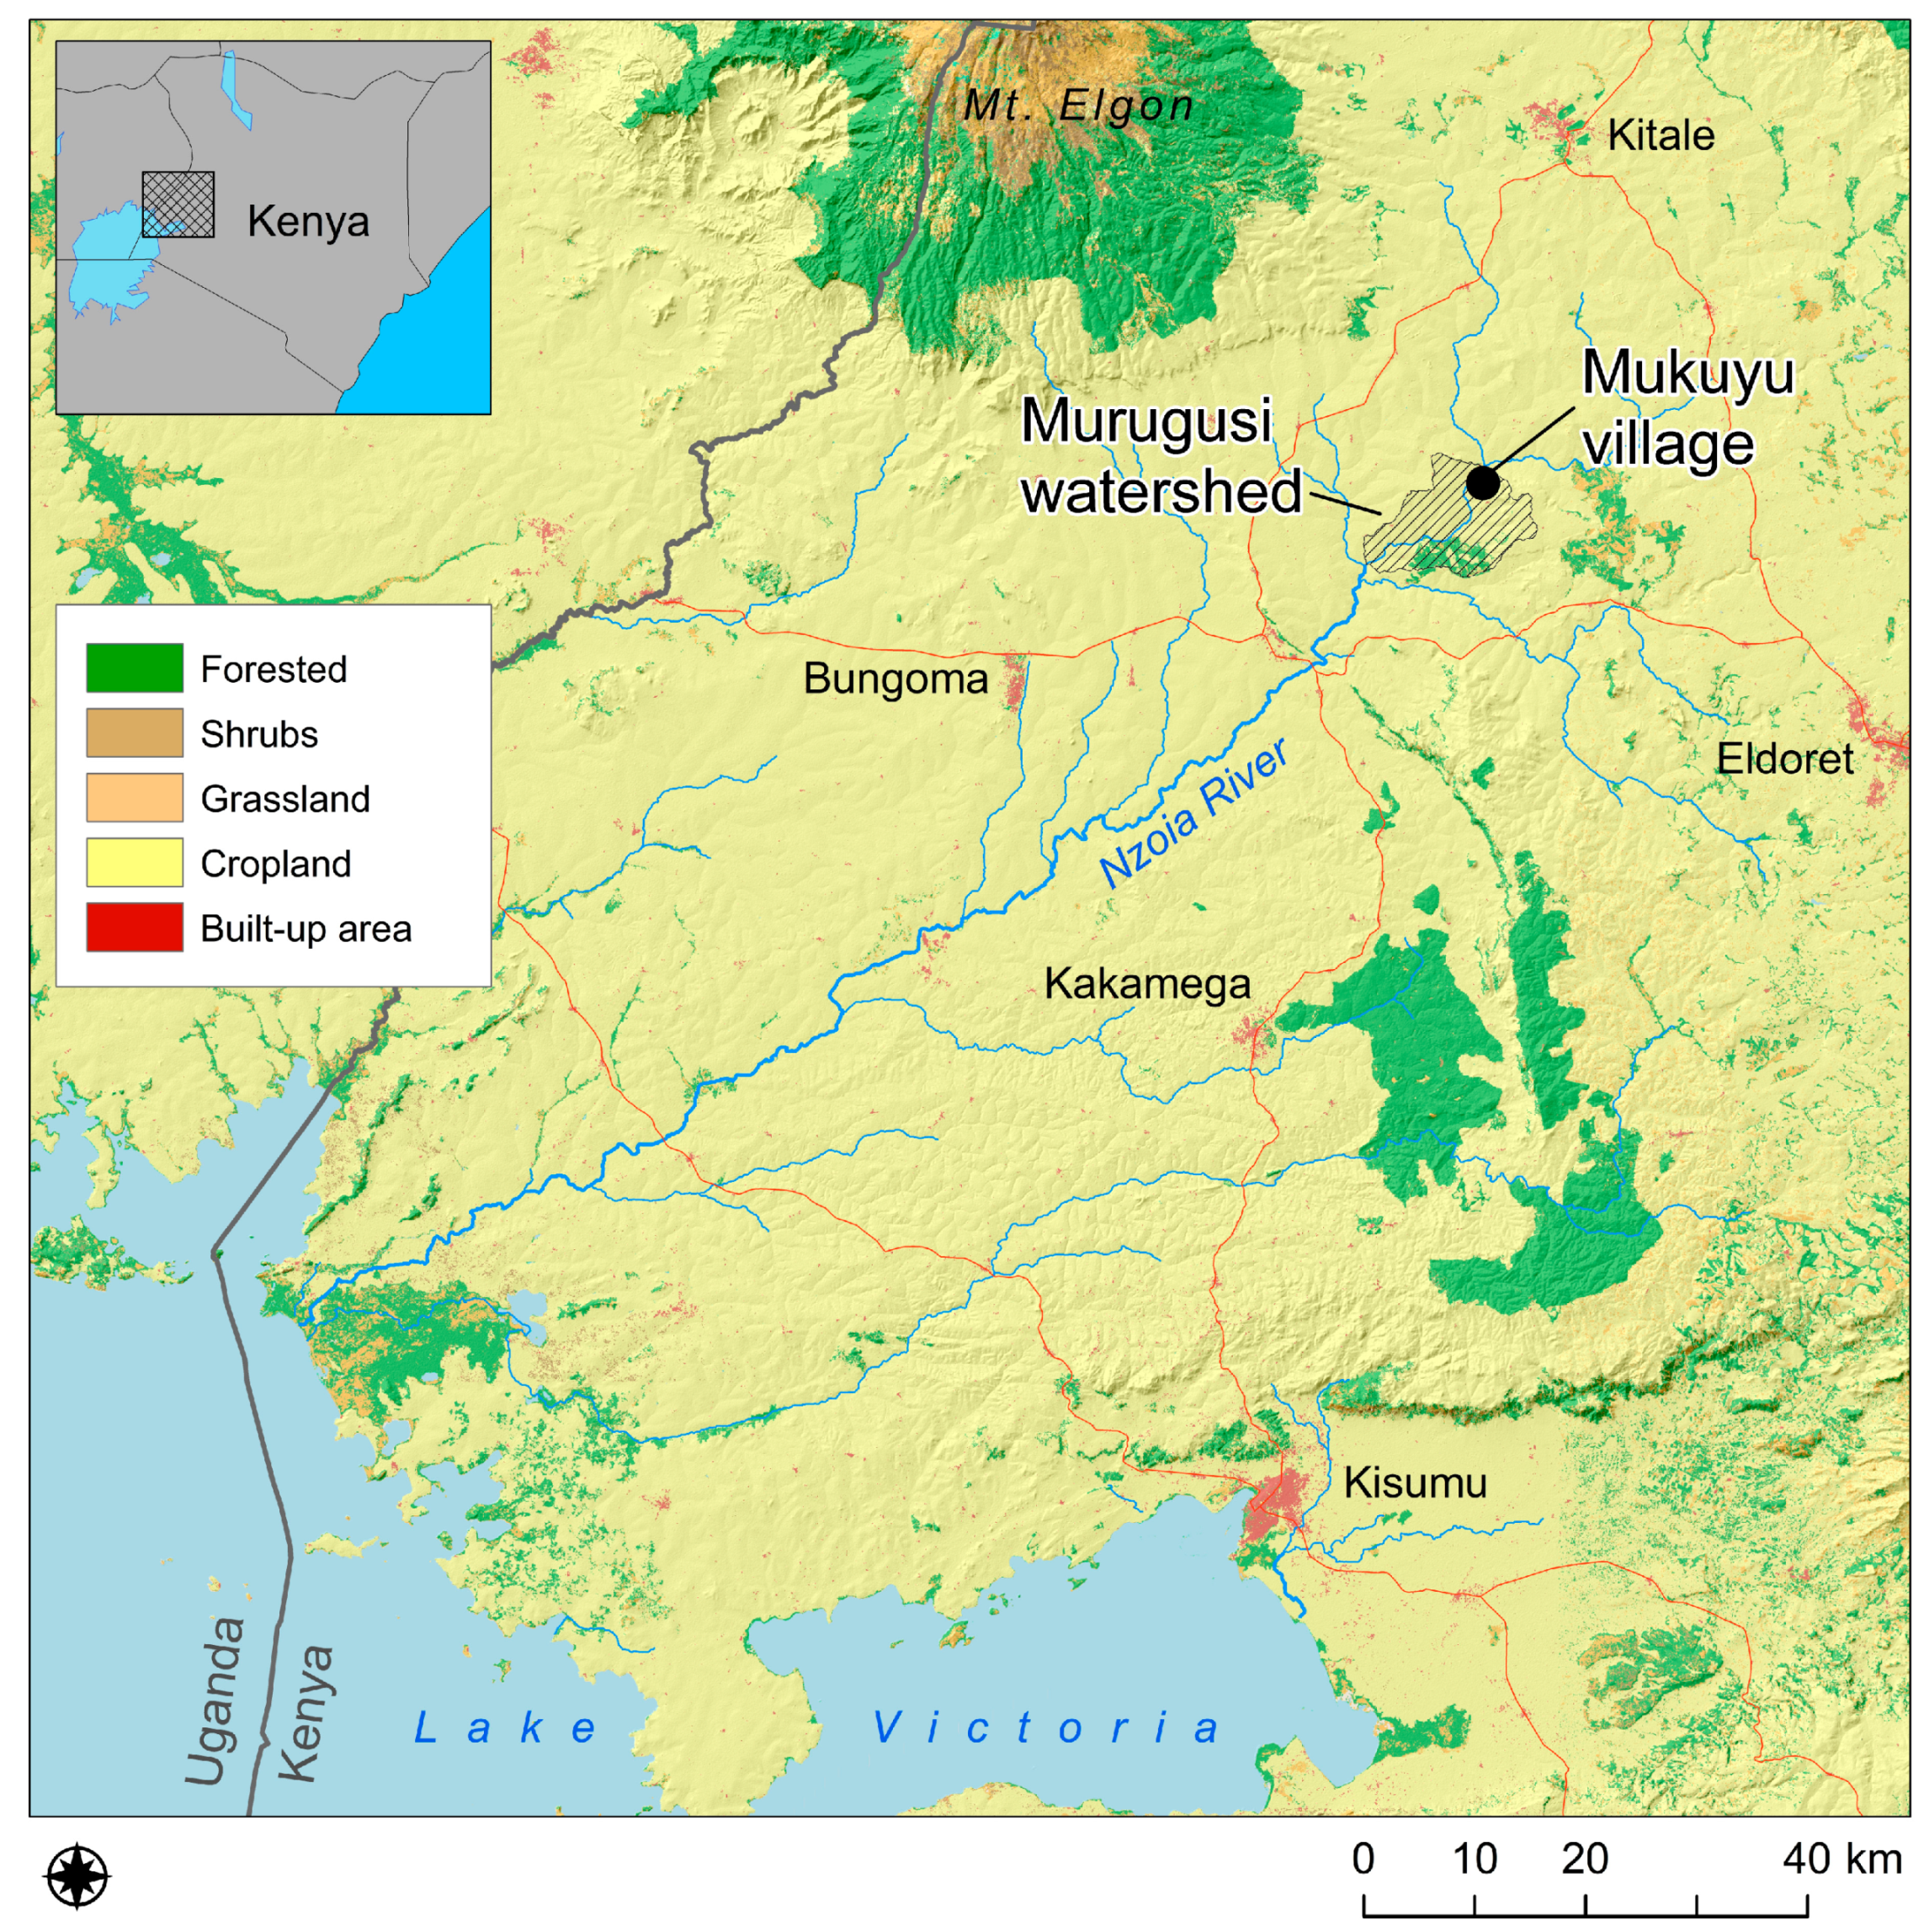
  • Demonstrate the method at two spatial scales: i) in a 125 km2 catchment in Western Kenya and ii) in a 4 km2 sub-area of that catchment.
  • Assess the potential benefits of increasing the SOC content in terms of soil fertility by testing correlations between soil nutrient status and SOC contents within the two study areas.

2. Materials and Methods

2.1. Study Area

Study areas in Western Kenya were chosen because it is a region in which targeting actions to improve soil fertility, e.g., by SOC sequestration, is currently a much-discussed concern among, e.g., farmers, extension services, international organizations, and non-governmental organizations. The Murugusi catchment, drained by the Nzoia River, is located on the border between the Bungoma and Kakamega counties in Kenya (Figure 1). It is a hilly landscape dominated by haplic ferralsols and acrisols [23], located in a sub-humid area (mean annual precipitation 1430 mm, mean annual temperature 19 °C; WorldClim data for the period 1950–2000, spatially disaggregated by the International Center for Tropical Agriculture (CIAT; Cali, Colombia) at 1530–1860 m above sea level (Shuttle Radar Topography Mission; SRTM 1 Arc-Second Global elevation data) (National Aeronautics and Space Administration; NASA, Washington, DC, USA). The rainfall is bimodal, with long and short rains occurring between February–May and September–November, respectively, while other months are practically dry. The dominant land use is small-scale crop production, the most important crops being maize (Zea mays) and beans (Phaseolus vulgaris L.) primarily produced for subsistence. In the long rainy season, both maize and beans are grown. Harvesting of maize takes place between September–October, after which crop residues are removed and used as animal feed. The soil is then cultivated for the production of beans, potatoes, and vegetables or left fallow for animals to graze in situ. Other food crops include sweet potatoes, cassava, sorghum, millet, vegetables, and fruits. During recent years, contract sugarcane production has been increasing in the area as a cash crop. Other farming activities include poultry keeping, dairy production, apiculture, and fish farming [24]. The Mukuyu sub-area is located in the eastern part of the Murugusi catchment, bordering the Nzoia River. In southern Murugusi, there are forest plantations.
Use of concentrated nitrogenous fertilizers (diammonium phosphate, urea, and calcium ammonium nitrate) for maize production is increasing in the region due to government subsidies [25]. However, the amount of fertilizer applied per unit area is still low [26]. This has contributed to low levels of soil nutrients, including nitrogen (N), phosphorus (P), potassium (K), sulfur (S), and boron (B). There is increasing debate on the use of compost and farmyard manure as alternative sources of nutrient elements, with farmers gradually embracing the idea. Current management practices, such as mono-cropping and no return of crop residues to the soil, have contributed to reduced soil fertility. Other factors contributing to reduced soil fertility include locally high erosion rates and leaching of soluble nutrients.

2.2. Soil Sampling

2.2.1. Murugusi Catchment

Attempting to capture the spatial variation in relevant soil properties in the Murugusi catchment and at the same time cover the entire study area, we used a stratified targeted sampling design as implemented in the R package SurfaceTortoise (version 1.0.1; R Foundation for Statistical Computing, Vienna, Austria), with elevation (SRTM) as the target covariate. This covariate was chosen because the elevation is globally available and often well correlated with soil properties [27]. The SRTM dataset was projected onto the Universal Transverse Mercator (UTM) 36 N coordinate system, which resulted in an approximate spatial resolution of 30 m × 30 m. The sampling procedure was based on the principle that the SRTM digital elevation model was iteratively sampled and reconstructed by inverse distance weighting interpolation. Where the difference between the original surface and the reconstructed surface was largest, a new sample was placed. This was repeated until predetermined samples had been distributed. To delineate an area with relatively homogeneous environmental conditions, forested areas (identified from a classified Sentinel-2 scene from 2017; ESA, Paris) and a plateau area above 1750 m above sea level were masked from the sampling area. A total of 102 samples were used. The sampling was constrained by using a stratification grid. When a sample had been located in a stratum (a square polygon cell), no more samples were allocated to that cell. Cropped strata at the boundary of the catchment were less likely to get a sample than complete cells falling within the area (the likelihood was proportional to the size of the cell). In addition to this, 30 random samples were added, and 10 samples were added manually, to better capture the biophysical variation patterns in the area. At each sample location, one composite topsoil sample (three cores of 7 cm in diameter) was taken from 0–0.2 m depth and bulk density was determined by drying and weighing two cylinders (height: 10 cm; diameter: 5 cm) of undisturbed soil, one down to 0.1 m and the other down to 0.2 m depth. This is the standard depth for soil sampling for soil analysis for agronomic recommendations in this area. The total number of samples taken in the Murugusi catchment was 200.

2.2.2. Mukuyu Sub-Area

Soil samples for the Mukuyu sub-area collected in 2015 within another project were used. The sampling procedure in that project followed a random stratified soil sampling design. The area was stratified by 300 m square grid cells, leaving a 40 m buffer zone to the area boundary. Four samples were randomly placed in each cell of the stratification grid. As in the Murugusi catchment, the sampling probability was constant across the area, which means that for cropped grid cells at the area boundary, the likelihood of having four samples was less than 100%. We also had access to soil sample data taken in a clustered manner on farms in another project, and these were added to the random stratified design. Where two samples were targeted to the same field or plot (shamba), the sample from the random stratified design was omitted. A total of 235 samples were collected in Mukuyu. Four topsoil (0–0.2 m depth) subsamples with a core diameter of 4 cm were taken in a 4 m × 4 m square, bulked to one composite sample in a bucket, and transferred to a labeled plastic bag.

2.3. Laboratory Analyses

2.3.1. Sample Preparation and Laboratory Facilities

The soil samples were air-dried at 30 °C, larger peds were sieved through an 8 mm mesh, and the remaining soil was sieved to pass through a 2 mm mesh. Soil texture (particle size distribution) and SOC content (%) were analyzed by the soil laboratory at CIAT (Nairobi, Kenya). Soil pH, cation exchange capacity (CEC), and the concentrations of several plant-available macronutrients and micronutrients were analyzed by Crop Nutrition Laboratory Services Ltd in Nairobi, Kenya (ISO/IEC 17025 accredited, Kenya Accreditation Service).

2.3.2. Laboratory Analyses

Soil fractions of clay (<0.002 mm), silt (0.002–0.05 mm), and sand (0.05–2 mm) were determined by the hydrometer method [28], using 10% sodium hexametaphosphate as the dispersing agent. Soil pH was determined potentiometrically on a soil suspension of 1:2 (soil:water). Total carbon and total nitrogen were measured after dry combustion using an elemental analyzer (Elementar Vario max cube; Elementar Analysensysteme GmbH, Langenselbold, Germany). As soils in the area are not calcareous, SOC content can be assumed to be equal to total carbon content. Plant-available fractions of P, K, magnesium (Mg), calcium (Ca), S, iron (Fe), B, manganese (Mn), zinc (Zn), and copper (Cu) were extracted in Mehlich-III solution (0.2 N CH3COOH + 0.2 N NH4NO3 + 0.015N NH4F + 0.013 N HNO3 + 0.001 M EDTA; [29]). Exchangeable aluminum (Al) was extracted in 1 M KCl solution. The elements were then analyzed by inductive coupled plasma-optical emission spectrometry (ICP-OES; Thermo Dual-6000 series; Thermo Fisher Scientific, Waltham, MA, USA). Mehlich-III extraction was chosen for all samples, irrespective of pH, to get a consistent dataset. The CEC was calculated by Equation (1) from the amounts of Mehlich-III extracted nutrients and concentrations of exchangeable H+ and other cations (Al3+, Fe2+, Mn2+), which were estimated according to the routine procedure by Crop Nutrition Laboratory Services Nairobi, Kenya.
CEC = 100 × ( 200 × [ Ca 2 + ] + 390 × [ K + ] + 120 × [ Mg 2 + ] + 230 × [ Na + ] ) ( 100 ( [ H + ] + other   cations ) )
where CEC is in cmolc kg-1, nutrient concentrations are in ppm, and the concentrations of H+ and other cations are expressed as percentages.

2.4. Estimation Method for Achievable SOC Sequestration

The achievable SOC sequestration was determined by Equation (2). Achievable SOC sequestration differs from SOC saturation deficit in that it is not the difference between current SOC content at a site and the SOC content in a state of biophysical carbon saturation. Instead, it is the difference between the current SOC content and the target SOC content, where the latter was defined as the predicted 95th percentile of SOC content in local soil samples with a similar texture. Hence, target SOC can be interpreted as the practically achievable SOC level. From a biophysical perspective, it may be possible to sequester even more carbon in the soil, but under the current farming system and socioeconomic conditions in the study area, this may not be realistic. The achievable SOC sequestration is what should be possible to sequester, simply by adopting the locally best (from a SOC preservation point of view) agricultural practices, without any radical shifts in cultivation methods, land ownership, input availability, mechanization, etc.
Achievable   SOC   sequestration   = target   SOC   content   current   SOC   content

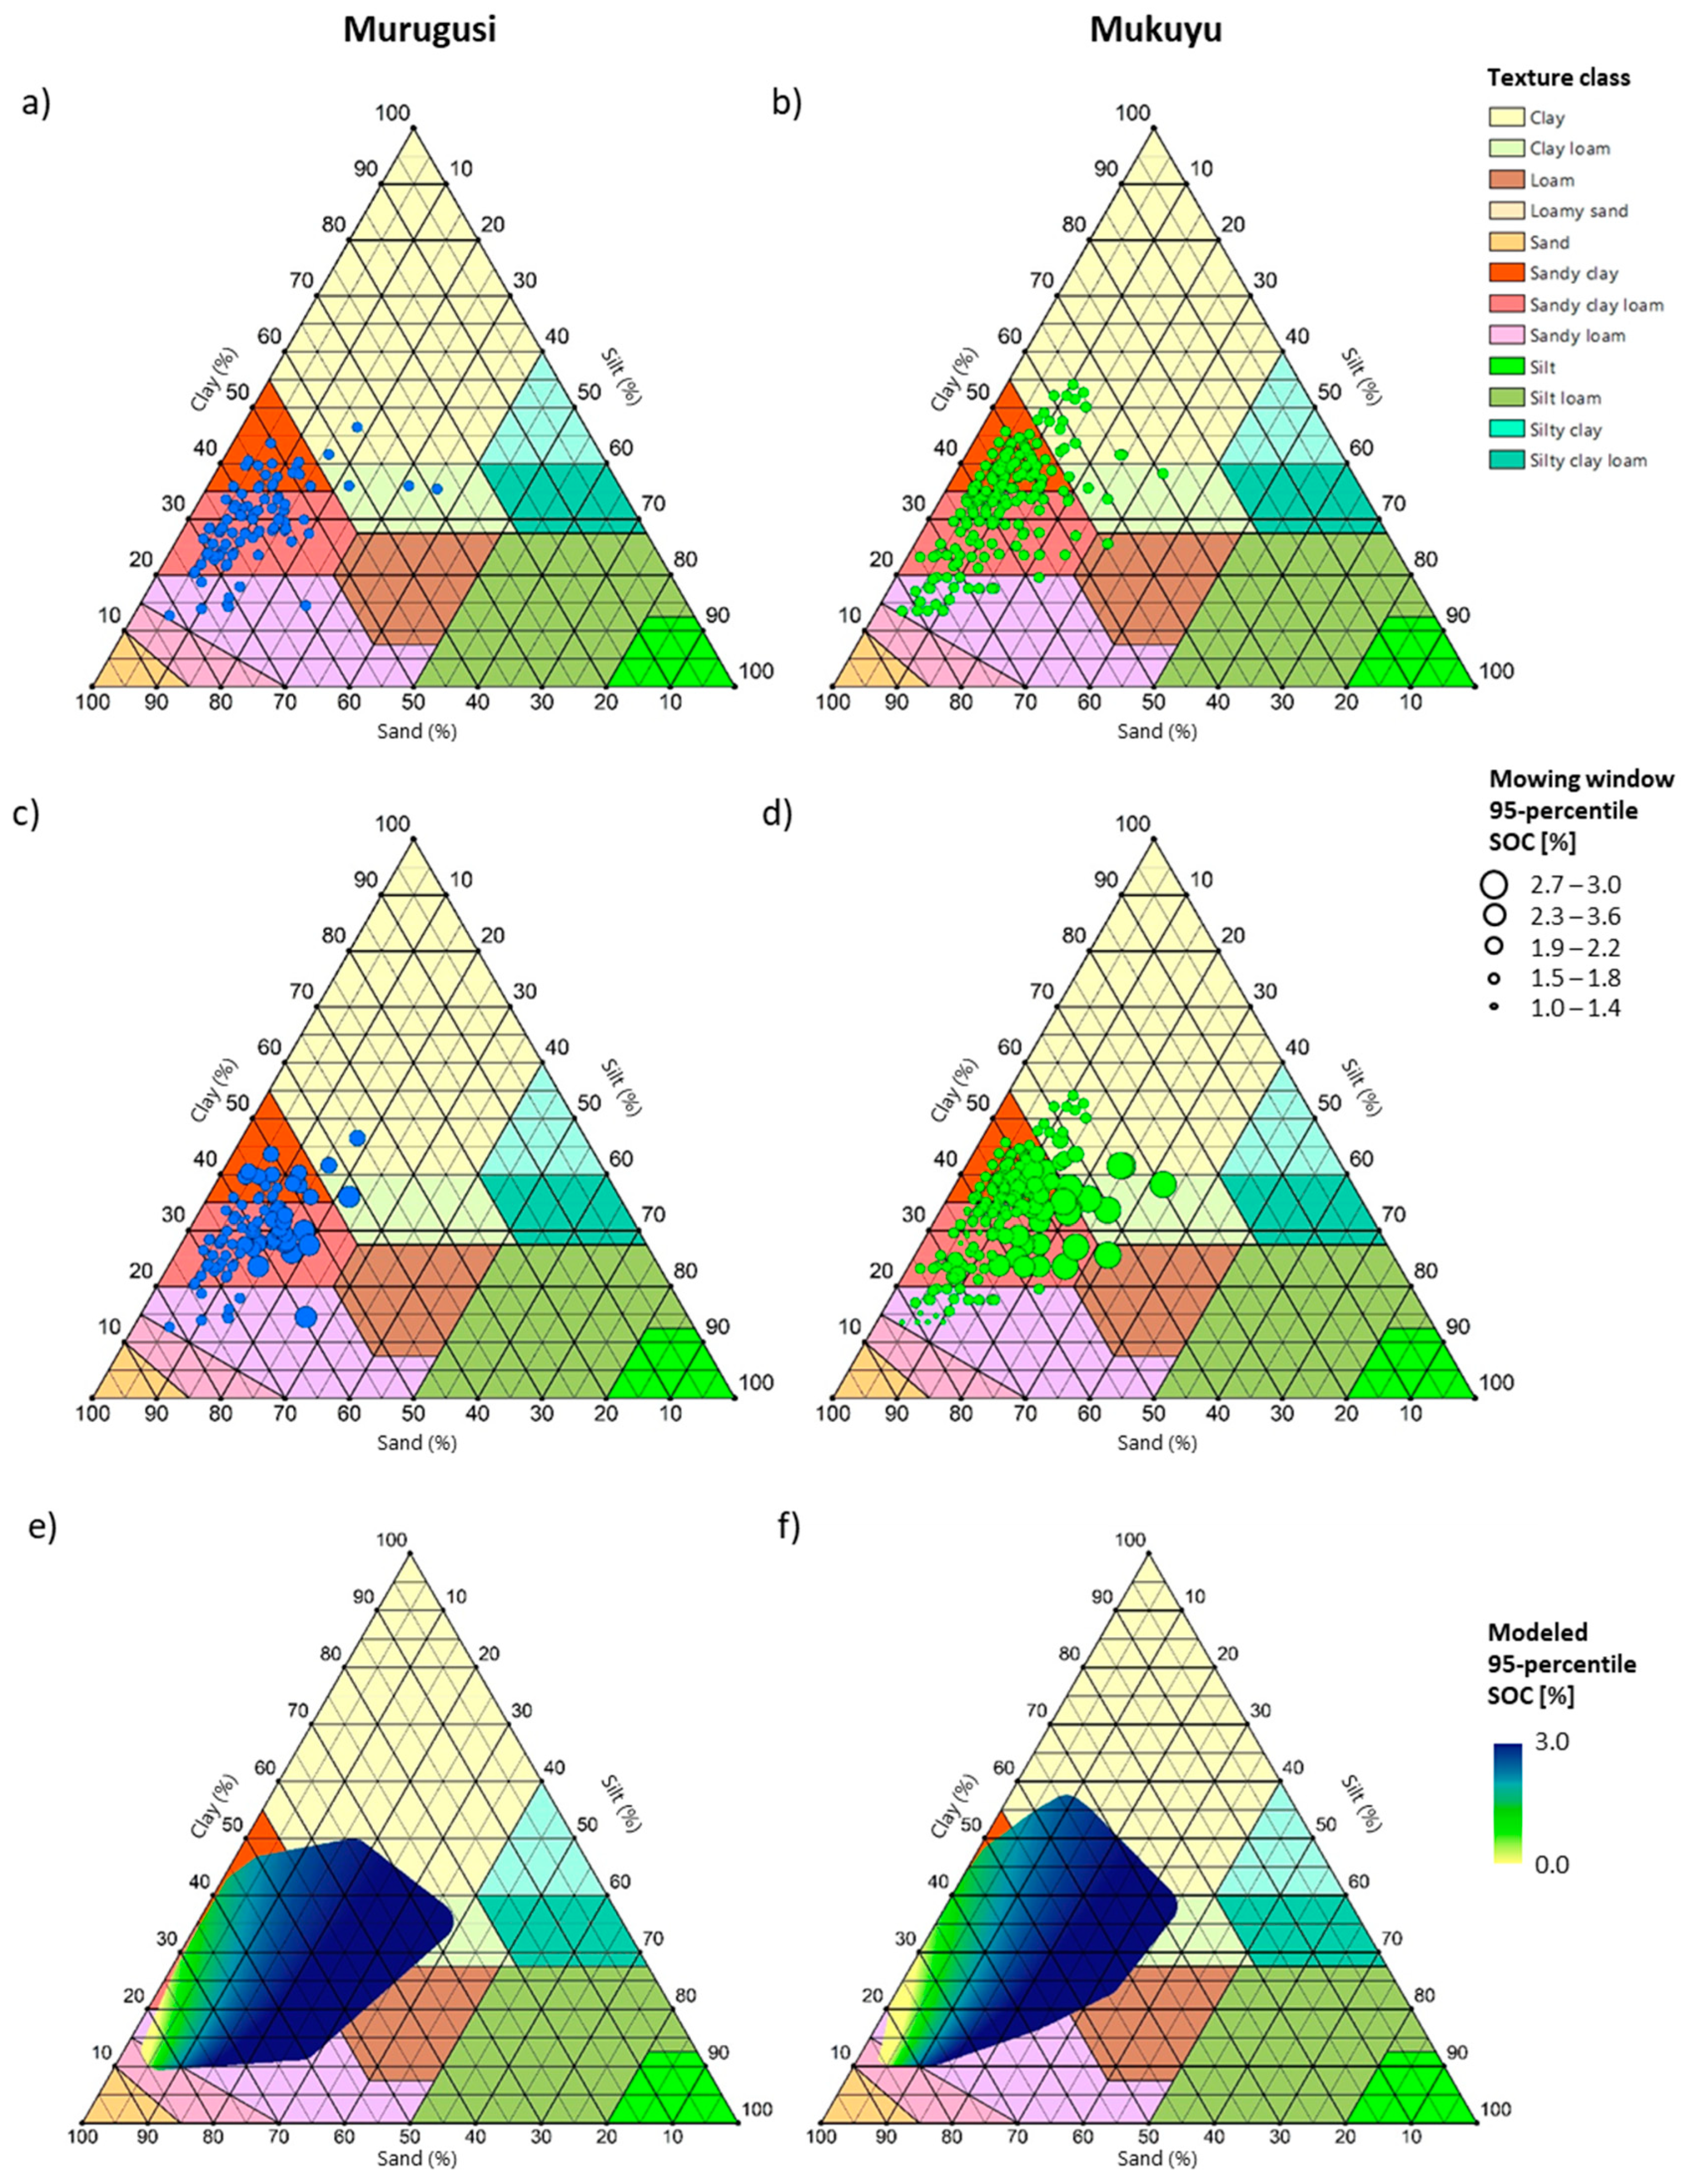
2.5. A Coordinate System for Soil Texture and SOC Content

In both soil sample datasets (Murugusi catchment and Mukuyu sub-area), the SOC content was plotted on z-axis orthogonal to the soil texture triangle, now described in a new x-y plane where the x- and y-coordinates are described by Equations (3)–(5). Back-conversion from this coordinate system to different particle-size classes can be done by Equations (6)–(9).
x   =   100     sand     clay   ×   a
y   =   clay   ×   b
z = SOC
clay   =   1 b   ×   y
silt   =   x     a b   ×   y
fine   =   x     a 1 b   ×   y
sand   =   100     x     a b   ×   y
where a = cosine (60°) =0.5, b = cosine (30°) = 3 2 , and fine = clay + silt

2.6. A Boundary Plane Model for Target SOC Content

The SOC targets (z) were modeled by boundary planes (Equation (10)) over the soil texture triangle fitted to the soil sample texture data by adjusting the parameters i, j, and k. First, a moving window determination of 95-percentile SOC values was made across the texture triangle. One 95-percentile value was stored for each soil sample. The 95-percentiles were based on the ten closest samples in the triangle (determined by the Euclidian distance in triangle x and y coordinates), including the sample in question. Then, the plane was fitted to the data. One boundary plane model was fitted for the Murugusi catchment and another for the Mukuyu sub-area.
z ^ = i + j x + k y

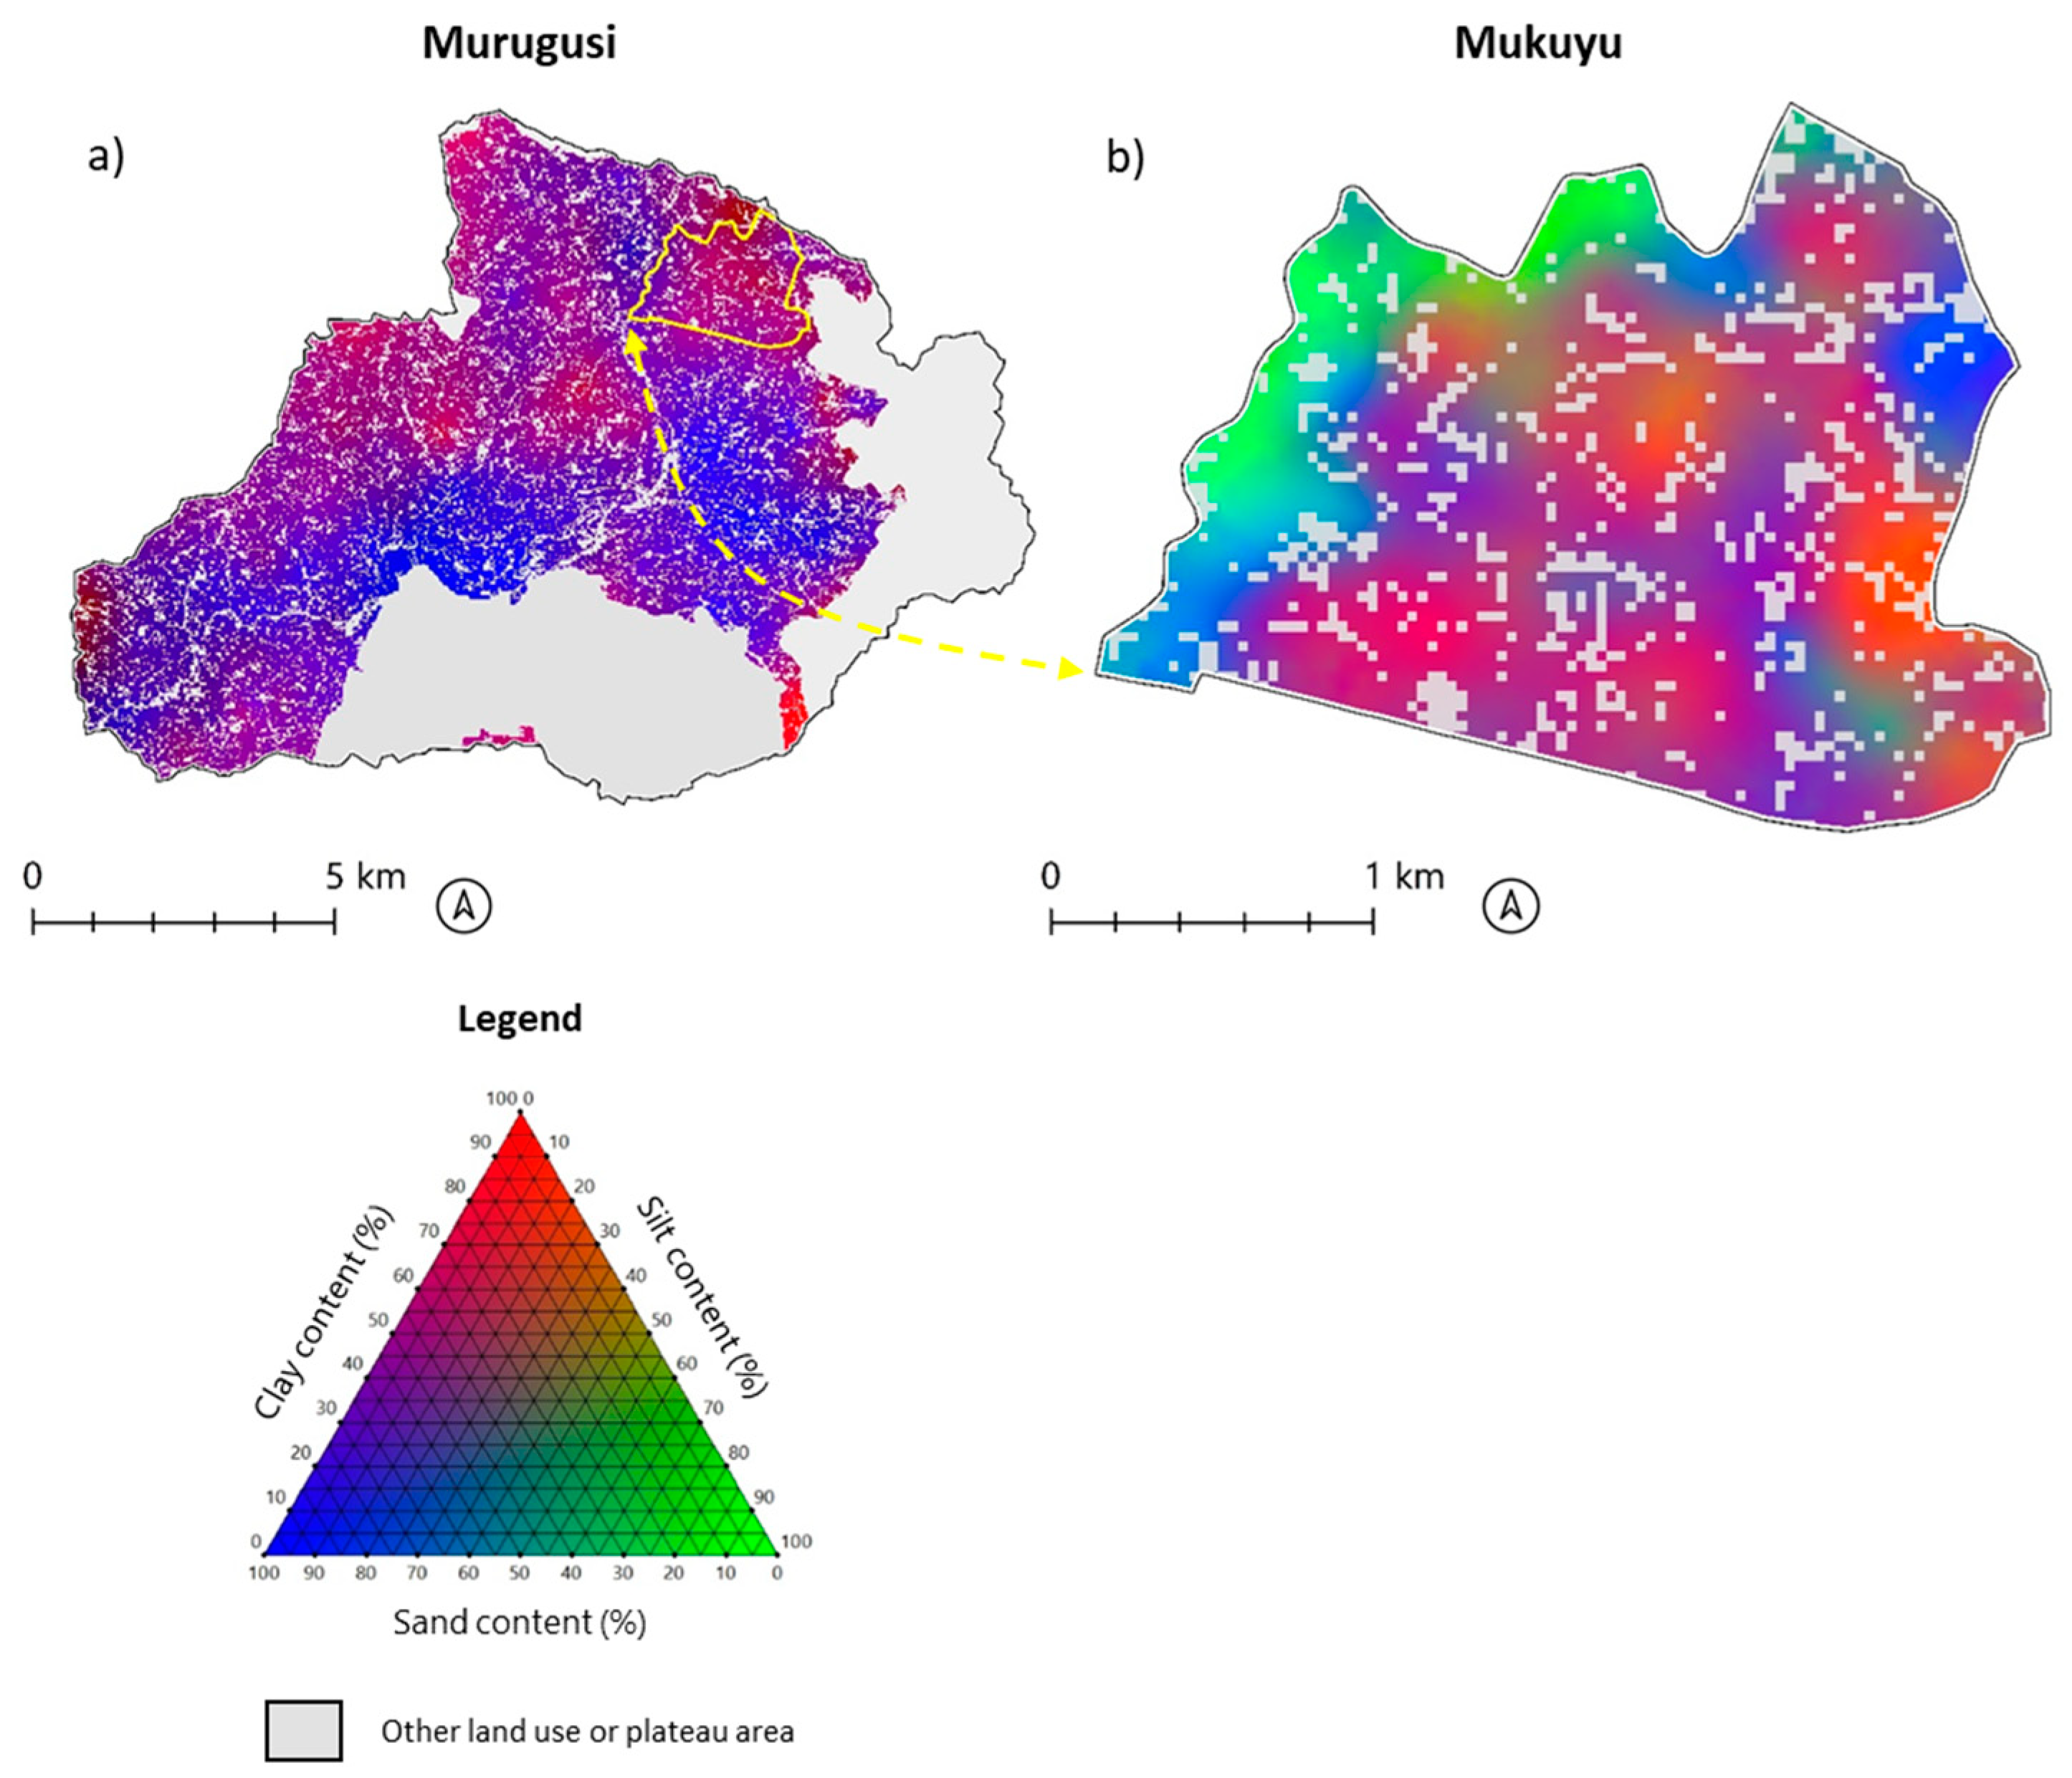
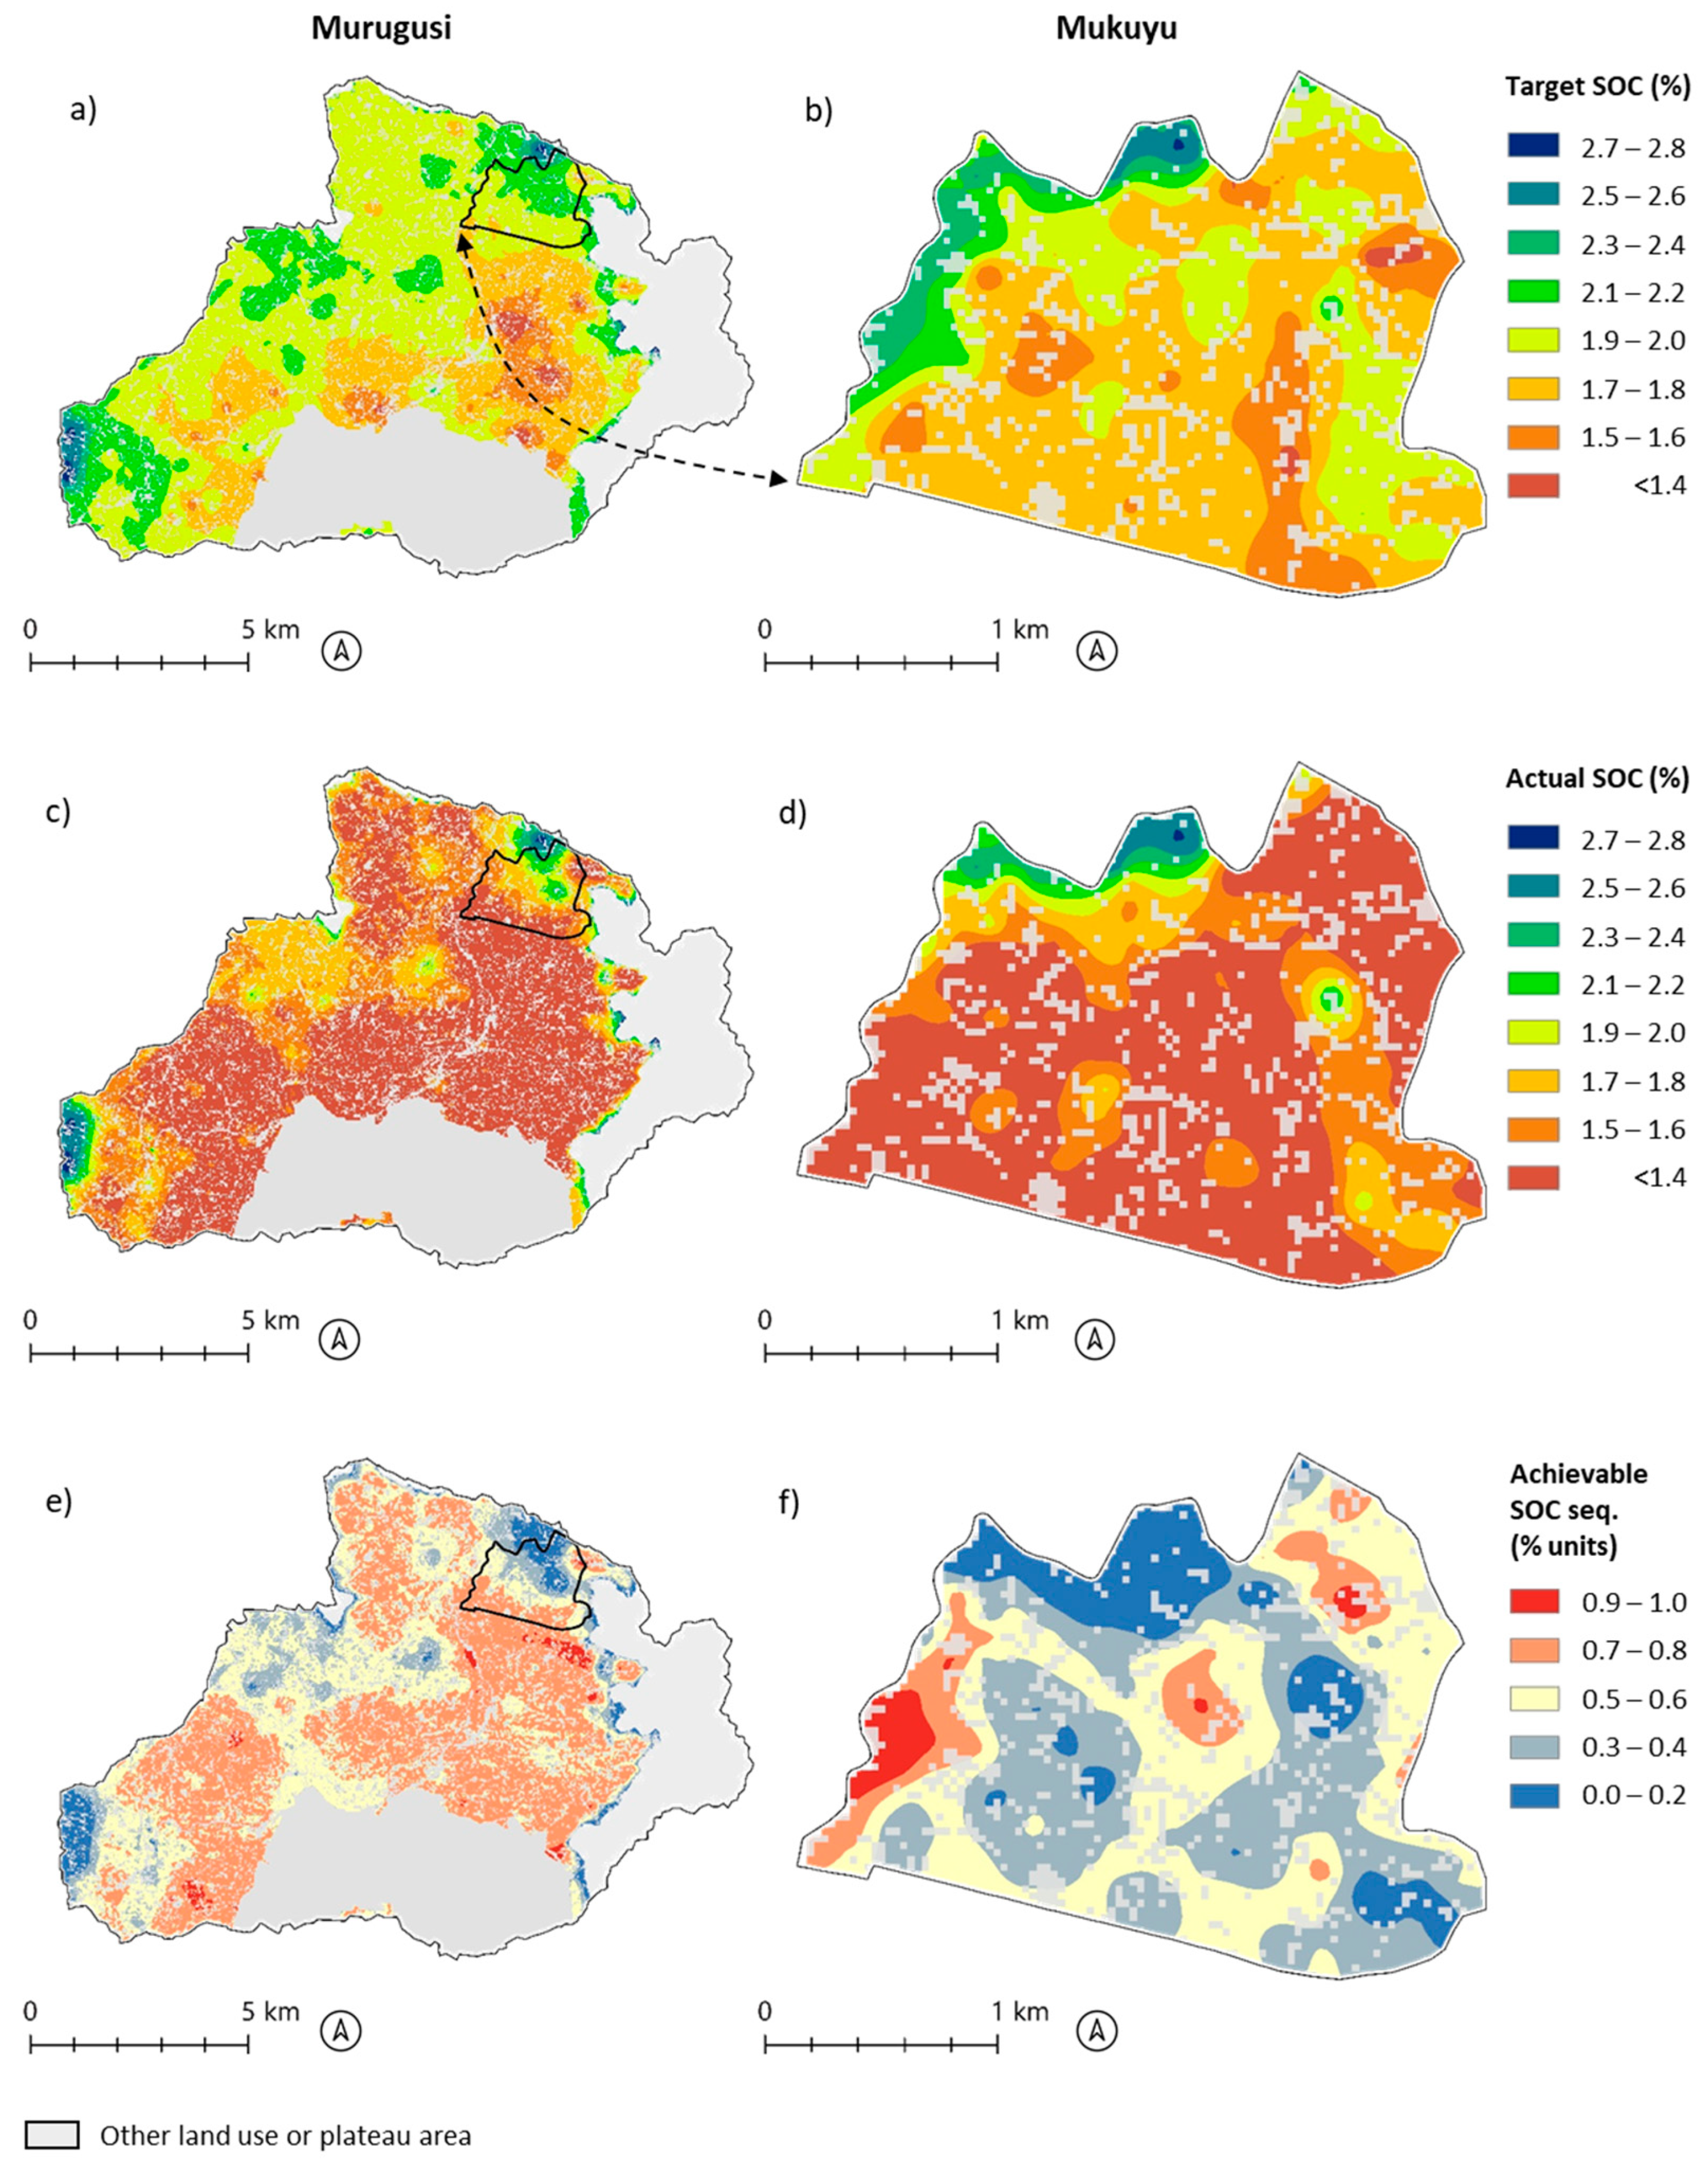
2.7. Mapping of SOC Sequestration

To apply Equation (2) and generate maps of achievable SOC sequestration in the Murugusi catchment and Mukuyu sub-area, maps of clay content, sand content, and SOC content were used. These were produced by the following methods: for Mukuyu sub-area, ordinary block kriging of the 235 soil analyses was carried out. For the Murugusi catchment, maps were produced using regression kriging (for a detailed description of the method, see [27]), with SRTM elevation as the covariate, together with data from 200 soil analyses. The map of current SOC was produced using the modeling technique multivariate adaptive regression splines (MARS) [30]. MARS is a non-parametric, piecewise linear regression technique in which several covariates are used for prediction. The following covariates were used: relative topography derived within 5 ha, 50 ha, and 500 ha neighborhoods; clay content; sand content; land use (reclassified Sentinel-2 data into four classes: water, cropland/grazing land, forest/tree cover/bushland, barren), with a 30 m × 30 m grid.
Maps of target SOC were produced through the deployment of Equation (10) on each grid cell of the clay and sand maps of Murugusi catchment and Mukuyu sub-area. Maps of achievable SOC sequestration were then estimated through map algebra according to Equation (2). The geographical extent and size of the SRTM grid were used in all maps.

2.8. Testing Relationships Between Other Soil Properties and SOC

Pearson correlation coefficients (r) were computed between each of the laboratory-analyzed soil properties and the SOC content. The null hypothesis (H0; Equation (11)) was tested, for α values of 0.05, 0.01, and 0.001. The correlation analyses were performed independently for the Murugusi and Mukuyu datasets.
H 0 : r = 0 ; H 1 : r 0

2.9. SOC Stock Estimation

A linear relationship parameterized between bulk density and SOC was used as a pedotransfer function and applied on the current SOC content and target SOC content maps of the Murugusi catchment. SOC stocks were then calculated for each cell of the SOC rasters according to Equation (12). The total SOC stock in the Murugusi area was obtained by summing the SOC stocks of all raster cells.
SOC   stock   [ tonnes ] = Soil   depth   [ m ] ×   cell   size   [ m 2 ] × BD   [ g   cm 3 ] × SOC   [ % ] 100

2.10. Software

The work was carried out using the following software: Microsoft Office (Microsoft Inc., Redmond, WA, USA), ArcGIS (ESRI Inc., Redlands, CA, USA), R [31], and Google Earth (Google, Mountain View, CA, USA).

2.11. Published Data

The soil sample dataset is available on Harvard Dataverse [32].

3. Results

3.1. Descriptive Statistics on Soil Properties

The SOC content levels were similar in the Murugusi catchment and Mukuyu sub-area (Table 1). The particle size distributions of the soils were also similar (Table 1 and Figure 2a–b). In the total dataset (Murugusi and Mukuyu), the clay content ranged from 13% to 54%, the sand content ranged from 29% to 82%, and the silt content ranged from 2% to 36%. The bulk density was only determined at the Murugusi soil sampling locations. It had an interquartile range of 1.2–1.4 g cm-3.

3.2. Boundary Plane Analyses

The coefficients of the fitted boundary planes Equation (10) are presented in Table 2, and the levels of their p-values. The shapes of the boundary planes were observed to be rather similar in the large Murugusi area and the smaller Mukuyu sub-area. All parameters significantly contributed to the models and the mean absolute errors of the target SOC values determined by leave-one-out cross-validation were 0.2% SOC in both areas.

3.3. Maps

The spatial variation in the soil particle size classes (clay, silt, and sand) is visualized in Figure 3. Both the Murugusi and the Mukuyu areas are dominated by sand and clay. The silt fraction seems to be minor in Murugusi according to the texture maps. In the more detailed maps for the Mukuyu sub-area obtained by interpolation of the 235 samples, however, an area where silt dominates was revealed close to Nzoia River, which runs along the north-eastern boundary of that area.
Maps of modeled target SOC content, current SOC content, and achievable SOC sequestration are presented in Figure 4. To some extent, the current SOC map and the target SOC map show similar spatial variation patterns, but there are also areas where they deviate, resulting in particularly high or low achievable SOC sequestration. The SOC content map shows a more detailed spatial variation pattern due to a different mapping method based on detailed covariate data (see Materials and Methods). The achievable SOC sequestration maps show that the gap between the current SOC content and the target SOC is often <1%—unit of SOC.

3.4. Relationships Between Other Soil Properties and SOC

Cation exchange capacity, which can be regarded as a general soil fertility indicator, showed a statistically significant positive correlation with the topsoil SOC content in both the Murugusi catchment and Mukuyu sub-area, as did soil pH and the plant-available content of several nutrients (K, Ca, Mg, B, Zn, and Cu; Figure 5). The content of Mn showed a statistically significant positive correlation with SOC content at the catchment scale, but not at the sub-area scale, while S was positively correlated with SOC in Mukuyu, but not in Murugusi. The levels of P and Fe were not found to be correlated with SOC in either Murugusi or Mukuyu. The correlation between bulk density and SOC content was only tested in the Murugusi dataset, where it was found to be negative and statistically significant. Scatterplots of soil property values versus SOC content are presented in Figure 5, together with values of Pearson’s r and the levels of statistical significance for rejecting r ≠ 0. These results showed that several soil properties of importance for soil fertility were correlated with SOC.

3.5. SOC Stock

The current total SOC stock in the upper 0.2 m of the cultivated soil in the Murugusi catchment was estimated to be 27 megatonnes. Under the scenario of the target SOC level being reached, the total amount of carbon would increase to 33 megatonnes, which means a sequestration potential of 6 megatonnes. These values represent the cultivated area of the Murugusi watershed, which is 70 km2, so the sequestration potential is thus 93 tonnes per km2 of cultivated land. This is approximately 0.86 tonnes of carbon (1.5 tonnes of organic matter) per hectare. There is, of course, uncertainty in these values, although it was not estimated in the present study. The assessed accuracy to the boundary plane predictions is given in Table 2.

4. Discussion

4.1. Implications of the Study

In the present study, we exemplified the boundary plane method for modeling target SOC and achievable SOC sequestration in a 125 km2 catchment and a 4 km2 sub-area of that catchment, but in principle, the method should be applicable to areas of any size. However, other factors than texture and agricultural management (e.g., temperature, precipitation, and soil mineralogy) that may affect SOC should be homogeneous within the area. When working with larger areas, it should also be borne in mind that access to agricultural inputs and socioeconomic conditions may differ within the area, which may affect the possibility to reach the target SOC.
The important point is that the target SOC maps derived by the method presented in this study should not be interpreted as the biophysical upper limit for SOC content under steady-state (if such exists). Instead, they reflect the best SOC status that has been achieved within the same area at locations with the same soil texture. It indicates that it is currently possible to reach this SOC content in cultivated soils in the area from where the data has been collected. Farmers whose soil has a SOC content below the target SOC should be able to reach the target SOC content by adopting the (SOC-wise) best farming practices currently applied in their neighboring area (principle illustrated in Figure 6). This is the “lowest hanging fruit” for increasing the organic carbon content in the soil. The rationale is that it is better to start with something simple and possible (adopting the locally best practices) and succeed, rather than aiming too high (reaching for the carbon content under biophysical SOC saturation), which may require major changes in the farming system, with socioeconomic and other consequences.

4.2. SOC and Soil Fertility

Keeping the soil functional, maintaining soil fertility, and avoiding yield reductions are important reasons for farmers to maintain or increase SOC content in their soils. Several statistically significant relationships between SOC and other soil properties of importance for soil fertility were observed, albeit no causal relationships have been proven. For example, the observed correlation between CEC with SOC: higher CEC values may be due to higher SOC values, but it may also be because soil with a greater capacity to store more SOC has a larger specific surface area (smaller particle sizes). However, in these very weathered soils (ferralsols and acrisols), it is more likely that high CEC is due to high SOC content. These soils have 1:1 clay and the clay charge is low. The theory that a larger specific surface area is increasing the CEC is more likely in soils with 2:1 clay. This is also the reason why adequate SOC levels are very important in tropical soils; the organic matter is responsible for providing negative charges for cations, such as Ca, K, and Mg, to bind to. Raising the SOC level could improve the status of several other soil properties of importance for crop production. Assuming that the observed positive relationships between CEC and SOC area causal, better soil fertility would be achieved if the SOC target of the study areas were reached.

4.3. How to Express Soil Texture?

Useful information is lost when merging clay and silt data to a common class of fine particles, as is commonly done in previously published methods to estimate SOC targets from soil texture [11,15,16]. The patterns of the moving window 95-percentiles in this study (Figure 2) revealed that the fraction of fine (clay and silt) particles (i.e., the complement to the sand fraction) might not be the optimal predictor of target SOC. The variation is better captured by using the fractions individually in the model. This is also indicated by the fact that all model parameters had significantly contributed to the models (Table 2). One way of doing this is to express them as coordinates in the two-dimensional space of the texture triangle. As the results from a texture analysis most often yield the required data, there is a good reason to make full use of this information.

4.4. Achievable SOC Sequestration in the Example Area(s)

According to Aune and Lal [33], a SOC content of 1.1% is the critical limit below which most crops in the tropics show declining yields. This value is lower than for temperate regions, where 2.0% SOC is generally considered the threshold [34]. Piikki et al. [35] identified 1.7% SOC as a lower limit in the production of common beans (Phaseolus vulgaris L.) in East Africa. The median SOC content in Murugusi (1.3% SOC) can be considered (too) low. It should be possible to sequester SOC in most of the area, or, at least, there is no obvious reason why this should not be possible. The SOC sequestration maps show areas where the gap between actual SOC and possible SOC is largest. We envisage that maps like those in Figure 4e–f can be used to identify hotspots with relatively higher achievable SOC sequestration and to target advice on how to increase the SOC content of the soil in those areas.

5. Summary

  • The concept of achievable soil SOC sequestration was developed. Achievable soil SOC sequestration is not a biophysical property of the soil but a measure of how much SOC that is realistic to sequester in an area without major changes in land use or agricultural systems.
  • A boundary plane approach to model achievable soil carbon sequestration potential was described. Ideally, the method should be applied in areas that are rather homogeneous in terms of socio-economic as well as biophysical conditions. The method was demonstrated in two areas of different sizes in western Kenya.
  • A higher SOC content was associated with a higher CEC and higher contents of several important nutrients in the soil, which indicates a possible improvement in soil fertility when the SOC content is raised to the modeled target levels.

Author Contributions

Conceptualization, K.P., M.S., R.S., M.D.S., S.M., and W.A.; Data curation, K.P. and M.S.; Formal analysis, K.P.; Funding acquisition, K.P., M.S., and R.S.; Investigation, K.P., M.S., M.D.S., and S.M.; Methodology, K.P. and M.S.; Project administration, K.P. and R.S.; Resources, K.P. and M.S.; Software, K.P. and M.S.; Validation, K.P.; Visualization, K.P. and M.S.; Writing—original draft, K.P.; Writing—review and editing, K.P., M.S., R.S., M.D.S., S.M., and W.A.

Funding

VGR/SLU (contract: RUN 2018-00141), Formas/SIDA (contract: 220-1975-2013), Formas (contract: 220-2014-00646), BMZ (contract: 81206681), and GIZ (contract: 81193729).

Acknowledgments

We are deeply thankful for the good services provided by John Mukulama, John Yumbya Mutua, Shadrack Nyawade, Rodgers Rogito, and Getrude Kavochi (soil sampling) and by Francis Mungthu Njenga (lab analyses) and Crop Nutrition Laboratory Services Ltd for their services (lab analyses). The project was carried out within the CGIAR Research Program on Water, Land, and Ecosystems (WLE).

Conflicts of Interest

The authors declare no conflict of interest. The funders had no role in the design of the study; in the collection, analyses, or interpretation of data; in the writing of the manuscript, or in the decision to publish the results.

References

  1. Ontl, T.A.; Schulte, L.A. Soil carbon storage. Nat. Educ. Knowl. 2012, 3, 35. [Google Scholar]
  2. Poeplau, C.; Don, A. Carbon sequestration in agricultural soils via cultivation of cover crops—A meta-analysis. Agrecosys. Env. 2015, 200, 33–41. [Google Scholar] [CrossRef]
  3. West, T.O.; Six, J. Considering the influence of sequestration duration and carbon saturation on estimates of soil carbon capacity. Clim. Chang. 2007, 80, 25–41. [Google Scholar] [CrossRef]
  4. Status of the World’s Soil Resources (SWSR)—Main Report; Food and Agriculture Organization of the United Nations and Intergovernmental Technical Panel on Soils: Rome, Italy, 2015. Available online: http://www.fao.org/3/a-i5199e.pdf (accessed on 8 June 2019).
  5. Lehmann, J.; Kleber, M. The contentious nature of soil organic matter. Nature 2015, 528, 60. [Google Scholar] [CrossRef] [PubMed]
  6. Schlesinger, W.H.; Bernhardt, E.S. Biogeochemistry: An analysis of global change; Academic Press: Cambridge, MA, USA, 2013; 688p. [Google Scholar]
  7. Paustian, K.; Lehmann, J.; Ogle, S.; Reay, D.; Robertson, G.P.; Smith, P. Climate-smart soils. Nature 2016, 532, 49. [Google Scholar] [CrossRef] [PubMed]
  8. Smith, P. Soil carbon sequestration and biochar as negative emission technologies. Glob. Chang. Biol. 2016, 22, 1315–1324. [Google Scholar] [CrossRef] [PubMed]
  9. Zomer, R.J.; Bossio, D.A.; Sommer, R.; Verchot, L.V. Global sequestration potential of increased organic carbon in cropland soils. Sci. Rep. 2017, 7, 15554. [Google Scholar] [CrossRef] [PubMed]
  10. Castellano, M.J.; Mueller, K.E.; Olk, D.C.; Sawyer, J.E.; Six, J. Integrating plant litter quality, soil organic matter stabilization, and the carbon saturation concept. Glob. Chang. Biol. 2015, 21, 3200–3209. [Google Scholar] [CrossRef]
  11. Feng, W.; Plante, A.F.; Six, J. Improving estimates of maximal organic carbon stabilization by fine soil particles. Biogeochemistry 2013, 112, 81–93. [Google Scholar] [CrossRef]
  12. Gulde, S.; Chung, H.; Amelung, W.; Chang, C.; Six, J. Soil carbon saturation controls labile and stable carbon pool dynamics. Soil Sci Soc Am. J. 2008, 72, 605–612. [Google Scholar] [CrossRef]
  13. Beare, M.H.; McNeill, S.J.; Curtin, D.; Parfitt, R.L.; Jones, H.S.; Dodd, M.B.; Sharp, J. Estimating the organic carbon stabilisation capacity and saturation deficit of soils: A New Zealand case study. Biogeochemistry 2014, 120, 71–87. [Google Scholar] [CrossRef]
  14. McNally, S.R.; Beare, M.H.; Curtin, D.; Meenken, E.D.; Kelliher, F.M.; Calvelo Pereira, R.; Shen, Q.; Baldock, J. Soil carbon sequestration potential of permanent pasture and continuous cropping soils in New Zealand. Glob. Chang. Biol. 2017, 23, 4544–4555. [Google Scholar] [CrossRef] [PubMed]
  15. Hassink, J. The capacity of soils to preserve organic C and N by their association with clay and silt particles. Plant. Soil 1997, 191, 77–87. [Google Scholar] [CrossRef]
  16. Webb, R.A. Use of the boundary line in the analysis of biological data. J. Hortic. Sci. 1972, 47, 309–319. [Google Scholar] [CrossRef]
  17. Davis, R.O.E.; Bennett, H.H. Grouping of soils on the basis of mechanical analysis. USA: U.S. Dept. of Agriculture 1927. Available online: https://naldc-legacy.nal.usda.gov/naldc/download.xhtml?id=CAT87217164&content=PDF (accessed on 8 June 2019).
  18. Akpa, S.I.; Odeh, I.O.; Bishop, T.F.; Hartemink, A.E.; Amapu, I.Y. Total soil organic carbon and carbon sequestration potential in Nigeria. Geoderma 2016, 271, 202–215. [Google Scholar] [CrossRef]
  19. Chambers, A.; Lal, R.; Paustian, K. Soil carbon sequestration potential of US croplands and grasslands: Implementing the 4 per Thousand Initiative. J. Soil Water Conserv. 2016, 71, 68A–74A. [Google Scholar] [CrossRef] [Green Version]
  20. Lugato, E.; Bampa, F.; Panagos, P.; Montanarella, L.; Jones, A. Potential carbon sequestration of European arable soils estimated by modelling a comprehensive set of management practices. Glob. Change Biol. 2014, 20, 3557–3567. [Google Scholar] [CrossRef] [Green Version]
  21. Minasny, B.; Malone, B.P.; McBratney, A.B.; Angers, D.A.; Arrouays, D.; Chambers, A.; Chaplot, V.; Chen, Z.-S.; Cheng, K.; Das, B.S.; et al. Soil carbon 4 per mille. Geoderma 2017, 292, 59–86. [Google Scholar] [CrossRef]
  22. Wiesmeier, M.; Hübner, R.; Spörlein, P.; Geuß, U.; Hangen, E.; Reischl, A.; Schilling, B.; von Lützow, M.; Kögel-Knabner, I. Carbon sequestration potential of soils in southeast Germany derived from stable soil organic carbon saturation. Glob. Change Biol. 2014, 20, 653–665. [Google Scholar] [CrossRef]
  23. IUSS Working Group WRB. World Reference Base for Soil Resources 2014. International Soil Classification System for Naming Soils and Creating Legends for Soil Maps; World Soil Resources Reports, 106; FAO: Rome, Italy, 2014; 203p, Available online: http://www.fao.org/3/i3794en/I3794en.pdf (accessed on 8 June 2019).
  24. Wandere, D.O.; Egesah, O.B. Comparative ecological perspectives on food security by Abanyole of Kenya. Int. J. Ecol. Ecosolution. 2015, 2, 22–30. [Google Scholar]
  25. Mavuthu, A.K. Effect of the National Accelerated Agricultural Inputs Access Subsidy Program on Fertilizer Usage and Food Production in Kakamega County, Western Kenya. Ph.D. Thesis, Walden University, Minneapolis, MN, USA, May 2017. Available online: https://scholarworks.waldenu.edu/cgi/viewcontent.cgi?article=4906&context=dissertations (accessed on 8 June 2019).
  26. Ndwiga, J.; Pittchar, J.; Musyoka, P.; Nyagol, D.; Marechera, G.; Omanya, G.; Oluoch, M. Constraints and Opportunities of Maize Production in Western Kenya: A Baseline Assessment of Striga Extent, Severity, and Control Technologies; International Institute of Tropical Agriculture (IITA): Ibadan, Nigeria, 2013. [Google Scholar]
  27. Odeh, I.O.A.; McBratney, A.B.; Chittleborough, D.J. Further results on prediction of soil properties from terrain attributes: Heterotopic cokriging and regression-kriging. Geoderma 1995, 67, 215–226. [Google Scholar] [CrossRef]
  28. Estefan, G.; Sommer, R.; Ryan, J. Analytical Methods for Soil-Plant. and Water in Dry Areas. A Manual of Relevance to the West. Asia and North. Africa Region, 3rd ed.; International Center for Agricultural Research in the Dry Areas: Aleppo, Syria, 2013; 255p, Available online: http://repo.mel.cgiar.org:8080/handle/20.500.11766/7512?show=full (accessed on 8 June 2019).
  29. Mehlich, A. Mehlich 3 soil test extractant: A modification of Mehlich 2 extractant. Commun. Soil Sci. 1984, 15, 1409–1416. [Google Scholar] [CrossRef]
  30. Hastie, T.; Tibshirani, R.; Friedman, J. The Elements of Statistical Learning; Springer: New York, NY, USA, 2009; p. 745. Available online: https://web.stanford.edu/~hastie/Papers/ESLII.pdf (accessed on 8 June 2019).
  31. R Core Team. R: A language and environment for statistical computing. R Foundation for Statistical Computing; R Foundation for Statistical Computing: Vienna, Austria, 2018; Available online: https://www.R-project.org/ (accessed on 8 June 2019).
  32. Piikki, K.; Söderström, M.; Sommer, R.; Da Silva, M. Physical topsoil properties in Murugusi, Western Kenya; Harvard University: Cambridge, MA, USA, 2019. [Google Scholar] [CrossRef]
  33. Aune, J.B.; Lal, R. Agricultural productivity in the tropics and critical limits of properties of Oxisols, Ultisols and Alfisols. Trop. Agr. 1997, 74, 96–103. [Google Scholar]
  34. Loveland, P.; Webb, J. Is there a critical level of organic matter in the agricultural soils of temperate regions: A review? Soil Tillage Res. 2003, 70, 1–18. [Google Scholar] [CrossRef]
  35. Piikki, K.; Winowiecki, L.; Vågen, T.G.; Ramirez-Villegas, J.; Söderström, M. Improvement of spatial modelling of crop suitability using a new digital soil map of Tanzania. South Afr. J. Plant. Soil 2017, 34, 243–254. [Google Scholar] [CrossRef]
Figure 1. Areas in Kakamega and Bungoma counties in Western Kenya for which the boundary plane method was developed and tested (Murugusi catchment and Mukuyu sub-area). Please note that the slight discrepancies in color between the legend and the map is due to transparency in the visualization. Map by M. Söderström, digital data sources: Shuttle Radar Topography Mission (SRTM 1 Arc-Second Global elevation data) (National Aeronautics and Space Administration; NASA, Washington, DC, USA); S2 prototype LC 20 m map of Africa 2016 (Climate Change Initiative (CCI) Land Cover (LC), European Space Agency; ESA, Paris, France).
Sustainability 11 04038 g001
Figure 2. (ab) Texture of the soil samples (circular symbols: blue = Murugusi, green = Mukuyu), (cd) moving window 95-percentiles of SOC (soil organic carbon) content, and (ef) boundary planes. The left-hand diagrams (a,c,e) show results for the Murugusi catchment, and the right-hand diagrams (b,d,f) show results for the Mukuyu sub-area. All results are plotted on top of the USDA-FAO soil texture classes. USDA—United States Department of Agriculture; FAO—Food and Agriculture Organization of the United Nations.
Sustainability 11 04038 g002
Figure 3. Soil texture maps for (a) Murugusi catchment and (b) Mukuyu sub-area.
Sustainability 11 04038 g003
Figure 4. Map of (ab) target soil organic carbon (SOC) content, (cd) actual SOC content, and (ef) achievable SOC sequestration. The left-hand maps (a,c,e) show results for the Murugusi catchment, and the right-hand maps (b,d,f) show results for the Mukuyu sub-area. One % unit of SOC equals 10 mg kg−1.
Sustainability 11 04038 g004
Figure 5. Correlation analyses. The left three columns of scatterplots show data from the Murugusi area (n = 102), and the right three columns set of scatterplots show data from the Mukuyu area (n = 235). n = number of observations; P = phosphorous; K = Potassium; Ca = calcium; Mg = magnesium; Mn = Manganese; S = sulfur; Cu = cupper, B = boron, Zn = zinc; CEC = cation exchange capacity; BD = bulk density; r = Pearson correlation coefficients, ns = p ≥0.05, * = p <0.05, ** = p <0.01, *** = p <0.001.
Sustainability 11 04038 g005
Figure 6. Schematic description of the rationale for the study.
Sustainability 11 04038 g006
Table 1. Descriptive statistics on topsoil properties (0–0.2 m depth) at the point locations for soil sampling. Q = quartile, SOC = soil organic carbon, n= number of samples; BD = bulk density; P = phosphorous; K = Potassium; Ca = calcium; Mg = magnesium; Mn = Manganese; S = sulfur; Cu = copper, B = boron, Zn = zinc; CEC = cation exchange capacity; - = not determined.
Soil PropertyMurugusi (n = 102)Mukuyu (n = 235)
MinQ1Q2Q3MaxMinQ1Q2Q3Max
SOC (%)0.81.11.31.63.70.61.21.31.53.0
Clay (%)13252934471430353954
Sand (%)29556067822952566282
Silt (%)461013362681032
pH4.65.25.55.97.64.45.25.45.88.2
P (ppm)3.710.614.925.661.91.58.613.223.2130.0
K (ppm)218512221579420831191681150
Ca (ppm)1194867311158360015054876711256040
Mg (ppm)34821191626622391118172582
S (ppm)0.39.111.413.743.80.57.69.812.624.5
Fe (ppm)579511413650060127144205572
B (ppm)0.00.10.10.21.00.00.10.20.32.5
Mn (ppm)5517311329865172101291
Zn (ppm)0.10.71.21.912.30.51.32.03.030.6
Cu (ppm)0.71.21.51.810.20.91.72.02.512.2
CEC (cmolc kg−1)2.86.58.410.431.02.17.08.410.936.8
BD (g cm−3)0.91.21.31.41.5-----
Table 2. Parameters and fitting statistics on the boundary planes (i.e., models for target SOC (soil organic carbon) content). i–k = coefficients of Equation (10); MAE = mean absolute error determined by leave-one-out cross validation; *** = p-value of coefficient <0.001.
AreaijkMAE (% SOC)
Murugusi3 ***−30 ***11 ***0.2
Mukuyu3 ***−37 ***16 ***0.2

