Next Article in Journal
Engaging Stakeholders in Urban Traffic Restriction Policy Assessment Using System Dynamics: The Case Study of Xi’an City, China
Next Article in Special Issue
Changes of Microbial Diversity in Rhizosphere Soils of New Quality Varieties of Winter Wheat Cultivation in Organic Farming
Previous Article in Journal
China’s Provincial Vehicle Ownership Forecast and Analysis of the Causes Influencing the Trend
Previous Article in Special Issue
Variation of Microbial Communities in Aquatic Sediments under Long-Term Exposure to Decabromodiphenyl Ether and UVA Irradiation
 
 
Erratum published on 29 October 2019, see Sustainability 2019, 11(21), 6020.
Article

Analysis of Soil Properties, Bacterial Community Composition, and Metabolic Diversity in Fluvisols of a Floodplain Area

by
Karolina Furtak
1,*,
Jarosław Grządziel
1,
Anna Gałązka
1 and
Jacek Niedźwiecki
2
1
Department of Agricultural Microbiology, Institute of Soil Science and Plant Cultivation—State Research Institute, Czartoryskich 8, 24-100 Puławy, Poland
2
Department of Soil Science Erosion and Land Protection, Institute of Soil Science and Plant Cultivation—State Research Institute, Czartoryskich 8, 24-100 Puławy, Poland
*
Author to whom correspondence should be addressed.
Sustainability 2019, 11(14), 3929; https://doi.org/10.3390/su11143929
Submission received: 29 May 2019 / Revised: 16 July 2019 / Accepted: 17 July 2019 / Published: 19 July 2019

Abstract

:
The quality of a soil environment affects the microbial community that inhabits it. We decided to examine whether soils formed from river sediments, located in an area of high biodiversity of organisms, are fertile and microbiologically diverse. Fluvisols are considered to be one of the most fertile soils. In this research, bacterial and metabolic diversity, as well as physico–chemical parameters, in three Fluvisols from the Vistula River Gorge of Lesser Poland was investigated. The analysis of physico–chemical and biological parameters demonstrated statistically significant differences between the three Fluvisols examined. While determining the metabolic potential of soil microbiomes with the use of the EcoPlate™ Biolog® technique, we also noted variation between the Fluvisols; however, they were arranged in a significantly different manner from other properties. The next generation sequencing method enabled us to determine the microorganisms common to three Fluvisols, and we identified bacteria specific to individual soils. These results corresponded with the data obtained through EcoPlate™, indicating that the structural diversity and metabolic potential of the microbiome does not always depend on soil quality parameters. Meanwhile, the increased structural diversity of the microbiome was found to improve the metabolic potential of soil microorganisms.

1. Introduction

Soil is a complex and dynamic ecosystem whose functionality is related to the links that exist between chemical, physical, and biological parameters and resident microbial communities. Soil quality can be defined as the balance between high activity and high microbiological biodiversity [1]. The management of soil quality plays an important role in protecting the environment, through preserving biodiversity and good agricultural practices [2]. Many different microorganisms live in this environment, including bacteria, archaea, fungi and yeasts, and protozoa and microalgae. Soil microorganisms play a central role in decomposing organic matter, determining the release of mineral nutrients and in nutrient cycling, and have direct and indirect effects on both crop growth and quality [3,4,5]. The structural composition of the soil microbiome can be studied in detail using next generation sequencing (NGS) [6] and its metabolic potential via the EcoPlate™ method (Biolog® system) [7].
In addition to the composition and activity of soil microbiomes, the quality of the soil is also defined by its physical, chemical, and biochemical parameters [8]. Among the parameters used to assess the quality of soil, one can distinguish pore size distribution (PSD), organic matter content, pH value, the total content of carbon and nitrogen, microbial biomass carbon and nitrogen contents, enzymatic activity, and glomalin contents [9].
The microbiological diversity of soil influences its functioning and stability [5]. At the same time, the physical and chemical parameters of the soil influence the microbial community and its activity. It is considered that a certain minimum number of species is necessary for the functioning of ecosystems, although the relationship between microbiological diversity and the functioning of the soil system is not well known. A total of 80–90% of soil processes are reactions in which microorganisms mediate [5,6]. It can be concluded that soil quality is the result of interactions between physical, chemical, and biological properties [1]. A comprehensive assessment of the chemical, physical, and biological properties of soils is important for explaining the relationship between basic soil processes and in monitoring changes in the soil environment [10]. The Vistula River Gorge of Lesser Poland, which covers about 80 km from Zawichost to Puławy, is one of the most exquisite fragments of the Vistula valley [11]. It is protected by two Natura 2000 areas: PLB 140006 (from Józefów to Kazimierz Dolny) and PLH 060045 (from the mouth of the Sanny River, near Annopol, to Puławy). This area is characterised by considerable biodiversity. Indeed, there are numerous species of water and mud birds, fish, and plants of European rank. The valley of the central Vistula River is a rich grouping of flora and fauna [12,13]. Understanding the biodiversity of this area, including on a micro scale, may expose other untypical species present in the area and their specific properties. The river valleys are characterised by the occurrence of fertile soils, or Fluvisols. These soils are rich in organic matter and plant nutrients [14]. The most extensive area of Fluvisols in Poland occurs along the Vistula River [15]. These Fluvisols play an important agricultural role and are actively used by farmers [16]. The agricultural area covers approximately 34% of the area of Fluvisols in the Vistula River Gorge of Lesser Poland.
We have therefore decided to investigate what is influencing the fertility of Fluvisols. The aim of this research was to determine the interaction between the physico–chemical parameters of soil which is considered fertile with the activity and composition of its microbiome. For this purpose, we determined the characteristic soil properties and structural biodiversity of soil bacteria, as well as metabolic activity, in three different Fluvisols of the floodplain area from the Vistula River Gorge of Lesser Poland. We assumed that the differences between the soils located in the same floodplain area of the Vistula River, undergoing the same treatments and weather conditions, would not be significant. Additionally, we assumed that selected soils, formed from river sediments and located in an area of high natural importance, would be characterised by high activity and microbiological diversity, as well as other parameters of soil quality being high, which would indicate their fertility.

2. Materials and Methods

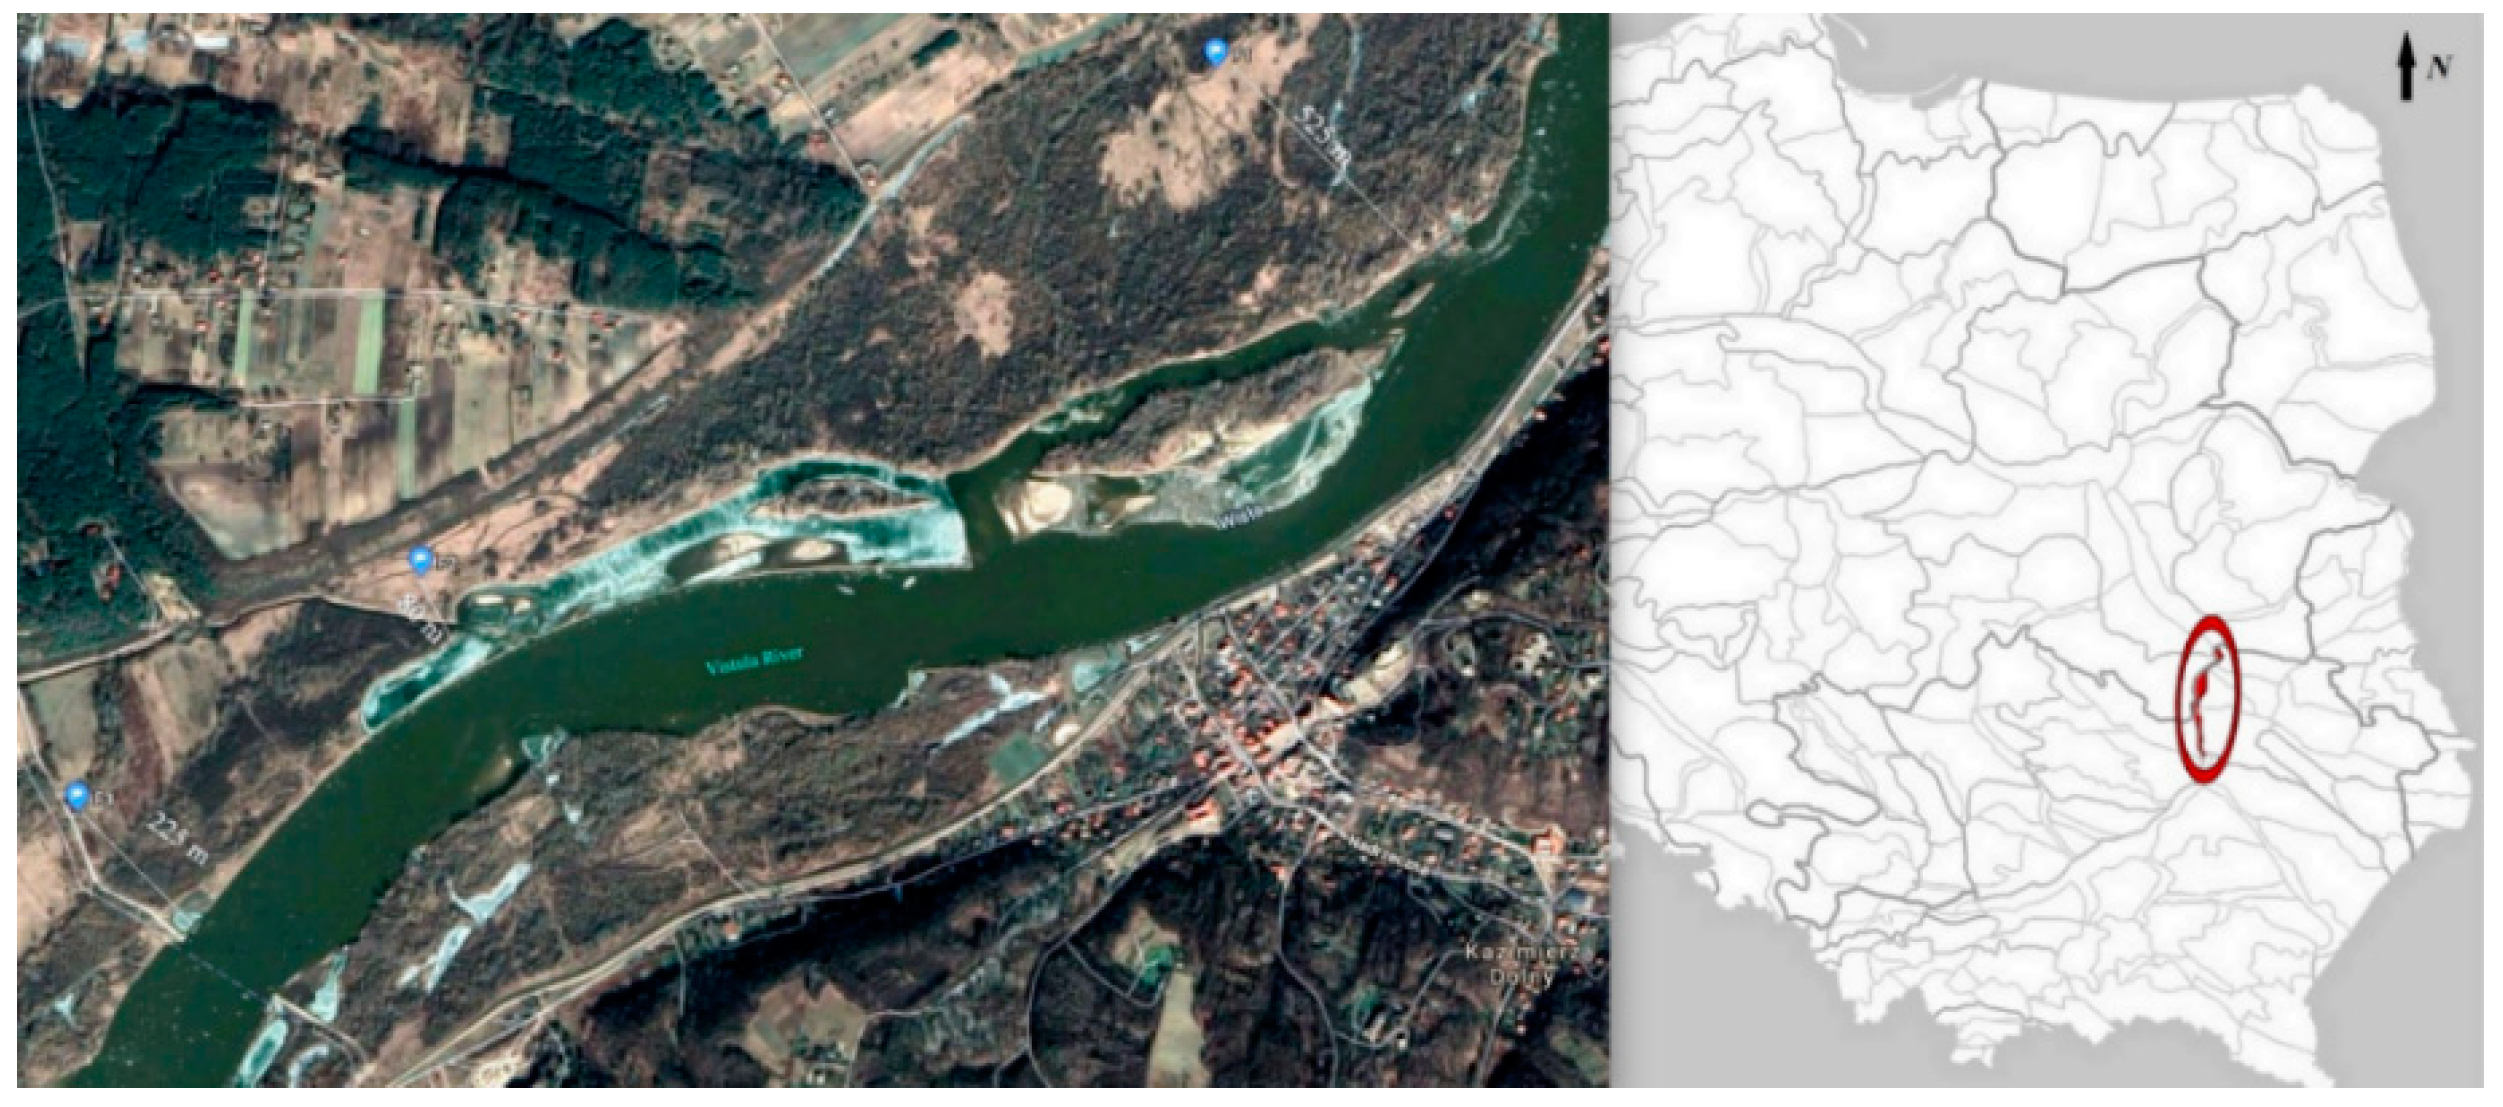
2.1. Site Information

The study was conducted in eastern Poland, in the Lubelskie Voivodeship (Figure 1). Three different Fluvisols were taken from the Vistula floodplains of the Vistula River Gorge, Lesser Poland. Soil sampling abbreviations and locations are shown in Table 1.
The selected locations were grassland, not used for agricultural purposes, and located between the Vistula riverbed and the flood embankment, which are natural floodplains of the Vistula River. The climate in the area is classified as a warm-summer humid continental climate (Dfb, according to the Köppen climate classification). The mean annual temperature is 7.7 °C in Wojszyn and 7.9 °C in Janowiec. The mean annual precipitation is 537 mm in Wojszyn and 527 mm in Janowiec [17].
Fluvisols were selected on the basis of a soil and agricultural map on the scale of 1:25,000. The soil and agricultural map provided us with preliminary information on the particle size distribution of these soils, which allowed us to select suitable locations for the collection of soil samples. We chose soils that are widely recognised as fertile, located in close proximity, under the same climatic conditions, and without human activity.

2.2. Sample Collection

Soil samples were collected in August 2018 from 0–20 cm depth from 15 representative spots (from an area of approximately 0.04 ha) per Fluvisol. Soil samples were pooled (~1 kg), sieved through a 2 mm sieve, and quickly stored at 4 °C until analysis of the soil biological properties and metabolic potential of the microbial community, and in −20 °C until DNA extraction.

2.3. Analysis of Soil Physico–Chemical Properties

The soil particle size distribution (PSD, %) was measured via the laser diffraction method, using a Mastersizer 2000 analyser [18]. The soil pH in KCl was measured potentiometrically (1:2.5 mV) in a suspension of soil within a 1 mol dm−3 KCl solution. The soil stability was measured in terms of readily dispersible clay (RDC, g 100 g−1 of soil) using a Hach 2100 AN ratio turbidimeter [19]. The total carbon (TC) and nitrogen (TN) contents (%) in the soil were determined using a Vario Macro Cube CN analyser [20]. The organic carbon (OC) and organic matter (OM) concentrations (%) in the soil were measured using the Tiurin modified method [21]. The content of selected heavy metals (g kg−1 of soil) in the soil were assessed using microwave digestion (CEM MARS Xpress) with a mixture (1:3 v v−1) of ultrapure HCl and HNO3. Next, the contents of metals were determined using the inductively coupled plasma mass spectrometer (ICP-MS) Agilent 7500ce.

2.4. Analysis of Soil Biological Properties

Enzymatic activities were determined spectrophotometrically in triplicate. The activity of soil dehydrogenases (DHa, µg TPF g−1 d.m. of soil 24 h−1) was determined using Casida et al.’s [22] method, with TTC (2,3,5—triphenyl-tetrazolium chloride) as a substrate. The measurement of alkaline (AlP) and acid (AcP) phosphatase activities (µg PNP g−1 d.m. of soil 1 h−1) was performed with ρ-nitrophenyl phosphate (ρ-NPP) as a substrate, according to Tabatabai [23]. Microbial biomass carbon (MBC) and microbial biomass nitrogen (MBN) contents (µgC/N g−1 d.m. of soil) in the soil were measured via the chloroform fumigation–extraction method [24].

2.5. Physiological Profiling of Microbial Communities—Biolog EcoPlate™

The metabolic potential of the soil microbial community was determined using the Biolog EcoPlate™ (Biolog Inc., Hayward, CA, USA). One gram of fresh soil sample was suspended in 99 mL of sterile water, shaken for 20 minutes, and incubated at 4 °C for 30 minutes [25]. Next, the soil suspension was applied to each well of the microplates in a volume of 120 µl and incubated at 25 °C for 120 h. The intensity of colour development was determined spectrophotometrically at λ = 590 nm [26] for a period of 120 h at 24 h intervals, using a MicroStation ID system (Biolog Inc., Hayward, CA, USA). The most intensive metabolic activity was observed after 120 h of incubation, and the results obtained at this time are presented here. The classification of substrates into five biochemical groups was made according to Weber and Legge [25].

2.6. Soil DNA Extraction and Next Generation Sequencing (Miseq, Illumina)

Total DNA was extracted from each soil sample with the FastDNA™ SPIN Kit for Soil (MP Biomedical), according to the manufacturer’s instructions. The concentration of DNA was measured by a NanoDrop 1000 Spectrophotometer (Thermo Scientific) and diluted in sterile water to 10 ng µl−1.
Next generation sequencing was performed in Genomed S.A. (Warsaw, Poland). The hypervariable V3–V4 region of the 16S rRNA gene was sequenced using 341F and 785R primers [27]. Library preparation was made with Q5 Hotstart HF DNA Polymerase (NebNext), according to the manufacturer’s instructions. Sequences shorter than 250 bp and containing more than 50 degenerated bases were filtered out. Subsequently, the reads were demultiplexed.
Amplicon sequence variants (ASVs) were resolved using the DADA2 version 1.8 package [28] in R version 3.5.1 [29]. Based on the sequences’ quality plots, forward and reverse reads were trimmed to 250 bp and primer sequences were removed from all reads. The filtering parameters were as follows: maxN = 0, maxEE = 2, truncQ = 2. Other parameters were set to default. The error rates were estimated by learnErrors using one million reads. Sequences were dereplicated using derepFastq with default parameters, and exact sequence variants were resolved using dada. Next, removeBimeraDenovo was used to remove chimeric sequences.
Taxonomy was assigned against the latest version of the RDP database (11 version) using the Naïve Bayesian Classifier [30] with the minboot parameter set to 80. The resulting taxonomy and reads-count tables constructed in DADA2 were appropriately converted and imported into the phyloseq (1.22.3) package [31]. Sequences belonging to the chloroplast or mitochondrial DNA were removed.

2.7. Statistical Analysis

Statistical analyses were performed using Statistica ver. 10.0 (StatSoft. Inc., Tulsa, OK, USA). Significant differences were calculated according to post hoc Tukey’s HSD (Tukey’s honest significant difference) test with a significance level of p < 0.05. Heat maps were developed using data from the average absorbance values after 120 h incubation of Biolog EcoPlate™. On the basis of the data obtained at 120 h, the average well colour development (AWCD), richness, Shannon diversity (H’), and evenness (E) indexes were calculated, as given in Table 2. The results were submitted to principal component analysis (PCA) in order to determine the common relationships between parameters.

3. Results

3.1. Soil Physico–Chemical Properties

The examined soils were classified on the granulometric composition basis as sandy loam—F1 and F2, and sand—F3 (Table 3). The content of total and organic carbon, total nitrogen, and organic matter was highest in F1 and lowest in F3. The soil pH of the three Fluvisols was neutral. The content of RDC was not determined in F3 because the content (%) of colloidal clay (soil texture < 0.002 mm) in the sample was 0.00 (Table 3). Nevertheless, according to the classification proposed by Czyż et. al. [19] the following susceptibility class for soil destruction was found in the other Fluvisols: F1—very poorly susceptible, and F2—susceptible soil. It can be noted that the TC, OC, TN, and OM contents in the soils examined were arranged in the following sequence: F1 > F2 > F3.
The total content of some metals in the soil samples was determined. A high content of aluminium and iron was recorded in F1 and F2 (Table 4).
The content of metals in individual soils followed the same trend as in the case of carbon and nitrogen content—in F1, the highest values of individual metals were recorded in comparison with other soils, and the lowest values in F3.

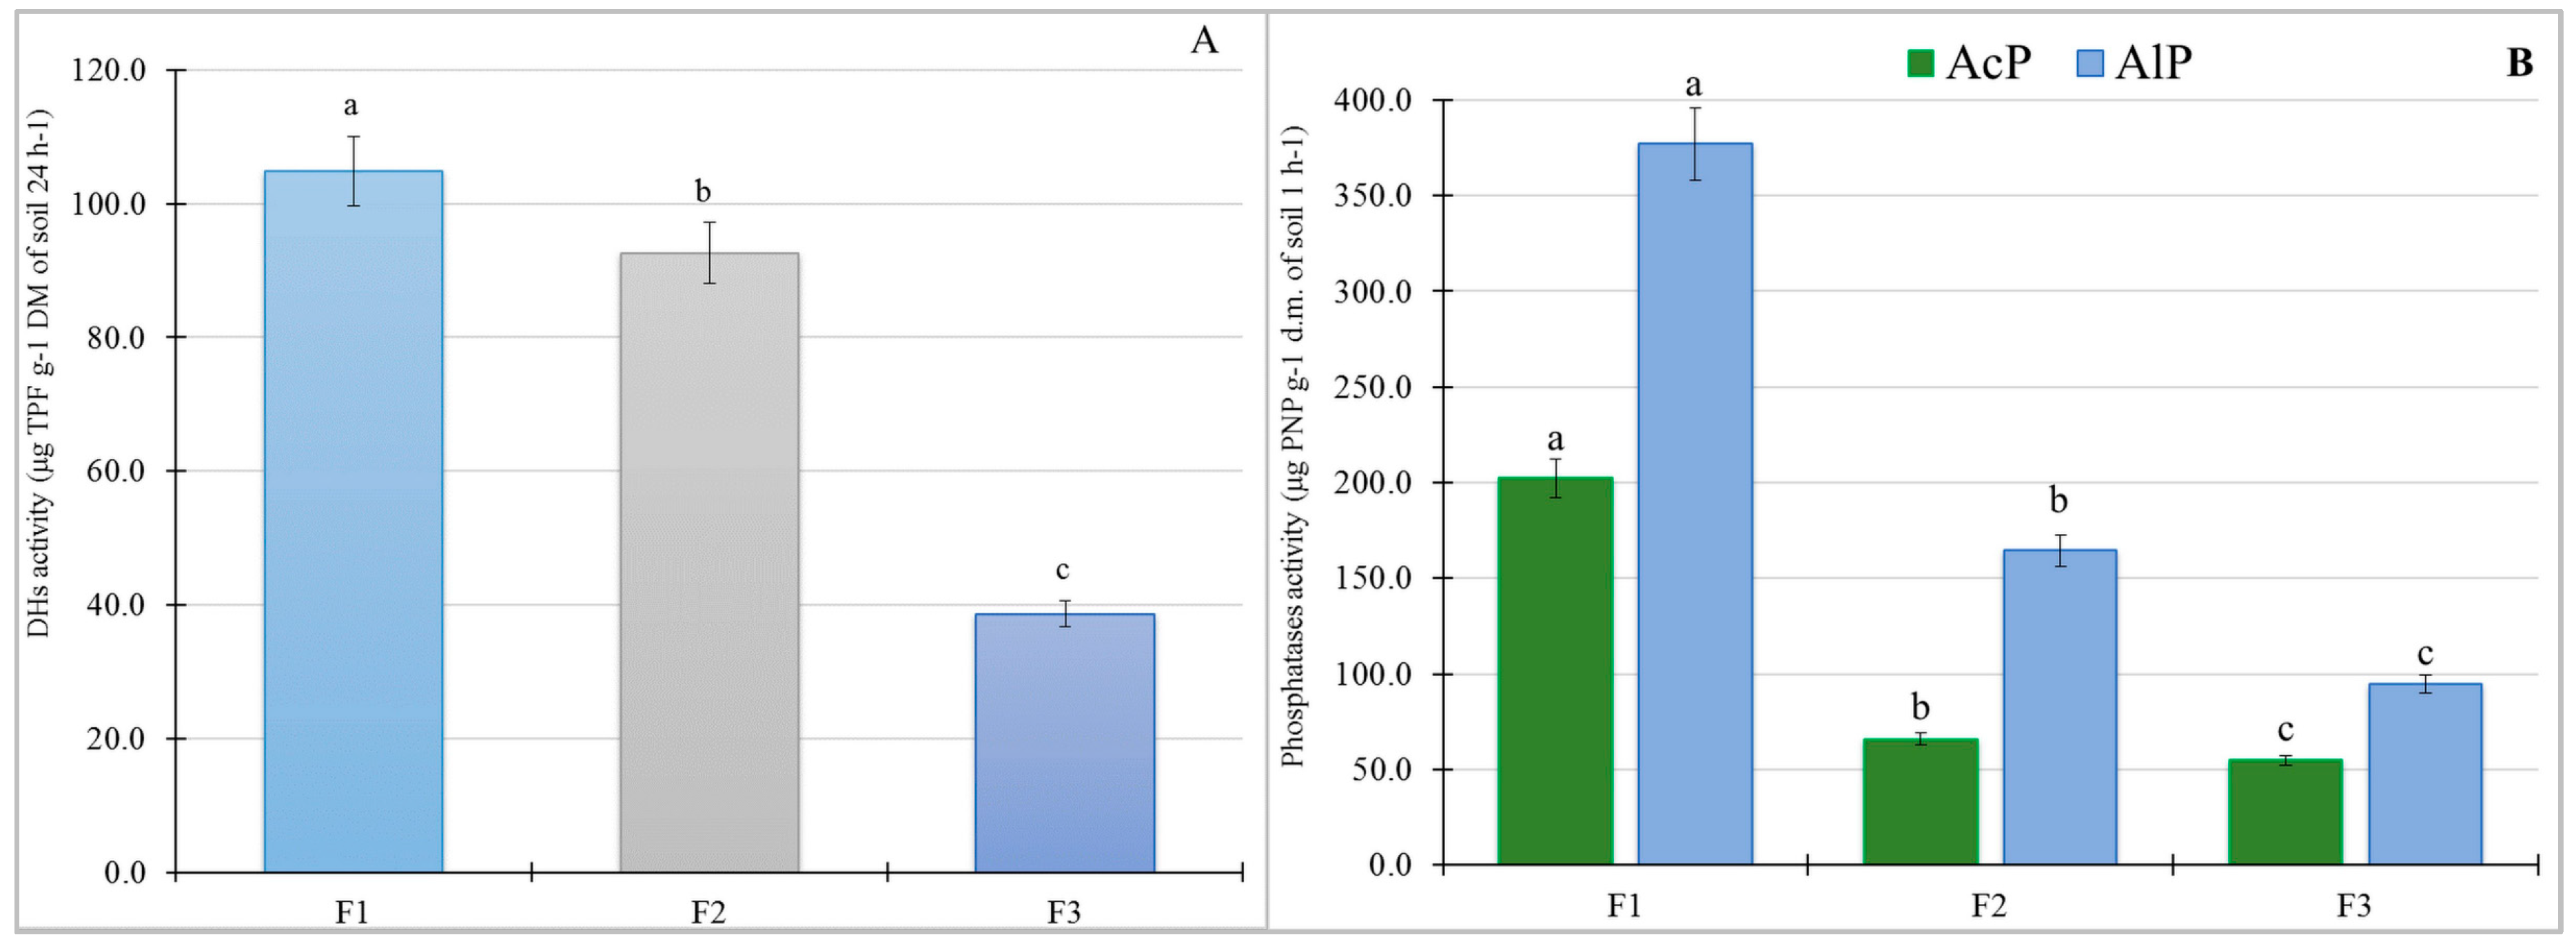
3.2. Soil Biological Properties

Enzymatic activity is a sensitive parameter influenced by a number of natural and anthropogenic factors [8,37]. The enzymatic activity of the Fluvisols examined is presented in Figure 2. The activity of dehydrogenases (DHa) was significantly (p < 0.05) higher in F1 (by 11.6%) than in F2, and 63.2% higher than in F3 (Figure 2A). The DHa obtained in our studies differed significantly between the soils studied.
The activity of acid phosphatase (AcP) was higher in F1 than F2 and F3, by 67.4% and 72.9%, respectively (Figure 2B). Similar differences were noted in alkaline phosphatase (AlP) activity, which was 56.4% and 74.9% higher in F1 than in F2 and F3, respectively. These results were significantly statistically different.
The levels of MBC and MBN were higher in F1 than in other soils (Table 5). The smallest MBC and MBN contents were observed in F3. The obtained values differed statistically significantly between the Fluvisols.

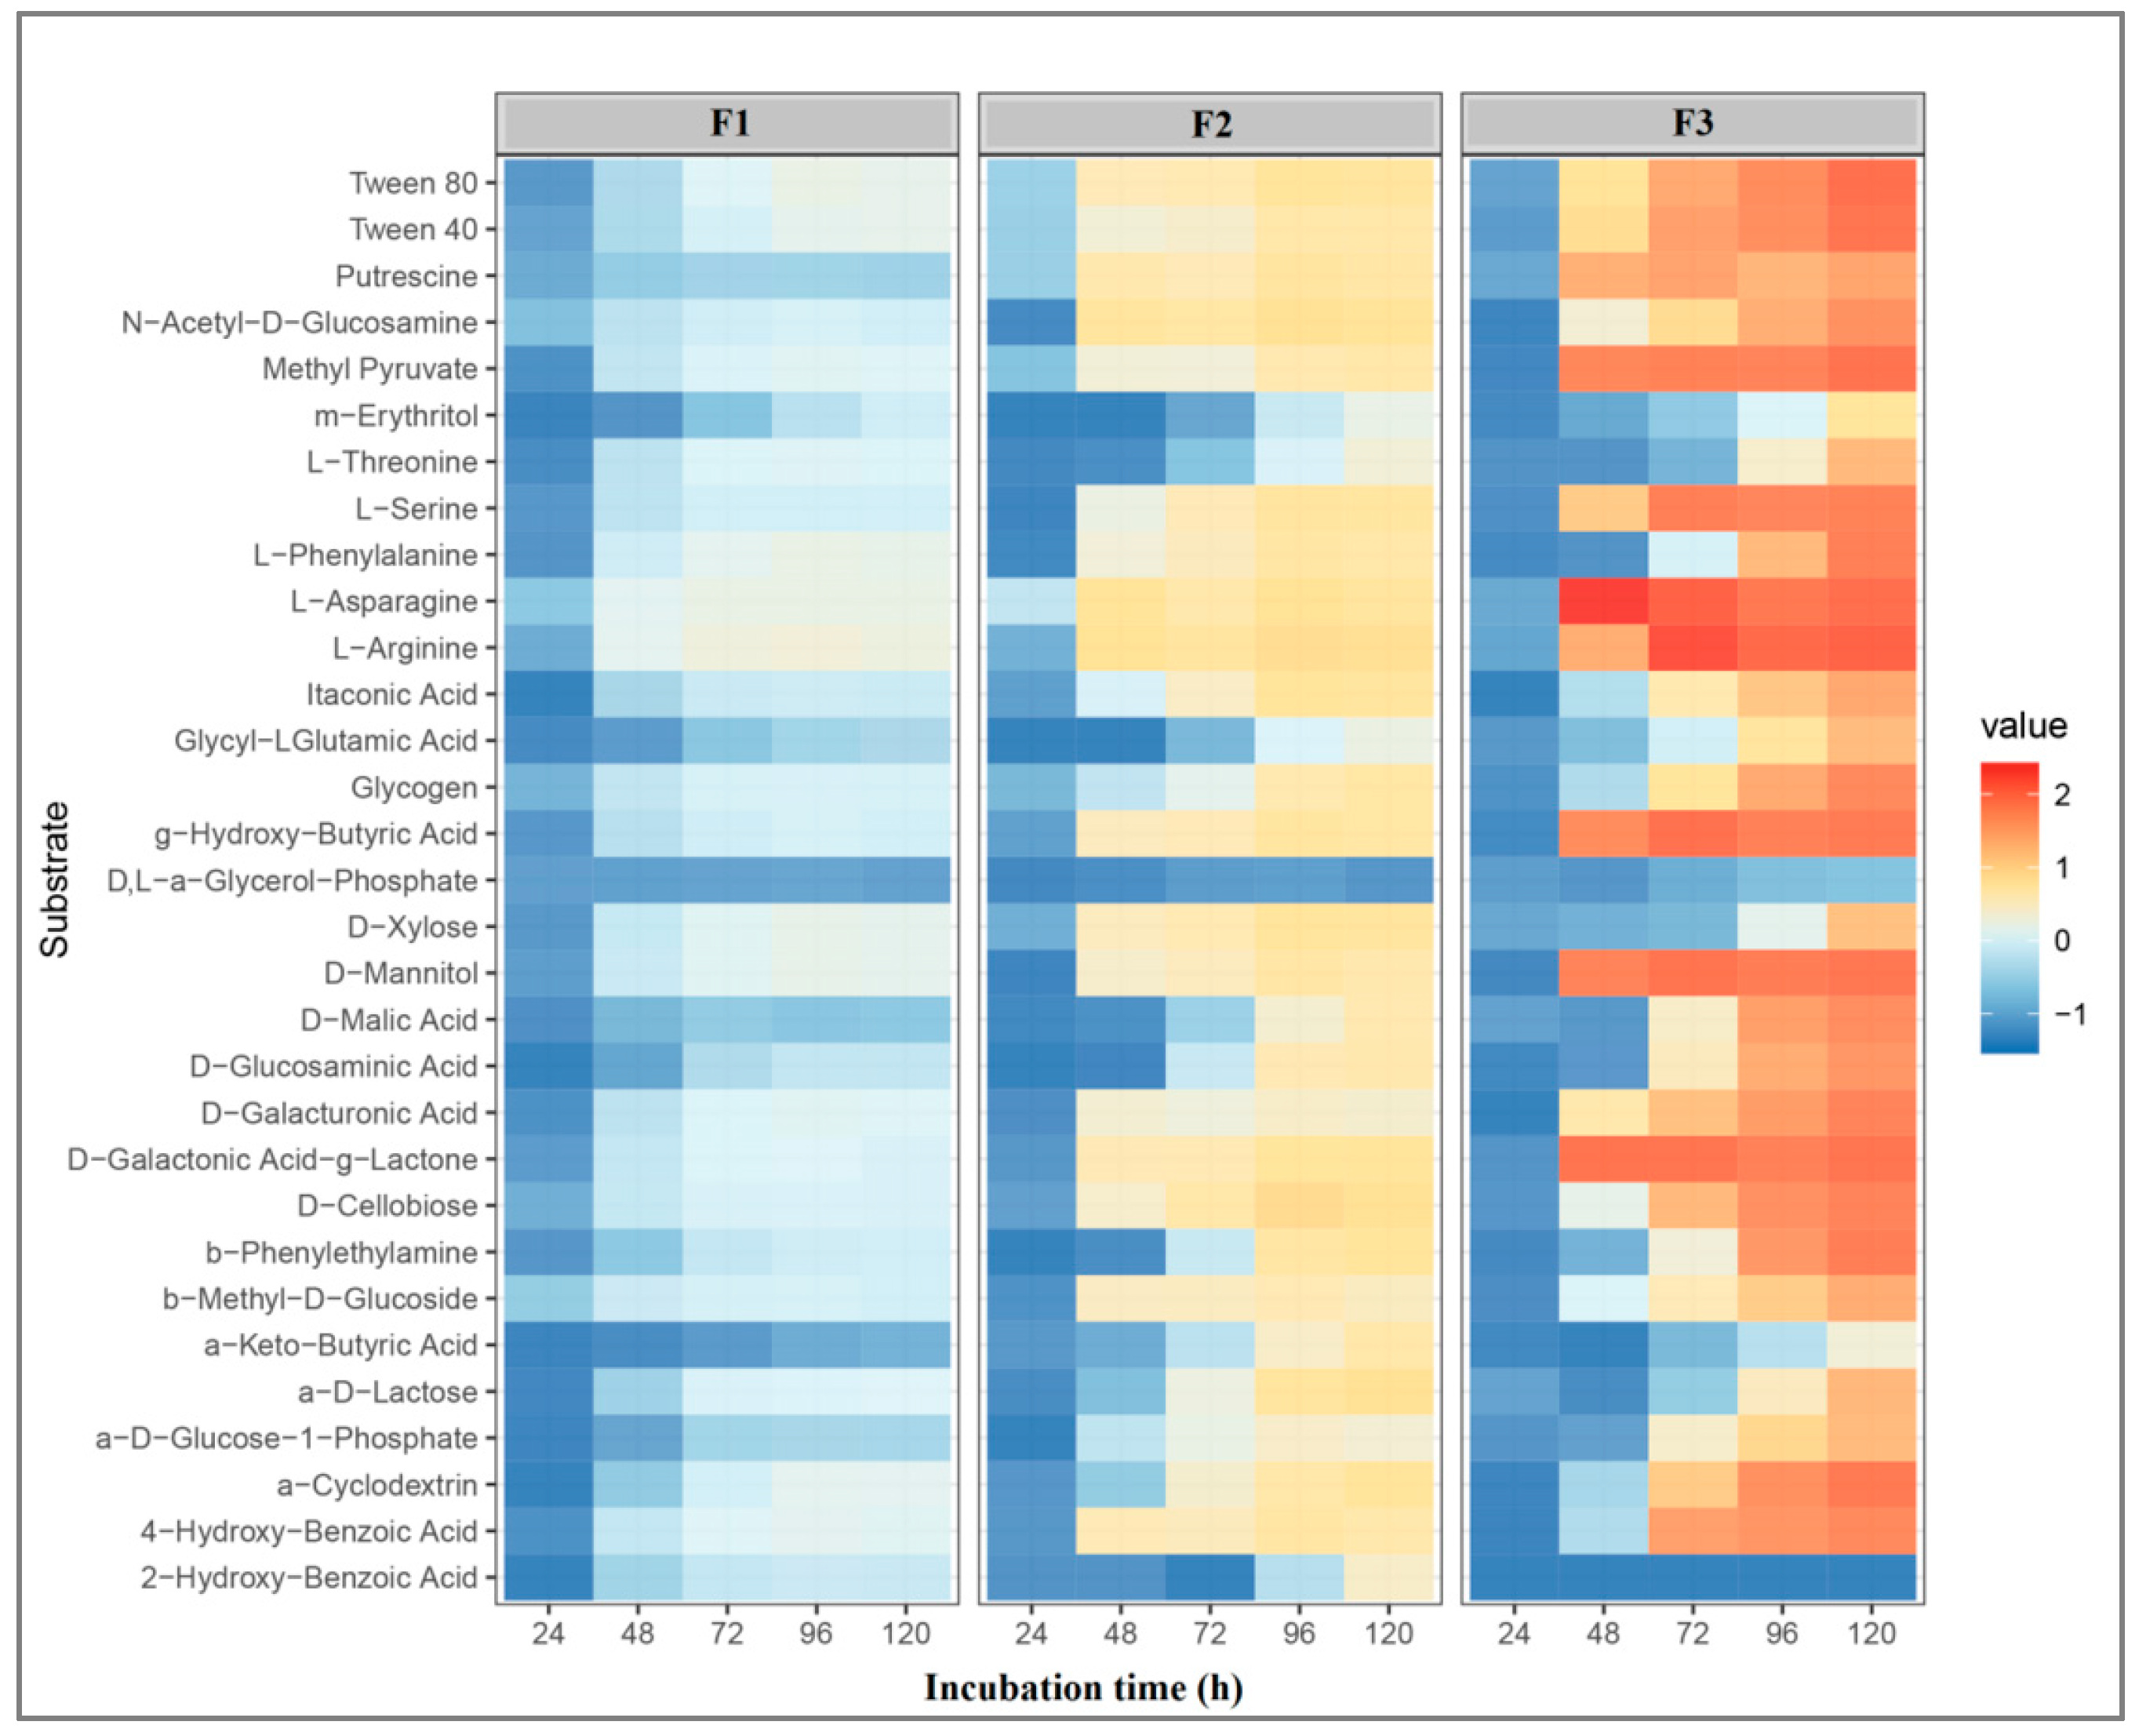
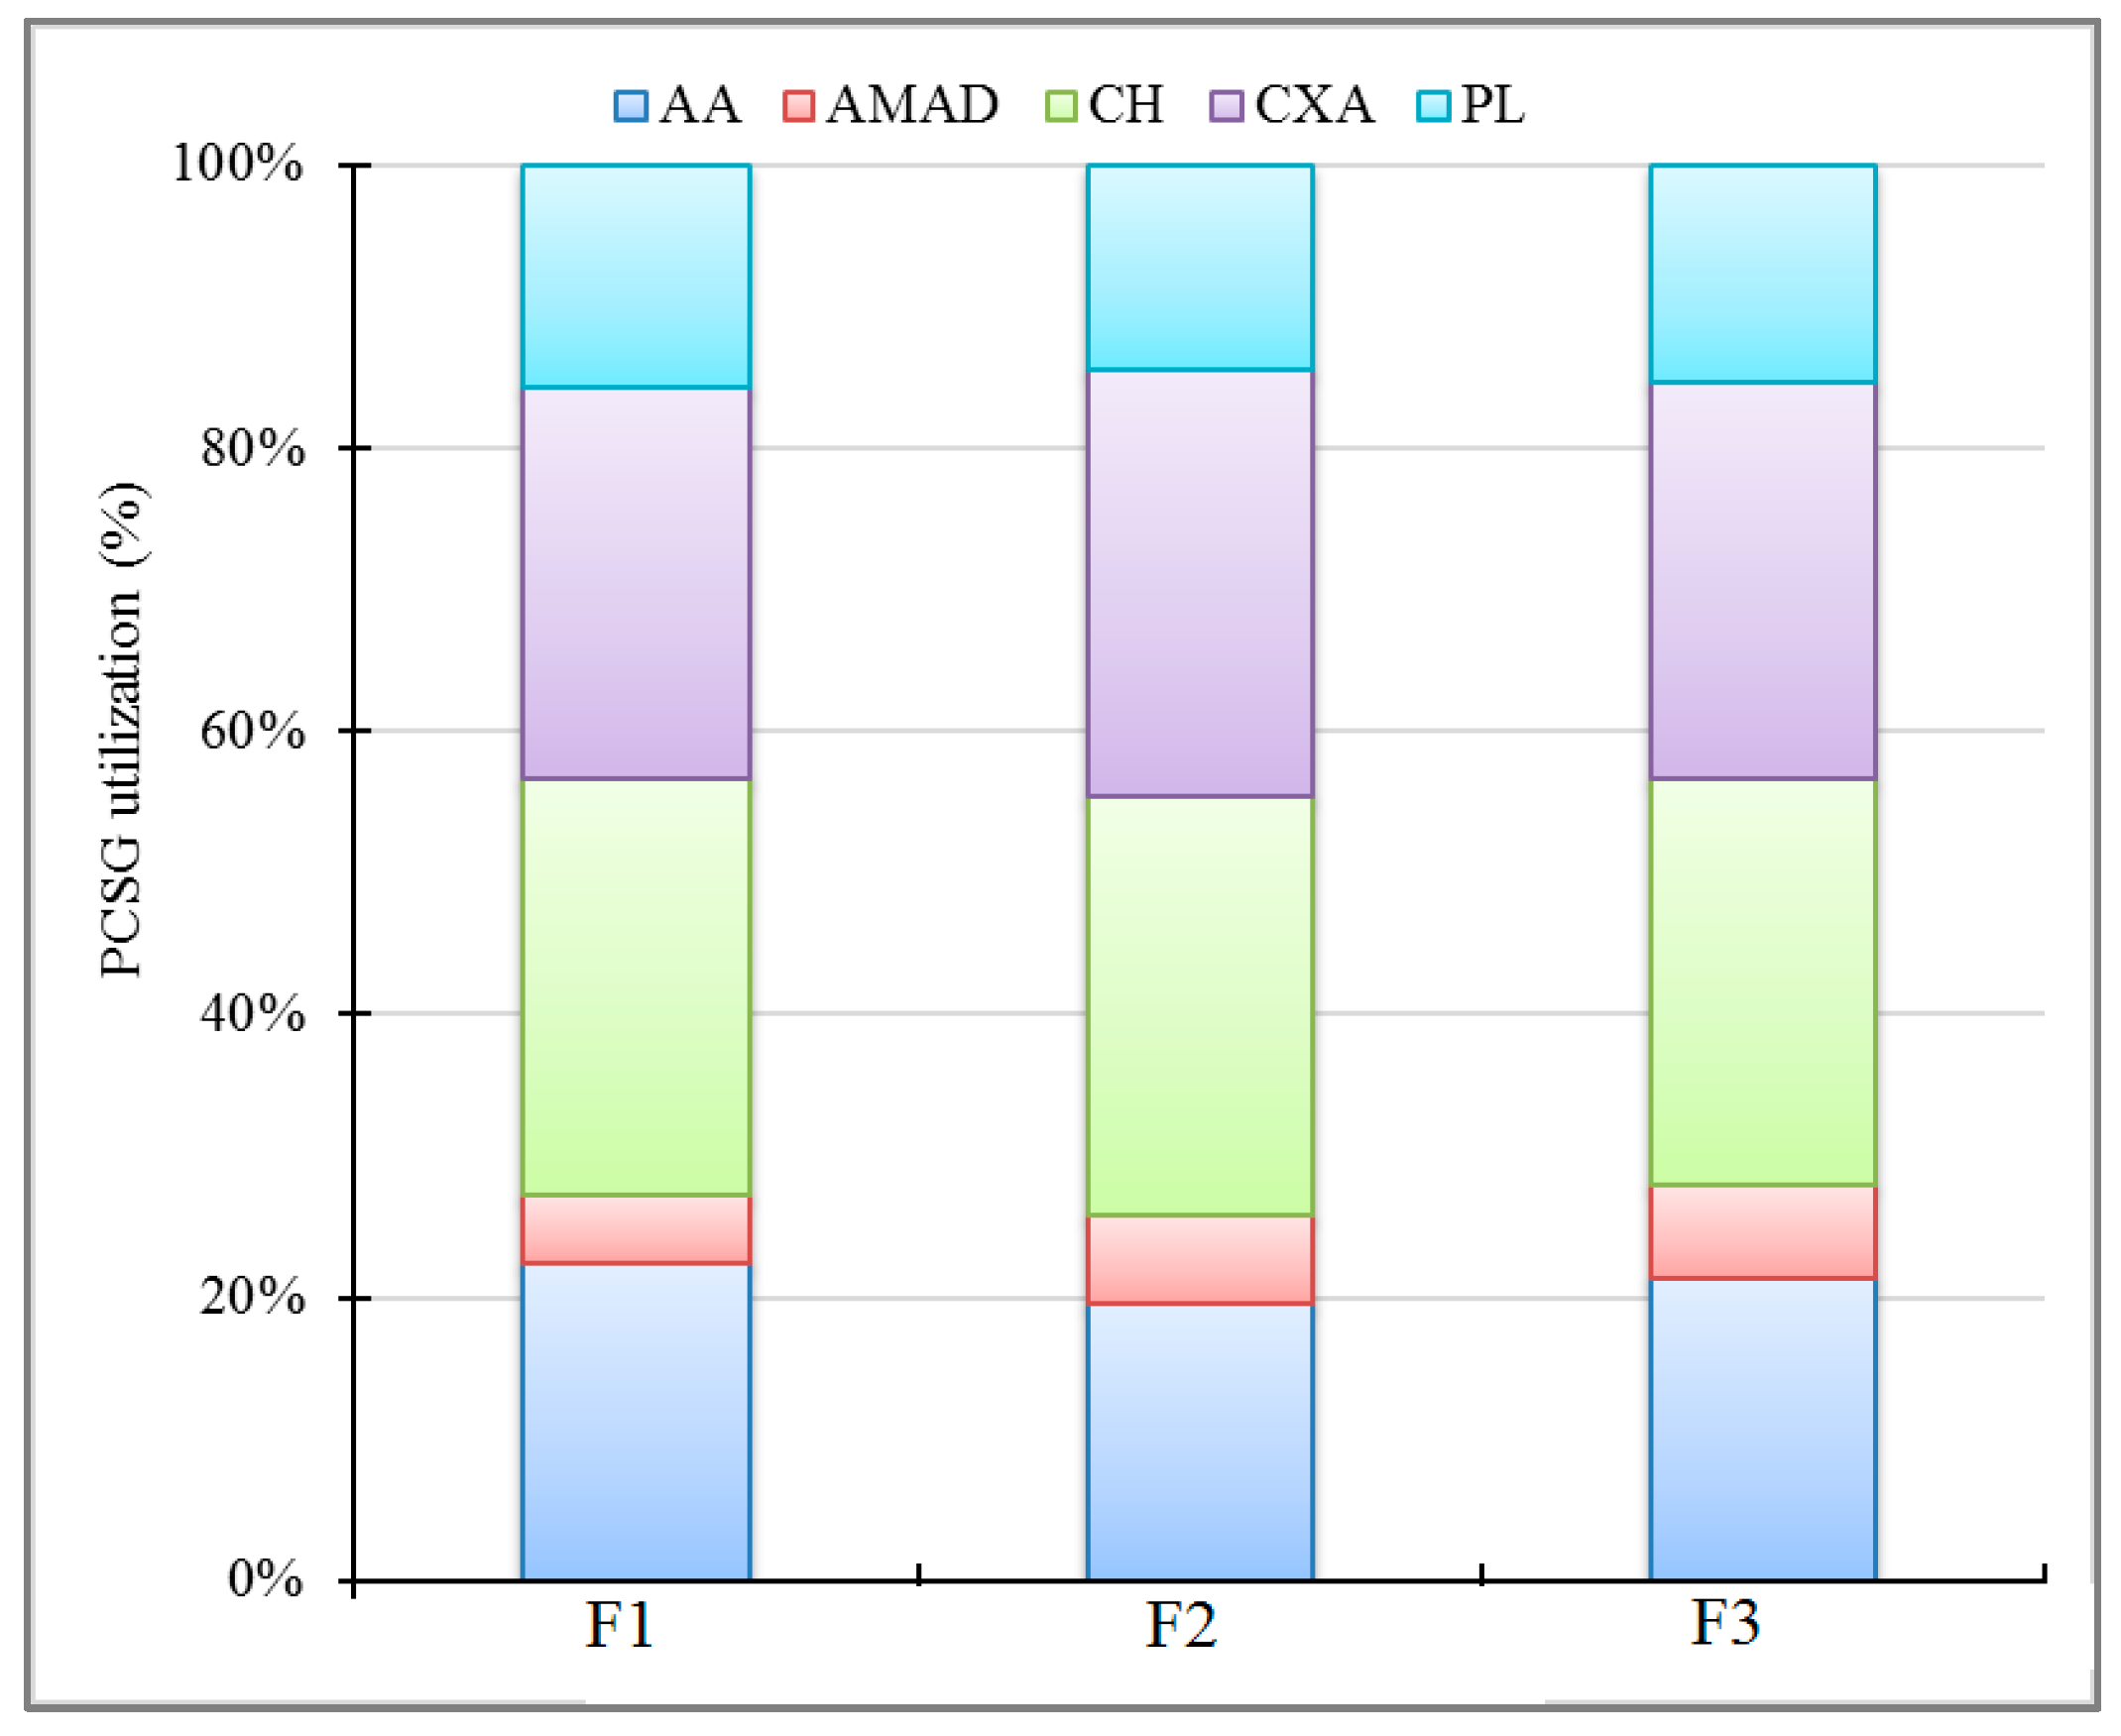
3.3. Microbial Metabolic Potential

The Biolog® EcoPlate™, with three replications of 31 different substrates, represents a useful approach for environmental community analysis [38] and has proven to be an effective technique for observing differences in the functional diversity of microbial communities in Fluvisols. Differences in the metabolic activity of the soil microbial community are presented in Figure 3 and Figure 4.
It can be noticed that in all soil samples the substrate utilisation increased during EcoPlate™ incubation, with the highest being recorded after 120 h (Figure 3). It can also be observed that the microbial community inhabiting F3 was more metabolically active in comparison to other samples. Two substrates (D, L-α-Glycerol Phosphate and 2-Hydroxy-Benzoic Acid) were the substrates least utilised by microbial communities from all examined samples.
When analysing the distribution of individual substrate groups, it can be observed that those from the carbohydrates group were utilised most intensively, at a level of 28.7–29.6% in all soil samples (Figure 4). The least utilised group of substrates comprised amines and amides (4.9–6.5%).
The calculated AWCD index ranged from 1.13 to 1.83 in all soil samples (Table 6). The highest AWCD was observed for microbial communities from F3 and the lowest from F1. The AWCD values for samples F2 and F3 were statistically similar, whereas the AWCD value obtained for sample F1 was statistically different.
The Shannon diversity index (H’) showed similar values (3.35–3.38) for all soil microbial communities, and these differences between soils were not statistically significant (Table 6). The Shannon evenness index (E) was highest for the microbial community from sample F1 and lowest from F3. These results differed significantly (Table 6). The substrate richness index ranged from 29.33 to 30.33 in all samples and values were not statistically different between soil samples (Table 6).

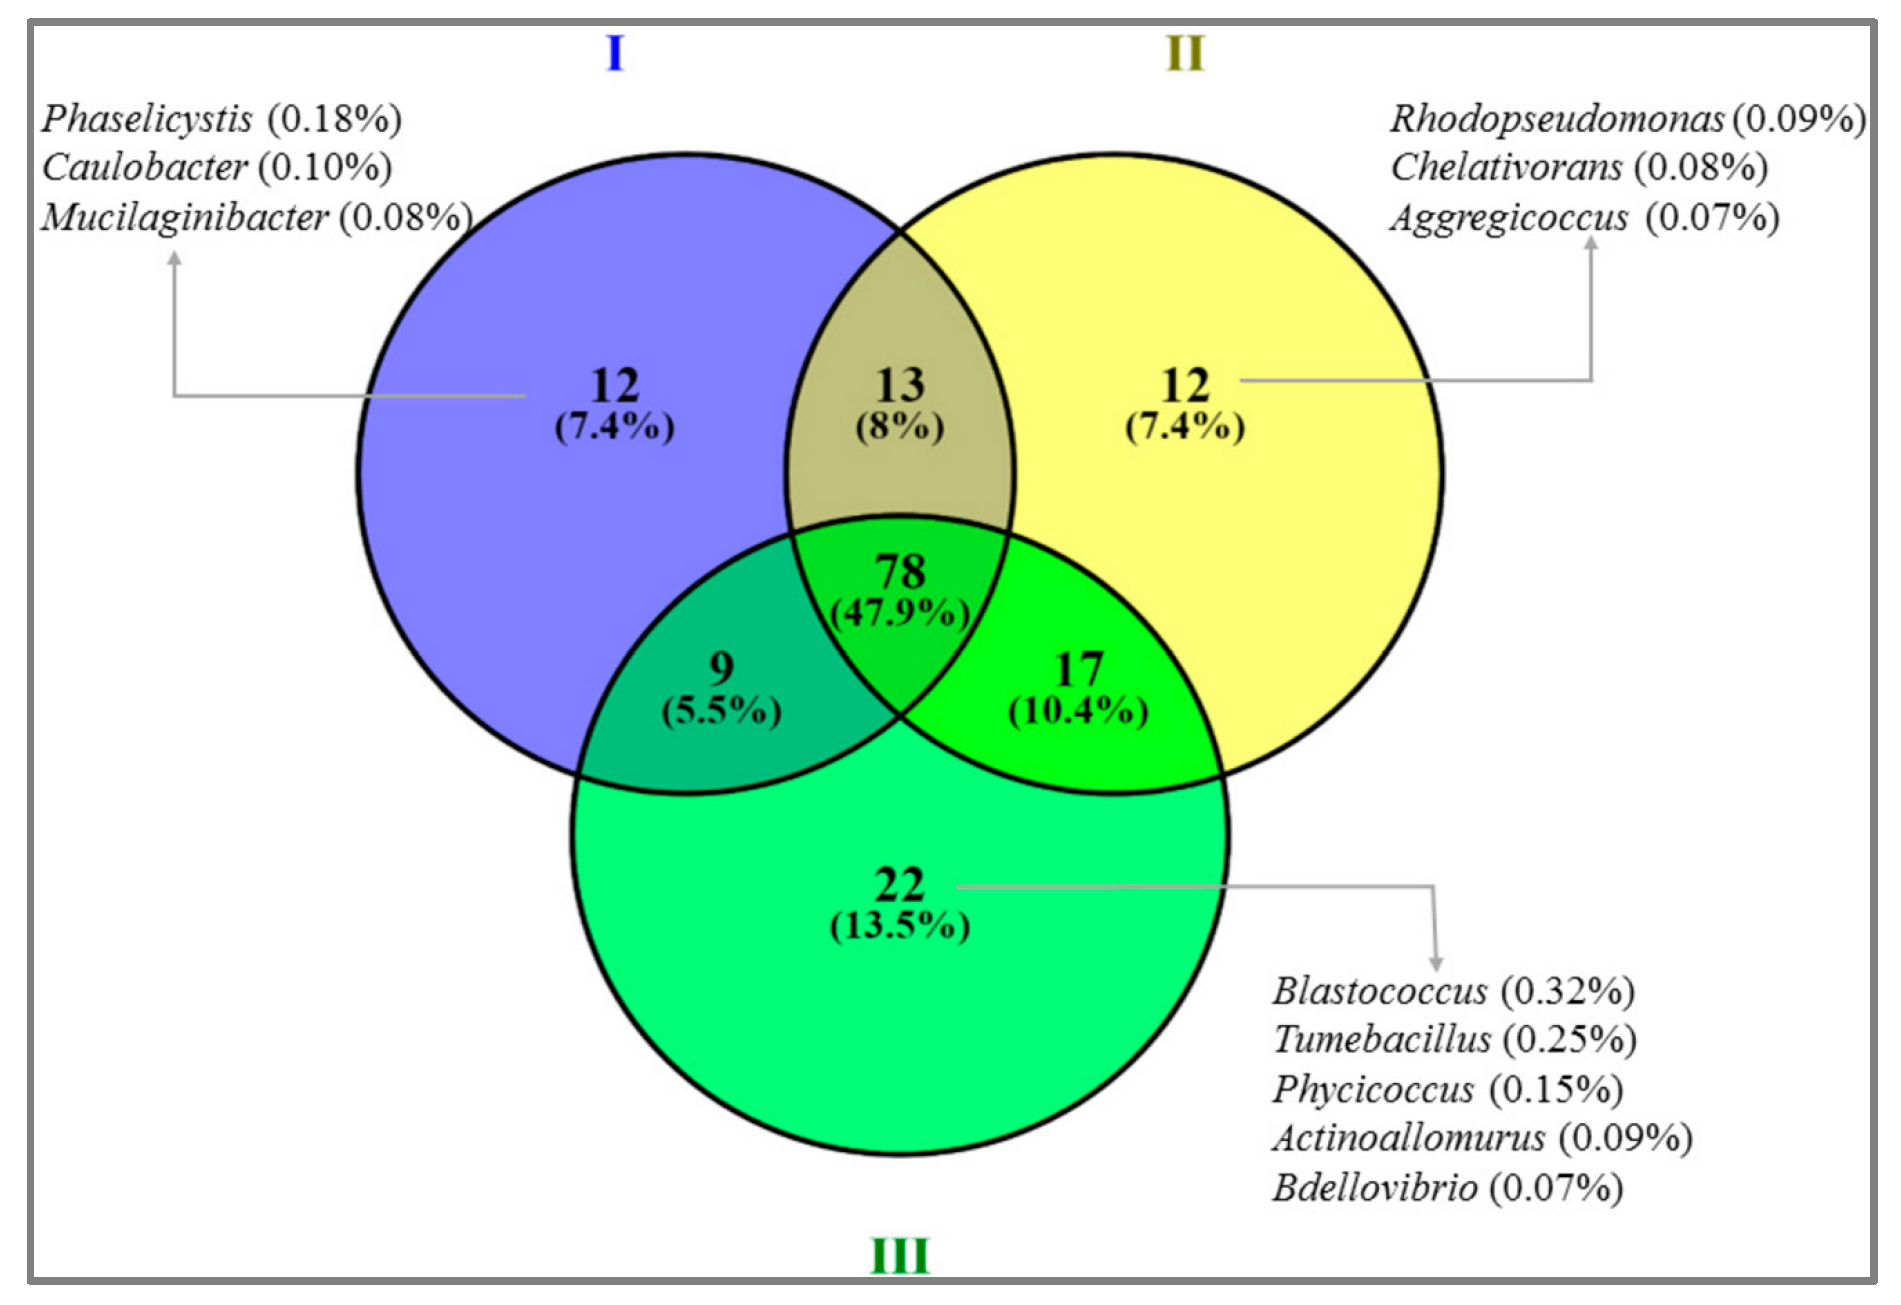
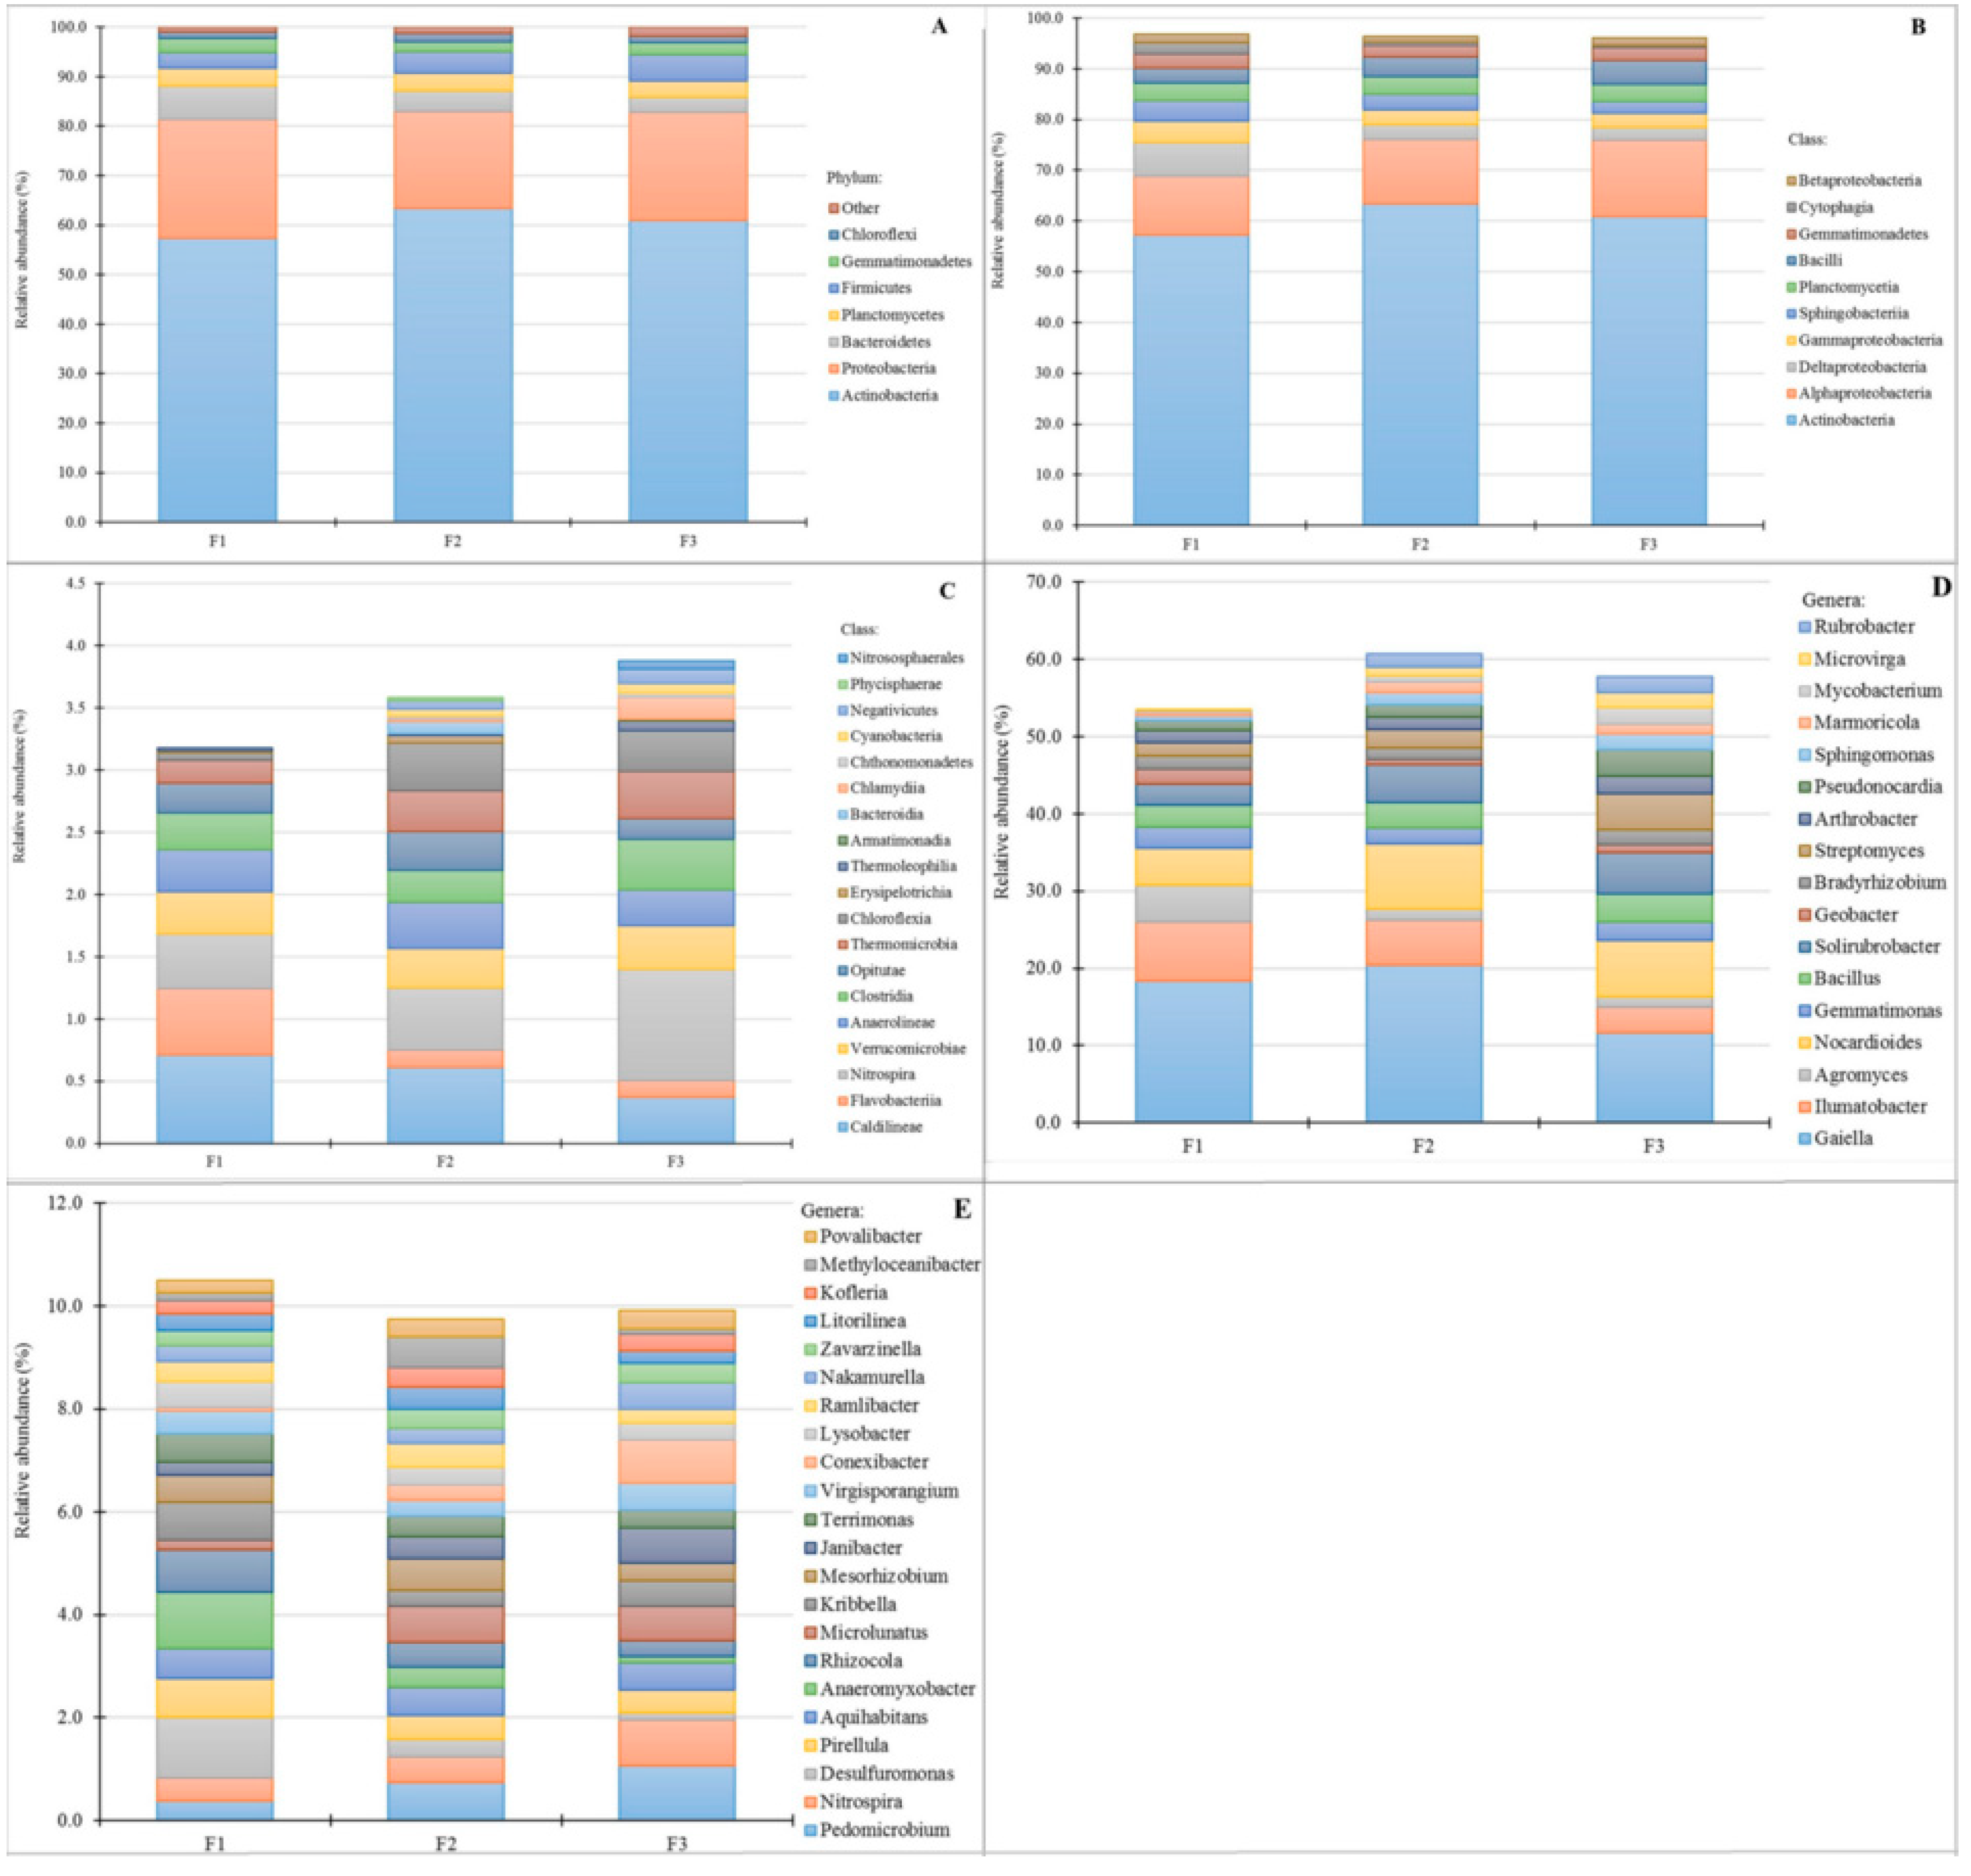
3.4. Bacterial Community Abundance and Composition

16S rRNA gene sequencing has become very popular as a means of identifying bacteria in environmental samples [39]. Indeed, this method allowed us to identify differences and similarities in the composition of the microbiomes of the soils examined.
Out of all 13 phyla obtained, only seven were present in all Fluvisols in amounts above 1%: Verrucomicrobia, Proteobacteria, Planctomycetes, Nitrospirae, Gemmatimonadetes, Firmicutes, Chloroflexi, Bacteroidetes, and Actinobacteria. Actinobacteria was the most common phylum in all samples (Figure 5A) at levels of 57.33–63.42%. The second most abundant phylum was Proteobacteria, occurring at 19.58–24.06%. For F1, Bacterioidetes (6.77%) was the third most numerous phyla. However, for F2 and F3, Firmicutes (4.27%—F2, 5.295%—F3) was more significant. Only in F3 were all 13 phyla identified. An absence of Armatimonadetes, Chlamydiae, Cyanobacteria, and Thaumarcheota phyla was recorded in F1. Moreover, in F2, the presence of Thaumarcheota was not detected. Thaumarcheota was the only representative of Archea identified in the Fluvisols, and only in F3, with a rather low level of 0.07%.
A total of 29 classes of bacteria were identified in all Fluvisols studied. Ten accounted for more than 96% of all identified classes in each of the Fluvisols studied. (Figure 5B). Among the dominant classes of bacteria were Actinobacteria, Alphaproteobacteria, Deltaproteobacteria, Gammaproteobacteria, Sphingobacteriia, Plancomycetia, Bacilli, Gemmatimonadetes, Cytophagia, and Betaproteobacteria. The most abundant was Actinobacteria, in the range of 57.3–63.4%. In analysing another 19 classes of bacteria, one can note considerable variation between soils (Figure 5C). In F1, only 11 out of 19 classes were identified. In F1 and F2, 0.7–0.6% of Caldilineae was recorded, while in F3 there were half as many representatives of this class (0.37%). Moreover, Nitrospira occurred at 0.89% in F3, yet in F1 and F2, this class occurred to half the extent (0.44% and 0.49%, respectively. The lowest rate of Chloroflexia was 0.06% in F1; in F2 and F3, their abundance was 0.33–0.38%.
Differentiation between the abundance of bacteria of particular genera in the Fluvisols examined can be acknowledged (Figure 5D,E). The 17 dominant bacterial genera accounted for 53.55–60.70% of all identified genera in Fluvisols. The number of Gaiella in F2 was 22.3%, in F3 about 47.1% less, and 11.8% in F1 (Figure 5D). However, in the case of Streptomyces, the opposite relationship could be observed—in the sample of F3, bacteria from this genus occurred in amounts of 47.8% higher than in F2 and 65.2% than in F1. The number of bacteria of the genus Nocardioides ranged from 4.75% to 7.27% (F1 < F2 < F3). The Rubrobacter bacteria were identified in F2 and F3 in amounts of 1.69% and 2.01%, respectively, but in F1, Rubrobacter was absent (Figure 5D). A further 22 genera of bacteria accounted for between 9.92% and 10.50% (Figure 5E). Within these genera there were differences between Fluvisols. The highest differences were observed in the number of Desulfuromonas and Anaeromyxobacter bacteria. The abundance of both genera in the soils was arranged (successively) as follows: F1 (1.19–1.11%) > F2 (0.35–0.40%) > F3 (0.14–0.13%). Moreover, in the case of Conexibacter bacteria there was a marked difference between soils—in F3 they were the most abundant (0.84%) and in F1 the least (0.06%).
Of all 163 the genera of bacteria identified, 78 were common to all three Fluvisols, or about 48% (Figure 6). Gaiella, Nocardioides, and Ilumatobacter (Figure 5D) can be distinguished. Furthermore, in each Fluvisol, some genera of bacteria did not inhibit the other two. Indeed, in F1 and F2 there were 12 such genera, while in F3 the number of “unique” genera was 22 (Figure 6). As the “core microbiome” of the Fluvisols studied, 78 genera of bacteria belonging to nine phyla can be identified: Verrucomicrobia, Proteobacteria, Planctomycetes, Nitrospirae, Gemmatimonadetes, Firmicutes, Chloroflexi, Bacteroidetes, and Actinobacteria.

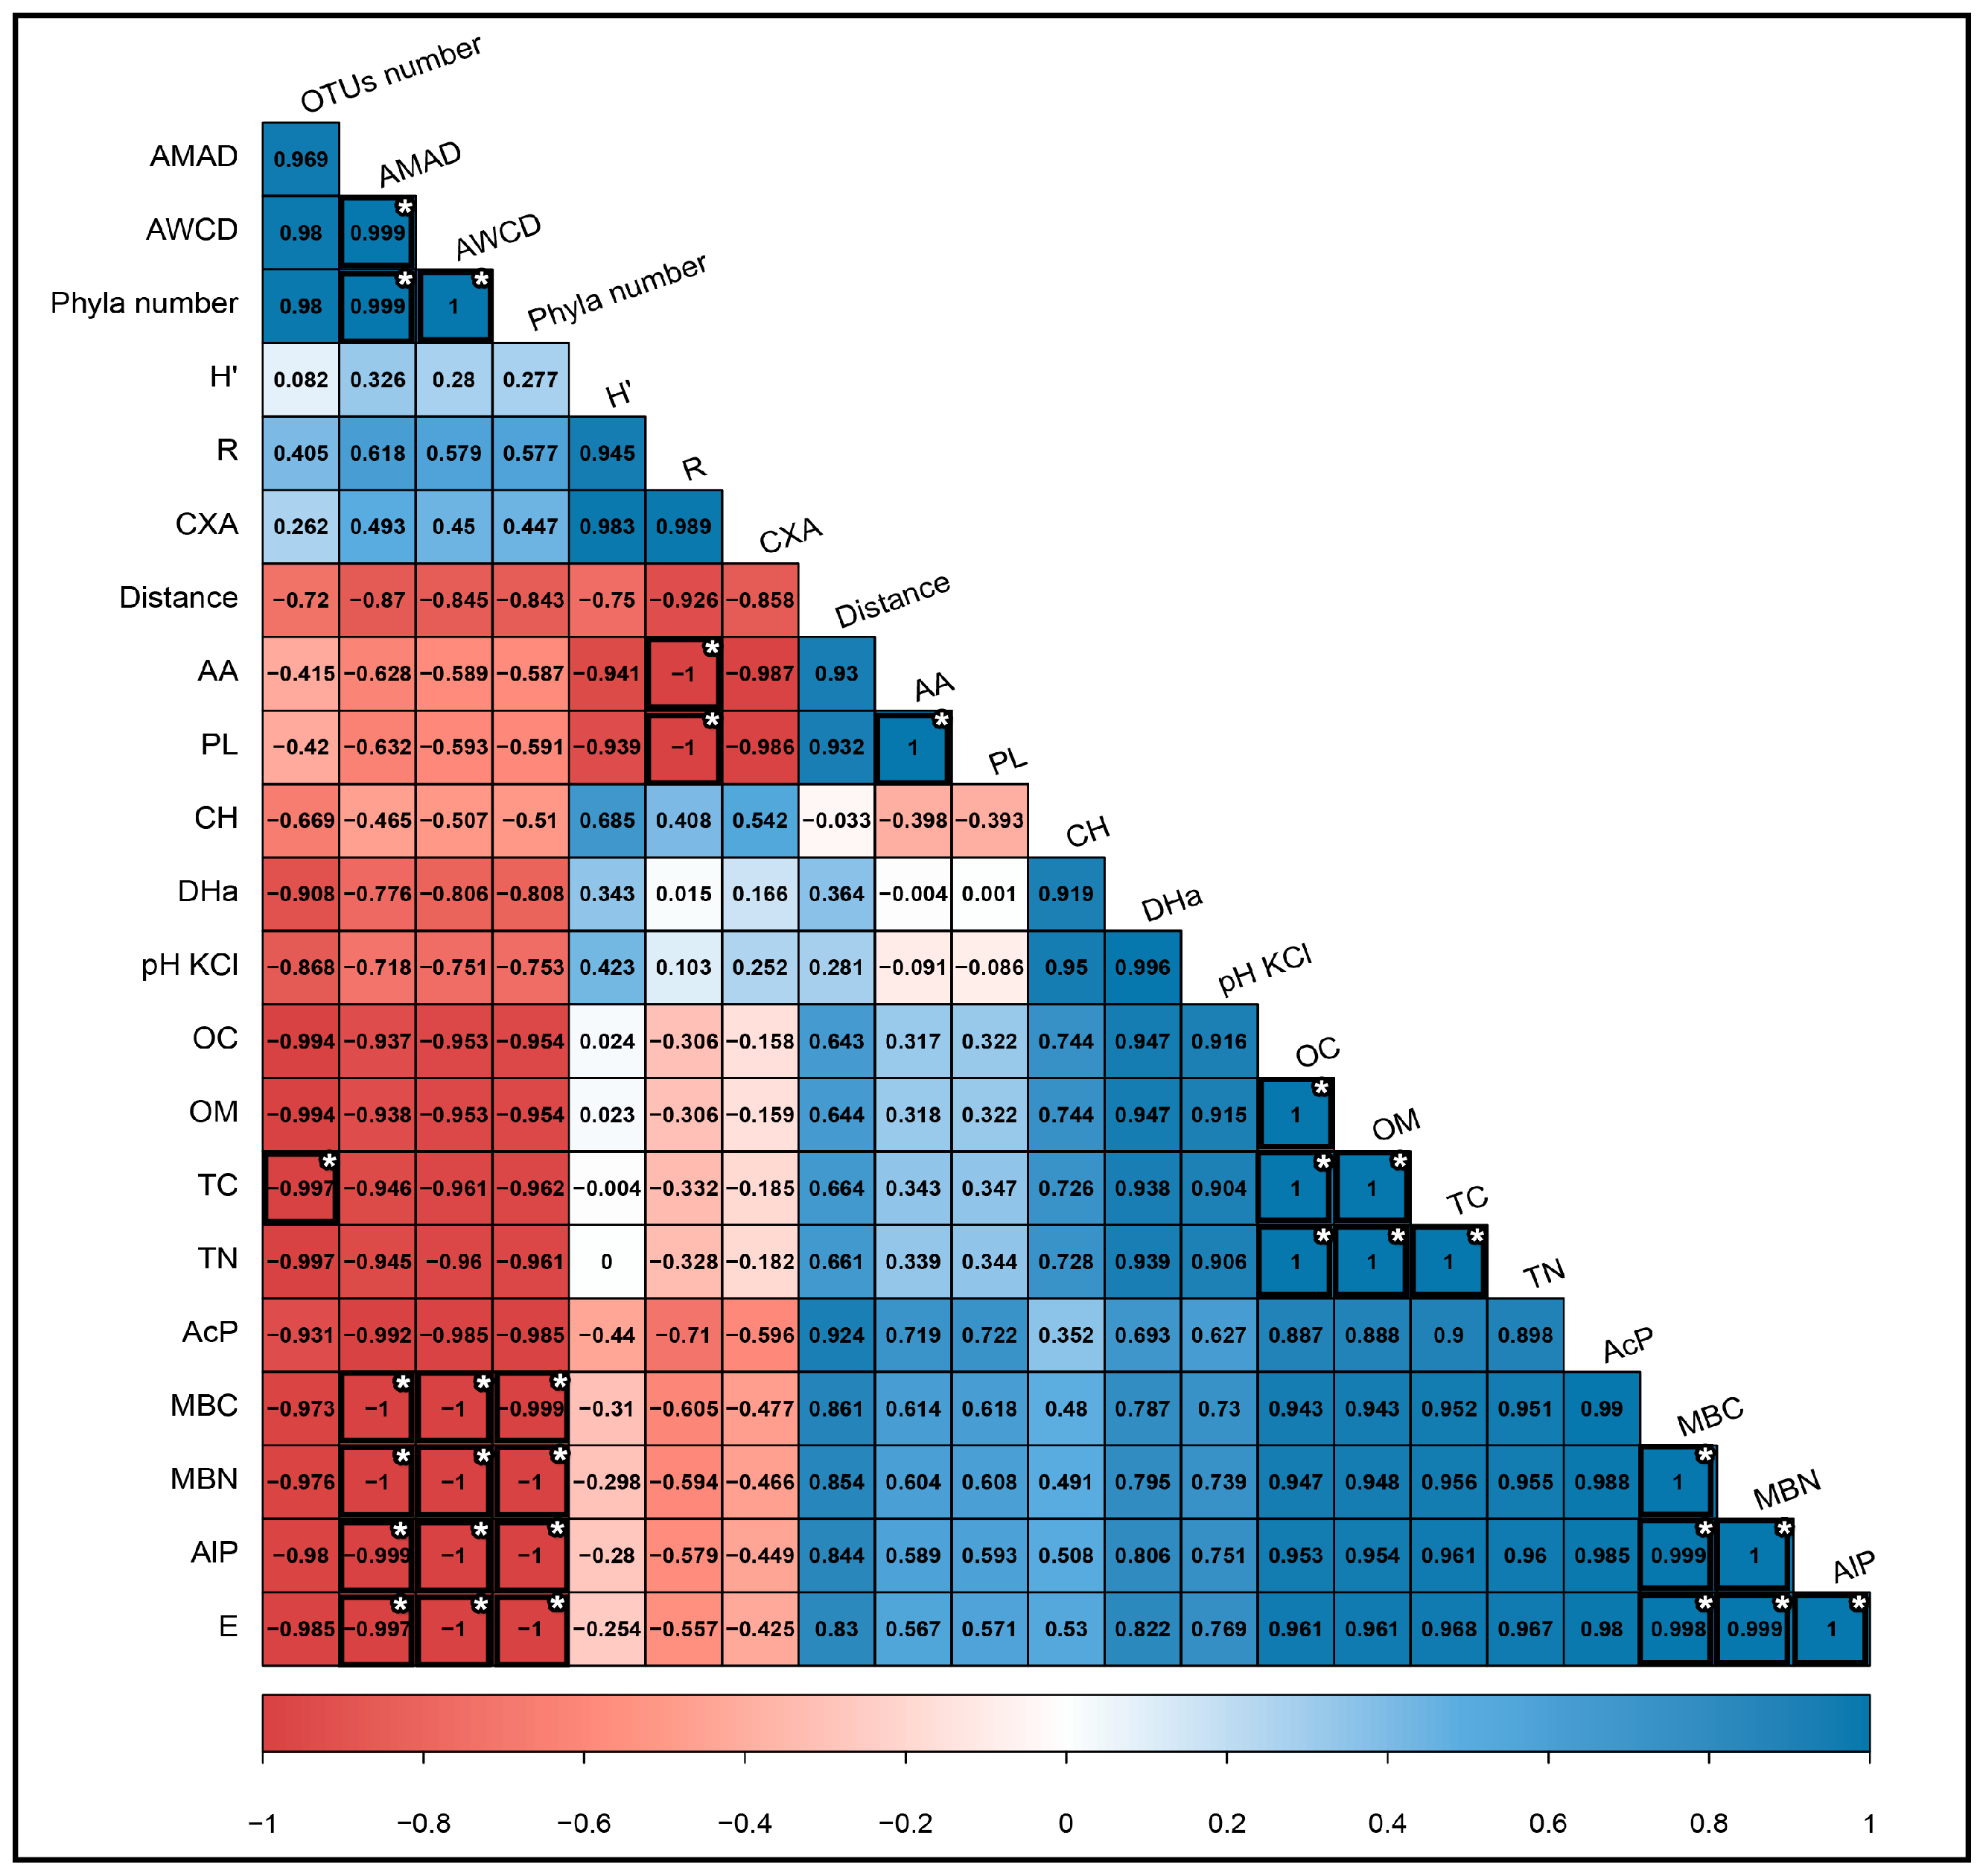
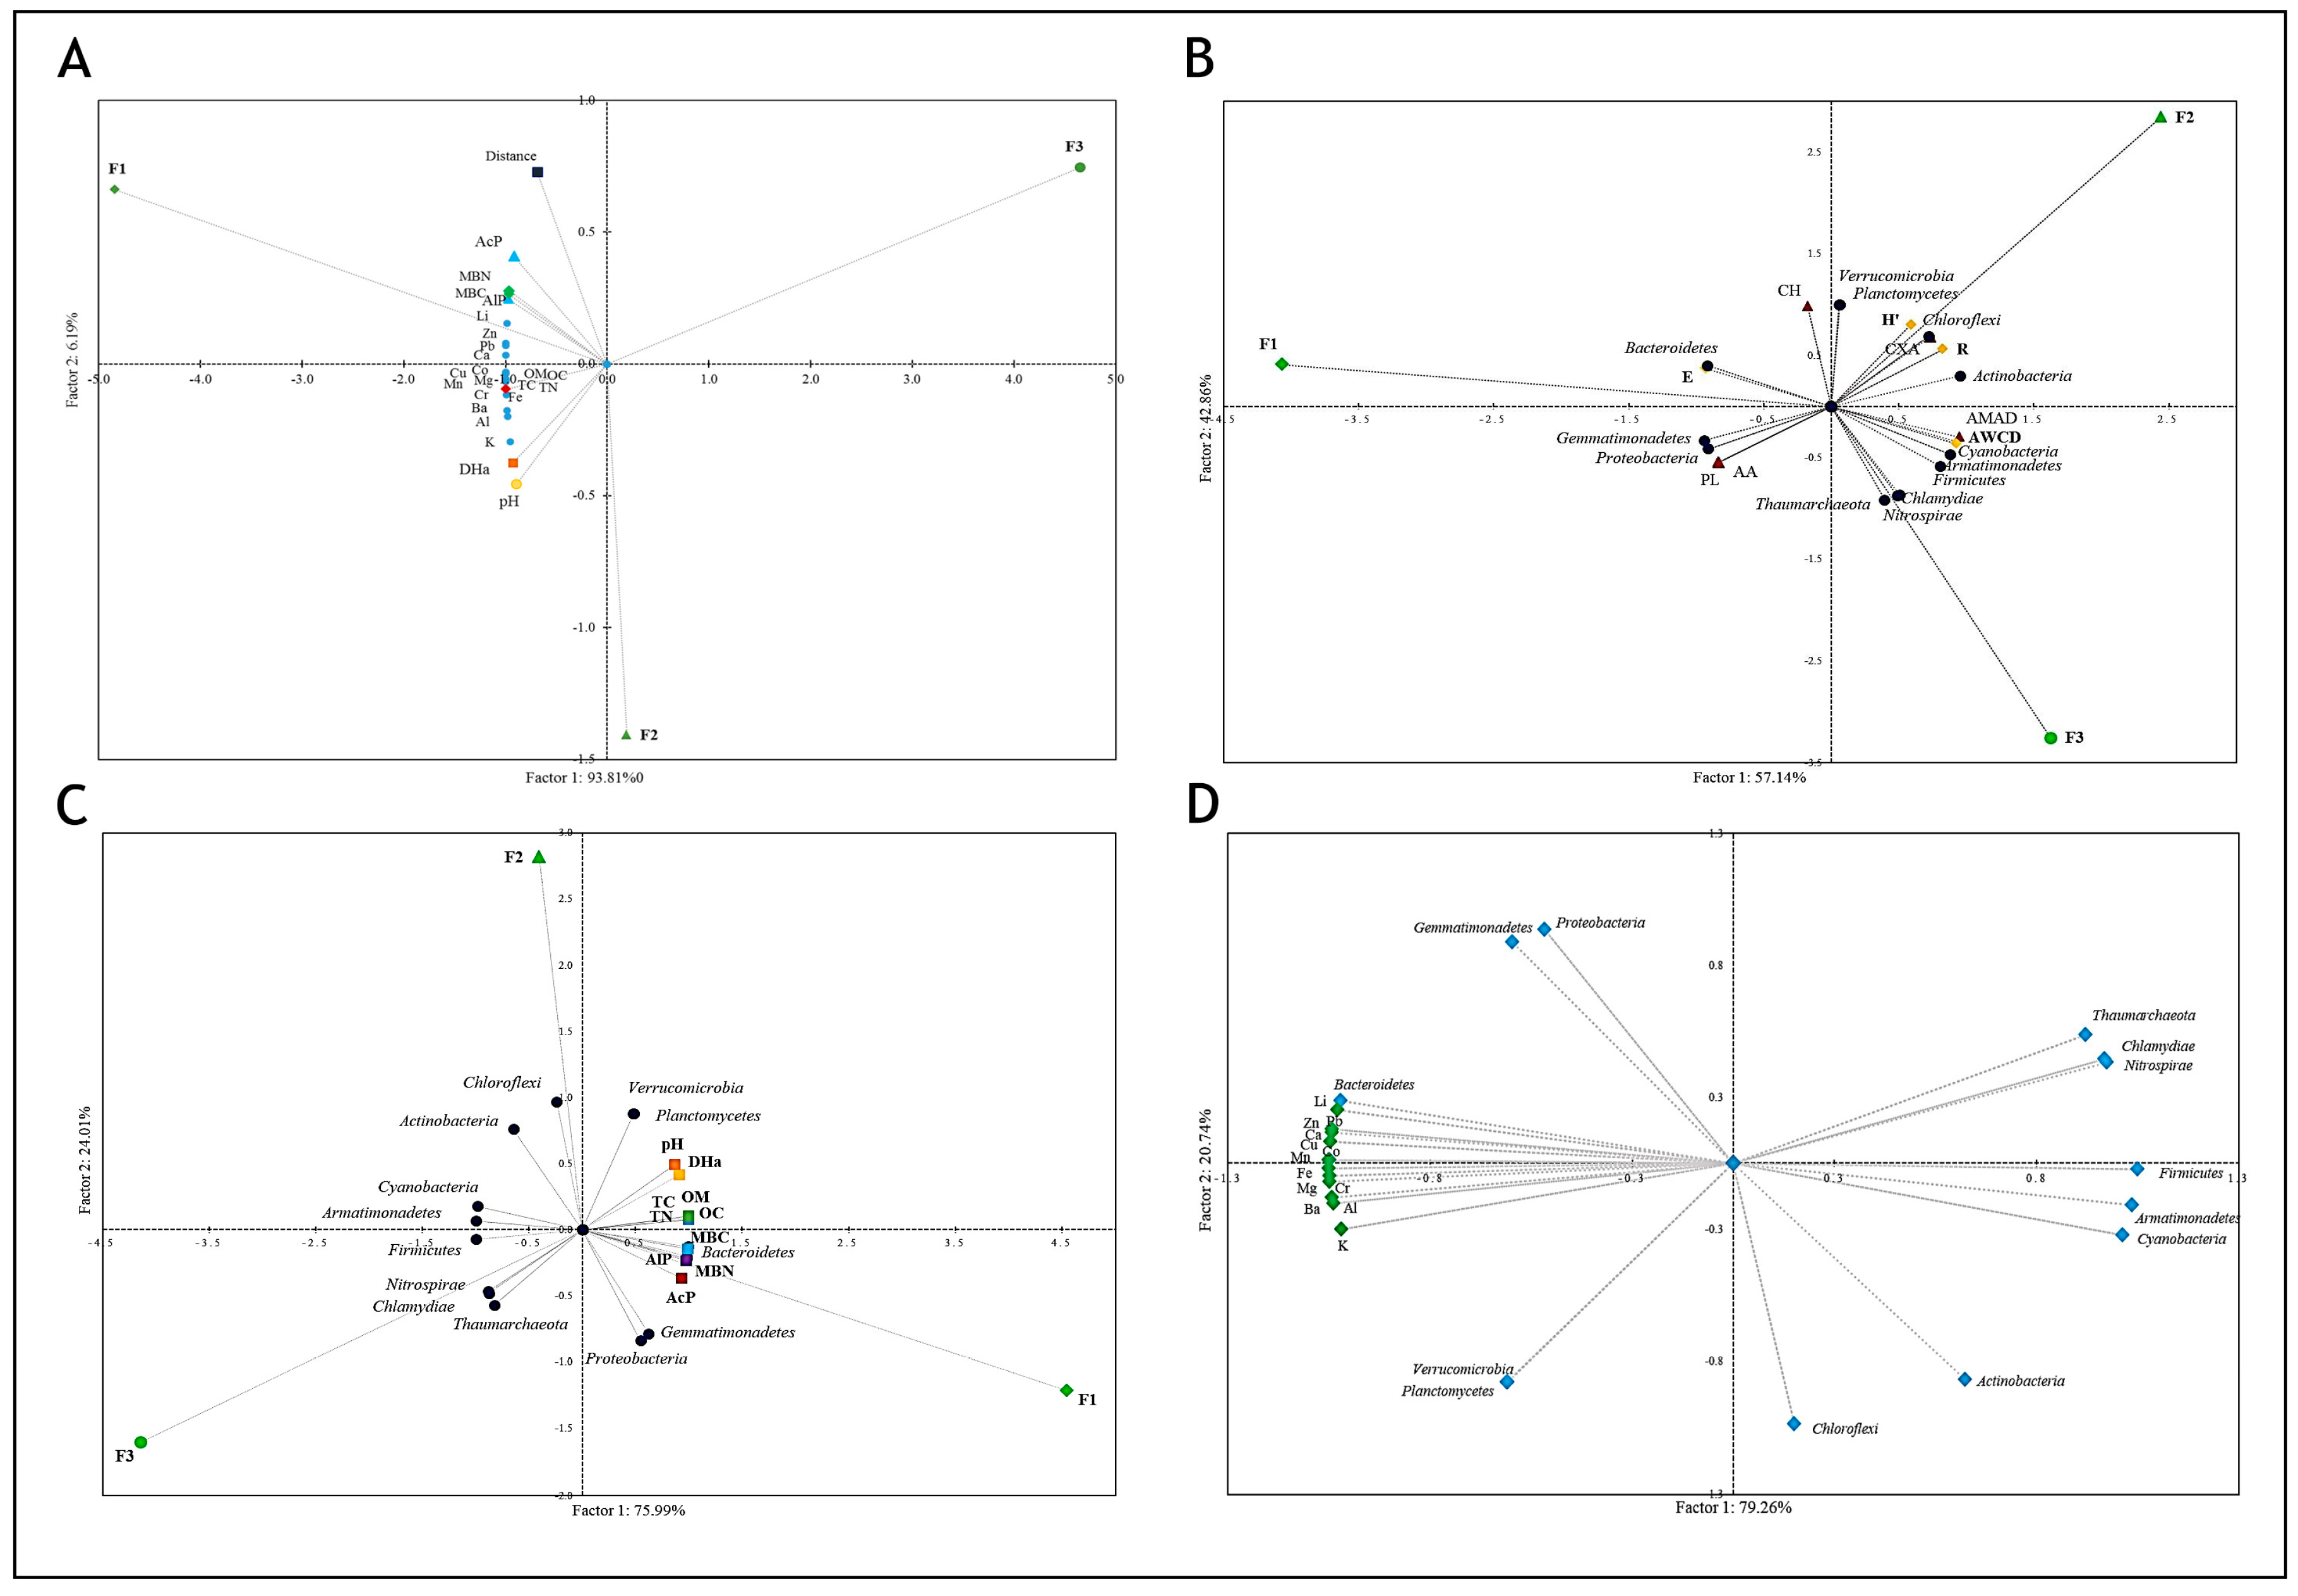
3.5. Correlation of Soil Properties and the Bacterial Community

A strong positive and statistically significant correlation was observed between the biological parameters of the soil investigated, including AlP activity, MBC, MBN, TC, OC, TN, and OM contents (Figure 7). Astonishingly high Pearson’s correlation coefficients were detected for dehydrogenase activity and soil pH values (=0.996), but these were not statistically significant (at p < 0.05).
Physico–chemical parameters (such as pH, OC, OM, TC, TN) did not positively correlate with the microbiological activity expressed by AWCD, H, R indexes, nor with bacterial diversity (OTUs number—number of all identified bacterial operational taxonomic units, phyla number). It can also be noted that the distance of the sampling site from the river bed had no statistical influence on the analysed soil parameters. However, a strong positive correlation was noted between the AWCD index and bacterial phyla number.
To understand the correlation between the bacterial community structure and its metabolic potential, as well as the biological parameters of different soils, principal component analysis (PCA) was undertaken (Figure 8 A–D).
The parameters selected were pHKCl, metals contents, phosphatase activity (AcP, AlP), dehydrogenases activity (DHs), microbial biomass carbon, and nitrogen content (MBC, MBN), and these explained 93.81% of the variability in the soils examined (Figure 8A). The analysed parameters can be divided into two groups: (I) MBC, MBN, AlP, AcP, distance from the riverbed, and Li, Zn, Pb, Ca contents; (II) pHKCL, DHa, OM, TC, OC, TN, and Cu, Co, Mg, Mn, Cr, Ba, Al, K, Fe contents. In addition, group I contains soil F1. Parameters from group II are negatively correlated with Fluvisols F3, whereas the soil F2 is opposite to F1 and parameters from the group I.
In comparing the data from EcoPlate™ and NGS, we can see that the presence of Bacteroidetes correlates with the utilisation of carbohydrates (CH) and the evenness (E) index, as well as soil F1 (Figure 8B). In contrast, the Shannon diversity (H’) and richness (R) indexes are correlated with soil F2 and the presence of Verrucomicrobia, Planctomycetes, Chloroflexi, and Actinobacteria, as well as the utilisation of carboxylic acids (CXA). In opposition to F1 is soil F3, and correlated with it are Cyanobacteria, Armatimonadetes, Firmicutes, Chlamydiae, Nitrospirae, Thaumarcheota, utilisation of amines and amides (AMAD), and the AWCD index.
Based on the biplot (Figure 8C), the parameters and bacterial phyla can be clustered into two groups: (2) DHa, pHKCL, TC, TN, OC, and OM contents, Verrucomicrobia and Planctomycetes abundance; (2) MBC and MBC content, AlP and AcP activity, Bacteroidetes, Gemmatimonadetes, and Proteobacteria abundance. The remaining eight phyla did not positively correlate with the biological and physicochemical parameters determined. However, the presence of Firmicutes, Nitrospirae, Chlamydiae, and Thaumarcheota was positively correlated with soil F3, and Chloroflexi, Actinobacteria, Cyanobacteria, and Armatimonadetes abundance with soil F2. Moreover, F2 and F1 were negatively correlated.
In analysing the biplot (Figure 8D), we can notice that the phyla Gemmatimonadetes, Bacteroidetes, and Proteobacteria werepositively correlated with the content of metals, such as Li, Pb, Zn, Ca, Cu, Co, and Mn. At the same time, the presence of Chloroflexi, Actinobacteria, Cyanobacteria, Armatimonadetes, and Firmicutes was negatively correlated with these metals. Another positive correlation could be observed between Verrucomicrobia and Planctomycetes and the content of Fe, Mg, Cr, Ba, Al, and K in the soil. In contrast, Thaumarcheota, Chlamydiae, and Nitrospirae were negatively correlated with the content of these metals in the soil.
The biplots obtained (Figure 8A–C) indicate differentiation between the soils studied. Regardless of the analysed parameters, the soils were not similar to each other and did not positively correlate. On the contrary, F1 and F2 correlated negatively when comparing data from EcoPlate™ and soil quality parameters and NGS (Figure 8A,C). In the same way, F3 correlated negatively with F2 in the analysis of the content of metals and NGS, and with F1 in comparison with the results of EcoPlate™ and NGS.

4. Discussion

4.1. Soil Physicochemical Properties

The obtained results concerning the physico–chemical properties of the examined Fluvisols are comparable to the data obtained by other researchers. Similar results for total nitrogen and organic carbon content in Fluvisols from the river valley were also obtained by Banach-Szott et al. [15]. However, these researchers obtained different pH values for soils depending on their distance from the riverbed. Soils taken up to 200 m from the riverbed had a pH of 7.0–7.3, while at more than 200 m, the pH level was 5.8–6.4. Our results (distance from the riverbed 80, 225, 525 m, for F1, F2, and F3, respectively) are located between these values (6.9–6.7). Similar pH values were obtained by Kobierski [40] on samples which were taken from grasslands in floodplain areas in the Lower Vistula River.
The metal contents obtained in the examined soils did not exceed the values of metal contamination specified in the regulations of the Ministry of the Environment of 09 September 2002, concerning soil quality standards and the quality standards of soil (group B) [41]. The content of metals in F2 was also similar to those obtained by Kobierski [40] in a layer of 0–30 cm of Fluvisols from Grudziądz Basin (the Lower Vistula River). However, the concentrations of metals such as cadmium, lead, nickel, and zinc were much higher in F1 and significantly lower in F3. The content of manganese and iron in F1 was similar to Kobierski’s [40] results. The iron content of F1 and F2 was similar to the iron content of soils from the surroundings of Kerela Minerals and Metals Limited, a titanium dioxide manufacturer [42]. The content of lead and copper in F1 and F2 was much higher than in the Fluvisols of the Łyna River Valley [43]. On the other hand, the contents of these metals in F3 were lower than those obtained by Sowiński et al. [43].

4.2. Soil Biological Properties

The activity of dehydrogenases activity (DHa) obtained for F1 corresponds to the activity of these enzymes obtained in soils of good quality in Poland, e.g., Gleyic Chernozem and Cambic Leptosol. In contrast, the DHa obtained in F3 corresponds to the activity of soils of poor quality, e.g., Haplic Luvisol [6].
For alkaline phosphatase we observed lower values than those in soil from the riparian wetlands in Songhua River (Fujin, China), with pH 6.86 [44]. We also obtained lower values of phosphatase activity compared to fluvo-aquic soil with pH 7.98, i.e., higher than in our Fluvisols [45]. This indicates that the pH has a very large effect on the enzymatic activity of soils [8,46].
The MBC and MBN obtained in our study were lower for F2 and F3 and higher in F1 than in soils originating from meadows from the river oasis of Bulgan River (Western Mongolia) [47]. The same trend in MBC and MBN values was obtained by comparing our results with those of semi-arid soils from the pasture sites [48]. At the same time, the results were higher than those of soils cultivated for agricultural purposes [49].

4.3. Microbial Metabolic Potential and Bacterial Community Composition

The EcoPlate™ often reveals high carbohydrate consumption by soil microorganisms, along with the low utilisation of amines and amides [49,50], which is consistent with the present results (Figure 4). However, studies by Wolińska et al. [51] have demonstrated a particularly high consumption of amino acids and low consumption of carbohydrates. This difference may result from differences in soil pH and particle size distribution.
The diversity of soil microbial communities has an impact on the range of biogeochemical processes, the complexity of interactions, multifunctionality, and sustainability of the soil ecosystem, and thus on the quality of the soil [52,53,54]. Our results for soil microbiome composition are congruent with those of Delgado-Baquerizo et al., who presented in 2018 the Global Atlas of the Dominant Bacteria Found in Soil [55]. The greatest diversity of bacterial communities was recorded for microorganisms occurring in the amount of less than 1% in the soil at each level: phylum, class, and genus. However, the composition of dominant bacteria was similar in all Fluvisols examined. Other researchers have found that the most common soil bacterial phyla in the world are Proteobacteria and Actinobacteria. Actinobacteria (average 60.56%) proved to be the dominant bacterial phylum in the three analysed Fluvisols, followed by Proteobacteria (average 21.85%). In the study of meadows located on Gleysol, the dominant phylum was Proteobacteria, while Actinobacteria occurred in a much lower amount (third place among the dominant phyla; less than 10% abundance) [51]. Although the Fluvisols examined are also classified as sand loam due to their textural composition, the soils differ in physical–chemical parameters. The Gleysol analysed by Wolińska et al. [51] was more acidic (pH ~ 5.9) than that analysed here. Literature reports indicate that soil microbiomes may be dependent on both soil type and pH [6,56,57,58]. All organisms of the Thaumarcheota identified are chemolithoautotrophic ammonia-oxidisers, may play important roles in biogeochemical cycles, and are among the most abundant archaea on Earth [59,60]. It is therefore interesting that in the examined Fluvisols the Thaumarcheota representatives were identified in just one (F3) and at the level of only 0.07%.
The Actinobacteria, Gemmatimonadetes, and Bacteroidetes classes have been depicted as common inhabitants of soil [61,62]. Masse et al. [63] noted the absence of the class of Bacilli in grassland soils. This is astonishing when compared to our results, as we recorded Bacilli at a level of 2.89–4.77% in all samples. This discrepancy can be caused by factors such as a different soil type, pH, and carbon content [61,63,64]. Masse et al. [63] identified Caldilineae, along with Anaerolineae and Chloroflexia, as being the most common class of bacteria in grassland soils. In the Fluvisols examined here, the Anaerolineae class bacteria were present at 0.37–0.29%, while the Caldilineae class in soils F1 and F2 were considerably less (0.6–0.7%) and in F3 was presented at 0.37%.
Gaiella was recorded as a dominant genus in the Antarctic soils (King George Island) [65] and agricultural soils from China [62]. Discovering Rubrobacter bacteria in Fluvisols (F2, F3) is interesting because so far only five species have been classified as such, most of which were isolated from thermophilic environments (e.g., hot springs, desert soils, volcanic soil) or biodeteriorated monuments [66,67]. Uncultured Rubrobacter bacteria were also found in arid soil with sand contents of 65–85% [68], similar to that obtained in this research. Indeed, 67% sand (soil texture 2.0–0.05 mm) was recorded in F2 and 92% in F3.

4.4. Relationships between Bacterial Community and Physicochemical and Biological Parameters of Fluvisols

Correlations between the amounts of isolated DNA from the soil, microorganisms’ abundance, the activity of dehydrogenase, and total organic carbon contents were also obtained by other researchers [69]. For the Fluvisols examined, no such positive relationships were observed. However, we noted a negative statistically significant correlation (−1.000) between TC (total carbon) content and OTUs number. This is a very remarkable result that we did not expect. Data from the literature indicate a correlation between enzymatic activity, biomass content, and soil pH [46,49]. However, in our research, the pH did not correlate significantly with any defined parameter.
Numerous studies have shown that in the presence of certain metals (e.g., Cu, Zn, Pb, Ni, Ca, and Fe), the diversity and richness of bacteria can be reduced [70]. However, bacteria from Proteobacteria are favoured in stress-causing environments and are capable of transforming certain metals [71]. Therefore, the obtained correlation of their presence with lead, zinc and copper is not surprising. The negative correlation of Actinobacteria with some metals confirms that these are sensitive to contamination and increased metal content in the soil [72].
Correlations between the structural diversity of the microbiome and its functional diversity have also been noted by other researchers [6,73]. Also, in this research, we have shown the relationship between the bacterial community structure and their metabolic potential. A strong positive correlation (1.000) between the AWCD index and bacterial phyla number would indicate that if there were more different bacterial phyla, the AWCD index would be higher. Thus, in the case of F3, we identified 13 different phyla and, at the same time, the highest AWCD (equal to 1.83) compared to other soils—the phyla number was 12 for F2 and nine for F1, while AWCD was 1.66 and 1.13, respectively. The soil properties specified in this research influenced the functionality of soil bacteria. Similar correlations between soil quality parameters and EcoPlate™ analysis results were observed in other soils of Poland [74,75].

4.5. What Can Be Responsible for Differences between Microbiomes in the Examined Fluvisoils?

It is commonly claimed that the greater species diversity of soil microorganisms determines the higher soil fertility [76]. In analysing the quality of the soils examined as well as the diversity and metabolic activity of the microorganisms inhabiting them, we did not obtain the expected positive correlation. These results are very interesting and it is challenging to understand how microbial ecosystems work.
Many natural and anthropogenic factors can influence soil fertility and microbial community. They should be considered in the interpretation of the results concerning the soil microbiome. Some of them, such as pH, soil texture, and metal content, are discussed above. Temperature, precipitation, and other climatic events also may affect the community of soil microorganisms [77,78]. In this research, soils F2 and F3 were collected from the same locality and therefore were exposed to similar weather conditions. Moreover, all three locations were flooded with the same river water, from the Vistula River, as a result of the flood that occurred in Lubelskie Voivodeship in 2010 [79]. Therefore, the differences between the examined soils cannot be explained by the climatic conditions. Human activity, especially agriculture, is a factor influencing the soil environment and its microbiome [5]. Also, this aspect does not explain the high variability of the recorded results, because all investigated objects were grasslands, not fertilised, and not under grazing.
Differences in the number and diversity of bacteria in the soil may be caused by the structure of the soil microbiome itself. Researchers have shown that more than 80% of microbial cells in the soil are inactive and their activity is initiated under specific environmental conditions [80]. As a consequence, the detection of a specific species genome in the soil sample does not necessarily indicate its activity [80]. In this research, it was shown that in soil F3, which was characterised by the lowest values of physicochemical parameters, the diversity and metabolic activity of bacteria was the highest among the examined samples. This could indicate the presence of many inactive bacterial forms—endospores, which consist of the bacterium’s DNA. In F3, the lowest activity of dehydrogenases was also observed, which would be compliant with the above hypothesis because they occur intracellularly in living microbial cells [69]. The high activity of microorganisms from soil F3 recorded on EcoPlatetTM can be related to the availability of specific carbon sources in which the soil is deficient. It is also necessary to consider that the method using EcoPlatetTM determined the metabolic potential of the microorganisms from the analysed sample and not the actual activity [81]. When the environment becomes more favourable, the endospore can reactivate itself to the vegetative state. Thus, it can be expected that the availability of substrates and optimal temperature provide for the reactivated endospore its vegetative form. Soil F1 can be considered fertile based on physico–chemical parameters (organic matter, and carbon and nitrogen contents) and enzymatic activity. At the same time, the lowest diversity of bacteria in this soil and their low metabolic activity using EcoPlate™ were shown. It has been suggested that the basic metabolic processes in the soil, such as respiration, carbon cycle, organic matter mineralization, and nutrient cycle, are conducted by most, if not all, microorganisms in the soil [82]. It can be supposed that the lower diversity of bacteria in soil F1 does not negatively influence the basic processes occurring in it. However, after using specific carbon sources (EcoPlate™), a lower metabolic activity was obtained in comparison to other soils, probably due to the absence of microorganisms performing specialised functions.
The large microbial diversity in the soil enables the maintenance of ecosystem functions, even under stressful conditions [83]. Conversely, in soils with poor microbial diversity, even a small loss of species may expose the environment to functional changes [54]. In the discussed soils, differences in the structure and activity of the microorganisms inhabiting them may be important during the periodical floods. This is a subject deserving of further consideration.
The complexity of the soil ecosystem continues to be a challenge for researchers. Relationships between individual elements of the soil environment, i.e., microorganisms, plants, enzymatic activity, soil type, pH, nutrient content, and other physico–chemical parameters, are the current issue of research [10].

5. Conclusions

The results demonstrate significant differences between the Fluvisols studied, both regarding physico–chemical and biological parameters, as well as the structure and functionality of soil microbiomes. Based on physico–chemical (total carbon and nitrogen content, organic matter content, organic carbon content) and biological parameters (dehydrogenase activity, phosphatase activity, glomalin content, and microbial biomass carbon and nitrogen contents), it can be concluded that F1 was the more fertile and biologically active soil. However, considering the metabolic potential, F3 had the highest activity and F2 the highest metabolic diversity of the microbial community. Analysing the results from NGS, we recorded the highest number of OTUs (operational taxonomic units) and unique bacterial genera in F3.
It can be assumed that a greater diversity of microorganisms and their varied metabolic potential is not directly related to soil fertility, defined as high enzymatic activity and nutrient content. In Fluvisols with higher values of the biological and physical–chemical parameters determined, there may have been more biomass than in other soils, however, this concerns a less diversified microcosm, based on the dominant microorganisms. In Fluvisols with less fertility, greater microbiological diversity was found, probably due to the fact that a larger group of microorganisms is required to maintain the stability of the soil environment under less favourable conditions and that a significant part of the microorganisms is present in spore-form. However, this hypothesis is difficult to confirm based on the current results.
The complexity of the interaction between microorganisms and the soil environment is still not sufficiently understood.

Author Contributions

methodology; analysis, K.F., J.G. and J.N.; data curation, K.F. and A.G.; writing—original draft preparation, K.F. and J.G.; review and editing, K.F., A.G., J.G. and J.N.; visualization, J.G. and K.F.; project administration, K.F and A.G.

Funding

The research was conducted within the grant for young scientists in IUNG-PIB (MNiSW): Influence of summer floods on changes in structural and functional biodiversity of microbiomes of selected river muds (2018) and by the statutory activity of IUNG—PIB (3.12).

Conflicts of Interest

The authors declare no conflict of interest.

References

  1. Li, P.; Zhang, T.; Wang, X.; Yu, D. Development of biological soil quality indicator system for subtropical China. Soil Tillage Res. 2013, 126, 112–118. [Google Scholar] [CrossRef]
  2. Lemaire, G.; Franzluebbers, A.; Carvalho, P.C.; Dedieu, B. Integrated crop-livestock system: Strategies to achieve synergy between agricultural production and environmental quality. Agric. Ecosyst. Environ. 2014, 190, 4–8. [Google Scholar] [CrossRef]
  3. Handelsman, J.; Rondon, M.R.; Brady, S.F.; Clardy, J.; Goodman, R.M. Molecular biological access to the chemistry of unknown soil microbes: A new frontier for natural products. Chem. Biol. 1998, 5, 245–249. [Google Scholar] [CrossRef]
  4. Kozdrój, J. Metagenome—A new source of information about soil microorganisms. Postępy Mikrobiologii 2013, 52, 185–200. (In Polish) [Google Scholar]
  5. Nannipieri, P.; Ascher, J.; Ceccherini, M.T.; Landi, L.; Pietramellara, G.; Renella, G. Microbial diversity and soil functions. Eur. J. Soil Sci. 2003, 54, 655–670. [Google Scholar] [CrossRef]
  6. Grządziel, J.; Gałązka, A. Microplot long-term experiment reveals strong soil type influence on bacteria composition and its functional diversity. Appl. Soil Ecol. 2018, 124, 117–123. [Google Scholar] [CrossRef]
  7. Gałązka, A.; Furtak, K. Functional microbial diversity in context to agriculture. In Advances in Microbial Diversity in Genomic Era; Das, S., Dash, H.R., Eds.; Academic Press, Elsevier Inc.: Cambridge, MA, USA, 2019; pp. 347–358. [Google Scholar] [CrossRef]
  8. Furtak, K.; Gajda, A.M. Biochemical methods for the evaluation of the functional and structural diversity of microorganisms in the soil environment. Postępy Mikrobiologii 2018, 57, 194–202. (In Polish) [Google Scholar]
  9. Gajda, A.M.; Furtak, K. Measuring the Effects of Farming Systems on Physical, Chemical and Microbiological Parameters of Soil Quality. In Novel Methods and Results of Landscape Research in Europe, Central Asia and Siberia Vol. 1, Landscapes in the 21th Century: Status Analyses. Basic Processes and Research Concepts; Sychev, V.G., Mueller, L., Eds.; Publishing House FSBSI “Pryanishnikov Institute of Agrochemistry”: Moscow, Russia, 2018; pp. 212–217. [Google Scholar] [CrossRef]
  10. Gałązka, A.; Łyszcz, M.; Abramczyk, B.; Furtak, K.; Grządziel, J.; Czaban, J.; Pikulicka, A. Biodiversity of soil environment—Overview of parameters and methods in soil biodiversity analyses. In Proceedings of the Monografie i Rozprawy Naukowe IUNG-PIB, Puławy, Poland, 14–15 September 2016. (In Polish). [Google Scholar]
  11. Harasimuk, M.; Domonik, A.; Machalski, M.; Pinińska, J.; Warowna, J.; Szymkowiak, A. Małopolska Gap of Vistula River—Projected geopark. Prz. Geol. 2011, 59, 405–416. (In Polish) [Google Scholar]
  12. Kot, J.; Kucharczyk, M. Pilot Programmes for Management of Natura 2000 Areas “Lesser Poland Gorge of the Vistula”, “Małopolska Gap of Vistula” and “Valley of Zwolenka”; Infrastruktura i ekologia terenów wiejskich, Polska Akademia Nauk, Oddział w Krakowie: Krakow, Poland, 2006; pp. 55–66. (In Polish) [Google Scholar]
  13. Natura 2000. Available online: http://natura2000.eea.europa.eu/ (accessed on 11 January 2019).
  14. Malinowski, R. Charecteristic of physical and oxy-redox properties of some alluvial soils of the Cedynia Landscape Park Polder. Folia Univ. Agric. Stetin. 2007, 259, 91–102. (In Polish) [Google Scholar]
  15. Banach-Szott, M.; Kondratowicz-Maciejewska, K.; Kobierski, M. Humic substances in Fluvisols of the Lower Vistula floodplain, North Poland. Environ. Sci. Pollut. Res. 2018, 25, 23992–24002. [Google Scholar] [CrossRef]
  16. Özcan, H. Fluvisols. In The Soils of Turkey; World Soils Book Series; Kapur, S., Akça, E., Günal, H., Eds.; Springer International Publishing AG: Cham, Switzerland, 2018; pp. 129–137. [Google Scholar]
  17. Climate-Data.org. Available online: https://pl.climate-data.org (accessed on 11 January 2019).
  18. Litynski, T.; Jurkowska, H.; Gorlach, E. Chemical and Agricultural Analysis; Wydawnictwo Naukowe PWN: Warszawa, Polska, 1976. (In Polish) [Google Scholar]
  19. Czyż, E.A.; Dexter, A.R.; Terelak, H. Content of readily-dispersible clay in the arable layer of some Polish soils. Adv. Geoecol. 2002, 35, 115–124. [Google Scholar]
  20. DIN/ISO 13878:1998. Soil Quality—Determination of Total Nitrogen Content by Dry Combustion (“Elemental Analysis”); American National Standards Institute: Washington, DC, USA, 2007. [Google Scholar]
  21. Ostrowska, A.; Gawliński, S.; Szczubiałka, Z. Methods of Analysis and Assessment of Soil and Plant Properties. Catalogue; Dział wydawnictw IOŚ: Warszawa, Poland, 1991. (In Polish) [Google Scholar]
  22. Casida, L.; Klein, D.; Santoro, T. Soil Dehydrogenase Activity. Soil Sci. 1964, 98, 371–376. [Google Scholar] [CrossRef]
  23. Tabatabai, M.A. Soil enzymes. In Methods of Soil Analysis; Part 2; Page, A.L., Miller, R.H., Keeney, D.R., Eds.; American Society of Agronomy and Soil Science Society of America: Madison, WI, USA, 1982. [Google Scholar]
  24. PN-ISO 1038-6:1998. Soil Quality—Determination of Soil Microbial Biomass—Part 2: Fumigation-Extraction Method; American National Standards Institute: Washington, DC, USA, 2007. [Google Scholar]
  25. Weber, K.P.; Legge, R.L. One-dimensional metric for tracking bacterial community divergence using sole carbon source utilization patterns. J. Microbiol. Methods 2009, 79, 55–61. [Google Scholar] [CrossRef] [PubMed]
  26. Insam, H.; Goberna, M. Use of Biolog R for community level physiological profiling (CLPP) of environmental samples. In Molecular Microbial Ecology Manual, 2nd ed.; Kowalchuk, G.A., de Brujin, F.J., Head, I.M., Akkermans, A.D., van Elsas, J.D., Eds.; Kluwer Academic Publishers: Dordrecht, The Netherlands, 2004; pp. 853–860. [Google Scholar]
  27. Klindworth, A.; Pruesse, E.; Schweer, T.; Peplies, J.; Quast, C.; Horn, M.; Glöckner, F.O. Evaluation of general 16S ribosomal RNA gene PCR primers for classical and next-generation sequencing-based diversity studies. Nucleic Acids Res. 2013, 41, 1–13. [Google Scholar] [CrossRef] [PubMed]
  28. Callahan, B.J.; McMurdie, P.J.; Rosen, M.J.; Han, A.W.; Johnson, A.J.A.; Holmes, S.P. DADA2: High-resolution sample inference from Illumina amplicon data. Nat. Methods 2016, 13, 581–583. [Google Scholar] [CrossRef] [PubMed] [Green Version]
  29. R Core Team. R: A Language and Environment for Statistical Computing. 2016. Available online: https://www.r-project.org/ (accessed on 5 February 2019).
  30. Wang, Q.; Garrity, G.M.; Tiedje, J.M.; Cole, J.R. Naive Bayesian Classifier for Rapid Assignment of rRNA Sequences into the New Bacterial Taxonomy. Appl. Environ. Microbiol. 2007, 73, 5261–5267. [Google Scholar] [CrossRef] [PubMed]
  31. McMurdie, P.J.; Holmes, S. Phyloseq: An R Package for Reproducible Interactive Analysis and Graphics of Microbiome Census Data. PLoS ONE 2013, 8, e61217. [Google Scholar] [CrossRef] [PubMed]
  32. Garland, J.L.; Millis, A.L. Classification and characterization of heterotrophic microbial communities on the basis of patterns of community-level sole-carbon-source utilization. Appl. Environ. Microbiol. 1991, 57, 2351–2359. [Google Scholar]
  33. Hill, T.C.J.; Walsh, K.A.; Harris, J.A.; Moffett, B.F. Using ecological diversity measures with bacterial communities. FEMS Microbiol. Ecol. 2003, 43, 1–11. [Google Scholar] [CrossRef]
  34. Zak, J.; Willig, M.; Moorhead, D.; Wildman, H. Functional diversity of microbial communities: A quantitative approach. Soil Biol. Biochem. 1994, 26, 1101–1108. [Google Scholar] [CrossRef]
  35. Jałowiecki, L.; Chojniak, J.M.; Dorgeloh, E.; Hegedusova, B.; Ejhed, H.; Magner, J.; Plaza, G.A. Microbial Community Profiles in Wastewaters from Onsite Wastewater Treatment Systems Technology. PLoS ONE 2016, 11, e0147725. [Google Scholar] [CrossRef]
  36. Particle size distribution and textural classes of soils and mineral materials—Classification of Polish Society of Soil Science 2008. Roczniki Gleboznawcze Soil Sci. Annu. 2008, 60, 5–16.
  37. Nannipieri, P.; Grego, S.; Ceccanti, B. Ecological Significance of the Biological Activity in Soils; Marcel Dekker: New York, NY, USA, 1990. [Google Scholar]
  38. Preston-Mafham, J.; Boddy, L.; Randerson, P.F. Analysis of microbial community functional diversity using sole-carbon-source utilisation profiles—A critique. FEMS Microbiol. Ecol. 2002, 42, 1–14. [Google Scholar] [CrossRef]
  39. Derakshani, M.; Lukow, T.; Liesack, W. Novel bacterial lineages at the (sub)division level as detected by signature nucleotide-targeted recovery of 16S rRNA genes from bulk soil and rice roots of flooded rice microcosms. Appl. Environ. Microbiol. 2001, 67, 623–631. [Google Scholar] [CrossRef]
  40. Kobierski, M. Evaluation of the content of heavy metals in fluvisols of floodplain area depending on the type of land use. J. Ecol. Eng. 2015, 16, 23–31. [Google Scholar] [CrossRef]
  41. Journal of Laws 2002 No 165, item 1359; Dziennik Ustaw 2002. Rozporządzenie Ministra Środowiska, Żelichowski, S. z dn. 09.09.2002 w sprawie standardów jakości gleby oraz jakości ziemi. Dz. U. 2002, Nr 165, poz. 1359. Available online: http://prawo.sejm.gov.pl/isap.nsf/DocDetails.xsp? id=WDU200216 51359 (accessed on 20 May 2019).
  42. Beena, K.N.; Jaya, D.S. Evaluation of soil contamination in the surroundings of Kerala Minerals and Metals Limited (KMML) industrial area in Kollam District, Kerala, South India. J. Soil Sci. Environ. Manag. 2016, 7, 92–99. [Google Scholar] [CrossRef] [Green Version]
  43. Sowiński, P.; Glińska-Lewczuk, K.; Kalisz, B.; Astel, A. Distribution of heavy metals in soils in a postglacial river valley—A geochemical landscape approach. Environ. Eng. Manag. J. 2016, 15, 1323–1335. [Google Scholar] [CrossRef]
  44. Ou, Y.; Rousseau, A.N.; Wang, L.; Yan, B.; Gumiere, T.; Zhu, H. Identification of the alteration of riparian wetland on soil properties, enzyme activities and microbial communities following extreme flooding. Geoderma 2019, 337, 825–833. [Google Scholar] [CrossRef]
  45. Liu, B.; Huang, Q.; Su, Y.; Wang, M.; Kelly, R.M.; Sun, L. Speciation of nickel and enzyme activities in fluvo-aquic soil under organic amendments treatment. Soil Res. 2018, 56, 456–467. [Google Scholar] [CrossRef]
  46. Shuler, M.; Kargi, F. Bioprocess Engineering Basic Concepts; Prentice-Hall Incorporation: Englewood Cliffs, NJ, USA, 2010. [Google Scholar]
  47. Goenster, S.; Gründler, C.; Buerkert, A.; Joergensen, R.G. Soil microbial indicators across land use types in the river oasis Bulgan sum center, Western Mongolia. Ecol. Indic. 2017, 76, 111–118. [Google Scholar] [CrossRef]
  48. Acosta-Martínez, V.; Acosta-Mercado, D.; Sotomayor-Ramírez, D.; Cruz-Rodríguez, L. Microbial communities and enzymatic activities under different management in semiarid soils. Appl. Soil Ecol. 2008, 38, 249–260. [Google Scholar] [CrossRef]
  49. Furtak, K.; Gawryjołek, K.; Gajda, A.M.; Gałązka, A. Effects of maize and winter wheat grown in different cultivation techniques on biological activity of soil. Plant Soil Environ. 2017, 63, 449–454. [Google Scholar] [CrossRef]
  50. Gałązka, A.; Grządziel, J. Fungal Genetics and Functional Diversity of Microbial Communities in the Soil under Long-Term Monoculture of Maize Using Different Cultivation Techniques. Front. Microbiol. 2018, 9, 76. [Google Scholar] [CrossRef] [Green Version]
  51. Wolińska, A.; Frąc, M.; Oszust, K.; Szafranek-Nakonieczna, A.; Zielenkiewicz, U.; Stępniewska, Z. Microbial biodiversity of meadows under different modes of land use: Catabolic and genetic fingerprinting. World J. Microbiol. Biotechnol. 2017, 33, 154. [Google Scholar] [CrossRef]
  52. Jansson, J.K.; Hofmockel, K.S. The soil microbiome-from metagenomics to metaphenomics. Curr. Opin. Microbiol. 2018, 43, 162–168. [Google Scholar] [CrossRef]
  53. Torsvik, V.; Øvreås, L. Microbial diversity and function in soil: From genes to ecosystems. Curr. Opin. Microbiol. 2002, 5, 240–245. [Google Scholar] [CrossRef]
  54. Wagg, C.; Bender, S.F.; Widmer, F.; van der Heijden, M.G.A. Soil biodiversity and soil community composition determine ecosystem multifunctionality. Proc. Natl. Acad. Sci. USA 2014, 111, 5266–5270. [Google Scholar] [CrossRef] [Green Version]
  55. Delgado-Baquerizo, M.; Oliviero, A.M.; Brewer, T.E.; Benavent-González, A.; Eldridge, D.J.; Bardgett, R.D.; Maestre, F.T.; Singh, B.K.; Fierer, N. A global atlas of the dominant bacteria found in soil. Science 2018, 359, 320–325. [Google Scholar] [CrossRef] [Green Version]
  56. Girvan, M.S.; Billimore, J.; Pretty, J.N.; Osborn, A.M.; Ball, A.S. Soil type is the primary determinant of the composition of the total and active bacterial communities in arable soils. Appl. Environ. Microbiol. 2003, 69, 1800–1809. [Google Scholar] [CrossRef]
  57. Ma, F.; Wu, J.; Wang, L.; Yang, J.; Li, S.; Li, Z.; Zhag, X. Characterization of the microbial community in the rhizosphere of Phragmites australis (cav.) trin ex steudel growing in the Sun Island Wetland. Water Environ. Res. 2010, 86, 258–268. [Google Scholar] [CrossRef]
  58. Rousk, J.; Brookes, P.C.; Bååth, E. Contrasting soil pH effects on fungal and bacterial growth suggest functional redundancy in carbon mineralization. Appl. Environ. Microbiol. 2009, 75, 1589–1596. [Google Scholar] [CrossRef]
  59. Brochier-Armanet, C.; Boussau, B.; Gribaldo, S.; Forterre, P. Mesophilic crenarchaeota: Proposal for a third archaeal phylum, the Thaumarchaeota. Nat. Rev. Microbiol. 2008, 6, 245–252. [Google Scholar] [CrossRef]
  60. Pester, M.; Schleper, C.; Wagner, M. The Thaumarchaeota: An emerging view of their phylogeny and ecophysiology. Curr. Opin. Microbiol. 2011, 14, 300–306. [Google Scholar] [CrossRef]
  61. Fierer, N.; Jackson, R.B. The diversity and biogeography of soil bacterial communities. Proc. Natl. Acad. Sci. USA 2006, 103, 626–631. [Google Scholar] [CrossRef] [Green Version]
  62. Zhang, M.M.; Wang, N.; Hu, Y.B.; Sun, G.Y. Changes in soil physicochemical properties and soil bacterial community in mulberry (Morus alba L.)/alfalfa (Medicago sativa L.) intercropping system. Microbiol. Open 2018, 7, e00555. [Google Scholar] [CrossRef]
  63. Masse, J.; Prescott, C.E.; Renaut, S.; Terrat, Y.; Grayston, S.J. Plant community and nitrogen deposition as drivers of alpha and beta diversities of prokaryotes in reconstructed oil sand soils and natural boreal forest soils. Appl. Environ. Microbiol. 2017, 83, e03319-16. [Google Scholar] [CrossRef]
  64. Hansel, C.M.; Fendorf, S.; Jardine, P.M.; Francis, C.A. Changes in bacterial and archaeal community structure and functional diversity along a geochemically variable soil profile. Appl. Environ. Microbiol. 2008, 74, 1620–1633. [Google Scholar] [CrossRef]
  65. Wang, N.F.; Zhang, T.; Zhang, F.; Wang, E.T.; He, J.F.; Ding, H.; Zhang, B.T.; Liu, J.; Ran, X.B.; Zang, J.Y. Diversity and structure of soil bacterial communities in the Fildes Region (maritime Antarctica) as revealed by 454 pyrosequencing. Front. Microbiol. 2015, 6, 1188. [Google Scholar] [CrossRef] [Green Version]
  66. Laiz, L.; Miller, Z.; Jurado, V.; Akatova, E.; Sanchez-Moral, S.; Gonzalez, J.M.; Dionísio, A.; Macedo, M.F.; Saiz-Jimenez, C. Isolation of five Rubrobacter strains from biodeteriorated monuments. Naturwissenschaften 2009, 96, 71–79. [Google Scholar] [CrossRef]
  67. Norman, J.S.; King, G.M.; Friesen, M.L. Rubrobacter spartanus sp. nov., a moderately thermophilic oligotrophic bacterium isolated from volcanic soil. Int. J. Syst. Evol. MIcrobiol. 2017, 67, 3597–3602. [Google Scholar] [CrossRef]
  68. Kuske, C.R.; Yeager, C.M.; Johnson, S.; Ticknor, L.O.; Belnap, J. Response and resilience of soil biocrust bacterial communities to chronic physical disturbance in arid shrublands. ISME J. 2011, 6, 886–897. [Google Scholar] [CrossRef] [Green Version]
  69. Wolińska, A.; Stępniewska, Z.; Szymańska, E. Dehydrogenase activity of soil microorganisms and the total DNA level in soil of different use. J. Agric. Sci. Technol. B 2013, 3, 613–622. [Google Scholar]
  70. Park, J.E.; Lee, B.T.; Kim, B.Y.; Son, A. Bacterial community analysis of stabilized soils in proximity to an exhausted mine. Environ. Eng. Res. 2018, 23, 420–429. [Google Scholar] [CrossRef] [Green Version]
  71. Sheik, C.S.; Mitchell, T.W.; Rizvi, F.Z.; Rehman, Y.; Faisal, M.; Hasnain, S.; McInerney, M.J.; Krumholz, L.R. Exposure of soil microbial communities to chromium and arsenic alters their diversity and structure. PLoS ONE 2012, 7, e40059. [Google Scholar] [CrossRef]
  72. Hur, M.; Kim, Y.; Song, H.R.; Kim, J.M.; Choi, Y.I.; Yi, H. Effect of genetically modified poplars on soil microbial communities during the phytoremediation of waste mine tailings. Appl. Environ. Microbiol. 2011, 77, 7611–7619. [Google Scholar] [CrossRef]
  73. Flores-Rentería, D.; Rincón, A.; Valladares, F.; Yuste, J.C. Agricultural matrix affects differently the alpha and beta structural and functional diversity of soil microbial communities in a fragmented Mediterranean holm oak forest. Soil Biol. Biochem. 2016, 92, 79–90. [Google Scholar] [CrossRef]
  74. Gałązka, A.; Gawryjołek, K.; Grządziel, J.; Frąc, M.; Księżak, J. Microbial community diversity and the interaction of soil under maize growth in different Cultivation techniques. Plant Soil Environ. 2017, 63, 264–270. [Google Scholar] [CrossRef]
  75. Grządziel, J.; Furtak, K.; Gałązka, A. Community-level physiological profiles of microorganisms from different types of soil that are characteristic to Poland—A long-term Microplot experiment. Sustainability 2019, 11, 56. [Google Scholar] [CrossRef]
  76. Johns, C. Living Soils: The Role of Microorganisms in Soil Health. Strategic Analysis Paper. Future Directions International Pty Ltd. Available online: http://www.futuredirections.org.au/publication/ living-soils-role-microorganisms-soil-health/ (accessed on 23 June 2019).
  77. Li, G.; Kim, S.; Park, M.; Son, Y. Short-term effects of experimental warming and precipitation manipulation on soil microbial biomass C and N, community substrate utilization patterns and community composition. Pedosphere 2017, 27, 714–724. [Google Scholar] [CrossRef]
  78. Yan, N.; Marschner, P.; Cao, W.; Zuo, C.; Qiun, W. Influence of salinity and water content on soil microorganisms. Int. Soil Water Conserv. Res. 2015, 3, 316–323. [Google Scholar] [CrossRef] [Green Version]
  79. Bednarek, W.; Dresler, S.; Tkaczyk, P.; Hanaka, A. Physicochemical Properties of surface soil layer after the flood in the middle Vistula river valley. J. Elementol. 2014, 19, 17–29. [Google Scholar] [CrossRef]
  80. Lennon, J.T.; Jones, S.E. Microbial Seed Banks: The Ecological and Evolutionary Implications of Dormancy. Nat. Rev. Microbiol. 2011, 9, 119–130. [Google Scholar] [CrossRef]
  81. Ross, M.; Goberna, M.; Pascual, J.A.; Klammer, S.; Insam, H. 16S rDNA analysis reveals low microbial diversity in community level physiological profile assays. J. Microbiol. Methods 2008, 72, 221–226. [Google Scholar] [CrossRef]
  82. Griffiths, B.S.; Ritz, K.; Bardgett, R.D.; Cook, R.; Christensen, S.; Ekulund, F.; Sørensen, S.J.; Bååth, E.; Bloem, J.; de Ruiter, P.C.; et al. Ecosystem response of pasture soil communities to fumigation-induced microbial diversity reductions: An examination of the biodiversity-ecosystem function relationship. Oikos 2000, 90, 279–294. [Google Scholar] [CrossRef]
  83. Wertz, S.; Degrange, V.; Prosser, F.P.; Commeauc, C.; Guillaumaud, N.; Le Roux, X. Decline of soil microbial diversity does not influence the resistance and resilience of key soil microbial functional groups following a model disturbance. Environ. Microbiol. 2007, 9, 2211–2219. [Google Scholar] [CrossRef]
Figure 1. Location of the Vistula River Gorge of Lesser Poland on the map of Poland (photo on the right) and the area of soil sampling for research (photo on the left).
Sustainability 11 03929 g001
Figure 2. Enzymatic activity in three Fluvisols: (A) dehydrogenases (DHa); (B) Activity of phosphatases: AcP—acid phosphatase (green columns), AlP—alkaline phosphatase (blue columns); different letters (a–c) indicate values with a significant difference at p < 0.05 (n = 3) by Tukey’s HSD test; vertical bars represent the standard error (SE).
Sustainability 11 03929 g002
Figure 3. EcoPlate™ substrate utilisation during 120 h of incubation (average from n = 3); lack of or low utilisation is represented by a dark blue colour; the gradient from light blue to red represents positive utilisation; the colour key scale (from −2 to 2) for each substrate is based on dye reduction, quantified by Omnilog units.
Sustainability 11 03929 g003
Figure 4. Percentage of utilisation of particular carbon substrate groups (PCSG) by microbial communities after 120 h of incubation (average from n = 3); five groups of substrates: AA—amino acids (n = 6), AMAD—amines and amides (n = 2), CH—carbohydrates (n = 10), CXA—carboxylic acids (n = 9), PL—polymers (n = 4).
Sustainability 11 03929 g004
Figure 5. Bacterial community structure in the different Fluvisols based on next generation sequencing: (A) relative abundance of phyla; classifications with less than 1.0% abundance are summarised under the artificial category “other”; (B) 10 classes of greatest relative abundance; (C) relative abundance of other 19 classes; (D) most abundant genera in samples (17); (E) relative abundance of next 22 genera.
Sustainability 11 03929 g005
Figure 6. Venn diagram of the overlapping bacteria genera from different Fluvisols.
Sustainability 11 03929 g006
Figure 7. Pearson’s correlation coefficients among biological properties of the Fluvisols examined; the values indicated in red are a negative correlation, and those in blue are a positive correlation; the values marked in bold and ‘*’ are statistically significant at p < 0.05 (n = 3), the number of degrees of freedom (df) = 1, statistically significant values must be greater than 0.9969; E—evenness index; AlP—alkaline phosphatase; MBN—microbial biomass nitrogen; MBC—microbial biomass carbon; AcP—acid phosphatase; TC—total carbon; TN—total nitrogen; OC—organic carbon; DHa—dehydrogenase activity; PL—polymers; AA—amino acids; CH—carbohydrates; H’—Shannon diversity index; CXA—carboxylic acid; R—richness index; OTUs number—number of all identified bacterial operational taxonomic units in Fluvisols; AMAD—amines and amides; AWCD—average well colour development; Phyla number—number of identified bacterial phyla in Fluvisols; data obtained from the EcoPlate™ after 120 h of incubation.
Sustainability 11 03929 g007
Figure 8. Principal component analysis (PCA): (A) metals contents, physical–chemical soil parameters, enzymatic activity, and distance from the riverbed; (B) indexes and data obtained from EcoPlate™ and bacterial phyla; (C) bacterial phyla and biological and physical–chemical parameters of soil; (D) bacterial phyla and metals contents. Explanations of abbreviations as in Figure 7.
Sustainability 11 03929 g008
Table 1. Soil samples used in the experiment.
AbbreviationLocationGPS CoordinatesDistance from the Riverbed
F1Wojszyn, Puławy County51°20’03.4″ N
21°56’43.2″ E
525 m
F2Janowiec (1), Puławy County51°19’29.9″ N
21°55’19.2″ E
80 m
F3Janowiec (2), Puławy County51°19’14.4″ N
21°54’42.9″ E
225 m
Table 2. Formulae used to calculate indices based on Biolog microplates data.
IndexFormula and DescriptionReferences
AWCD
(average well color development)
AWCD = ( C R ) / n [32]
C—reading of the well OD590;
R—reading of the control well OD590;
n—number of substrates on an EcoPlate™ (n = 31).
Shannon diversity
(H’)
H = i = 1 N p i ( l n p i ) [33]
pi—proportional color development of the well over the total colour development of all wells (96) of a plate;
n—number of substrates on an EcoPlate™ (n = 31).
Shannon evenness
(E)
E = H / l n R [34]
R—substrate utilization richness (the number of wells with colour development)
Richness
(R)
The number of wells with color development—number of utilised substrates with OD590 ≥ 0.25[35]
Table 3. Selected physical and chemical properties of the examined soil (0–20 cm depth).
Soil SampleSoil Texture, mm (%)Textural ClassespHKClRDC (g 100g−1 soil)TC (%)OC (%)TN (%)OM (%)
2.0–0.050.05–0.002<0.002USDA 1PTG 2
F158384SLgp6.960.16 a3.55 ± 0.02 a2.78± 0.04 a0.28± 0.05 a4.79± 0.06 a
F267303SLgp6.940.32 a2.07 ± 0.01 b1.72± 0.02 b0.17± 0.01 b2.96± 0.03 b
F39280Spl6.75n.d.*0.61 ± 0.01 c0.57± 0.02 c0.06± 0.01 c0.98± 0.04 c
1 according to USDA classification: SL—sandy loam, S—sand; 2 according to the Polish System of Soil Classification 2008 [36]: gp—glina piaszczysta (sandy loam), pl—piasek luźny (sand); RDC—readily dispersible clay; TC—total carbon content; OC—organic carbon content; TN—total nitrogen content; OM—organic matter content; means ± standard deviation (SD); different letters (a–c) in the columns indicate values with significant difference at p < 0.01 (n = 3) by Tukey’s honest significant difference (HSD) test.
Table 4. Trace elements contents (g kg−1 soil) in the examined Fluvisols.
Soil SampleMetal Content (g kg−1 soil)
AlBaCaCoCuCrFeKLiMgMnPbZn
F137.28 ± 0.490.21 ± 0.0015.25 ± 0.100.02 ± 0.000.05 ± 0.000.09 ± 0.0032.77 ± 0.018.83 ± 0.060.04 ± 0.008.55 ± 0.011.35 ± 0.000.06 ± 0.000.48 ± 0.00
F227.17 ± 0.070.15 ± 0.007.47 ± 0.010.01 ± 0.000.03 ± 0.000.06 ± 0.0020.42 ± 0.427.17 ± 0.070.02 ± 0.005.37 ± 0.070.79 ± 0.020.03 ± 0.000.22 ± 0.00
F38.75 ± 0.190.05 ± 0.001.36 ± 0.020.00 ± 0.000.01 ± 0.000.02 ± 0.006.58 ± 0.062.57 ± 0.020.01 ± 0.001.43 ± 0.010.23 ± 0.000.01 ± 0.000.04 ± 0.00
Values are the average of three replicates (n = 3); means ± standard deviation (SD).
Table 5. Microbial biomass carbon (MBC) and nitrogen (MBN) contents (µgN/C g−1 d.m. of soil) in three Fluvisols.
Soil SampleMBC
(µgC g−1 d.m. of soil)
MBN
(µgN g−1 d.m. of soil)
F1574.67 ± 13.3 a105.09 ± 4.5 a
F2191.11 ± 6.7 b32.95 ± 2.2 b
F384.36 ± 9.7 c11.42 ± 1.2 c
The values are the average of three replicates (n = 3); means ± standard deviation (SD); treatment means marked with different letters (a–c) in the columns are significantly different at p < 0.05 (n = 3) by Tukey’s HSD test.
Table 6. Indexes of microbial metabolic potential calculated for data obtained from the EcoPlate™ after 120 h of incubating.
Soil SampleAWCDH’ER
F11.13 ± 0.08 b3.35 ± 0.02 a0.94 ± 0.01 a29.33 ± 0.58 a
F21.66 ± 0.11 a3.38 ± 0.02 a0.86 ± 0.01 b30.33 ± 0.58 a
F31.83 ± 0.06 a3.35 ± 0.02 a0.83 ± 0.00 c29.67 ± 0.58 a
Means ± standard deviation (SD); treatment means in the columns marked with different letters (a–c) are significantly different at p < 0.05 (n = 3) by Tukey’s HSD test; AWCD—average well colour development, H’—Shannon diversity index, E—Shannon evenness index, R—substrate richness index.

