A Complex Network Method in Criticality Evaluation of Air Quality Standards


1
School of Business Administration, Zhongnan University of Economics and Law, Wuhan 430073, China
2
School of Public Finance and Taxation, Zhongnan University of Economics and Law, Wuhan 430073, China
3
Research Center for Environment and Health, Zhongnan University of Economics and Law, Wuhan 430073, China
*
Author to whom correspondence should be addressed.
Sustainability 2019, 11(14), 3920; https://doi.org/10.3390/su11143920
Submission received: 11 June 2019
/
Revised: 11 July 2019
/
Accepted: 15 July 2019
/
Published: 18 July 2019
(This article belongs to the Special Issue Characteristics, Health Risk Assessment and Sustainable Management of Air Pollutants in Asia)
Abstract
:In recent years, poor air quality has brought serious threats to public health and sustainable development. The air quality standard is an effective prerequisite to ensure the quality of the air. The citation relationships between air quality standards at a certain time point, which reflect technological development and knowledge transition, form a complex network. In this study, an integrated multi-criteria decision making method is proposed to measure the criticality of standards based on a dynamic citation network model. In particular, the Entropy Weight (EW) method is used to set the weights of each node measurement to avoid subjectiveness, while the TOPSIS method is employed to measure the criticality for each air quality standard. A case study based on the data of 444 of China’s national air quality standards reveals that the complex network method facilitates the identification of critical standards effectively. In addition, we found that there exist some structural problems in China’s air quality standard system: the connectivity between standards is insufficient; critical standards are lacking; and the critical standards change over time following the issue of national policies. Finally, policy suggestions are recommended on strengthening inter-standard citation, attaching importance to the revision of critical standards, and the dynamics of critical standards.
1. Introduction
Air is an essential element of human living environment. High quality air is one of the necessary conditions to promote people’s healthy life and the steady growth of the urban economy. In recent years, with the rapid growth of the population and the acceleration of urbanization, environmental pressure in developing countries has increased significantly [1,2,3,4], killing more people worldwide than AIDS, malaria, breast cancer, or tuberculosis. Taking China as an example, the extensive development mode of “high pollution and high energy consumption” has brought serious damage to the ecological environment with high concentrations of sulfur dioxide (SO) and total suspended particles (TSP) for many years [5]. In 2017, the air quality in 239 Chinese cities exceeded environmental air quality standards, accounting for . In order to solve air quality problems effectively, governments have taken a variety of measures, among which air quality standards are an effective guarantee for mitigating air quality risks. In 2012, China adopted the Ambient Air Quality Standards and began the development of a national Air Reporting System that includes 945 sites in 190 cities [6]. Specifically, air quality standards impose strict requirements on production, transportation, and construction activities. An important problem naturally arises: How should we construct a well-planned air quality standard system? The structure of a system is a basis for realizing specific functions [7]. This motivates us to explore the structural problem of China’s air quality standard system aiming to mitigate the public risks brought by air pollution.
China’s environmental air quality standard system has gone through substantial changes over the past 30 years. However, similar to other standard systems, there are still some structural problems, such as standards lacking, aging, repeating, and contradiction [8], which make the standard system unreasonable, impacting economic development. Due to the complexity of standard systems, which are composed of heterogeneous components and numerous citation edges, we can hardly know which standards should be updated or abandoned. In the process of drafting new standards, it is difficult to identify the target standards that should be carefully reviewed or cited to optimize the structure of the standard system. The main bottleneck for addressing these problems is that effective methods to assess the significance of standards are lacking, because the use of traditional quantitative or qualitative methods, such as AHP (Analytic Hierarchy Process) and ANP (Analytic Network Process) [9], is relatively lacking data, subjective, or time-consuming.
The challenges in assessing the significance or criticality of air quality standards lie in two main aspects. Firstly, the importance of air quality standards should be multi-dimensional and comprehensive, which cannot be measured by a single measurement. The construction of the measurement system is very important. Secondly, due to the promulgation and abolition of air quality standards, the structure of the standard network is essentially dynamic. Consequently, the sets of critical nodes also evolve over time. We need methods/algorithms to extract critical standards in such a dynamic network.
To address the aforementioned challenges, this paper develops a dynamic network model based on the citation relationships between standards over different periods to facilitate the identification of critical standards. As the node significance in a network is multi-dimensional, we deliberately select a set of topological measurements [10], including degree centrality, betweenness centrality, clustering coefficient, and eccentricity. Since it is difficult to measure the relative importance of each measurement, we use the Entropy Weight (EW) method [11,12] to set the weights for these measurements, which overcomes the disadvantages of traditional methods based on subjective judgments, such as AHP/ANP [9]. Then, the TOPSIS (Technique for Order Preference by Similarity to an Ideal Solution) method is used to generate a comprehensive significance index for each standard based on the weighted attributes [13]. The set of critical standards over different stages can be identified by ranking the standards based on the comprehensive evaluation value. This integrated method can be readily implemented in standard systems in different industries. Since the standard system is dynamic by nature, we can analyze the evolutionary process of critical standards based on our dynamic network model.
The structure of this paper is organized as follows. In Section 2, the related literature is reviewed. In Section 3, a dynamic network model of China’s air quality standards citation network is constructed. In Section 4, the measurement system is introduced and the integrated multi-criteria decision making method is used to evaluate the importance of each air quality standard. The dynamic evolution of the critical air quality standards is investigated in Section 5. This paper is concluded in Section 6.
2. Literature Review
In this study, critical air quality standards are identified by employing the methods of social network analysis and of multi-attribute decision making. In the following, we will mainly review two streams of literature on air quality standards and social network analysis separately.
2.1. Air Quality Standards
Research on air quality mostly focuses on air quality monitoring, evaluation standards, and evaluation technologies; only a few scholars have investigated the implementation of air quality standards standards [14,15,16]. For example, Giannadaki et al. [17] estimated the possible results of the worldwide implementation of PM2.5 air quality standards in the European Union and the United States. Kelly et al. conducted a case study of time-series comprehensive regional monitoring of the implementation of national environmental air quality standards in the United States [18]. Nehr et al. discussed the standardization for indoor air quality [19]. To the best of our knowledge, there is a research gap on the research of the citation relationship between air quality standards, and there is no reasonable and operable method to measure the importance of standards in the network.
2.2. Citation Network Analysis
At present, citation network analysis methods are mainly used in the research on paper citation and patent citation, and there is a shortage on the research of standard citation. Due to the similarities in these three different types of citation networks, the theory and methods used in the patent citation network and paper citation network also apply to the standard citation network. As for the research on the paper citation network, Garfield initially used citation frequency to evaluate journal papers [20]. In 1976, the journal citation report published by the American Institute for Scientific Information (ISI) developed the impact factors to evaluate the importance of journals [21]. Nerur et al. [22] used social network measurements to analyze journal citation networks, which can identify important journals that export knowledge in the network and understand the flow of knowledge between journals. Calero-Medina and Noyons [23] developed a paper citation network model to analyze the development path of future research by collecting citation data between papers in specific fields from 1990–2005. Shibata et al. [24] constructed a paper citation network model and predicted the future research direction of the subject through the network measurements such as between centrality, core-edge, and cohesion subgroup. Garcia et al. [25] transformed the rules of the social influence of a paper in citation networks into mathematical equations and used cooperative game theory to predict the degree of social influence of academic papers generated by citation networks. Madani and Weber [26] carried out bibliomeasurement analysis and keyword-based network analysis on 143 papers.
The network analysis of the citation relationship and evolution between patent documents is the basis of patent technology evaluation, selection, prediction, and other activities. At the same time, knowledge transfer and diffusion between different technical organizations and fields can also be studied [27,28,29,30,31]. Narin [32] applied the method of citation analysis to the patent field for the first time, opening up a new field of patent document measurement. After that, Chang et al. [33] used the citation data of all commercial technology patents in the USPTO (United States Patent and Trademark Office) database to develop a patent citation network, classified these patents based on the results of social network analysis, and identified two main research streams of commercial technology patents. Shih [34] studied the phenomenon of technology diffusion by constructing a patent citation network of 48 countries. The empirical results showed that technical knowledge follows the law of diffusion from developed countries to developing countries. Hung et al. [35] found that the RFID patent citation network has a small-world network phenomenon. Through the analysis of social network central measurements, it was found that of RFID patents have high betweenness centrality. Lee et al. [36] analyzed the network structure of technical knowledge flow in a mobile ecosystem by using the citation information of American patents. In addition, some scholars also studied the relationship between the company’s position in the patent citation network and its financial performance measurement, its ability to obtain external knowledge, and other measurements [37,38].
In summary, the existing literature on air quality has ignored the complicated relationship between standards, while citation network analysis mainly applies to the patent system and paper citation network. Actually, knowledge communication and technology development can also be explored from the standard citation network, which motives us to identify critical air quality standards in the standard citation network to mitigate the risks of air pollution.
3. Materials and Methods
3.1. A Dynamic Citation Network Model
The structure of the standard system evolves dynamically in the wake of new standards entering into the system and out-dated standards leaving the system due to a variety of standardization activities. Thus, a standard citation network at time t can be represented as a set composed of two subsets: , in which is the set of standards and is the set of directed edges, namely the citation relationship between standards. Note that the standard citation network is directed because any two standards cannot be cited by each other. The dynamic citation relationship between standards at a given time point t can be represented by a time-varying adjacent matrix , , in which if standard i is cited by standard j, otherwise . Actually, the citation set is consistent with . If , we must have . Consequently, we can build the air quality standard citation network by setting specific values for the adjacent matrix based on the dynamic citation data.
3.2. Data Collection
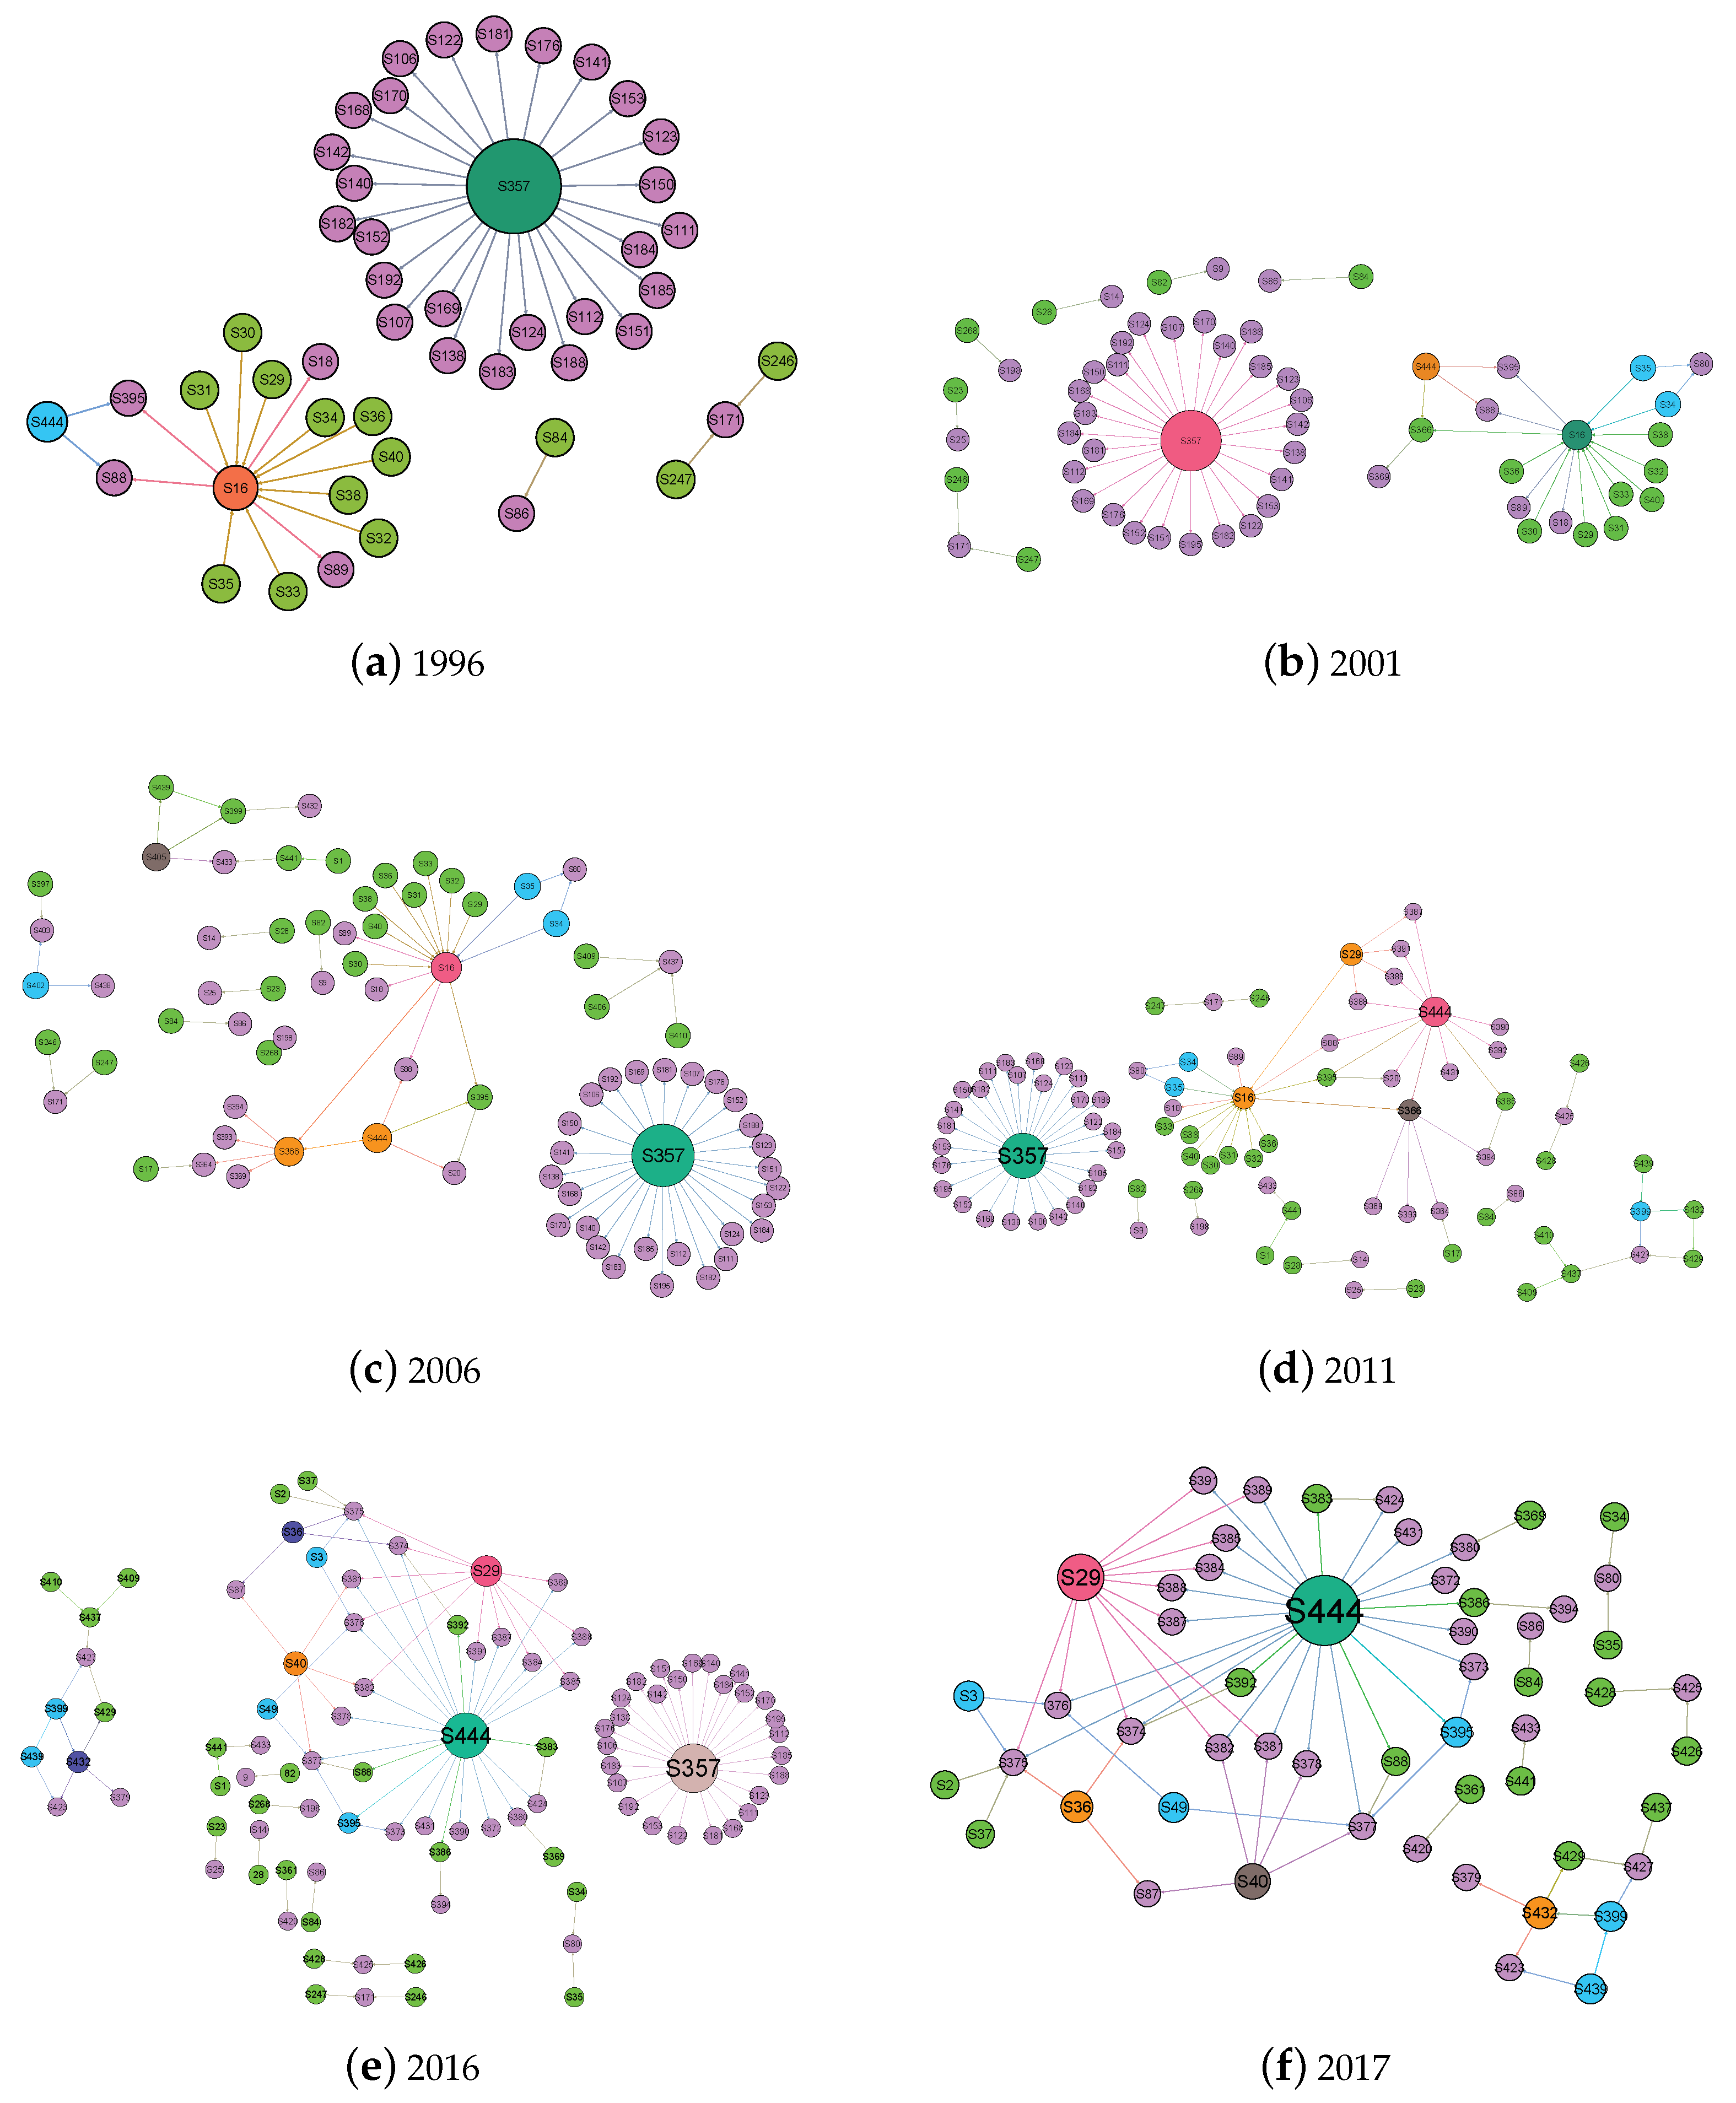
In this study, we collected air quality standard citation data mainly from the Chinese National Standard Full-Text Disclosure System, Shenzhen Standard Information Public Service Platform, and China Standard Online Service Network. A total of 444 air quality standards were collected and coded with unique ids. Through the analysis of the air quality standards, we found that most of the standards were put under centralized management by the Ministry of Health and the Ministry of Environmental Protection. In order to enhance the pertinence, this paper mainly focuses on the standards of these two departments. After the selection, 414 standards of these two departments were investigated in this study. Due to different development stages, China’s governmental policies on environmental protection at different periods are different. Therefore, this paper used the Five-Year Plan as the basis for time division. 1996 was the first year of the 9th Five-Year Plan. Every five years thereafter, a standard citation network will be established, including 1996, 2001, 2006, 2011, 2016, and 2017, implying that we will discuss the networks at six time points. It should be noted that a number of air quality standards were abolished in March 2017, July 2017, and December 2017. Therefore, we will also study the standard citation network on 30 December 2017. Table 1 shows the number of standards at six different time points, which clearly displays an increasing trend, except 2017. Figure 1 shows the structures of standards citation networks at different time points.
3.3. Node Measurements
In the research field of network science, some typical measurements, such as degree centrality, betweenness centrality, closeness centrality, and eccentricity, are widely used to evaluate the significance of nodes in the network. Based on the existing research, this paper deliberately chooses the degree centrality, betweenness centrality, eccentricity, and clustering coefficient, to develop the measurement system in evaluating node importance:
(1) Degree centrality: Since the standard citation network is a directed network, the degree centrality can be divided into in-degree and out-degree. The out-degree of a standard is computed by the number of standards that cite this standard. Consequently, out-degree is closely related to the impact of a standard, implying that the technology or knowledge recorded in a standard can be used to generate new standards. The out-degree of standard , , is defined as which reflects the number of standards that cite the concerned standard. Similarly, the in-degree of standard , , is represented as , which reflects the citation count of standard i.
(2) Betweenness centrality: The betweenness centrality refers to the ratio of the number of paths that pass the node to the total number of all the shortest paths in the network. In the air quality standard citation network, a standard with high betweenness centrality has a strong ability to control resources or transfer knowledge. The betweenness centrality is mathematically represented as:
where if a path starting from standard s and ending at d at time t passes through node i; otherwise , and is the number of all the shortest paths in the whole network.
(3) Eccentricity: The eccentricity of a node refers to the largest shortest path that a node can reach. It is the longest shortest path among all the paths that a node can reach. In the air quality standard citation network, a standard with high eccentricity has a persistent impact on other standards. Thus, the eccentricity of a standard i, , is defined as follows:
where is the length of the shortest path between standards i and j.
(4) Clustering coefficient: The clustering coefficient reflects the extent of node aggregation in a network. A node with a high clustering coefficient tends to be a central component in the whole network. In the air quality standard citation network, the clustering coefficient refers to the ratio of the actual number of edges to the maximum number of edges between nodes, which is defined by:
where is the number of actual edges between standard i and its neighbors.
3.4. An Integrated Method for Critical Standards’ Identification
In this study, we propose an integrated method by combining the Entropy Weight (EW) method and TOPSIS method for identifying critical standards. Specifically, based on the node measurements, we set the weights for each measurement with the entropy weight method. Many traditional methods, such as AHP and ANP, can be used to evaluate the significance of standards. These methods, however, are either qualitative or subjective in retrieving the data, while the EW method assigns large weights for the measurement that has large entropy, subsequently overcoming the subjective problem. Meanwhile, we used the EW method to assign weights for the measurements because we can hardly know which network measurement is better than another because the meaning of each measurement is essentially different, which impedes the use of expert judgment.
The basic idea of the TOPSIS method is that a good solution should be near the positive ideal solution and far away from the negative ideal solution. In multi-attribute decision making problems, the TOPSIS method yields a ranking index to measure the significance of all the alternatives. In this study, by multiplying the weights, which were determined by the EW method, with the attribute data, we can evaluate the significance of each standard and further identify the critical standards. The overall procedure is shown in Figure 2.
3.4.1. Weights’ Determination
As mentioned previously, the EW method is used for determining the weights in multi-criteria decision-making problems. In order to differentiate between all the standards, we set a high weight for a measurement with high entropy, which characterizes the diversity or variability of the measurement value. In this sense, the EW method is an objective method, and the detailed procedure is described as follows:
Step 1.Standardization of node measurements. Consider that node measurements are used to evaluate the significance of standards, and the value of the measurement of standard i is denoted as , and . Then, the measurements data form a decision matrix with rows and columns. Since the measurements are intrinsically different in the aspects of the definitions and values, it is impossible to compare them directly. It is necessary to standardize them to get a standardized matrix with the original decision matrix. All the node measurements selected in this paper are beneficial, that is the larger the measurement value is, the more important the standard is in the network. Therefore, the standardization of these measurements is described as follows:
where and . Considering that the measurement values need to be further used in calculating the entropy with the logarithm in the subsequent calculation process, in order to avoid negative numbers and zeros, the dimensionless measurement value is translated, making . Thus, we obtain a matrix from .
Step 2.Gravity ratio calculation. Calculate the specific gravity ratio of the elements in the normalized matrix to obtain the matrix by:
Step 3.Entropy calculation. Calculate the entropy for the measurement, which is represented as:
where for normalization and ensuring that .
Step 4.Weights’ generation. Calculate the difference coefficient , and finally, determine the weights for each measurement:
3.4.2. Identification of Critical Standards
The TOPSIS method is a sorting method that approximates the ideal solution. By defining a measure in the target space, it measures the degree to which each standard is close to the positive ideal solution and far away from the negative ideal solution, so as to evaluate the significance level of each standard. The specific steps of applying the TOPSIS method are as follows:
In the EW method, we obtained the normalized decision matrix by the transformation (2). Based on it, we could build the weighted decision matrix with the weights obtained previously in the use of EW. The calculation formula is represented as . Then, we could determine the ideal solution and the negative ideal solution , which are represented as:
and:
Then, we could calculate the distance from each standard to the positive ideal solution , , and the distance from each standard to the negative ideal solution, , by:
and
Finally, we could obtain the comprehensive ranking index Generally, a large value of indicates that standard i is relatively significant. Critical standards can be identified by sorting air quality standards in ascending order.
4. Results
In this study, Gephi, an open-source visualization and exploration software for all kinds of networks, was used to compute the node measurements at different times. For each measurement, we selected the five most significant standards for comparison due to space limitation. The detailed information of the standards mentioned in the paper is shown in Table A1.
4.1. Degree Centrality
Table 2 shows the standards’ information on in-degree and out-degree over different times. The standards are represented in descending order according to the out-degree due to its relative importance. This reveals that most of the standards with a high out-degree are method standards and fundamental standards, such as S357, S16, etc. Moreover, the majority of these standards that have been cited more often are relatively old. Most of the standards were issued between 1985 and 1996, and fewer standards were drafted after 2000. This shows that China’s air quality standard system has the problem of standard aging. In addition, the most cited standards changed slightly between 1996 and 2017. For example, S29 and S444 were cited frequently at each time point, and the out-degree exhibited an upward trend. In contrast, the standard S357 was cited frequently from 1996–2016, but it was not cited again in December 2017 due to its abolishment. Finally, we can also see that except for the standards with the highest out-degree, the out-degree of other top standards was less than 10, which indicates that the citation of air quality standards is relatively uniform, lacking diversity.
4.2. Betweenness Centrality
The top five standards in terms of betweenness centrality over six periods are shown in Table 2. The values of the betweenness centrality of standards were normalized, which made . We see that the betweenness coefficients of all the standards was generally small, e.g., the largest value was only 0.018501. This indicates that the citation relationship between China’s air quality standards was insufficient. In 1996, the betweenness centrality of most standards was zero, which was attributed by the fact that only a few air quality standards had been established in China in 1996. In 2017, we note that the betweenness centrality values of four standards were greater than zero. With the approval of the State Council of China, a large number of standards were abolished in 2017, and the newly-revised standards have not yet been implemented, thus reducing the citation relationship between air quality standards. The standards with the highest betweenness centrality values in Table 2 are mostly basis standards and method standards, which is similar to the results on out-degree. Some standards simultaneously had high out-degree and betweenness centrality values, such as S16 and S366. Comparing the betweenness centrality values over different time points, we found that the betweenness centrality values of the standard S432 in 2016 and 2017 ranked first. This shows that this standard is becoming more and more important, implying that China’s focus on air quality standards is shifting.
4.3. Eccentricity
The results on eccentricity are shown in Table 2, from which we see that the eccentricity of the standards ranking top at each time point is not high, the maximum being three, indicating that no standards imposed a great influence on China’s air quality standard citation network. In other words, the critical standard was lacking in the whole network. In addition, it can be found that in 1996, 2001, 2006, and 2011, the standards that had high eccentricity included S29, S30, S31, S32, and S33. However, in 2016 and 2017, the standards with high eccentricity were S444, S432, and S399. This is mainly because with the rapid development of China’s economy and the improvement of people’s living standards, the sales volume of motor vehicles has increased day by day. As a result, vehicle exhaust emissions have become the major threat to air quality. Therefore, with the shift of national policy focus, the standards of pollutants discharged by motor vehicles are becoming more and more important.
4.4. Clustering Coefficient
The top five standards with a high clustering coefficient over the six periods are shown in Table 2. Since the clustering coefficients of the standards in 1996 and 2001 were all zero, they are not shown in the Table 2. The clustering coefficients of most of the standards were not high. The standards with a high clustering coefficient were all basis standards, among which there were a few method standards, such as S20, S373, and S424. Comparing the clustering coefficient values at different time points, we noticed that there was a big difference between the clustering coefficients in 2006 and 2011. However, the situation in 2016 was similar to that in 2017. Although a number of standards were abolished in 2017, the critical standards were not abolished.
4.5. Evolution Analysis Based on the Integrated Evaluation Method
In the previous section, we analyzed the evolution of the node measurements’ values in the citation network of China’s air quality standards. In this part, we use the data of the node measurements to evaluate the air quality comprehensively by combining the entropy weight method and the TOPSIS method, as described in Section 3.4. The computational results are shown in Table 2.
It can be found from Table 2 that the standards with a high importance evaluation value in the network were also basis standards and method standards. The standards with high importance remained almost unchanged from 1996–2011. In addition, when evaluating the importance of the standards in recent years, as the eccentricity was given the largest weight when the EW method was used to determine the weights, the importance of standards with high values of eccentricity in the network ranked high, such as S29 and S30. In 2016 and 2017, the standards with higher importance changed, and the values of the importance of each standard were diminished as a whole. The standards at the top of the list with higher values of eccentricity and clustering coefficient are related to pollutants such as waste, waste water, and exhaust gas. To some extent, it reflects that as the government attaches more importance to the pollution problem, the critical standards in the network also shift with the policy focus.
5. Discussion
Based on the previous results on node measurements and the importance of standards in the citation network of air quality standards, the following insights can be drawn:
(1) The number of nodes and edges in China’s air quality standard citation network reveals an increasing trend. However, the connectivity of the current citation relationship is still insufficient, which reduces the systematicness of the standards system. This phenomenon is caused to some extent by the fact that the citation behavior lacks strong reference support. We can hardly know which standard is important without a quantitative assessment method. In this regard, we bridge this gap by proposing a network-based method to identify critical standards. As the existing citation can be optimized through drafting, revision, and abolishment activities, industrial communities or other related institutions should carefully examine the status of all the standards to see if they are of poor quality or are outdated.
(2) Through our computation, we found that the values of each measurement of air quality standards, namely the in-degree, out-degree, betweenness centrality, eccentricity, and clustering coefficient, were not high. In the early periods, some measurements even had zero values for all standards, indicating that there were very scarce citations between China’s air quality standards’ system, that the standards were not closely linked, and that the critical standards were lacking in the entire network.
(3) The significance ranking of standards in China’s air quality standards’ citation network has changed greatly in recent years. On the one hand, we observed that the clustering coefficient of standards improved, indicating that the connection between air quality standards was strengthened. Meanwhile, the difference in the significance between different standards in the network was reduced. On the other hand, we found that no standard had absolute dominance in the air quality standards’ system. The critical standards also changed over time with the shift of government attention.
6. Conclusions
In this study, the social network method, EW method, and TOPSIS method were integrated to identify China’s critical air quality standards over different periods. A dynamic standard citation network model was developed to reflect the topological evolution of the standard citation network. Four hundred forty four publicized national air-quality standards were collected in the analysis. Several node measurements were used to assess the significance of each standard, including in-degree, out-degree, betweenness centrality, eccentricity, and clustering coefficient. Since it was very difficult to differentiate the significance between these measurements, we used the EW method to set the weight for each node measurement to avoid subjectivity. The comprehensive criticality value of each standard was obtained by the TOPSIS method.
Based on the empirical study on China’s air-quality from 1996–2017, we deliberately selected six time periods to simplify the analysis. The following managerial suggestions are proposed for optimizing the structure of China’s air-quality standard system. Firstly, the air quality standards with relatively high criticality, as evaluated by the TOPSIS method, play dominant roles in the citation network and impose great control over other standards in the transmission of information and knowledge. In this sense, the drafting institutions should pay extensive attention to these critical standards when carrying out the related standardization activities, such as revision or replacement. For example, we observed that the standards on testing methods were highly important over different periods. Secondly, we found that the critical standards changed over time as the introduction of new technologies or the issue of government policies. This feature is unique in the standard citation network due to standard revision and abolishment activities. Thus, relevant enterprises should attach great importance to the dynamics of standard systems and further identify the development of new technologies and knowledge.
Overall, this study showed the effectiveness of the application of social network analysis methods in identifying the criticality of air quality standards’ citation networks. Nevertheless, there exist several problems deserving further investigation. For example, it is interesting to study the participation and contribution of different drafting institutions, which can provide a foundation for resource allocation. In addition, this study addressed the interrelationship between air quality standards by citation. However, the essential connectivity among standards is reflected by the knowledge content or the standard rules in standard texts. Some emerging AI technologies on text mining can be used for deeply understanding the interrelationship among standards.
Author Contributions
Y.W. and F.C. developed the network model and methodology; C.W. carried out the analysis; L.C. and H.W. contributed to the writing; Y.Q. and F.L. contributed to the review and editing.
Funding
This work was funded by the National Natural Science Foundation of China (Nos. 71401181, 71701213, and 71501151), the MOE (Ministry of Education in China) Project of Humanities and Social Sciences (Nos. 14YJC630136 and 15YJC630008), the Research Projects of Provincial Teaching Reform in Colleges and Universities of Hubei Province (No. 2017175, YB2018019), and the Fundamental Research Funds Project of the Central Universities “Incentive Performance and Institutional Mechanism Innovation of Ecological Transfer Payment from the Perspective of Green Development”, Zhongnan University of Economics and Law (No. 2722019JCT008).
Conflicts of Interest
The authors declare no conflict of interest.
Abbreviations
The following abbreviations are used in this manuscript:
| EW | Entropy Weight |
| AHP | Analytic Hierarchy Process |
| ANP | Analytic Network Process |
| TOPSIS | Technique for Order Preference by Similarity to an Ideal Solution |
Appendix A

Table A1.
Detailed information of standards mentioned in this paper.
| Standard Name | |
|---|---|
| S16 | Ambient Air Quality Standard |
| S171 | Health Standard for Element Mercury Vapor in the Air of Workplace |
| S18 | Emission Standard of Air Pollution for Coke Oven |
| S20 | Emission Standards for Air Pollutants in the Cement Industry |
| S29 | Ambient Air–Determination of Total Suspended Particulates–GravimetryMethod |
| S30 | Ambient Air–Determination of Fluoride–Lime Filter Paper, Fluoride Ion Selective |
| Electrode Method | |
| S31 | Ambient Air–Determination of Fluoride Mass Concentration–Filters, Fluoride Ion Selective |
| Electrode Method | |
| S32 | Ambient Air–Determination of Nitrogen Dioxide–Saltzman Method |
| S33 | Ambient Air–Determination of Nitrogen Oxides–Saltzman Method |
| S34 | Ambient Air–Determination of Ozone–Indigo Disulfonic Acid Sodium Spectrophotometry |
| Measurement Method | |
| S35 | Ambient Air–Determination of Ozone–Ultraviolet Photometry |
| S357 | Method for Measuring Dust in the Air of Workplace |
| S36 | Ambient Air–Determination of Benzo [A] Pyrene–High Performance Liquid Chromatography |
| S366 | Boiler Air Pollutant Discharge Standard |
| S373 | Emission Standard for Air Pollutants from Crematorium |
| S374 | Emission Standard of Pollutants for Petroleum Refining Industry |
| S375 | Emission Standard of Pollutants for Petroleum Chemistry Industry |
| S376 | Emission Standard of Pollutants for Synthetic Resin Industry |
| S377 | Emission Standards of Pollutants for Inorganic Chemical Industry |
| S381 | Emission Standards of Pollutants for Stannum, Antimony and Mercury Industries |
| S383 | Standard for Controlling Pollution of Solid Waste by Coordinated Disposal of Cement Kilns |
| S386 | Thermal Power Plant Emission Standard for Atmospheric Pollutants |
| S392 | Oil Storage Air Pollutant Discharge Standard |
| S395 | Integrated Emission Standard for Atmospheric Pollutants |
| S399 | Light Vehicle Pollutant Emission Limits and Measurement Methods (China III, IV Stage) |
| S40 | Ambient Air–Determination of Lea- Flame Atomic Absorption Spectrophotometry |
| S405 | Vehicle Emission Ignition Engine Exhaust Pollutant Emission Limits and Measurement Method |
| S409 | Light Vehicle Pollutant Emission Limits and Measurement Methods (I) |
| S424 | Domestic Waste Incineration Pollution Control Standard |
| S429 | Heavy Vehicle Exhaust Pollutant Emission Control System Durability Requirements and Test Methods |
| S432 | Vehicle Compression Ignition, Gaseous Fuel Ignition Engine and Vehicle Exhaust Pollutant Emission |
| Limits and Measurement Methods (China Phase III, IV, V) | |
| S437 | Emission Engine Vehicle Exhaust Pollutant Emission Limits and Measurement Method |
| (Double Idle Method and Simple Working Condition Method) | |
| S439 | Method for Automotive Compression Ignition Engine and Compression Ignition Engine |
| S441 | Agricultural Vehicle Free Acceleration Smoke Emission Limits and Measurement Method |
| S444 | Method for the determination of particulate matter Source Exhaust Gas and Sampling Method of |
| Gaseous Pollutant | |
| S88 | Industrial Furnace kiln Air Pollutant Emission Standards |
References
- Yang, G.; Wang, Y.; Zeng, Y.; Gao, G.F.; Liang, X.; Zhou, M.; Wan, X.; Yu, S.; Jiang, Y.; Naghavi, M.; et al. Rapid health transition in China, 1990–2010: Findings from the Global Burden of Disease Study 2010. Lancet 2013, 381, 1987–2015. [Google Scholar] [CrossRef]
- Li, F.; Zhang, J.; Jiang, W.; Liu, C.; Zhang, Z.; Zhang, C.; Zeng, G. Spatial health risk assessment and hierarchical risk management for mercury in soils from a typical contaminated site, China. Environ. Geochem. Health 2017, 39, 923–934. [Google Scholar] [CrossRef] [PubMed]
- Huang, J.; Li, F.; Zeng, G.; Liu, W.; Huang, X.; Xiao, Z.; Wu, H.; Gu, Y.; Li, X.; He, X.; et al. Integrating hierarchical bioavailability and population distribution into potential eco-risk assessment of heavy metals in road dust: A case study in Xiandao District, Changsha city, China. Sci. Total Environ. 2016, 541, 969–976. [Google Scholar] [CrossRef] [PubMed]
- Li, F.; Zhang, J.; Liu, C.; Xiao, M.; Wu, Z. Distribution, bioavailability and probabilistic integrated ecological risk assessment of heavy metals in sediments from Honghu Lake, China. Process Saf. Environ. Prot. 2018, 116, 169–179. [Google Scholar] [CrossRef]
- Wang, S.; Hao, J. Air quality management in China: Issues, challenges, and options. J. Environ. Sci. 2012, 24, 2–13. [Google Scholar] [CrossRef]
- Rohde, R.A.; Muller, R.A. Air pollution in China: mapping of concentrations and sources. PLoS ONE 2015, 10, e0135749. [Google Scholar] [CrossRef] [PubMed]
- Brodal, P. The Central Nervous System: Structure and Function; Oxford University Press: Oxford, UK, 2004. [Google Scholar]
- Wei, Y.; Chen, F.; Xue, H.; Wang, L. Research on structural dynamics in Chinese automobile standard citation network. Neural Comput. Appl. 2018, 1–9. [Google Scholar] [CrossRef]
- Saaty, T.L. Decision making—The analytic hierarchy and network processes (AHP/ANP). J. Syst. Sci. Syst. Eng. 2004, 13, 1–35. [Google Scholar] [CrossRef]
- Zhang, Y.; Na, S. Research on the Topological Properties of Air Quality Index Based on a Complex Network. Sustainability 2018, 10, 1073. [Google Scholar] [CrossRef]
- Zou, Z.H.; Yi, Y.; Sun, J.N. Entropy method for determination of weight of evaluating indicators in fuzzy synthetic evaluation for water quality assessment. J. Environ. Sci. 2006, 18, 1020–1023. [Google Scholar] [CrossRef]
- Wang, X.; Yang, Z. Application of Fuzzy Optimization Model Based on Entropy Weight Method in Atmospheric Quality Evaluation: A Case Study of Zhejiang Province, China. Sustainability 2019, 11, 2143. [Google Scholar] [CrossRef]
- Behzadian, M.; Otaghsara, S.K.; Yazdani, M.; Ignatius, J. A state-of the-art survey of TOPSIS applications. Expert Syst. Appl. 2012, 39, 13051–13069. [Google Scholar] [CrossRef]
- Hackney, J.D.; Linn, W.S. Controlled clinical studies of air pollutant exposure: evaluating scientific information in relation to air quality standards. Environ. Health Perspect. 1983, 52, 187–191. [Google Scholar] [CrossRef] [PubMed]
- Lebowitz, M.D. Utilization of data from human population studies for setting air quality standards: evaluation of important issues. Environ. Health Perspect. 1983, 52, 193–205. [Google Scholar] [CrossRef] [PubMed]
- Amann, M.; Purohit, P.; Bhanarkar, A.D.; Bertok, I.; Borken-Kleefeld, J.; Cofala, J.; Heyes, C.; Kiesewetter, G.; Klimont, Z.; Liu, J.; et al. Managing future air quality in megacities: A case study for Delhi. Atmos. Environ. 2017, 161, 99–111. [Google Scholar] [CrossRef]
- Giannadaki, D.; Lelieveld, J.; Pozzer, A. Implementing the US air quality standard for PM 2.5 worldwide can prevent millions of premature deaths per year. Environ. Health 2016, 15, 88. [Google Scholar] [CrossRef] [PubMed]
- Kelly, J.T.; Reff, A.; Gantt, B. A method to predict PM2. 5 resulting from compliance with national ambient air quality standards. Atmos. Environ. 2017, 162, 1–10. [Google Scholar] [CrossRef]
- Nehr, S.; Hösen, E.; Tanabe, S.i. Emerging developments in the standardized chemical characterization of indoor air quality. Environ. Int. 2017, 98, 233–237. [Google Scholar] [CrossRef] [PubMed]
- Garfield, E. Citation indexes for science. A new dimension in documentation through association of ideas. Int. J. Epidemiol. 2006, 35, 1123–1127. [Google Scholar] [CrossRef] [PubMed]
- Doreian, P. A measure of standing of journals in stratified networks. Scientometrics 1985, 8, 341–363. [Google Scholar] [CrossRef]
- Nerur, S.; Sikora, R.; Mangalaraj, G.; Balijepally, V. Assessing the relative influence of journals in a citation network. Commun. ACM 2005, 48, 71–74. [Google Scholar] [CrossRef]
- Calero-Medina, C.; Noyons, E.C. Combining mapping and citation network analysis for a better understanding of the scientific development: The case of the absorptive capacity field. J. Inf. 2008, 2, 272–279. [Google Scholar] [CrossRef]
- Shibata, N.; Kajikawa, Y.; Sakata, I. Link prediction in citation networks. J. Am. Soc. Inf. Sci. Technol. 2012, 63, 78–85. [Google Scholar] [CrossRef]
- García, J.A.; Rodriguez-Sánchez, R.; Fdez-Valdivia, J. Social impact of scholarly articles in a citation network. J. Assoc. Inf. Sci. Technol. 2015, 66, 117–127. [Google Scholar] [CrossRef]
- Madani, F.; Weber, C. The evolution of patent mining: Applying bibliometrics analysis and keyword network analysis. World Pat. Inf. 2016, 46, 32–48. [Google Scholar] [CrossRef]
- Kim, J.; Shin, J. Mapping extended technological trajectories: Integration of main path, derivative paths, and technology junctures. Scientometrics 2018, 116, 1439–1459. [Google Scholar] [CrossRef]
- Sun, X.; Ding, K. Identifying and tracking scientific and technological knowledge memes from citation networks of publications and patents. Scientometrics 2018, 116, 1735–1748. [Google Scholar] [CrossRef]
- Yin, J.; Gong, L.; Wang, S. Large-scale assessment of global green innovation research trends from 1981 to 2016: A bibliometric study. J. Clean. Prod. 2018, 197, 827–841. [Google Scholar] [CrossRef]
- Wang, J.; Zhang, L. Proximal advantage in knowledge diffusion: The time dimension. J. Inf. 2018, 12, 858–867. [Google Scholar] [CrossRef]
- Han, F.; Magee, C.L. Testing the science/technology relationship by analysis of patent citations of scientific papers after decomposition of both science and technology. Scientometrics 2018, 116, 767–796. [Google Scholar] [CrossRef] [Green Version]
- Narin, F. Patent bibliometrics. Scientometrics 1994, 30, 147–155. [Google Scholar] [CrossRef]
- Chang, S.B.; Lai, K.K.; Chang, S.M. Exploring technology diffusion and classification of business methods: Using the patent citation network. Technol. Forecast. Soc. Chang. 2009, 76, 107–117. [Google Scholar] [CrossRef]
- Shih, H.Y.; Chang, T.L.S. International diffusion of embodied and disembodied technology: A network analysis approach. Technol. Forecast. Soc. Chang. 2009, 76, 821–834. [Google Scholar] [CrossRef]
- Hung, S.W.; Wang, A.P. Examining the small world phenomenon in the patent citation network: A case study of the radio frequency identification (RFID) network. Scientometrics 2010, 82, 121–134. [Google Scholar] [CrossRef]
- Lee, S.; Kim, W.; Lee, H.; Jeon, J. Identifying the structure of knowledge networks in the US mobile ecosystems: patent citation analysis. Technol. Anal. Strateg. Manag. 2016, 28, 411–434. [Google Scholar] [CrossRef]
- Park, J.H.; Kwahk, K.Y. The effect of patent citation relationship on business performance: A social network analysis perspective. J. Intell. Inf. Syst. 2013, 19, 127–139. [Google Scholar]
- Dreyfus, D.; Iyer, B. Knowledge sharing and value flow in the software industry: Searching the patent citation network. In Proceedings of the 38th Annual Hawaii International Conference on System Sciences, Big Island, HI, USA, 6 January 2005; p. 87a. [Google Scholar]
Figure 1.
The evolution of the air quality standard citation network.

Figure 2.
The overall procedure of the integrated method for critical standards’ identification.

Table 1.
The number of standards at different time points.
| Year | 1996 | 2001 | 2006 | 2011 | 2016 | 2017 |
|---|---|---|---|---|---|---|
| Number of standards | 304 | 360 | 374 | 384 | 396 | 122 |
Table 2.
Results of critical standards’ evolution based on different measurements.
| 1996 | S357 | 26 | S16 | 10 | S16 | 0.019 | S29 | 2 | - | - | S34 | 0.8 |
| S16 | 4 | S88 | 2 | - | - | S30 | 2 | - | - | S35 | 0.8 | |
| S444 | 2 | S171 | 2 | - | - | S31 | 2 | - | - | S29 | 0.79 | |
| S29 | 1 | S395 | 2 | - | - | S32 | 2 | - | - | S30 | 0.79 | |
| S30 | 1 | S18 | 1 | - | - | S33 | 2 | - | - | S31 | 0.79 | |
| 2001 | S357 | 27 | S16 | 10 | S16 | 0.0175 | S29 | 3 | - | - | S34 | 0.8 |
| S16 | 5 | S88 | 2 | S366 | 0.0035 | S30 | 3 | - | - | S35 | 0.8 | |
| S444 | 3 | S171 | 2 | - | - | S31 | 3 | - | - | S29 | 0.79 | |
| S34 | 2 | S395 | 2 | - | - | S32 | 3 | - | - | S30 | 0.79 | |
| S35 | 2 | S366 | 2 | - | - | S33 | 3 | - | - | S31 | 0.79 | |
| 2006 | S357 | 27 | S16 | 10 | S16 | 0.0162 | S29 | 3 | S20 | 0.5 | S34 | 0.72 |
| S16 | 5 | S437 | 3 | S366 | 0.0078 | S30 | 3 | S439 | 0.5 | S35 | 0.72 | |
| S444 | 4 | S88 | 2 | S395 | 0.0018 | S31 | 3 | S395 | 0.1667 | S29 | 0.72 | |
| S366 | 4 | S171 | 2 | S399 | 0.0003 | S32 | 3 | S405 | 0.1667 | S30 | 0.72 | |
| S405 | 3 | S395 | 2 | S441 | 0.0002 | S33 | 3 | S399 | 0.1667 | S31 | 0.72 | |
| 2011 | S357 | 27 | S16 | 10 | S16 | 0.0137 | S29 | 3 | S20 | 0.5 | S29 | 0.79 |
| S444 | 12 | S437 | 3 | S366 | 0.0065 | S30 | 3 | S395 | 0.1667 | S34 | 0.78 | |
| S29 | 5 | S88 | 2 | S395 | 0.0015 | S31 | 3 | S444 | 0.0076 | S35 | 0.78 | |
| S16 | 5 | S171 | 2 | S399 | 0.0004 | S32 | 3 | - | - | S30 | 0.78 | |
| S366 | 4 | S395 | 2 | S437 | 0.0003 | S33 | 3 | - | - | S31 | 0.78 | |
| 2016 | S357 | 27 | S375 | 6 | S432 | 0.0005 | S439 | 3 | S88 | 0.5 | S383 | 0.53 |
| S444 | 24 | S377 | 5 | S399 | 0.0004 | S444 | 2 | S373 | 0.5 | S88 | 0.53 | |
| S29 | 11 | S374 | 4 | S437 | 0.0002 | S432 | 2 | S392 | 0.5 | S392 | 0.53 | |
| S40 | 5 | S376 | 4 | S386 | 0.0001 | S399 | 2 | S383 | 0.5 | S424 | 0.48 | |
| S36 | 3 | S381 | 3 | S429 | 0.0001 | S409 | 2 | S424 | 0.5 | S373 | 0.48 | |
| 2017 | S444 | 24 | S375 | 6 | S432 | 0.0017 | S439 | 3 | S88 | 0.5 | S383 | 0.58 |
| S29 | 11 | S377 | 5 | S399 | 0.0014 | S444 | 2 | S373 | 0.5 | S88 | 0.58 | |
| S40 | 5 | S374 | 4 | S386 | 0.0003 | S432 | 2 | S392 | 0.5 | S392 | 0.58 | |
| S36 | 3 | S376 | 4 | S429 | 0.0003 | S399 | 2 | S383 | 0.5 | S424 | 0.55 | |
| S432 | 3 | S381 | 3 | - | - | S34 | 1 | S424 | 0.5 | S373 | 0.55 |
© 2019 by the authors. Licensee MDPI, Basel, Switzerland. This article is an open access article distributed under the terms and conditions of the Creative Commons Attribution (CC BY) license (http://creativecommons.org/licenses/by/4.0/).
Share and Cite
MDPI and ACS Style
Wei, Y.; Chen, L.; Qi, Y.; Wang, C.; Li, F.; Wang, H.; Chen, F. A Complex Network Method in Criticality Evaluation of Air Quality Standards. Sustainability 2019, 11, 3920. https://doi.org/10.3390/su11143920
AMA Style
Wei Y, Chen L, Qi Y, Wang C, Li F, Wang H, Chen F. A Complex Network Method in Criticality Evaluation of Air Quality Standards. Sustainability. 2019; 11(14):3920. https://doi.org/10.3390/su11143920
Chicago/Turabian StyleWei, Yongchang, Lei Chen, Yu Qi, Can Wang, Fei Li, Haorong Wang, and Fangyu Chen. 2019. "A Complex Network Method in Criticality Evaluation of Air Quality Standards" Sustainability 11, no. 14: 3920. https://doi.org/10.3390/su11143920
Note that from the first issue of 2016, this journal uses article numbers instead of page numbers. See further details here.