Methodology for Energy Optimization in Wastewater Treatment Plants. Phase I: Control of the Best Operating Conditions

 ,
,  and
and 
Abstract
:1. Introduction
- the increase in the price of electricity by more than 50% in the last 10 years for industrial consumers in Spain [5],
- high energy dependence in Spain and the EU27 with the need to import almost 75% of the energy consumed,
- the slow evolution of energy savings in the water supply and treatment sector [6],
- the increasing demands of regulators for the quality of reclaimed water, with a tendency to reach drinking water levels that require the application of more complex and advanced technologies with higher energy consumption [7].
- and the United Nations Sustainable Development Goals (SDG), with targets that Member States have agreed to pursue by 2030 [8].
2. State of the Art
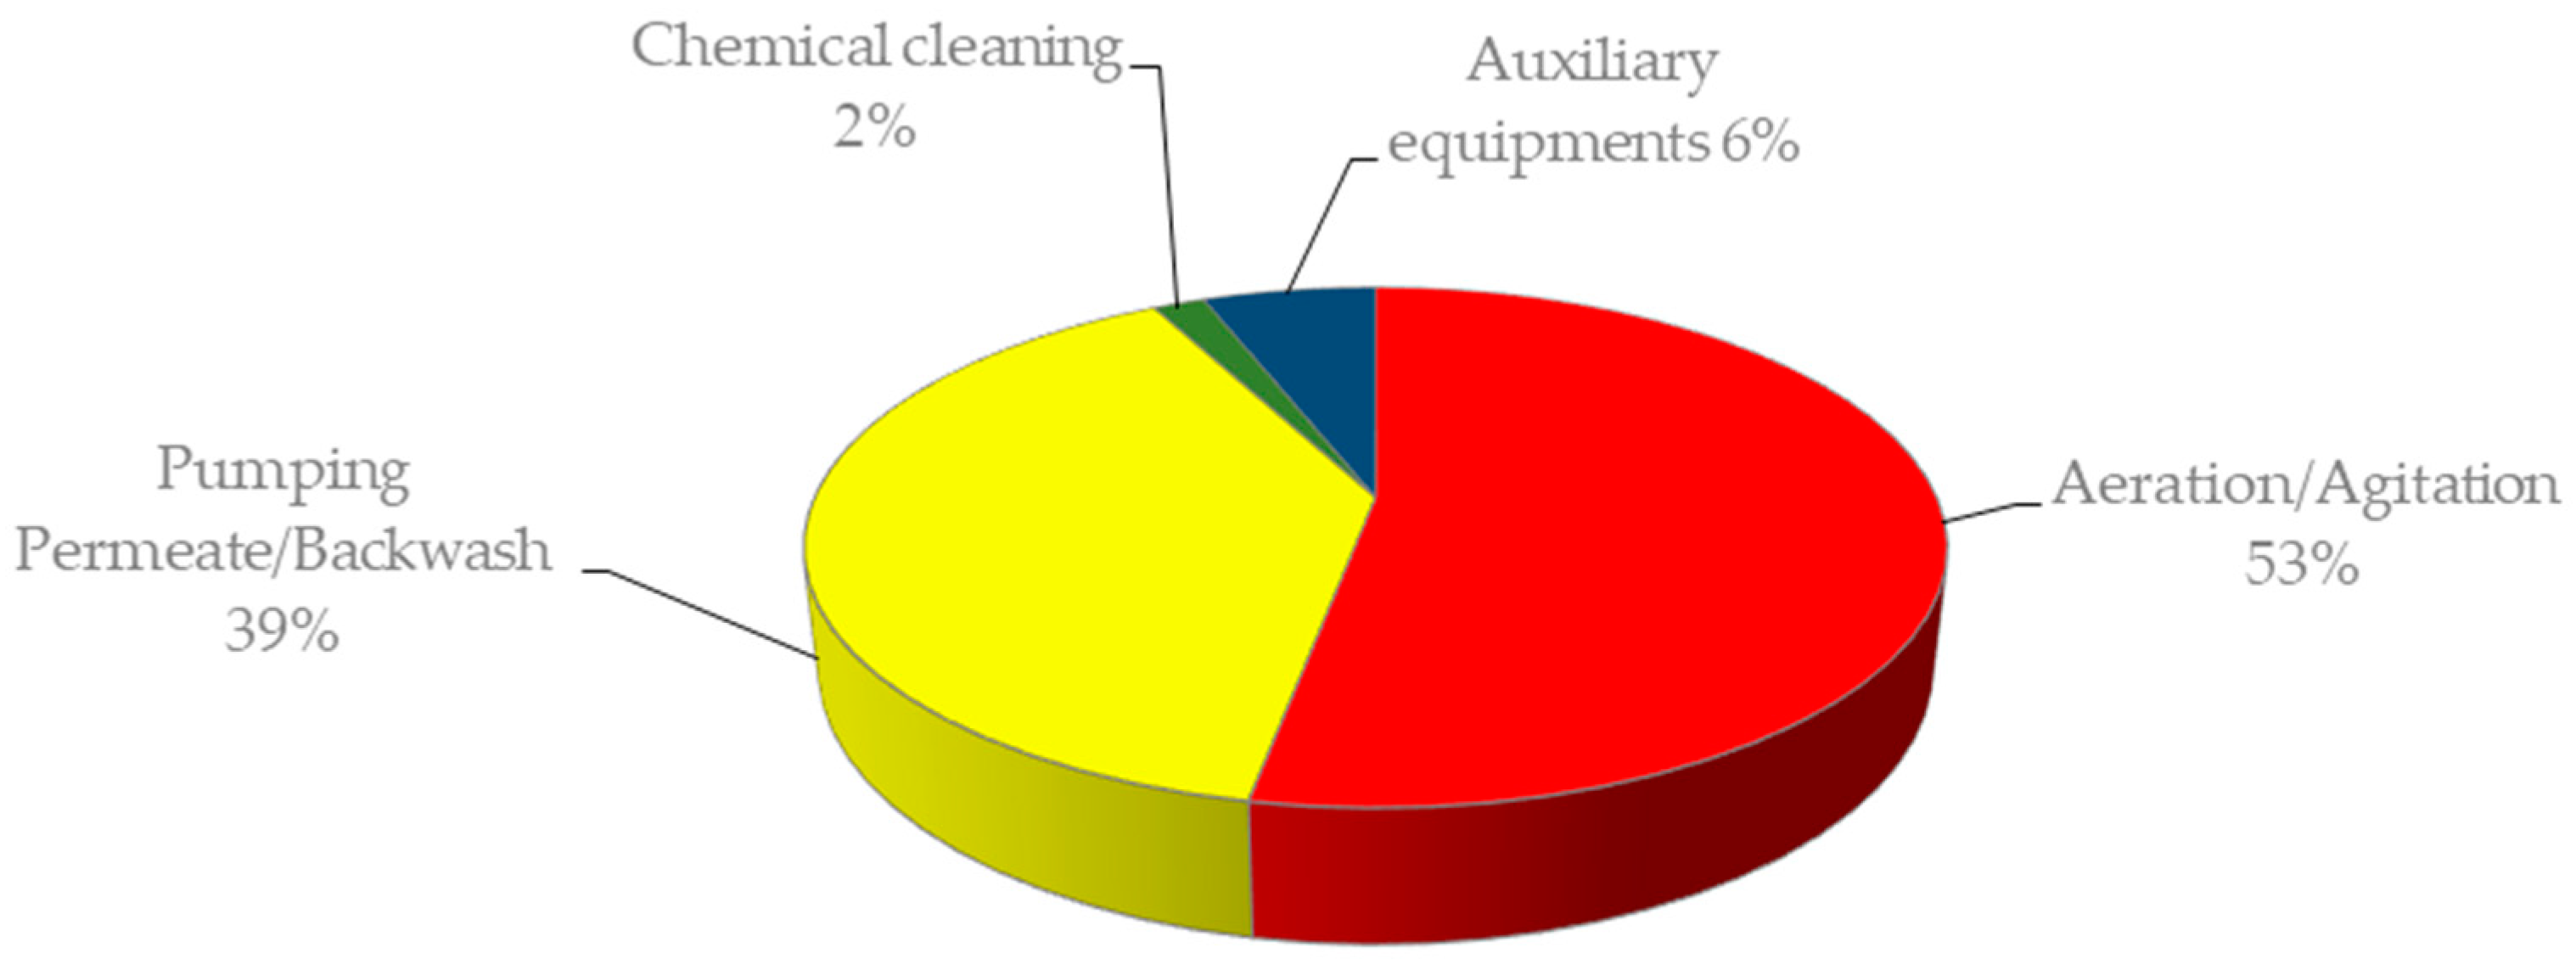
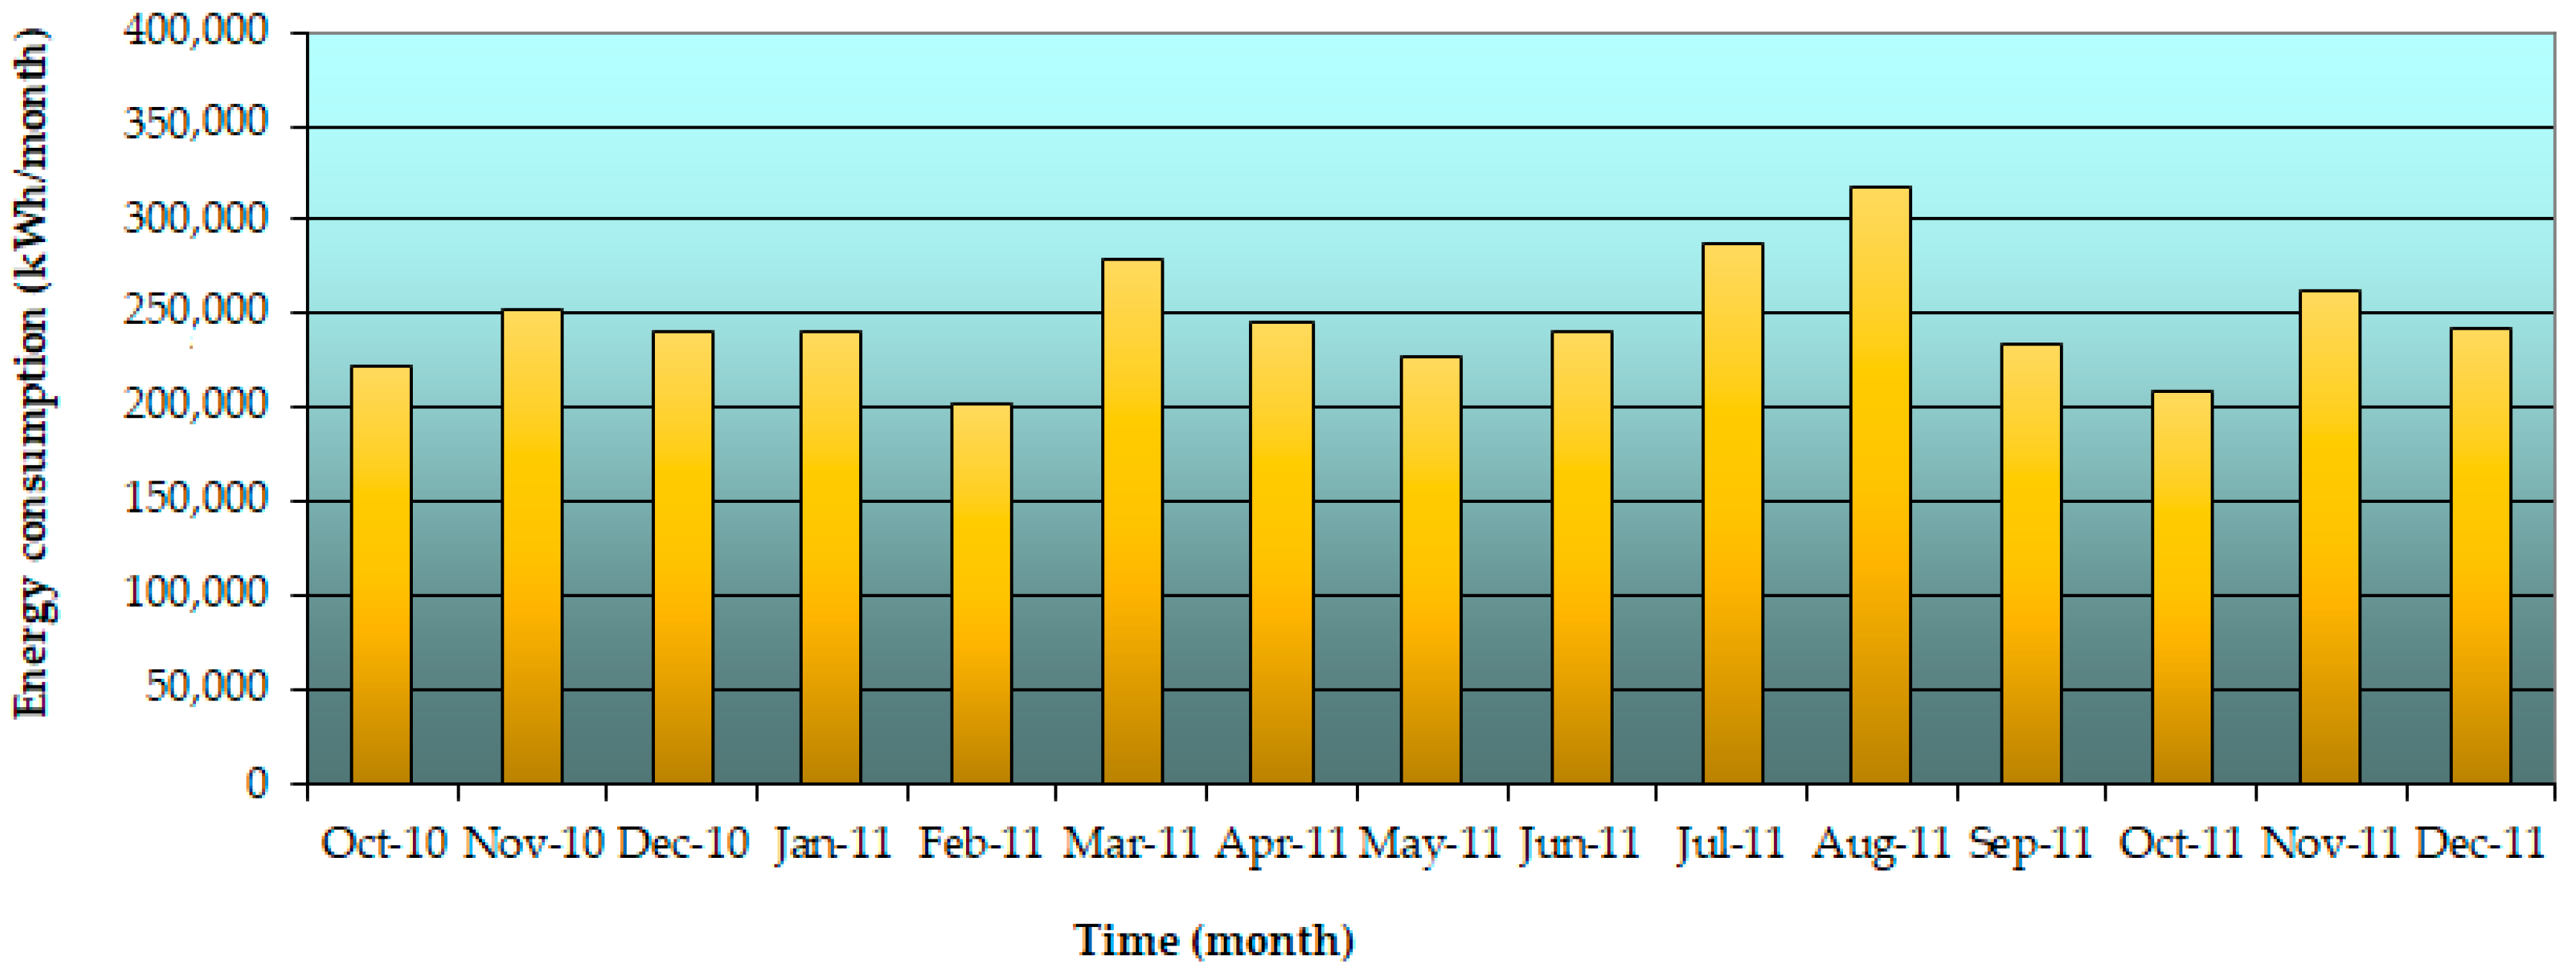
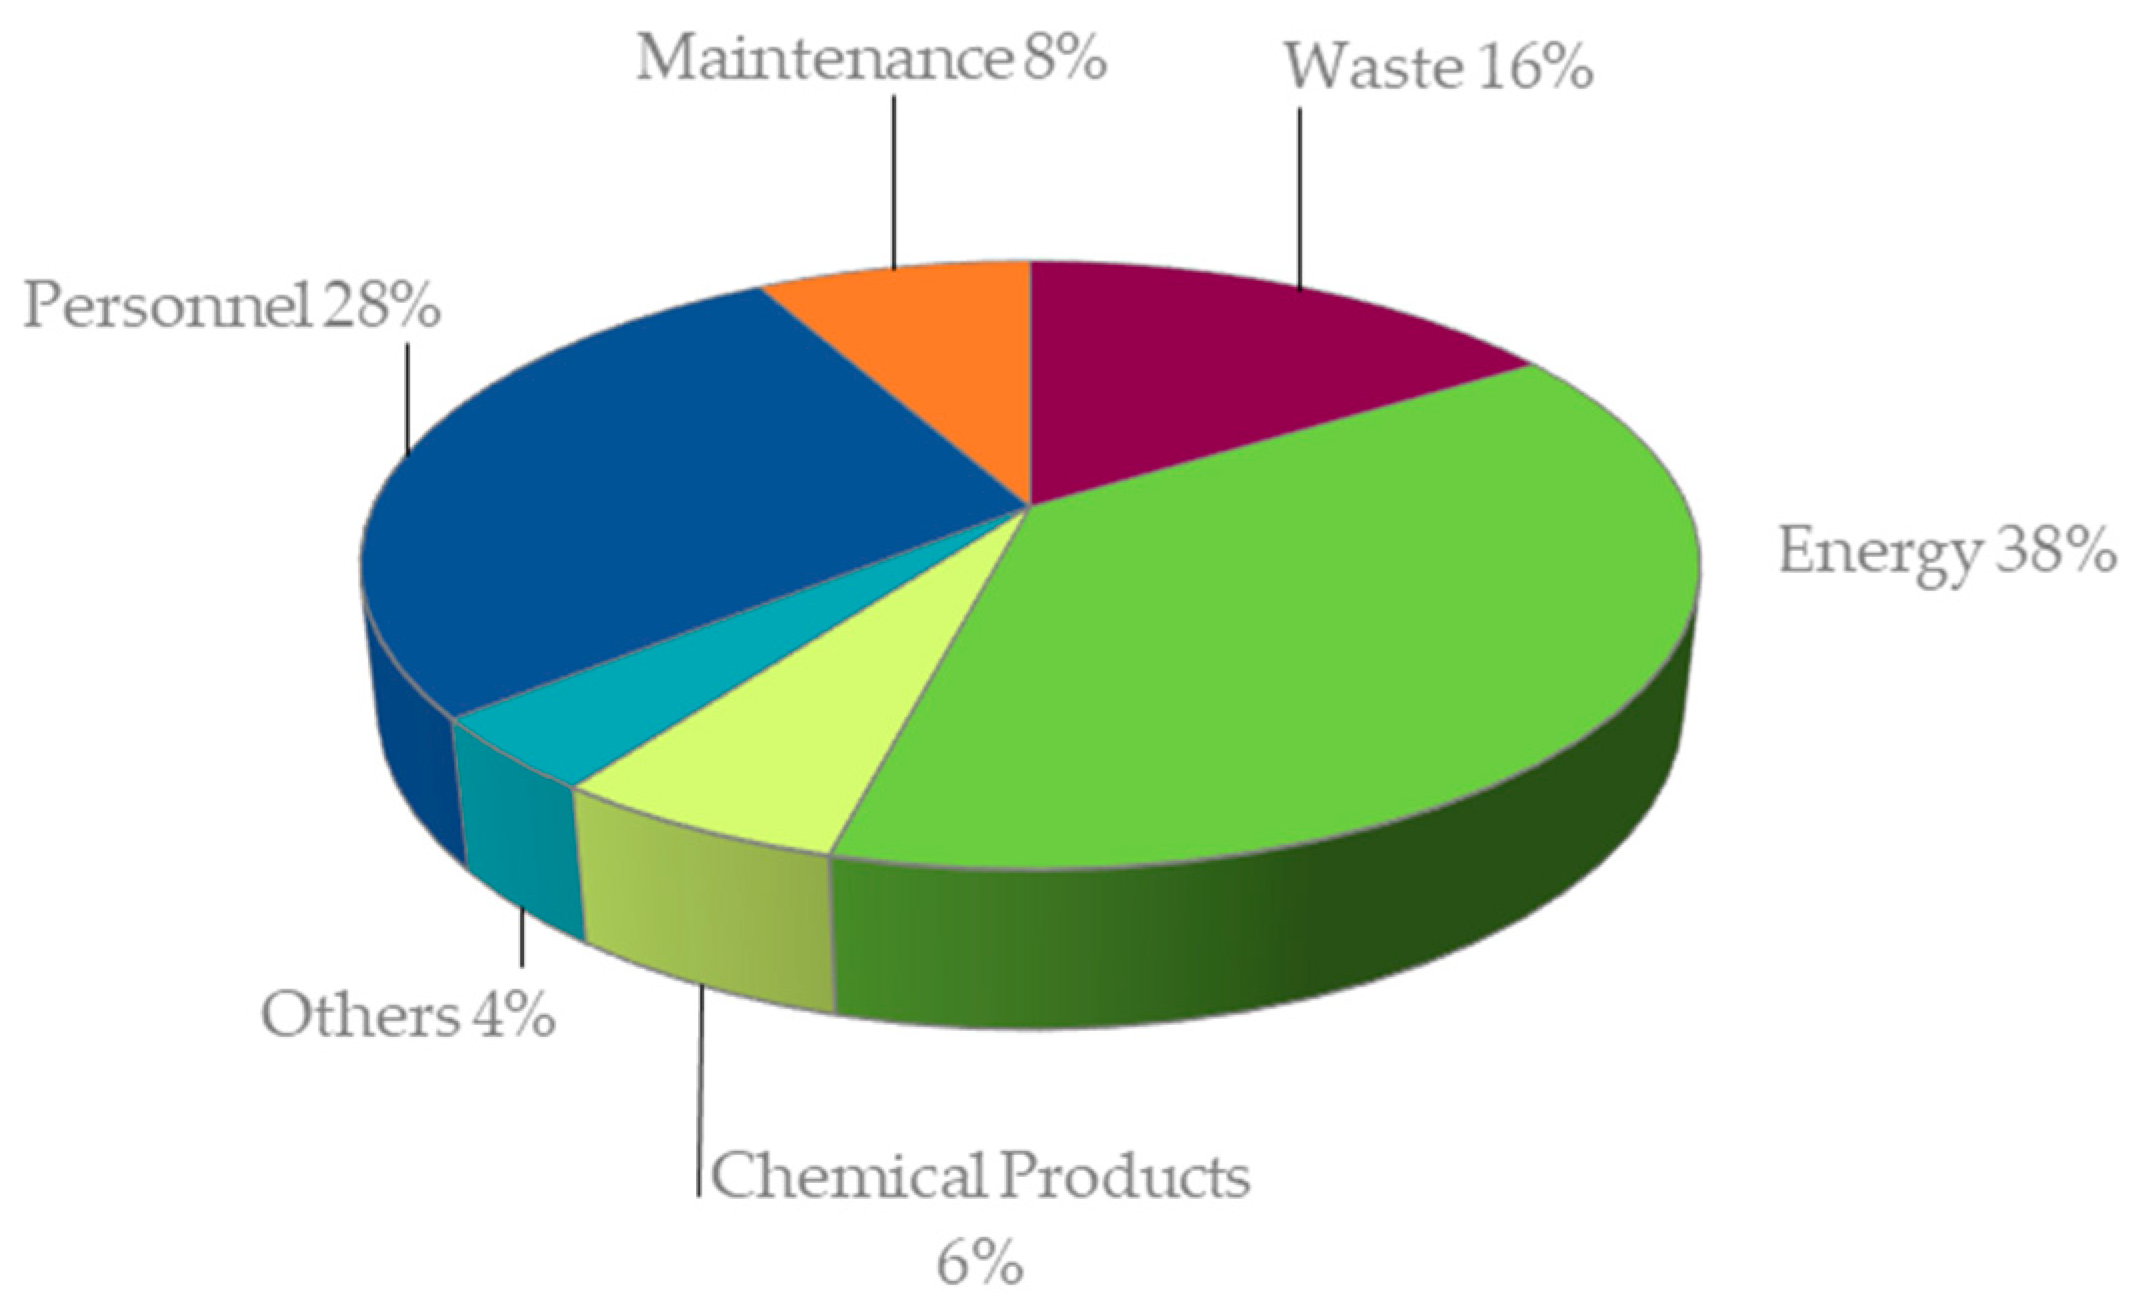
2.1. Energy Consumption in WWTPs
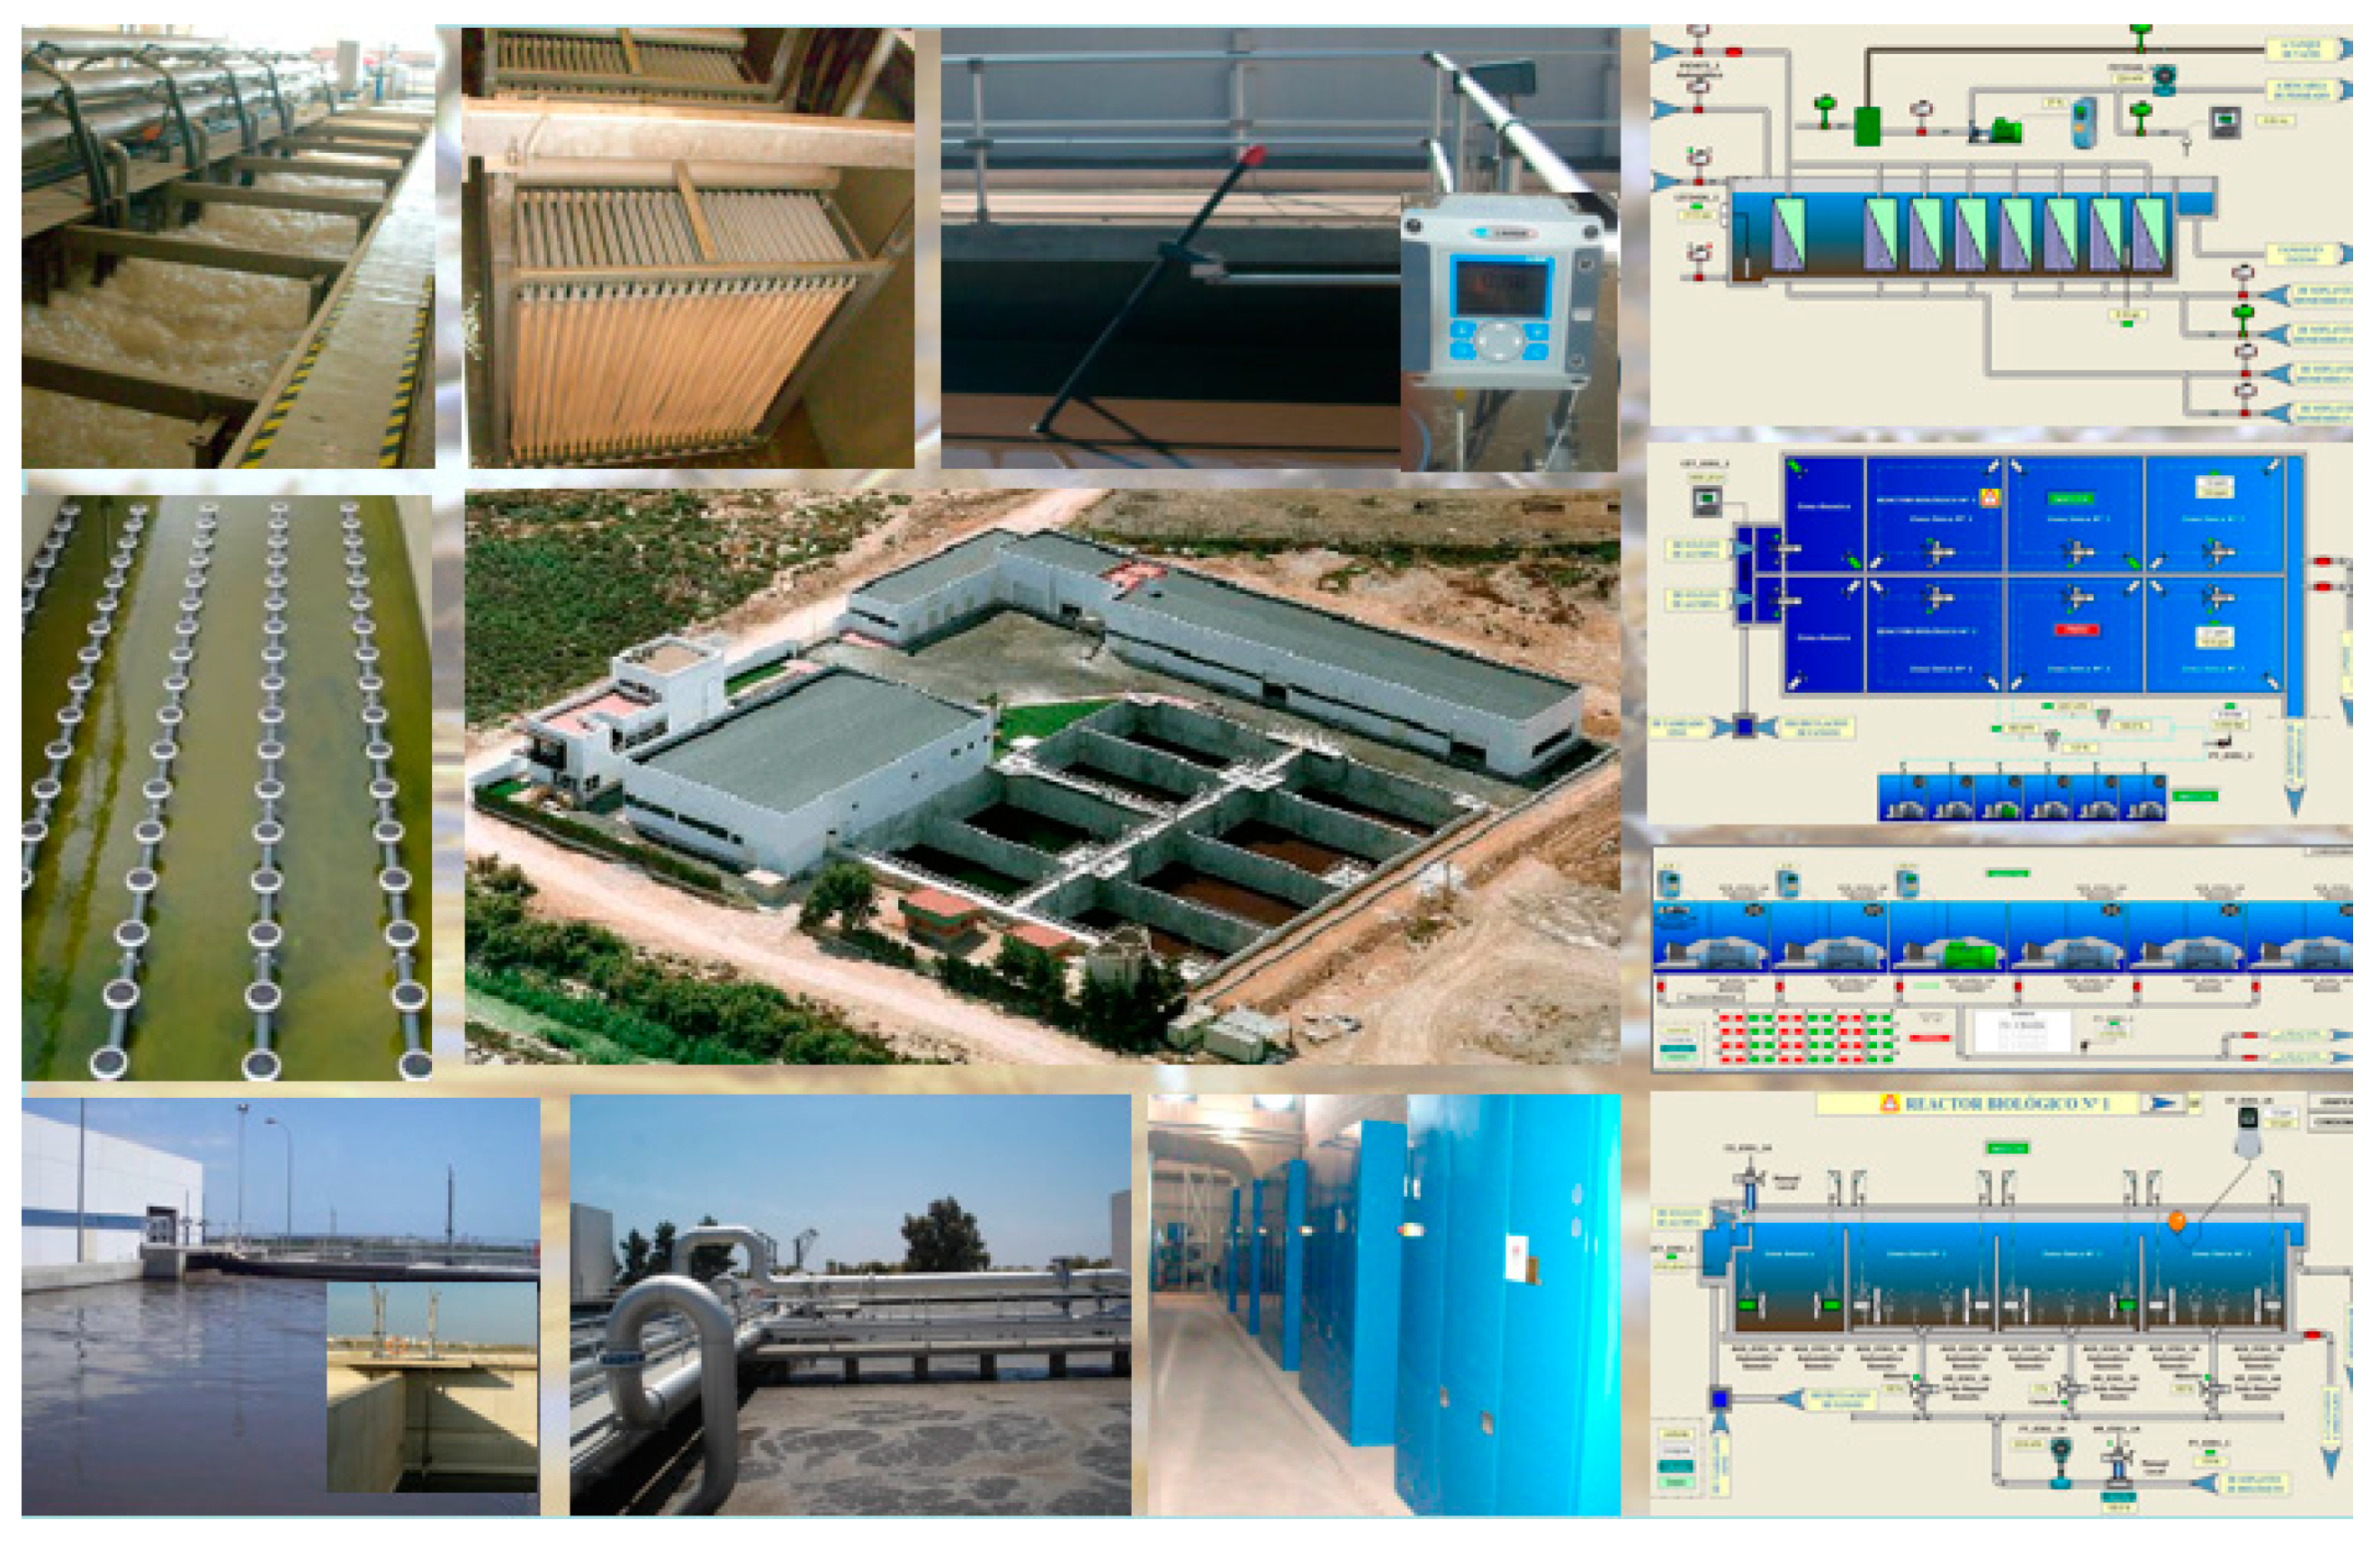
2.2. Starting Energy Conditions at the San Pedro del Pinatar WWTP
3. Materials and Methods
3.1. Study of the Specific Energy Consumption in Each of the Individual Stages of the WWTP
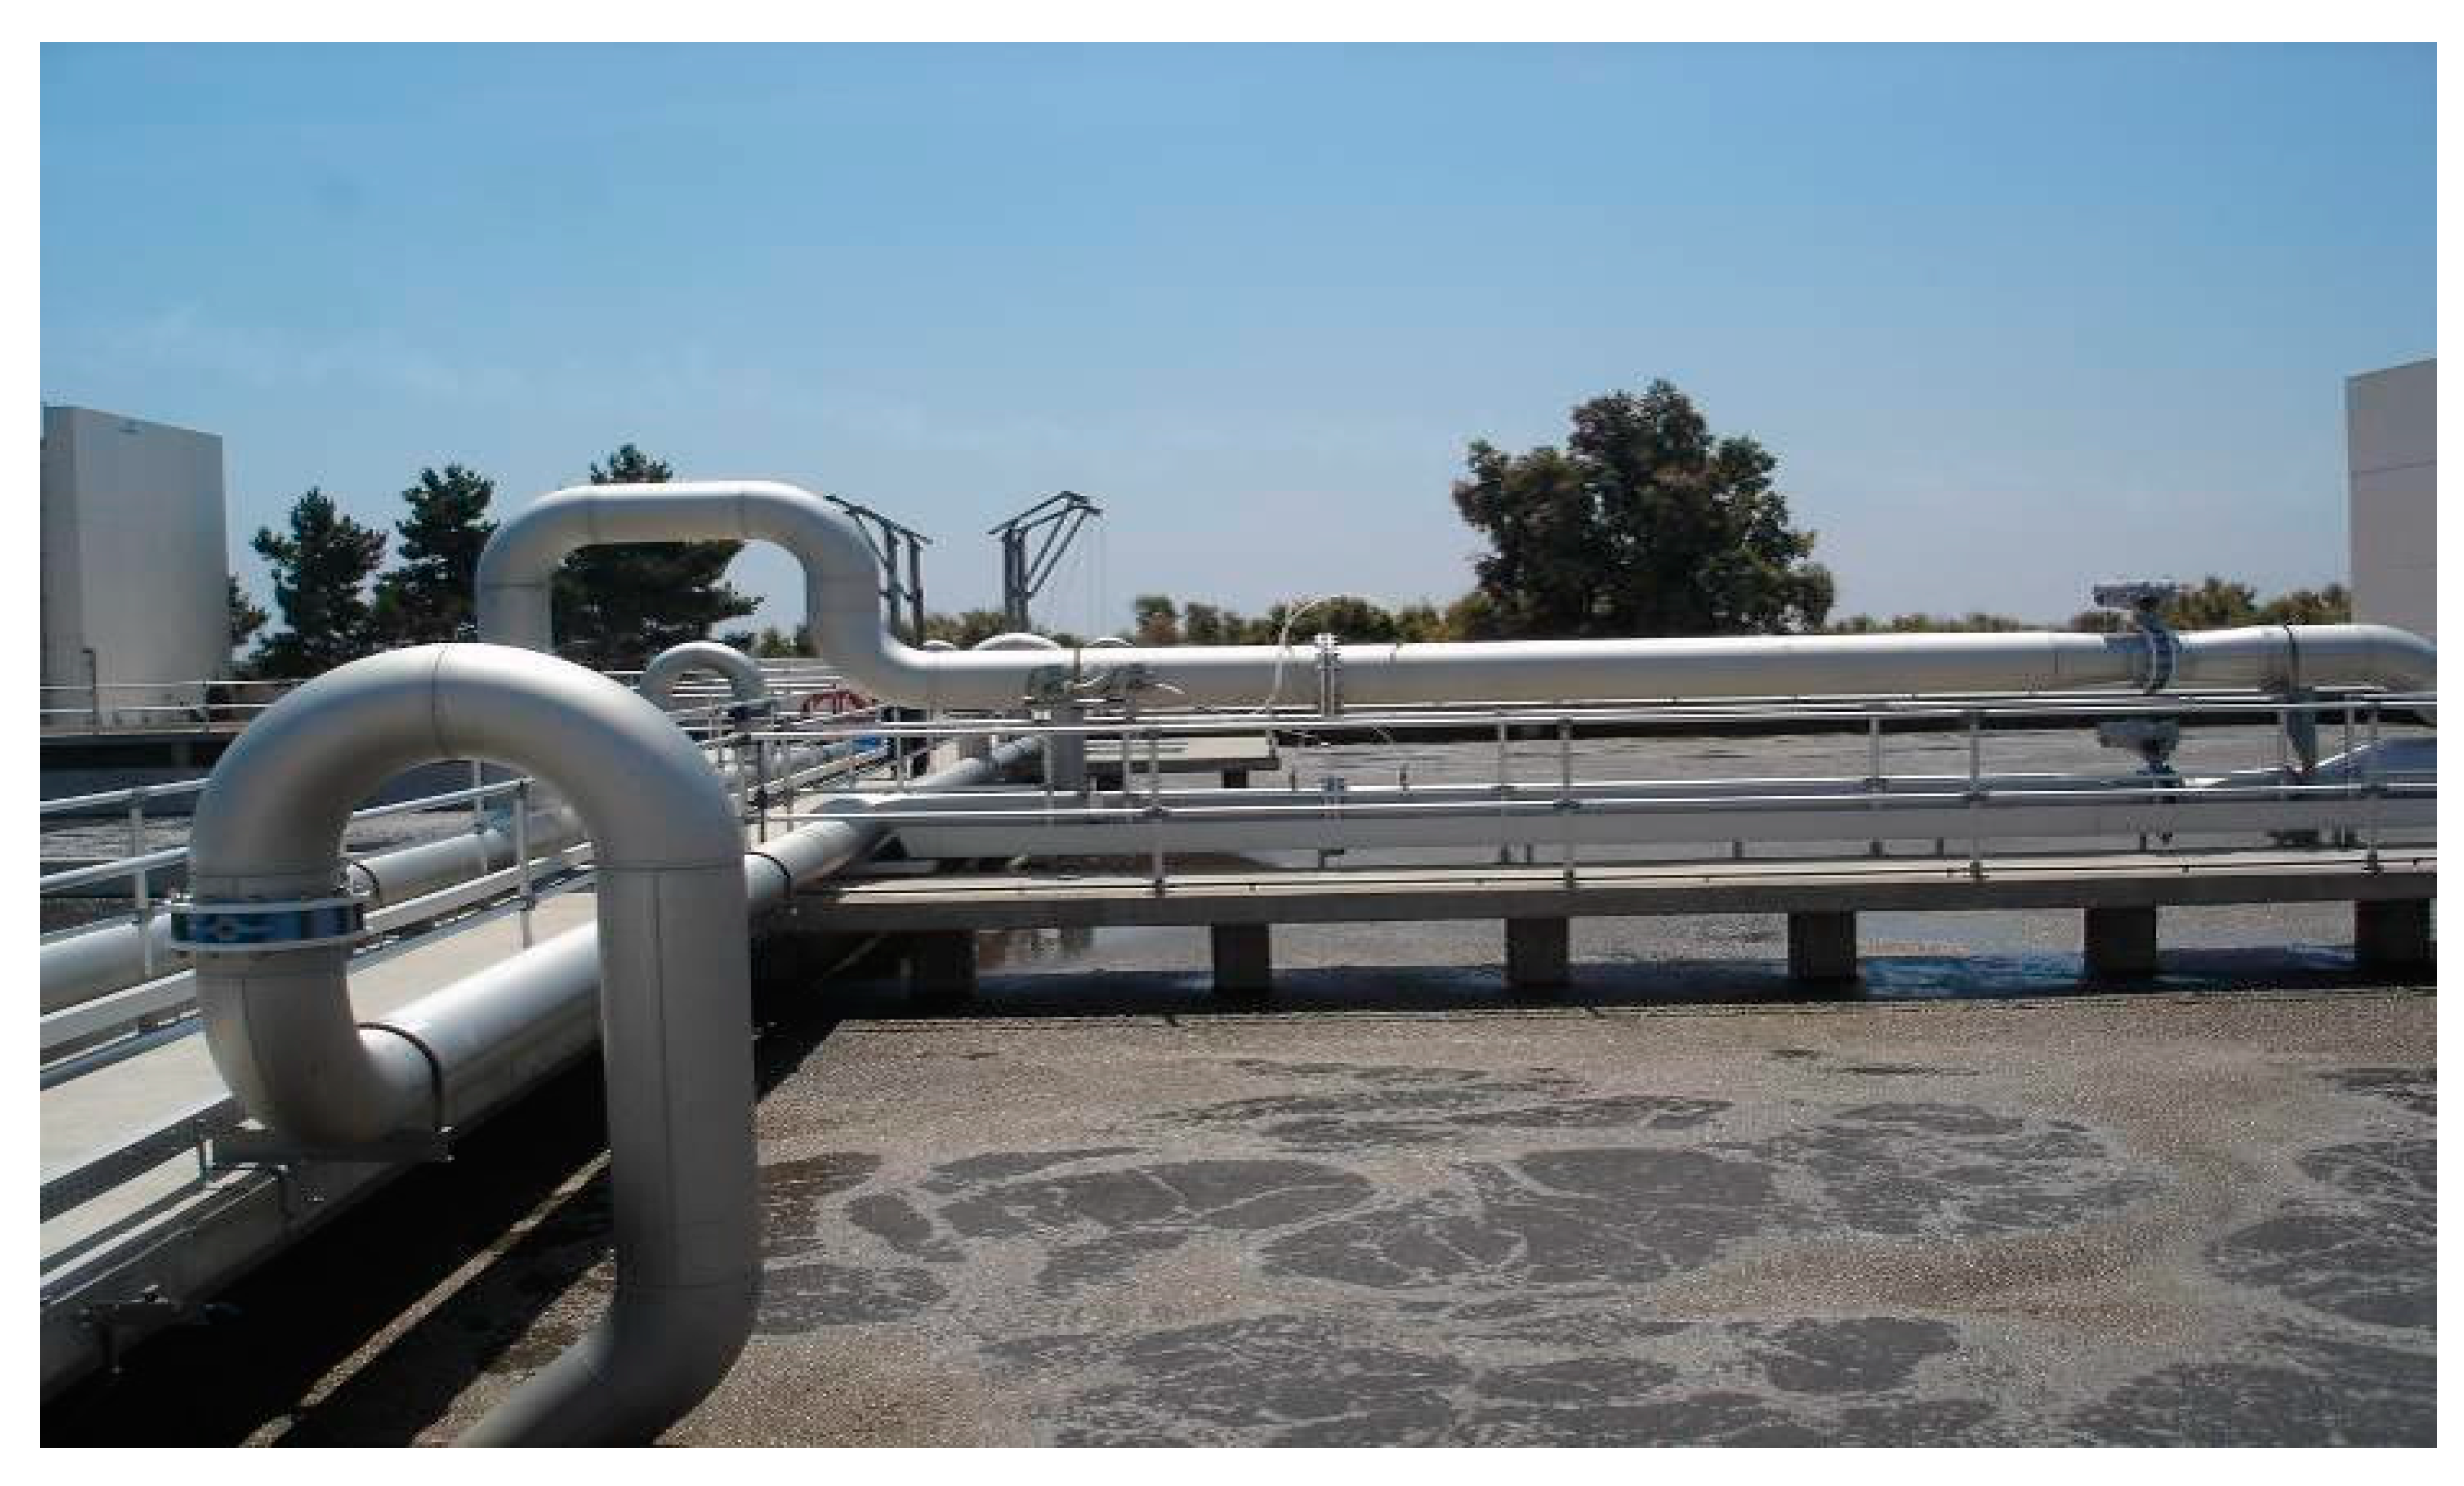
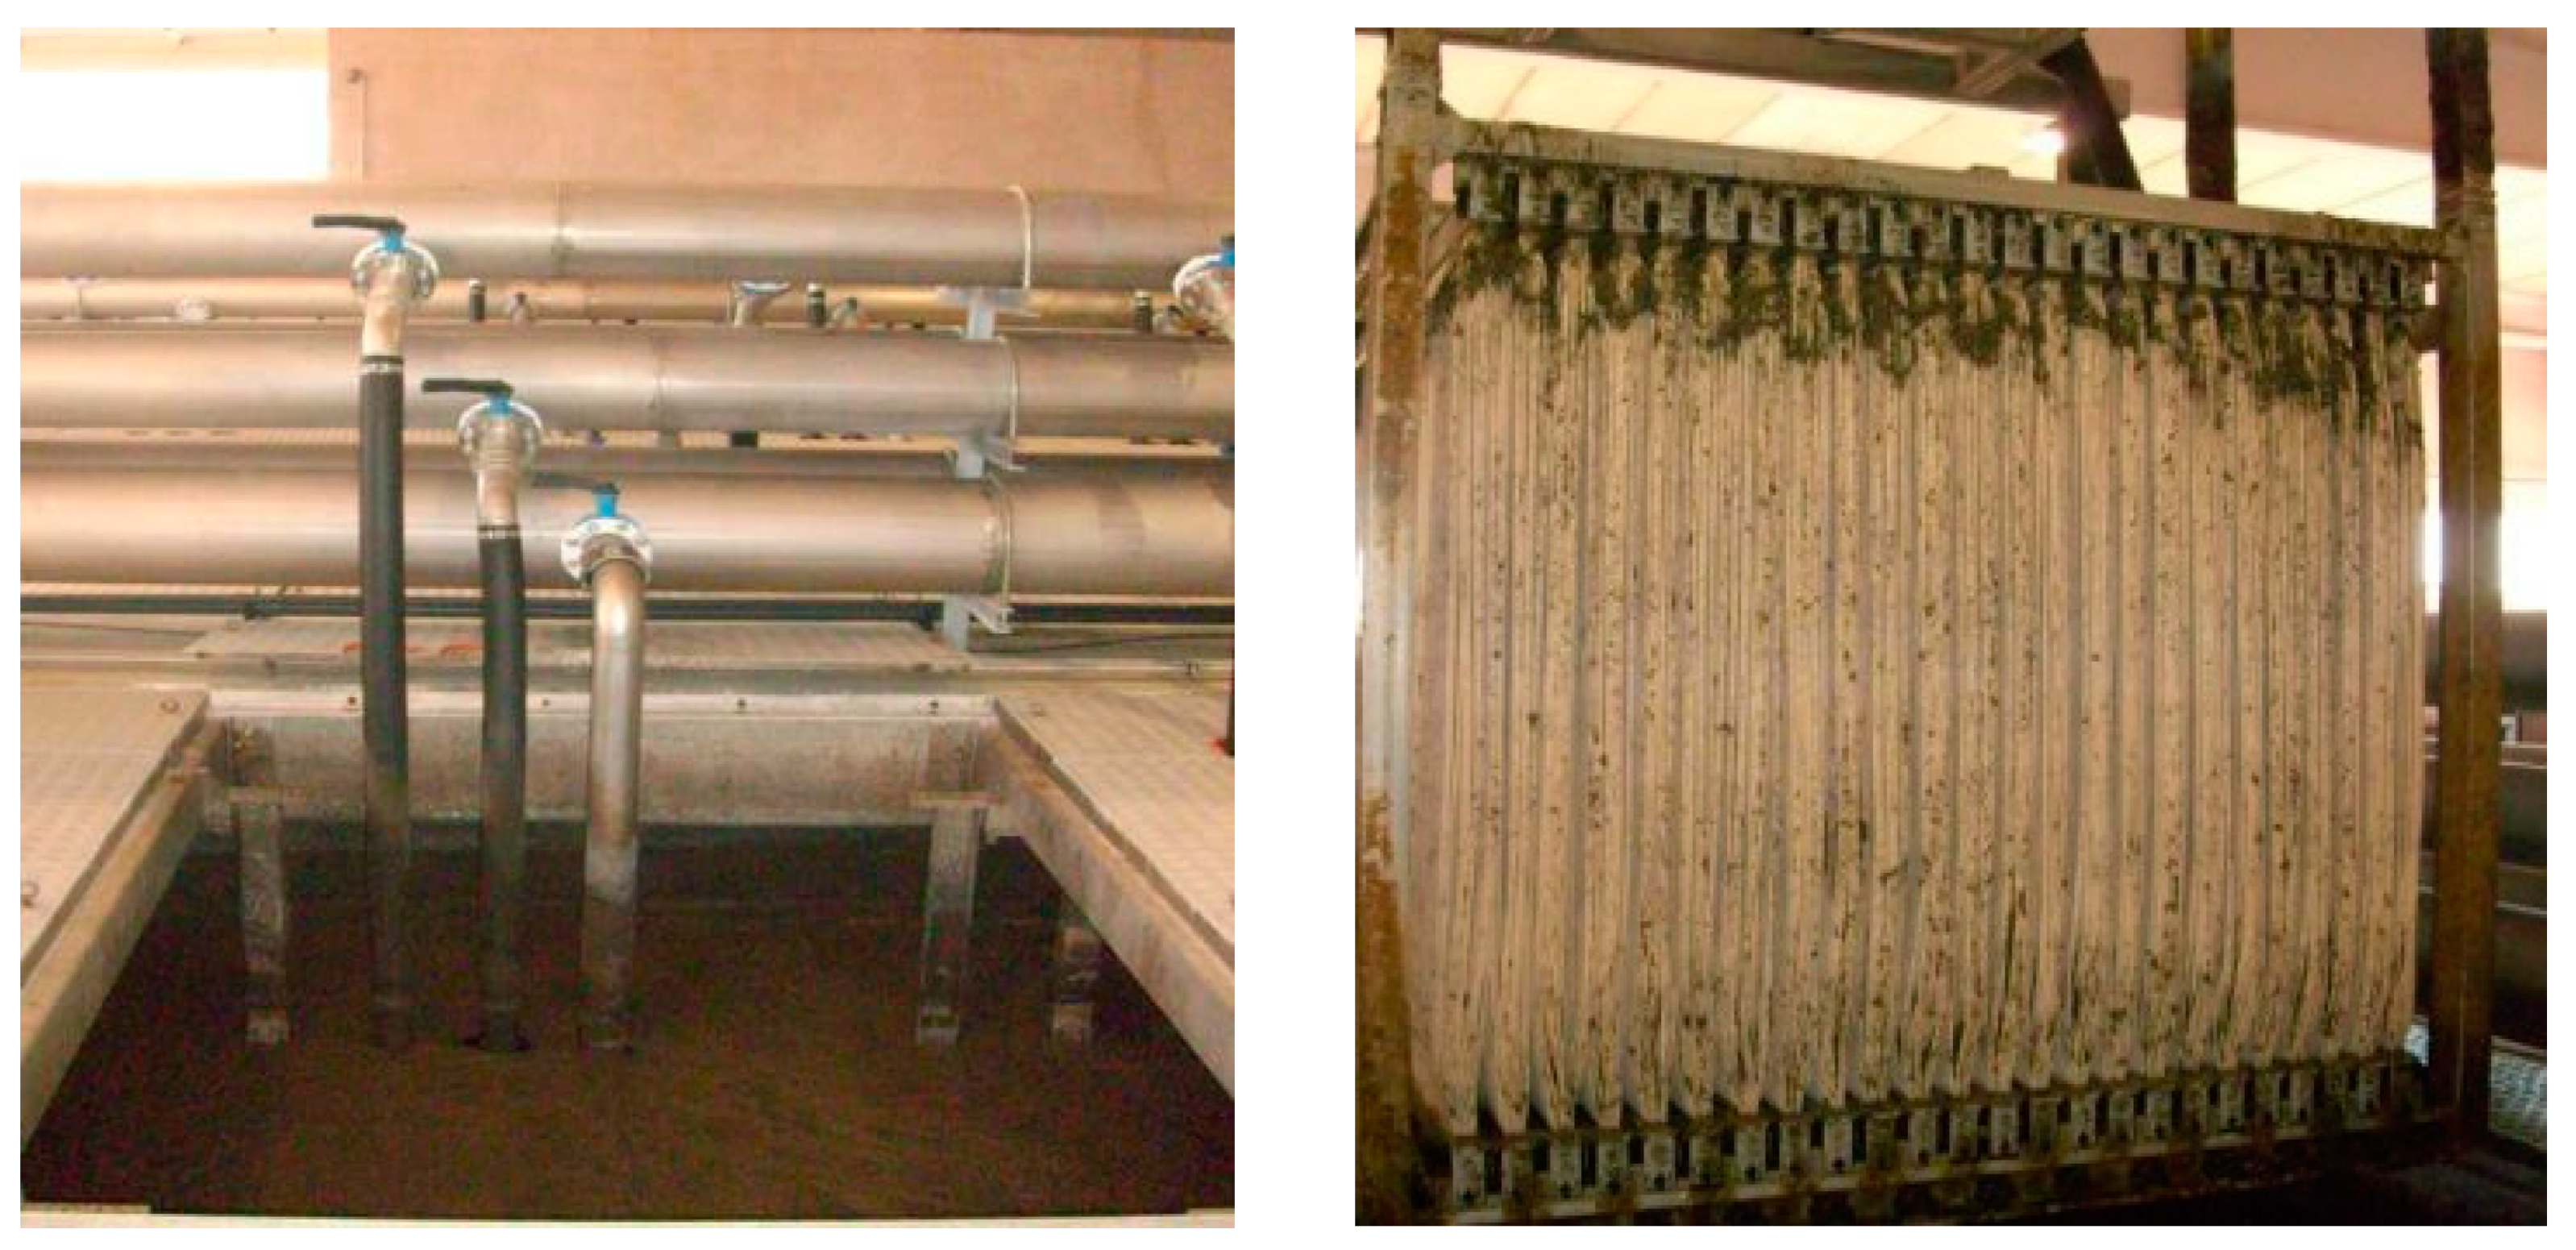
3.2. Analysis of the Installation and the Main Elements of the Activated Sludge Aeration System
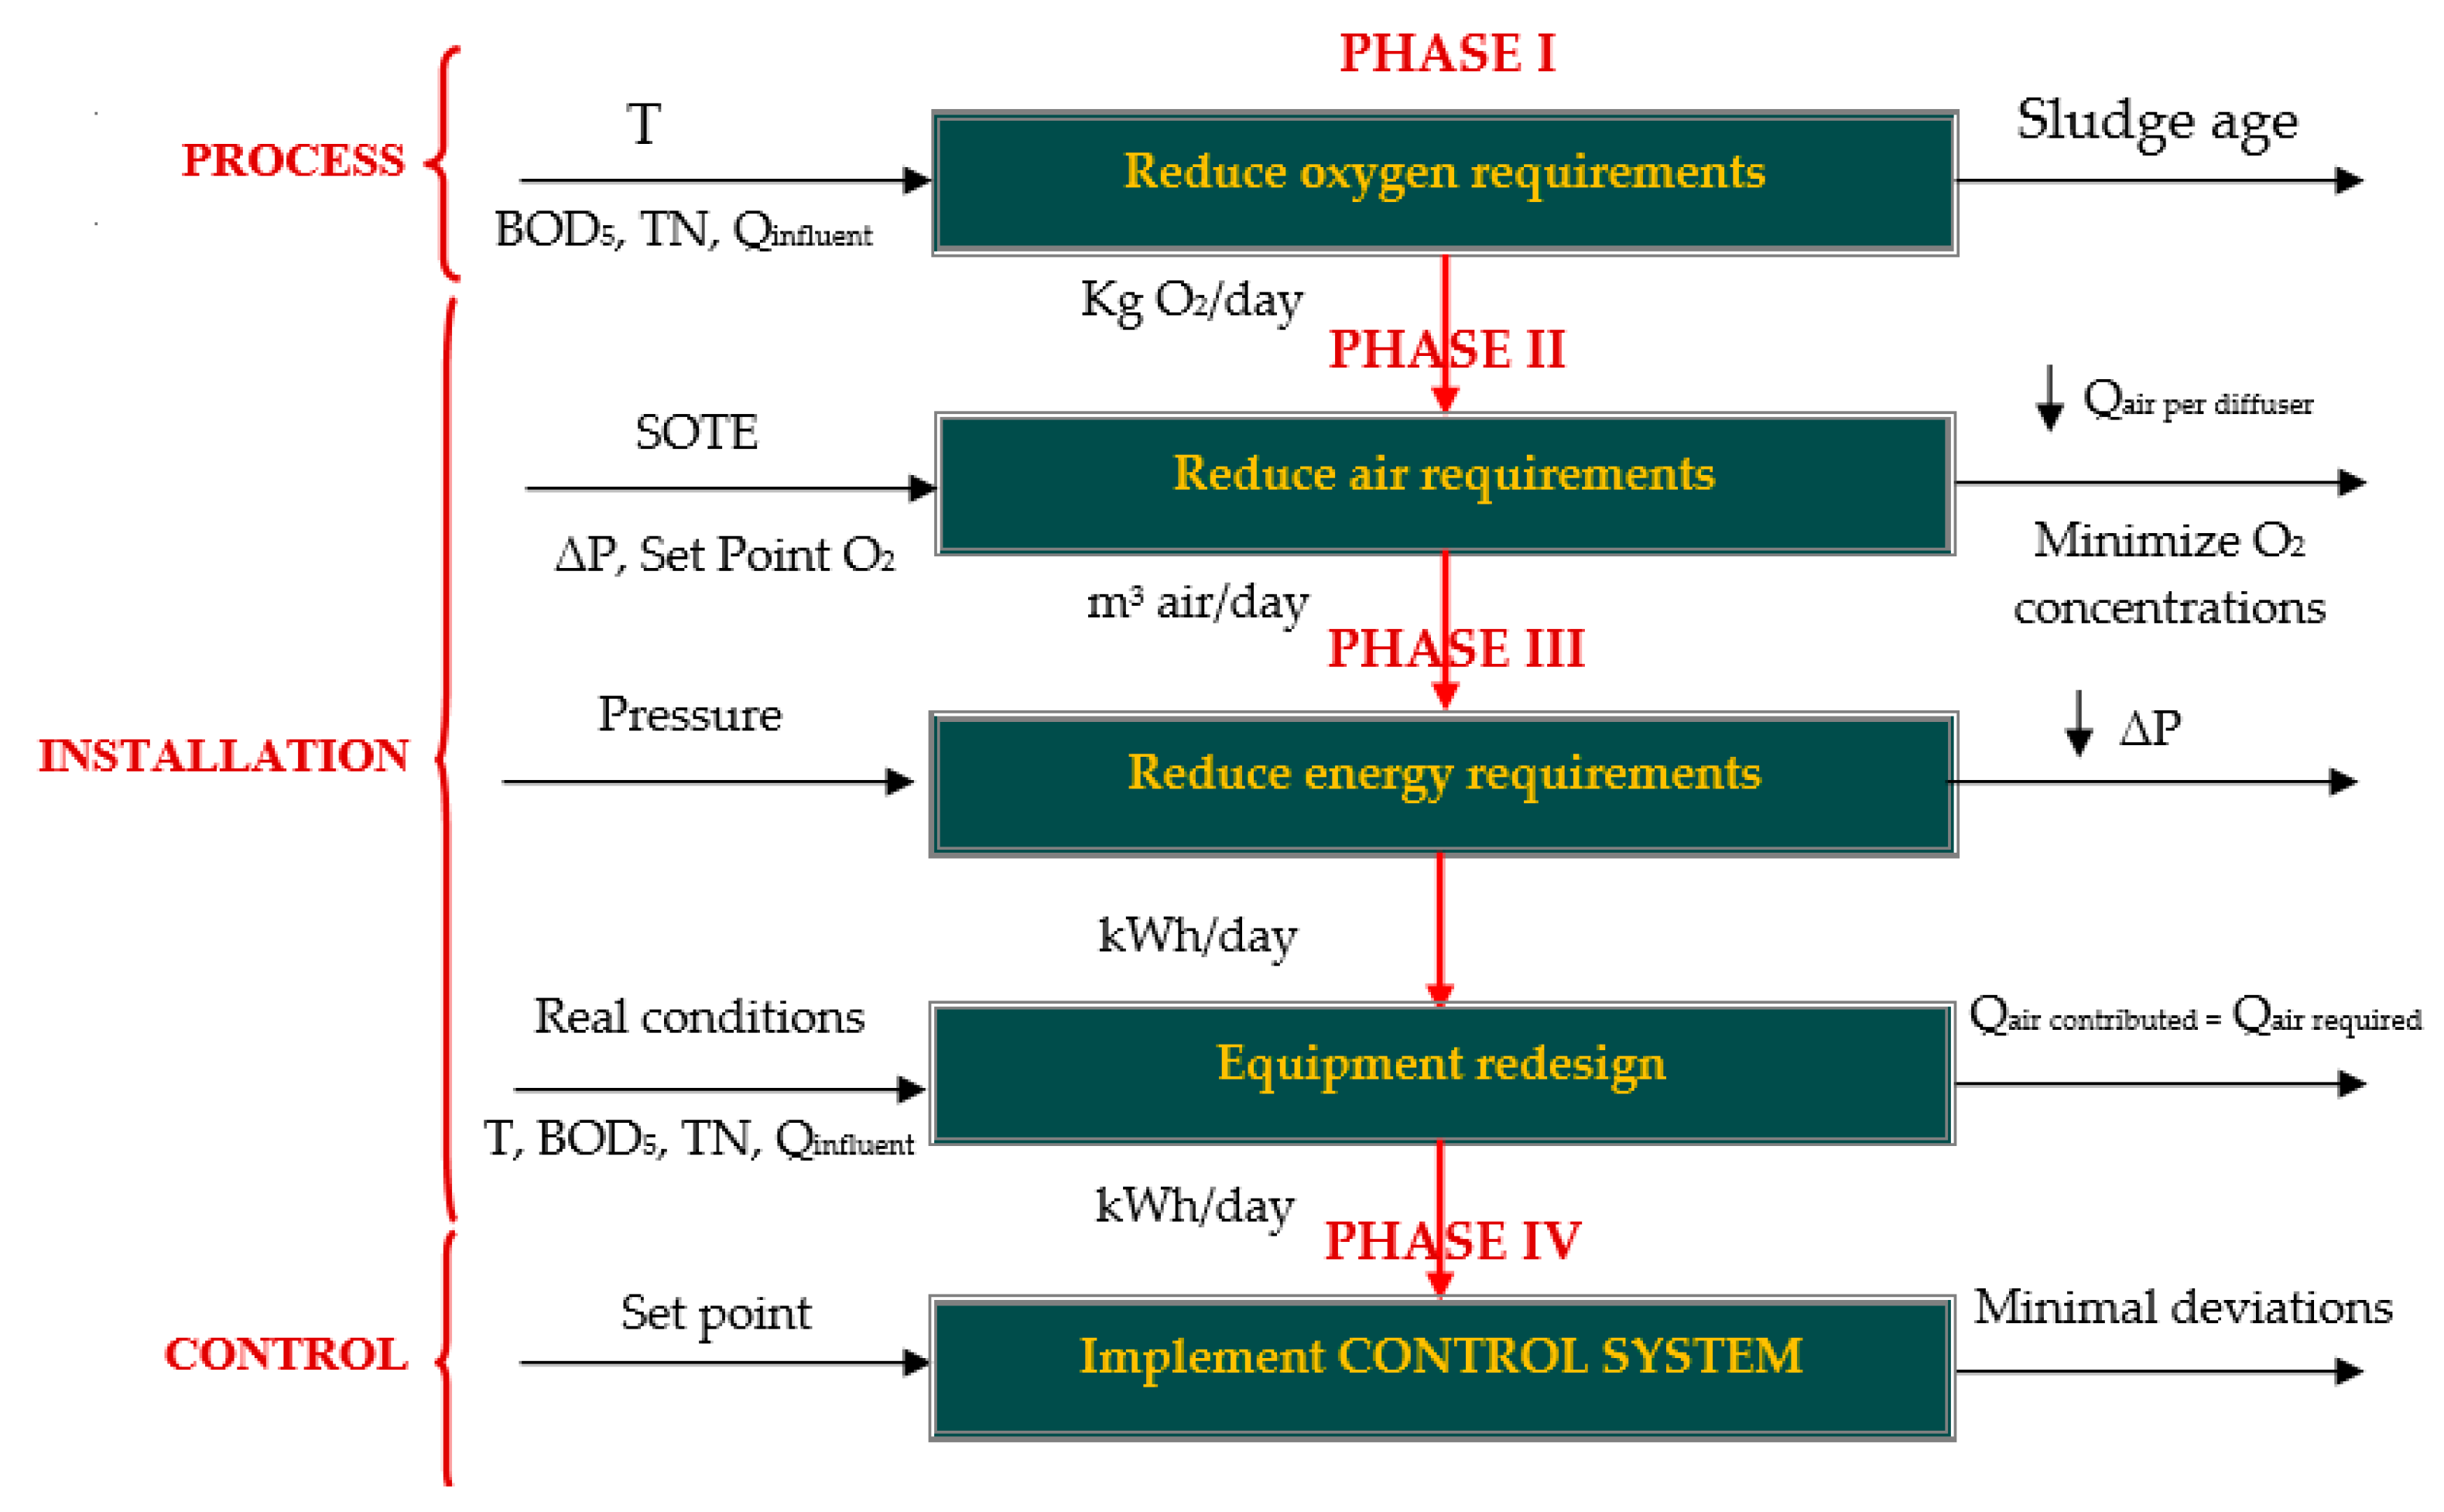
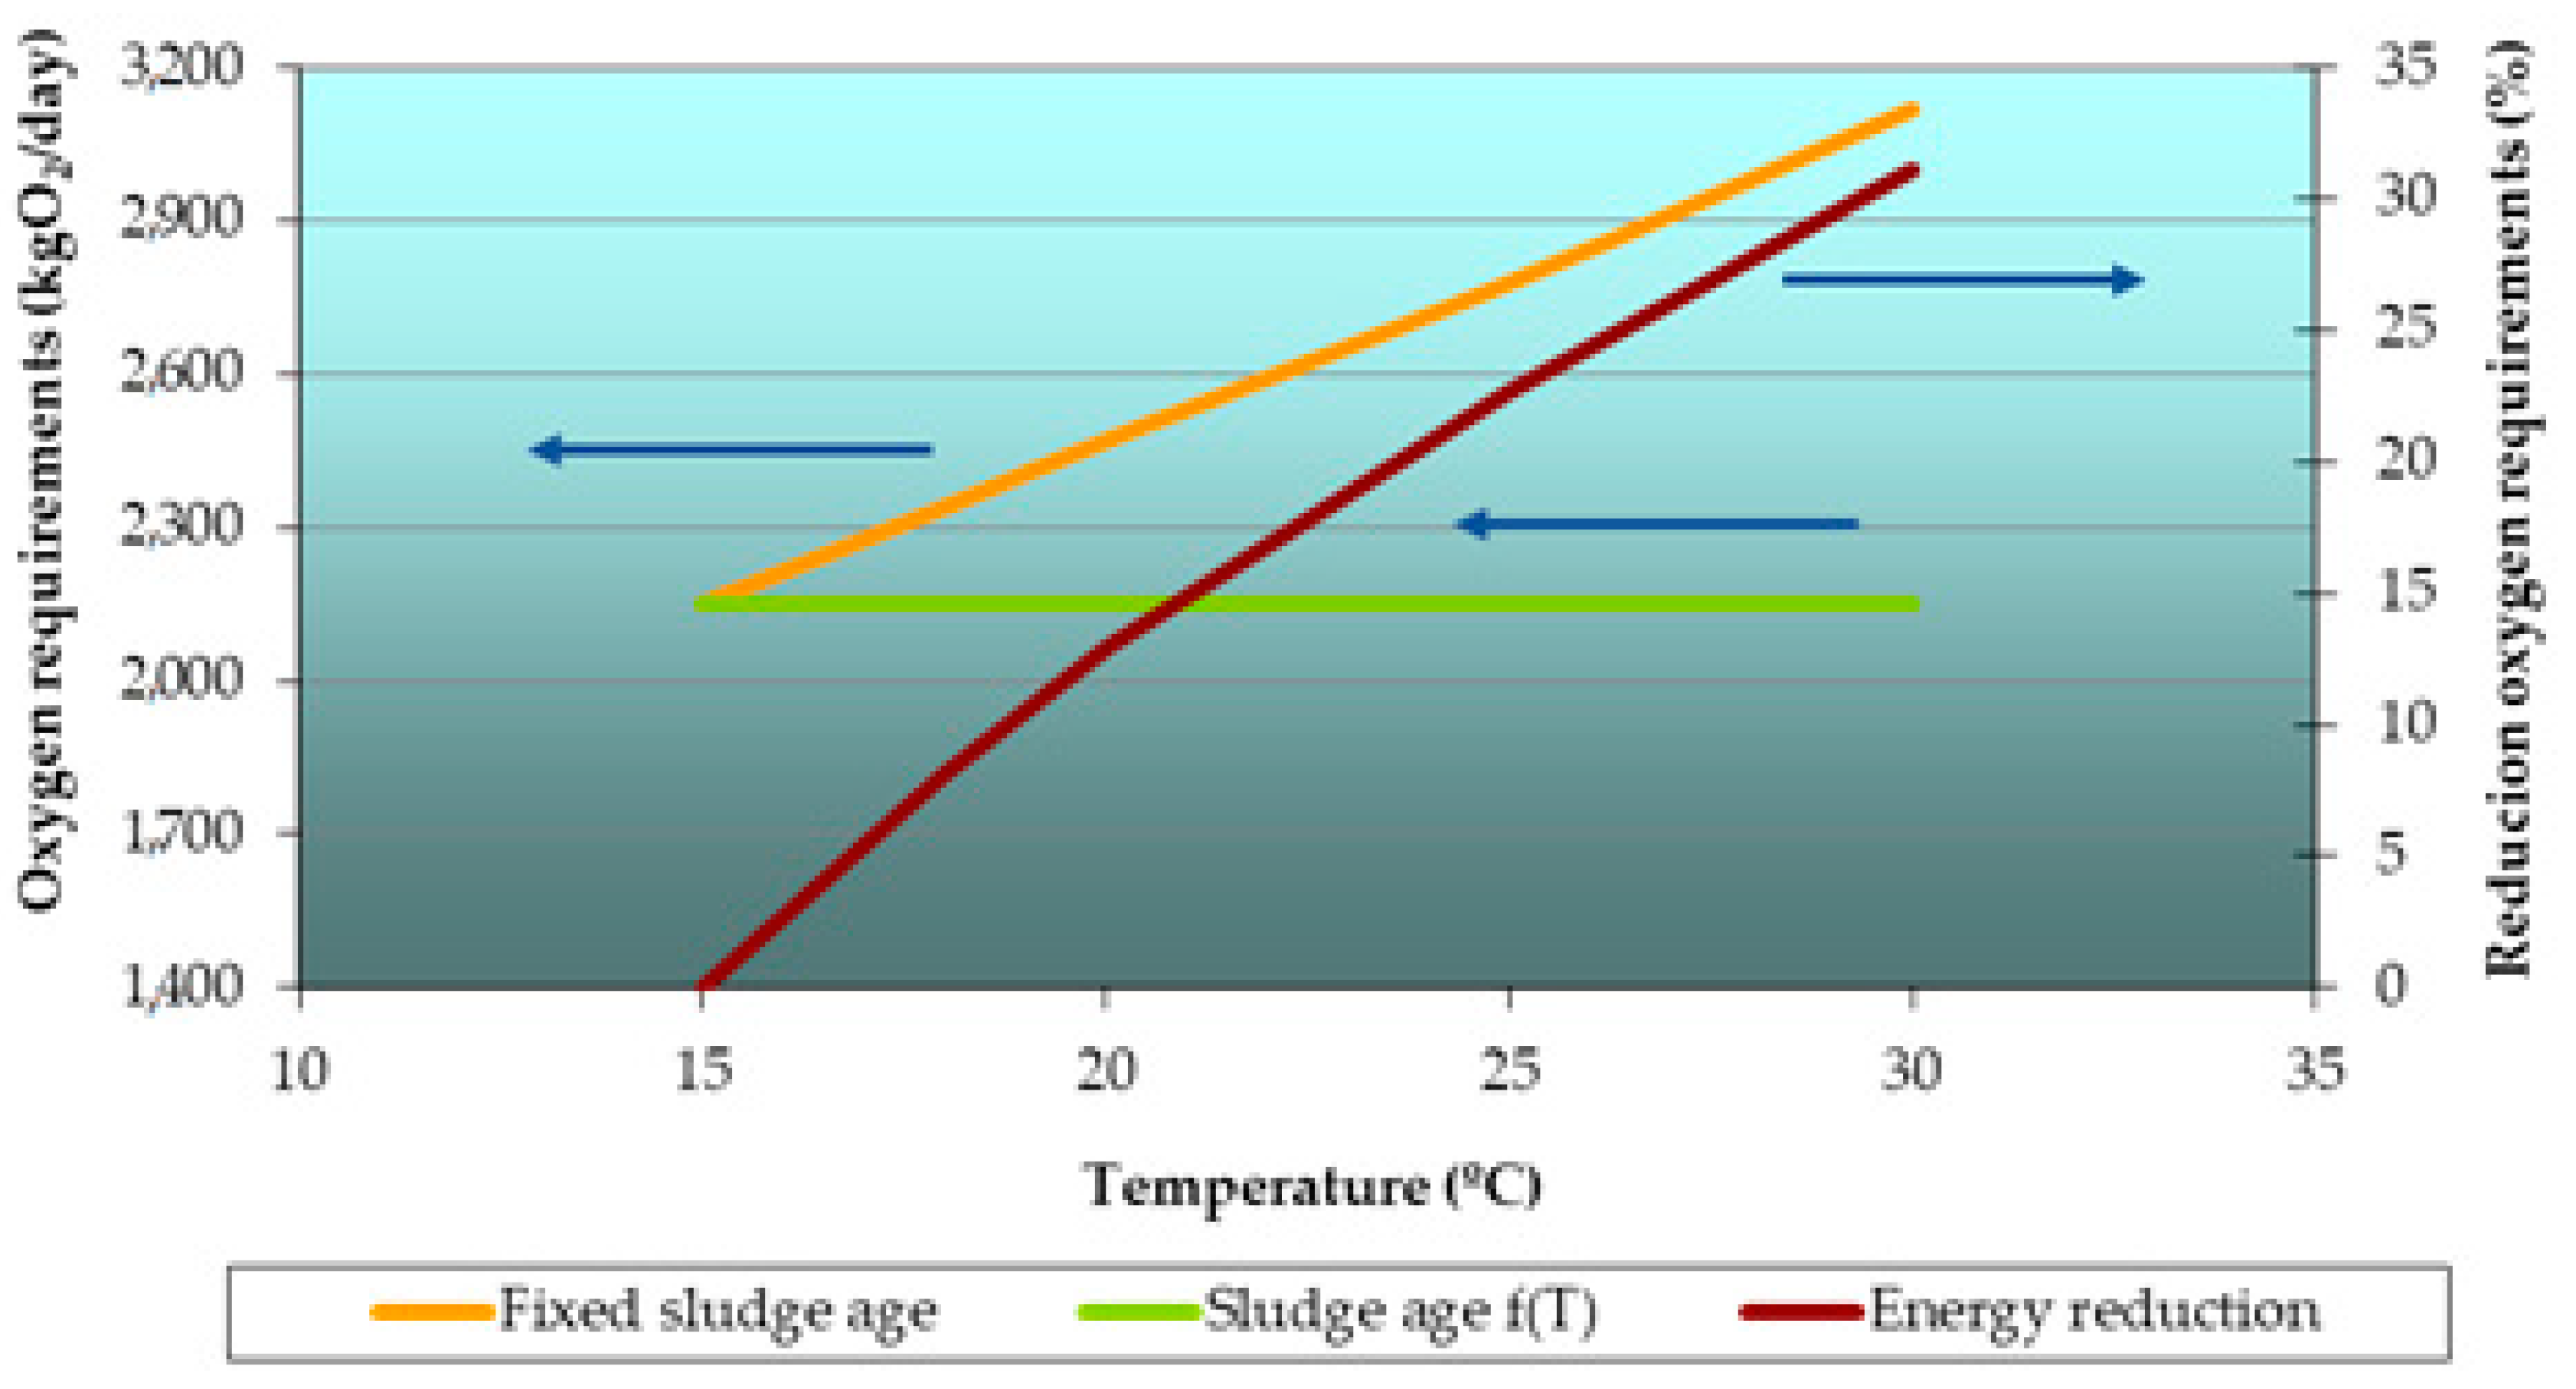
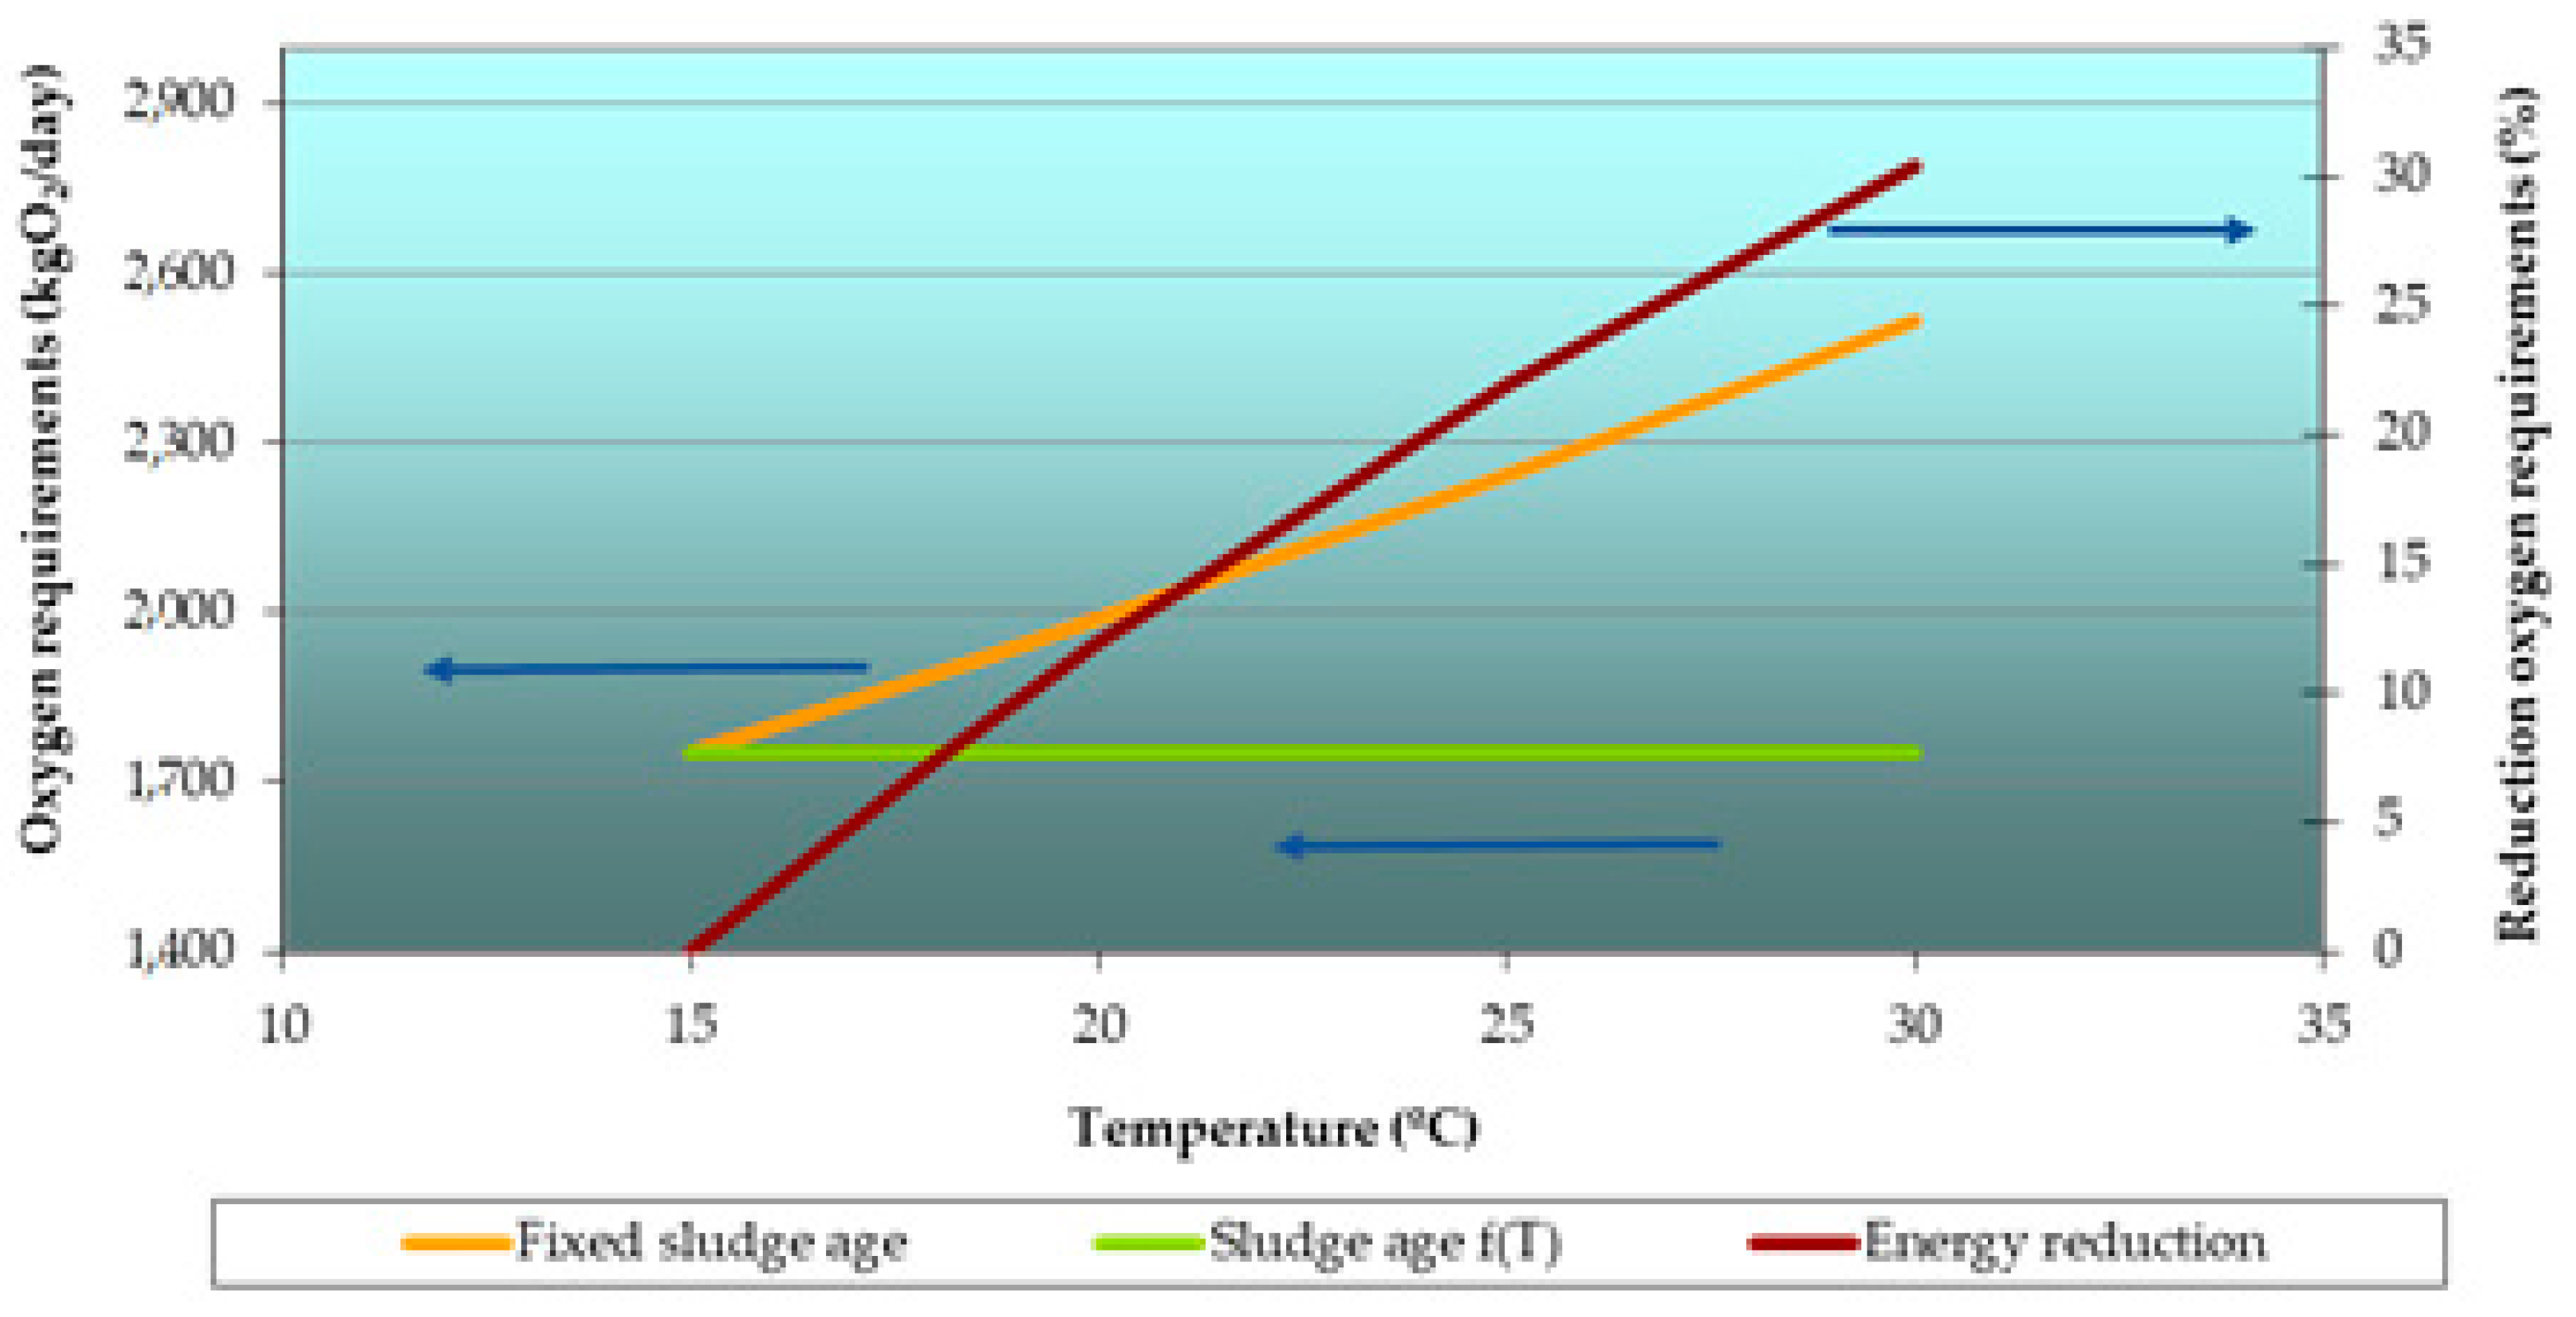
3.3. Tests for the Energy Optimization of a Biological Treatment Process
- Q influent is the inlet flow of wastewater to the biological reactor;
- SOTE is the standard oxygen transfer efficiency;
- ΔP is the pressure drop in air line and
- Q air is the flow of air injected into the biological reactor.
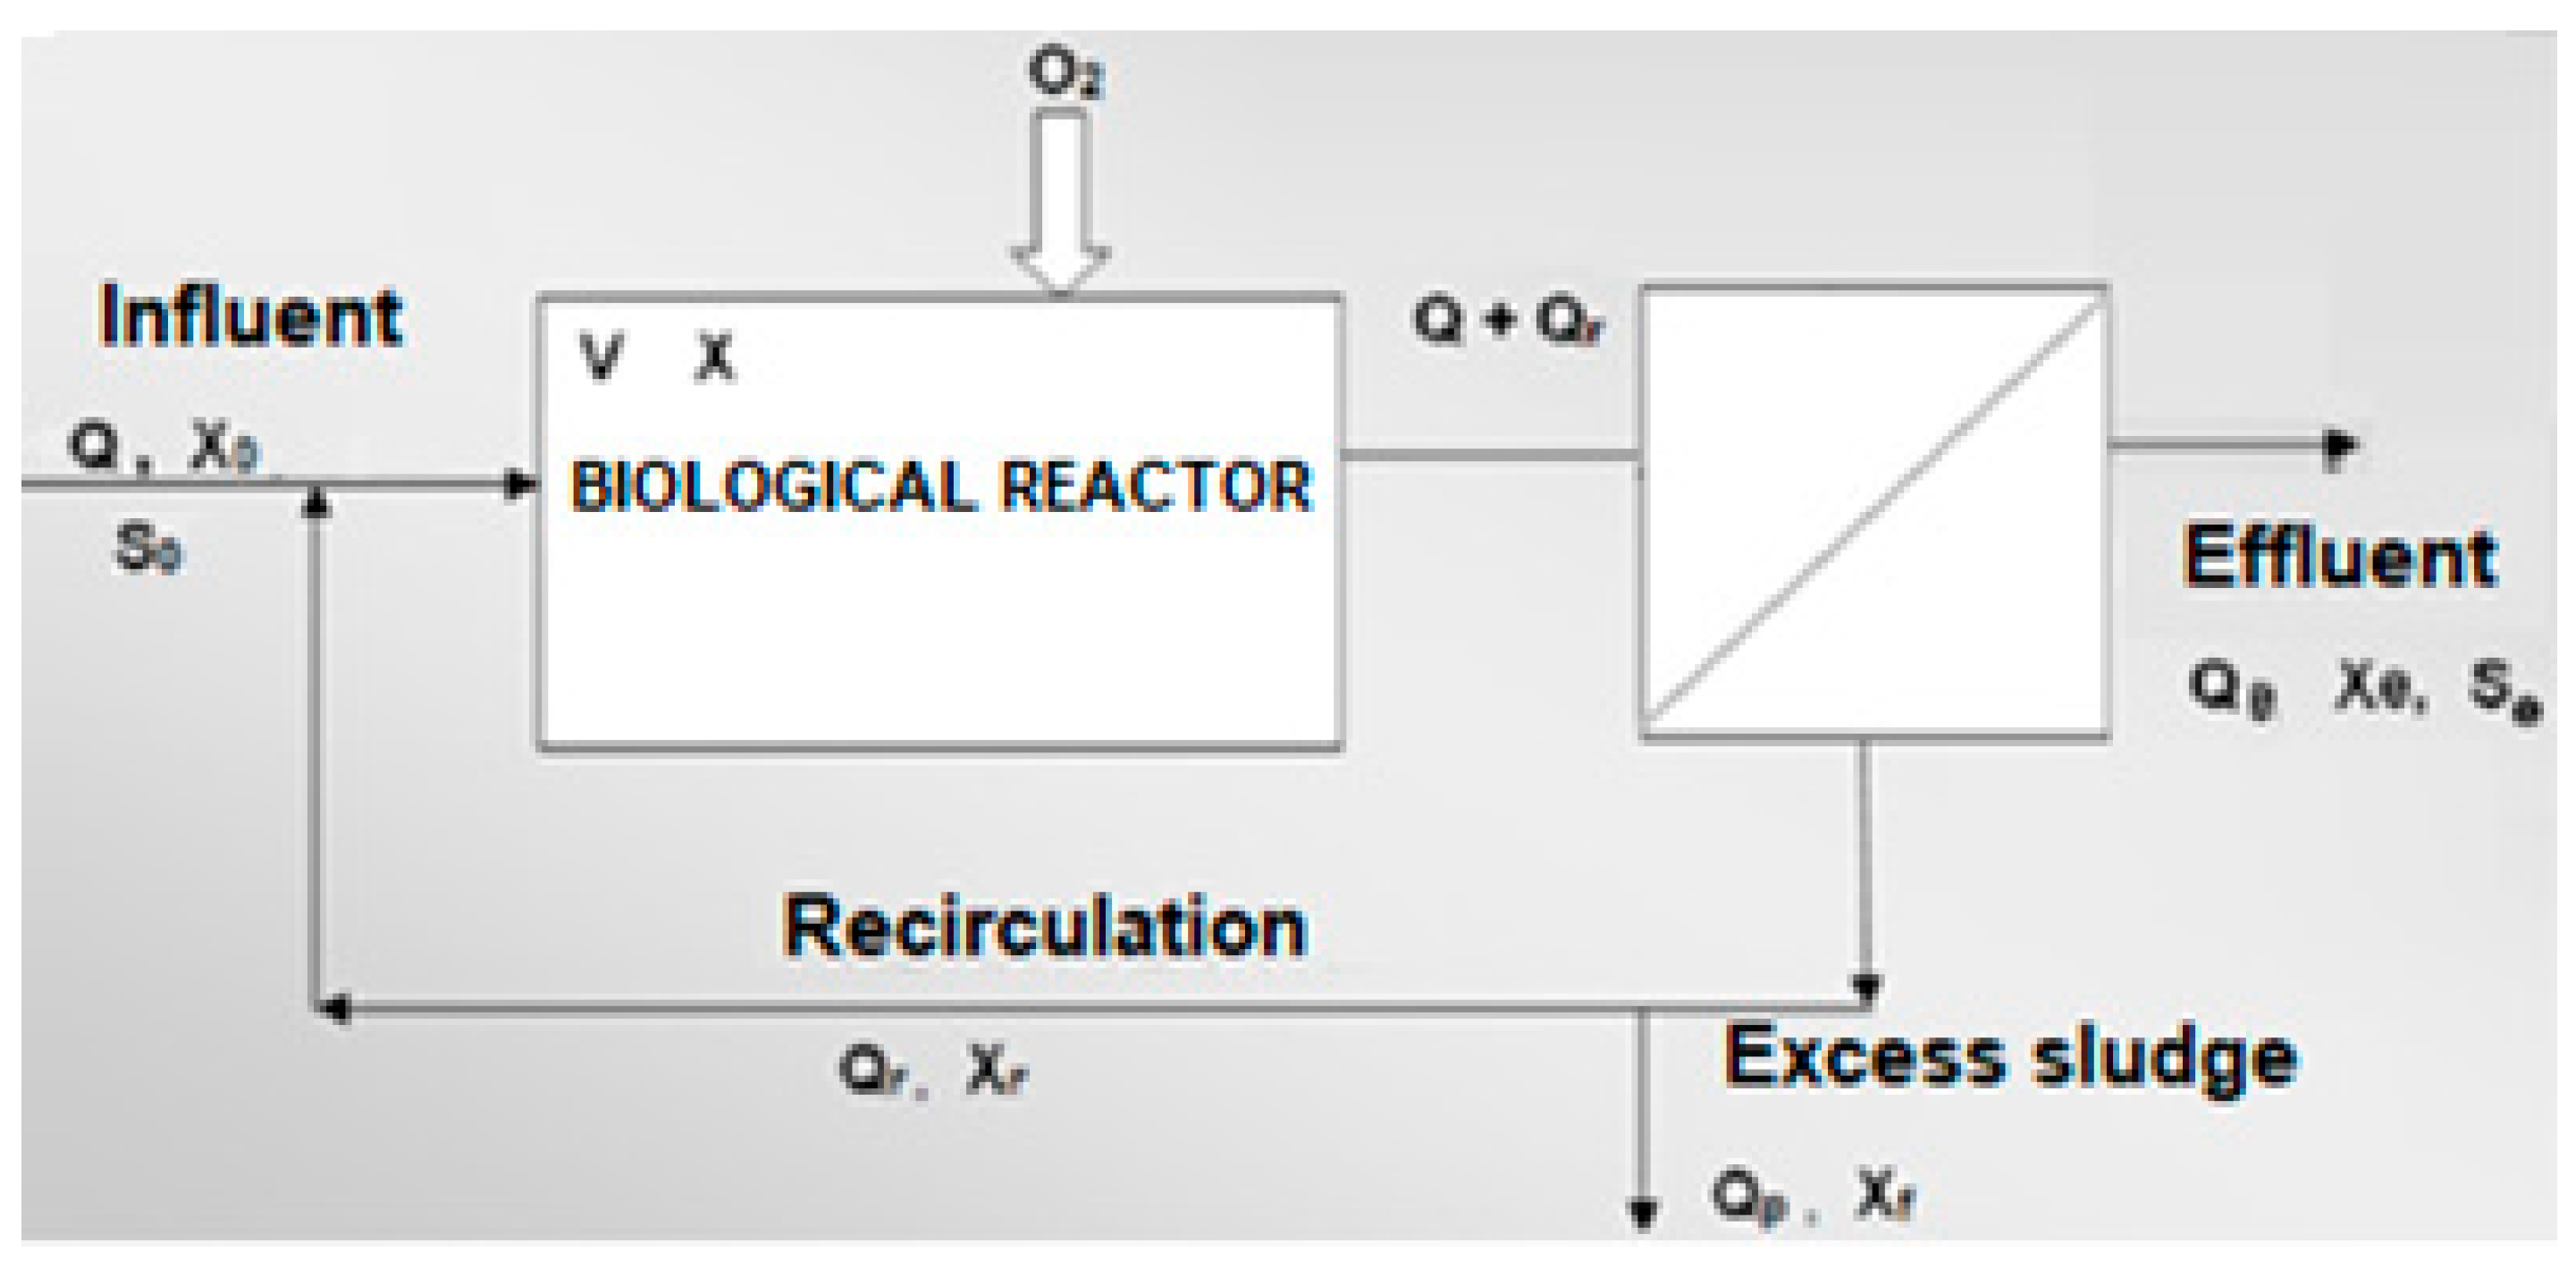
- Q is the inlet flow of wastewater to the biological reactor (m3/h);
- So is the BOD5 input (mg/L);
- V is the volume of the biological reactor (m3) and
- X is the concentration of the microorganisms in the reactor (mg/L).
- Qp is the excess sludge flow rate (m3/d)
- Xr is the concentration of microorganisms in the recirculation stream (mg/L) and
- Xp is the concentration of microorganisms in the purge stream (mg/L) (Xp = Xr).
- ➢
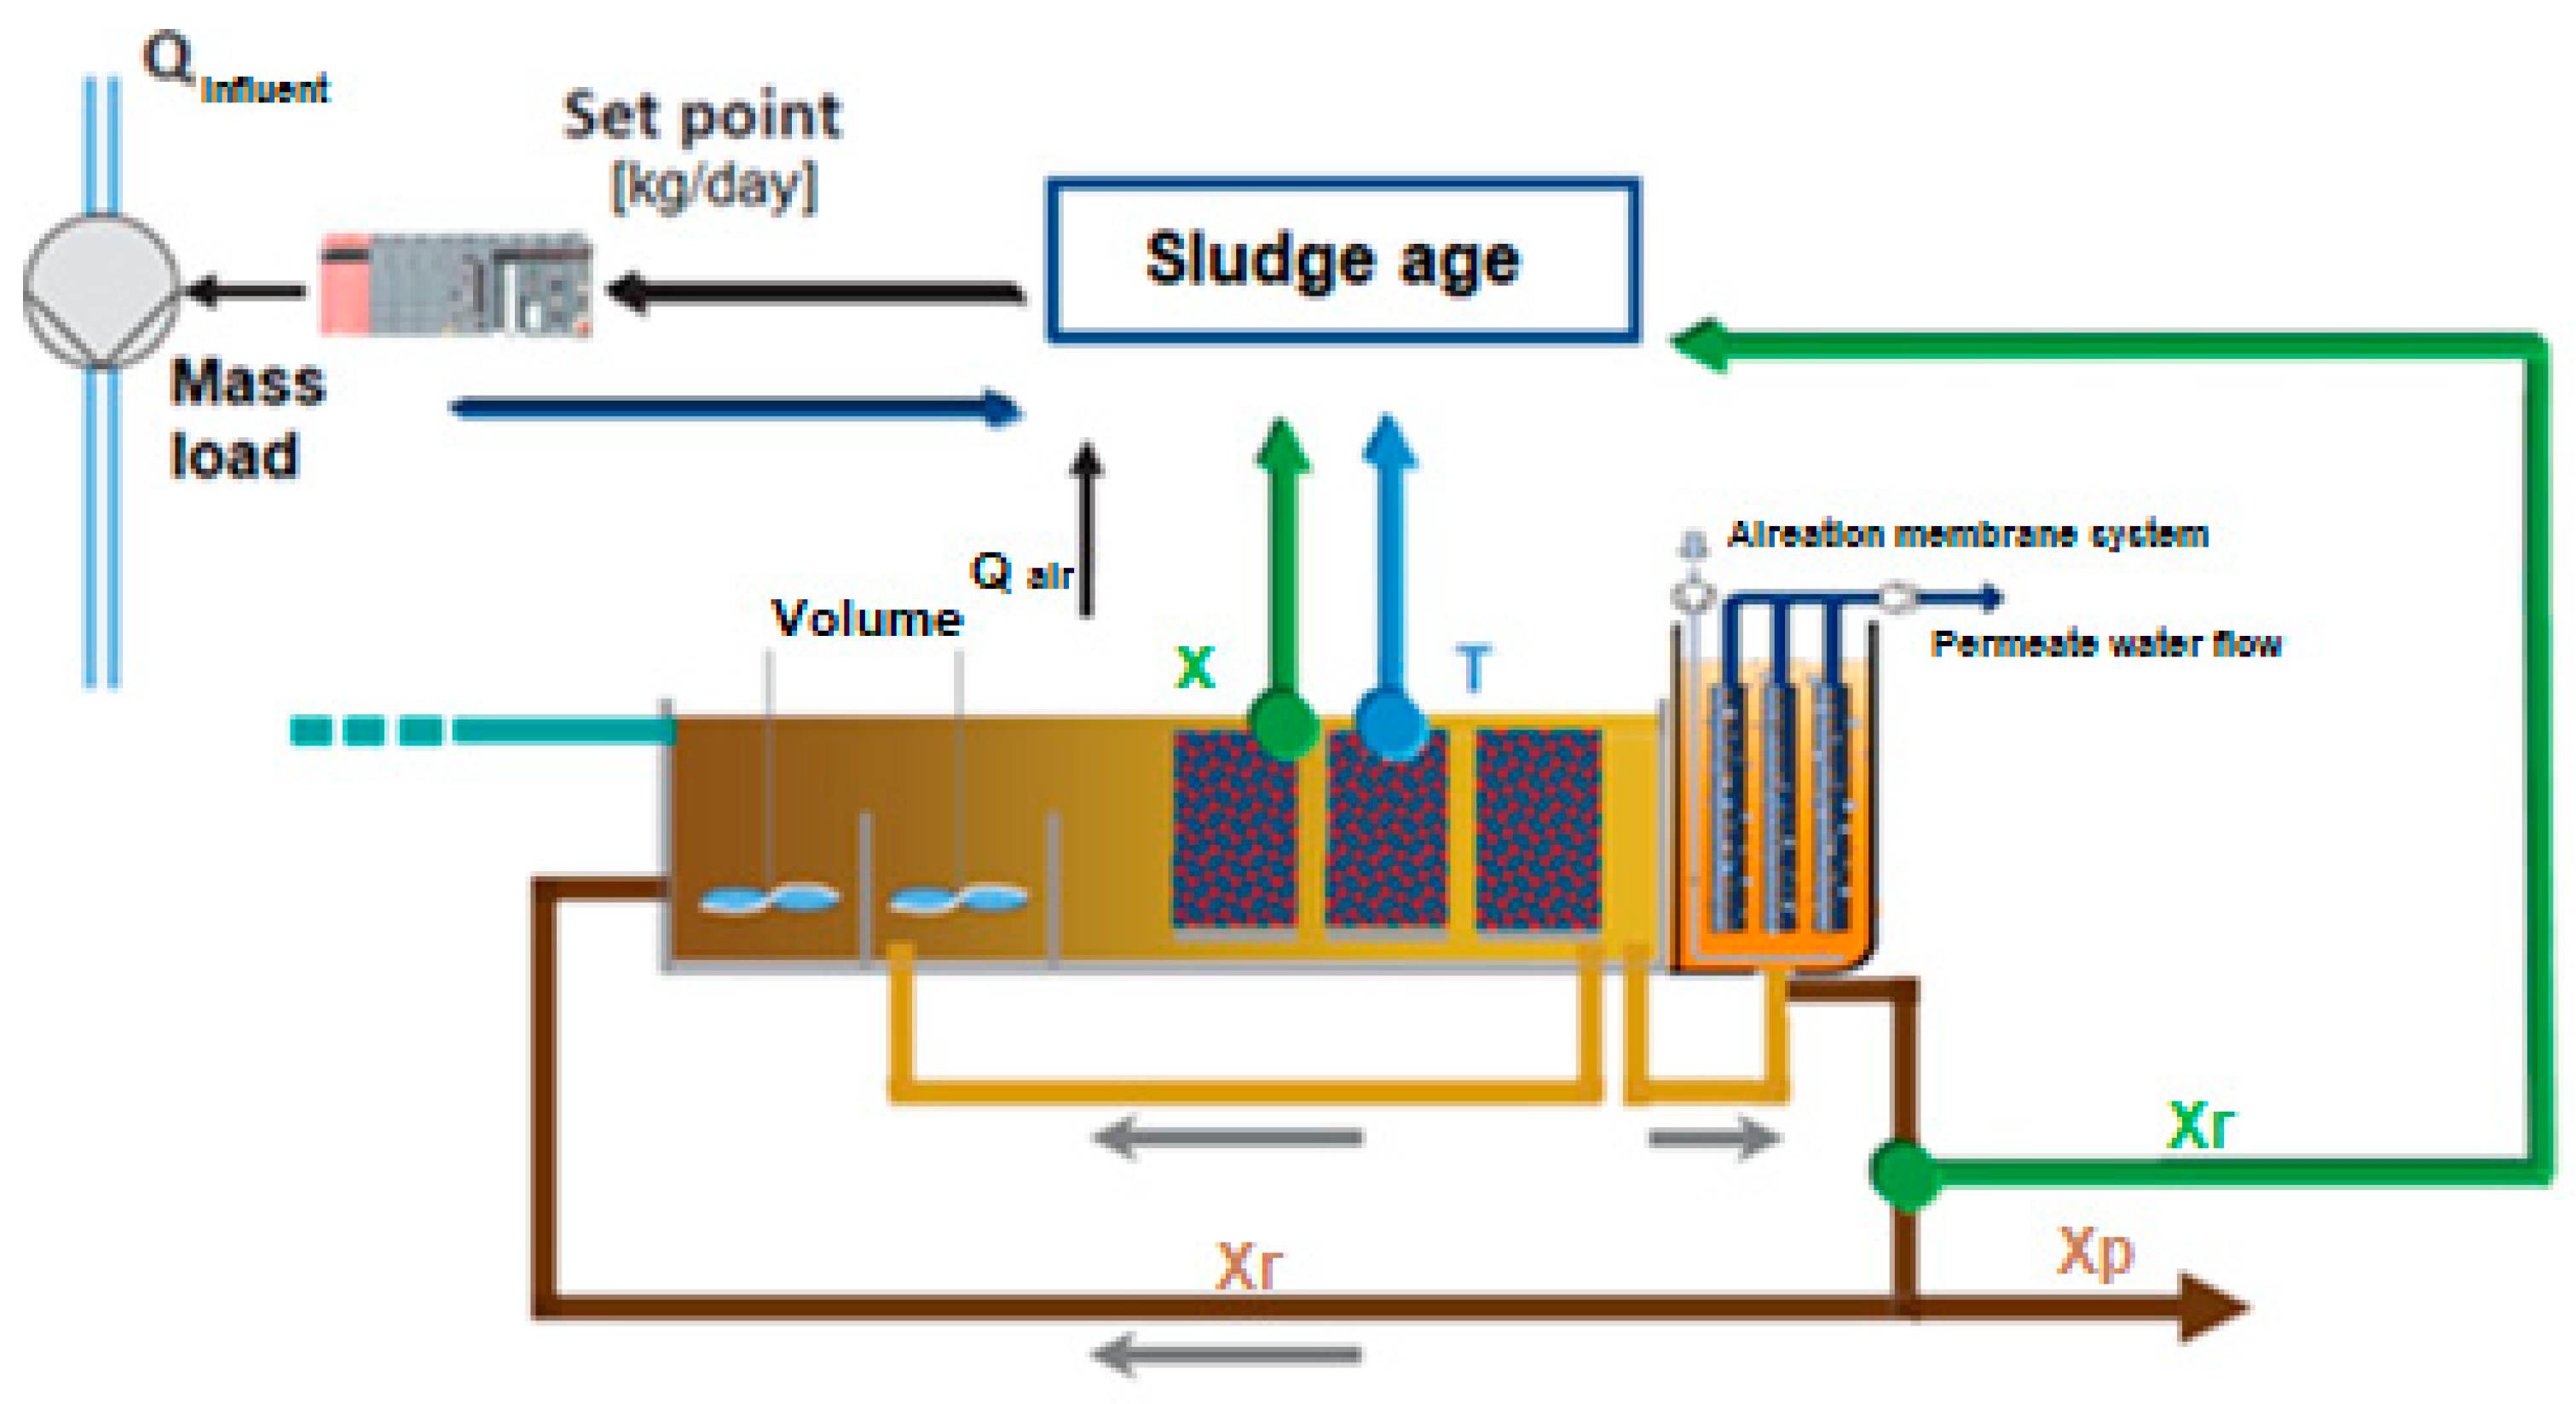
- Automatic control system for sludge purging according to the sludge age.
- Excess sludge flow purged to the sludge homogenization tank, inlet to the dewatering equipment.
- Concentration of solids in the biological reactor.
- Concentration of solids in the sludge purge.
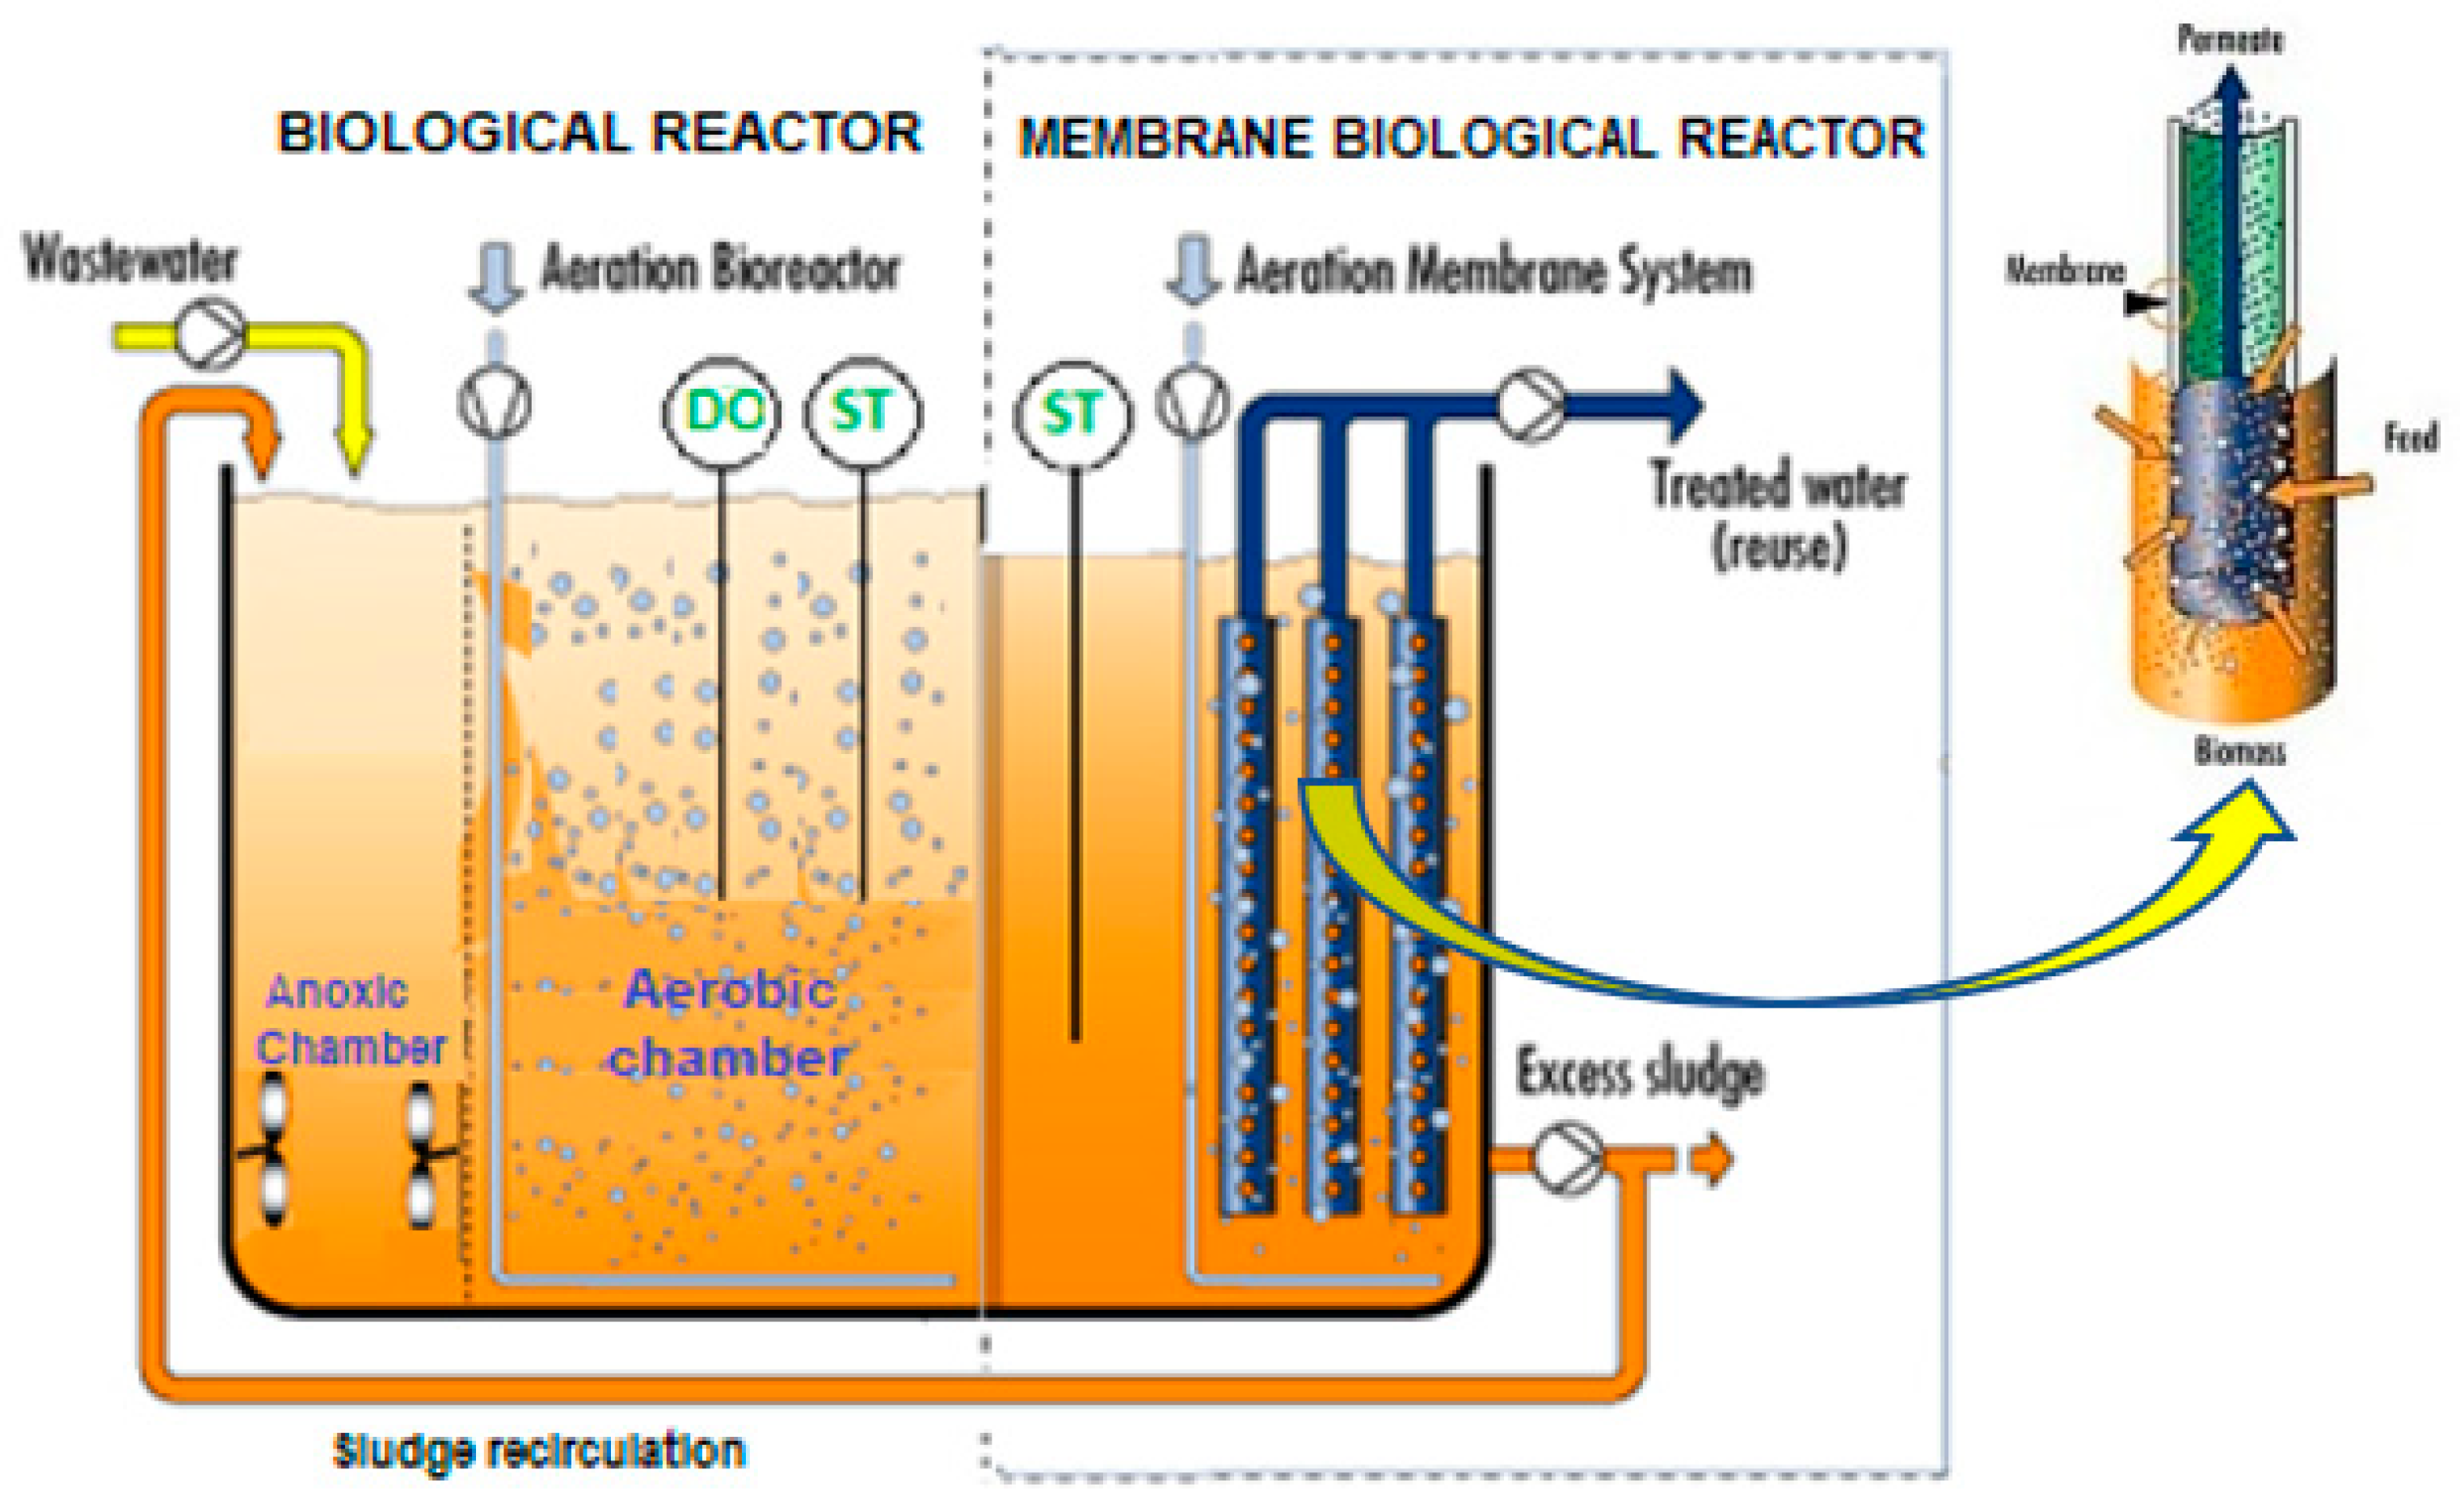
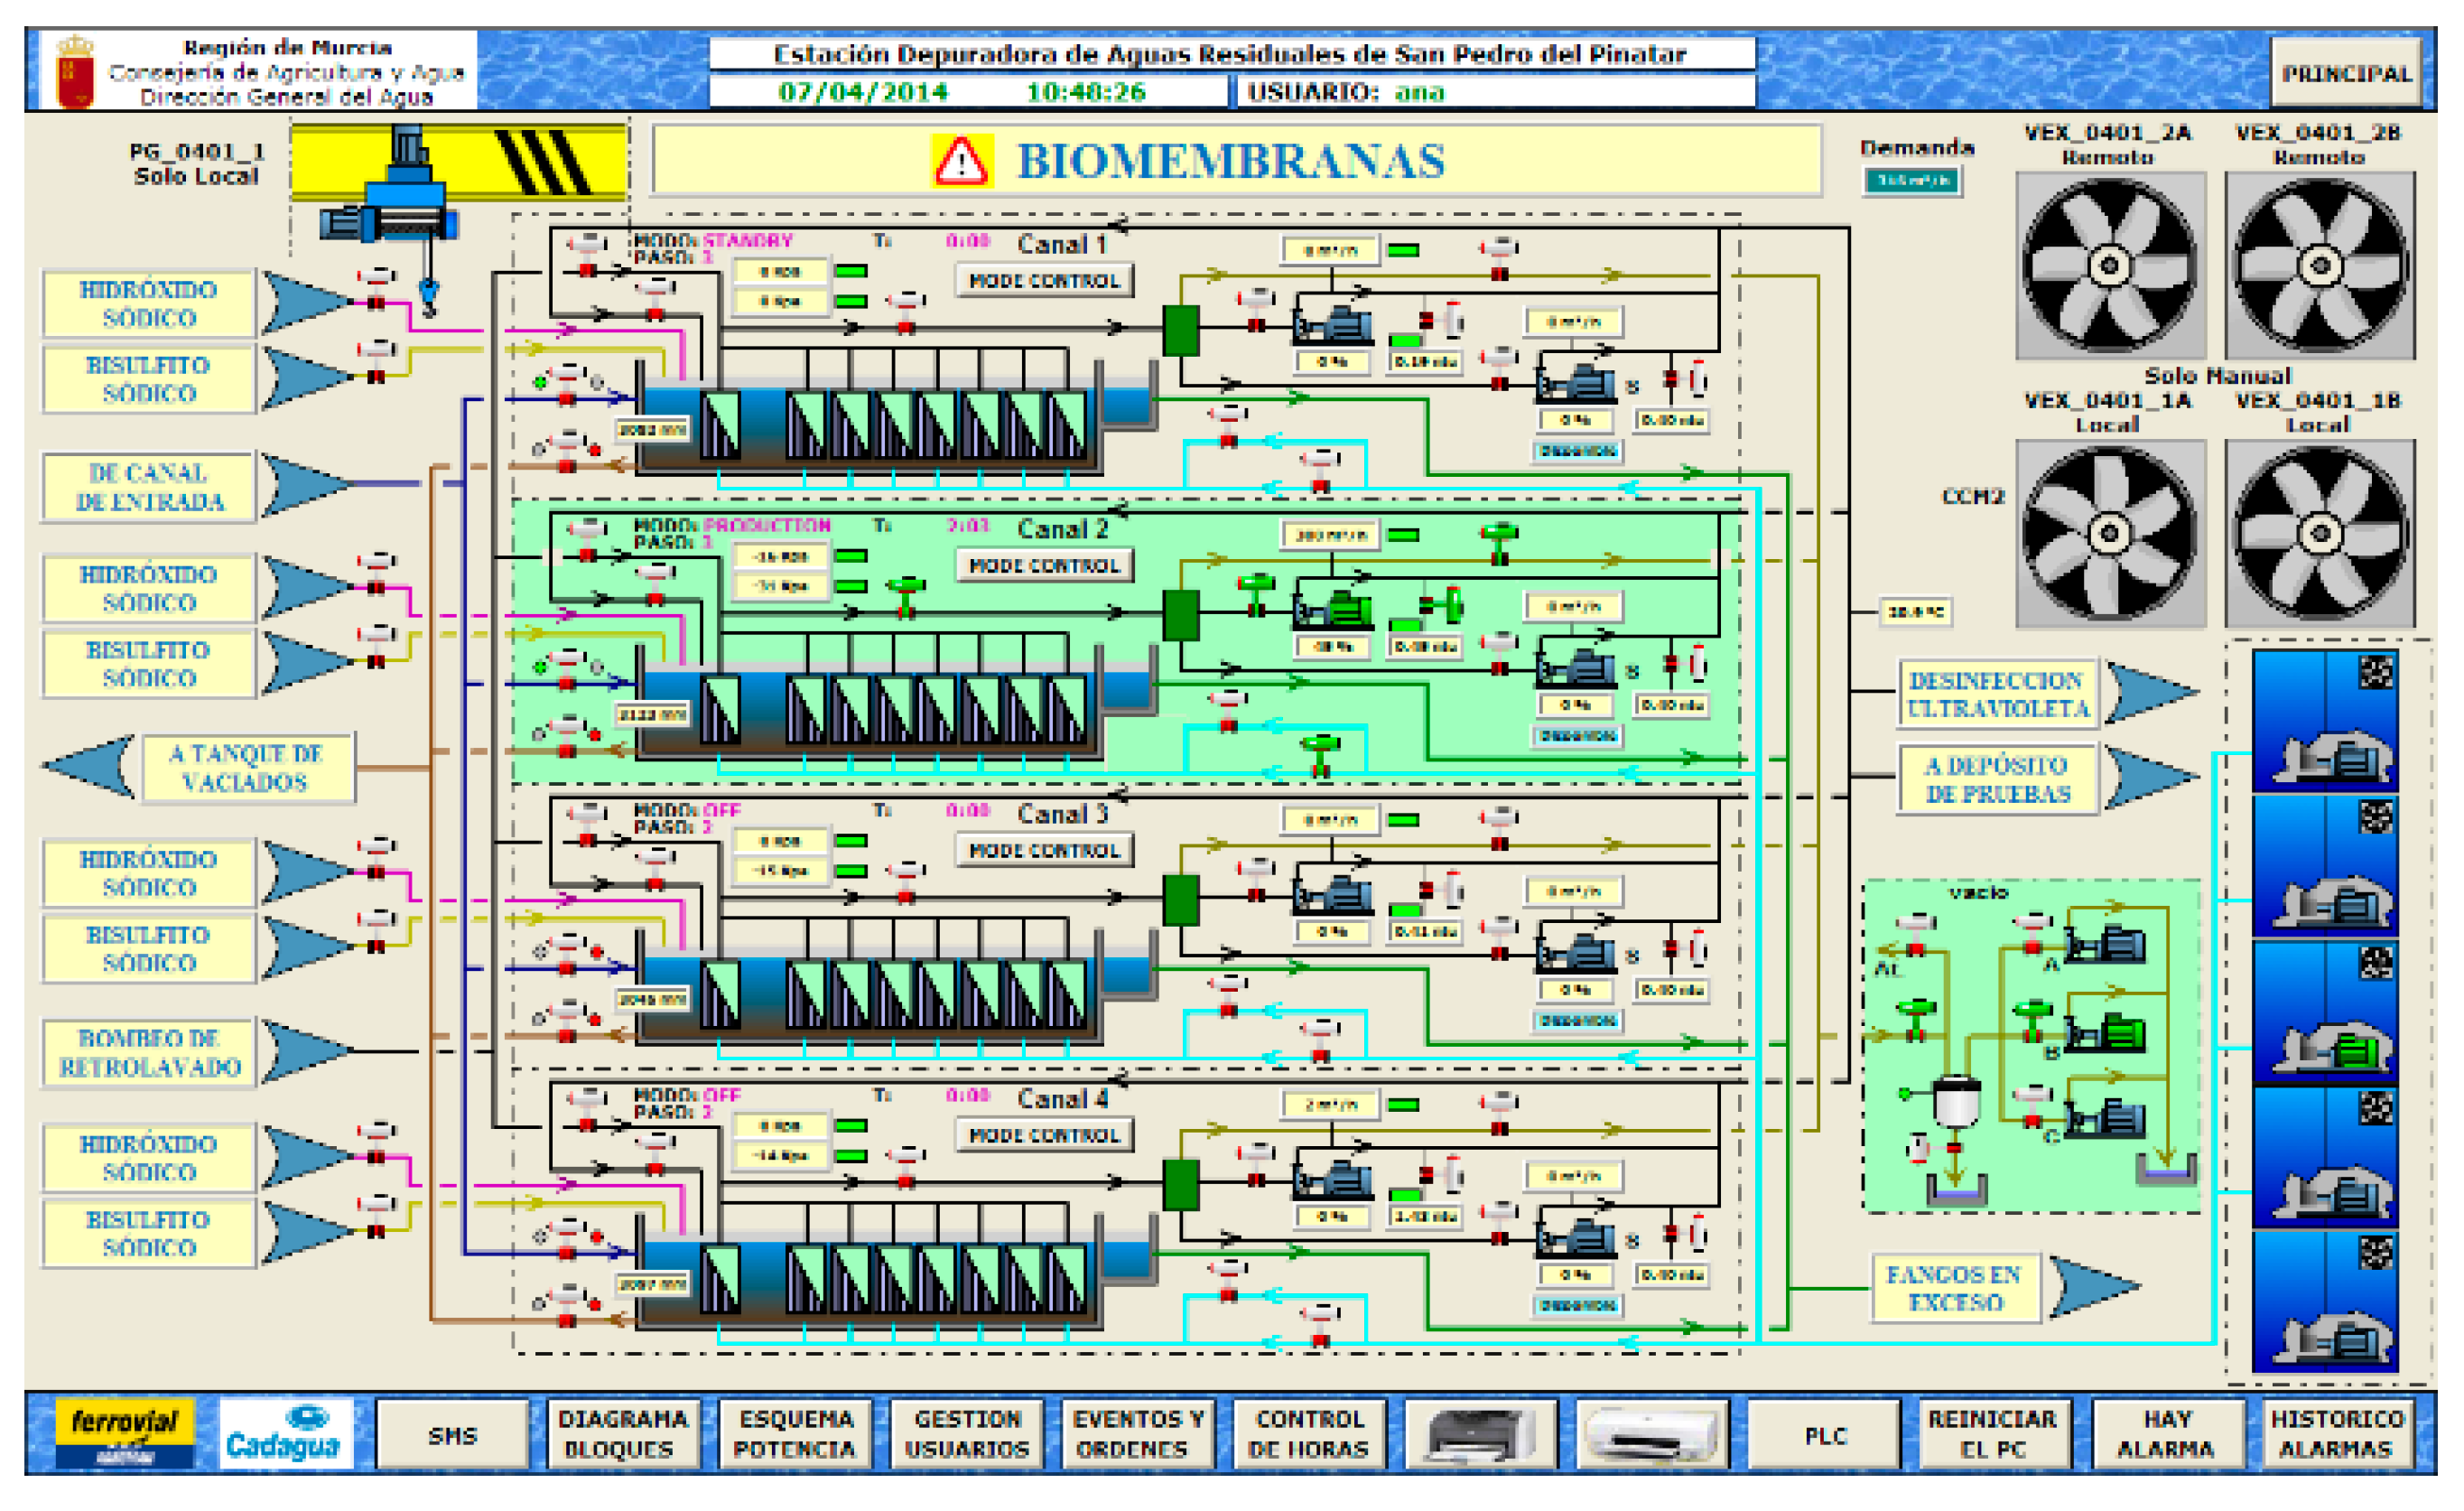
- Concentration of solids in the MBR chambers to maintain the optimum minimum concentration for the correct functioning of the membranes.
- Maintaining a constant concentration of solids in the reactor. In this working mode, the SCADA will specify the desired working concentration. The control loop regulates the volume of sludge purged by adjusting the operating time of the pumps.
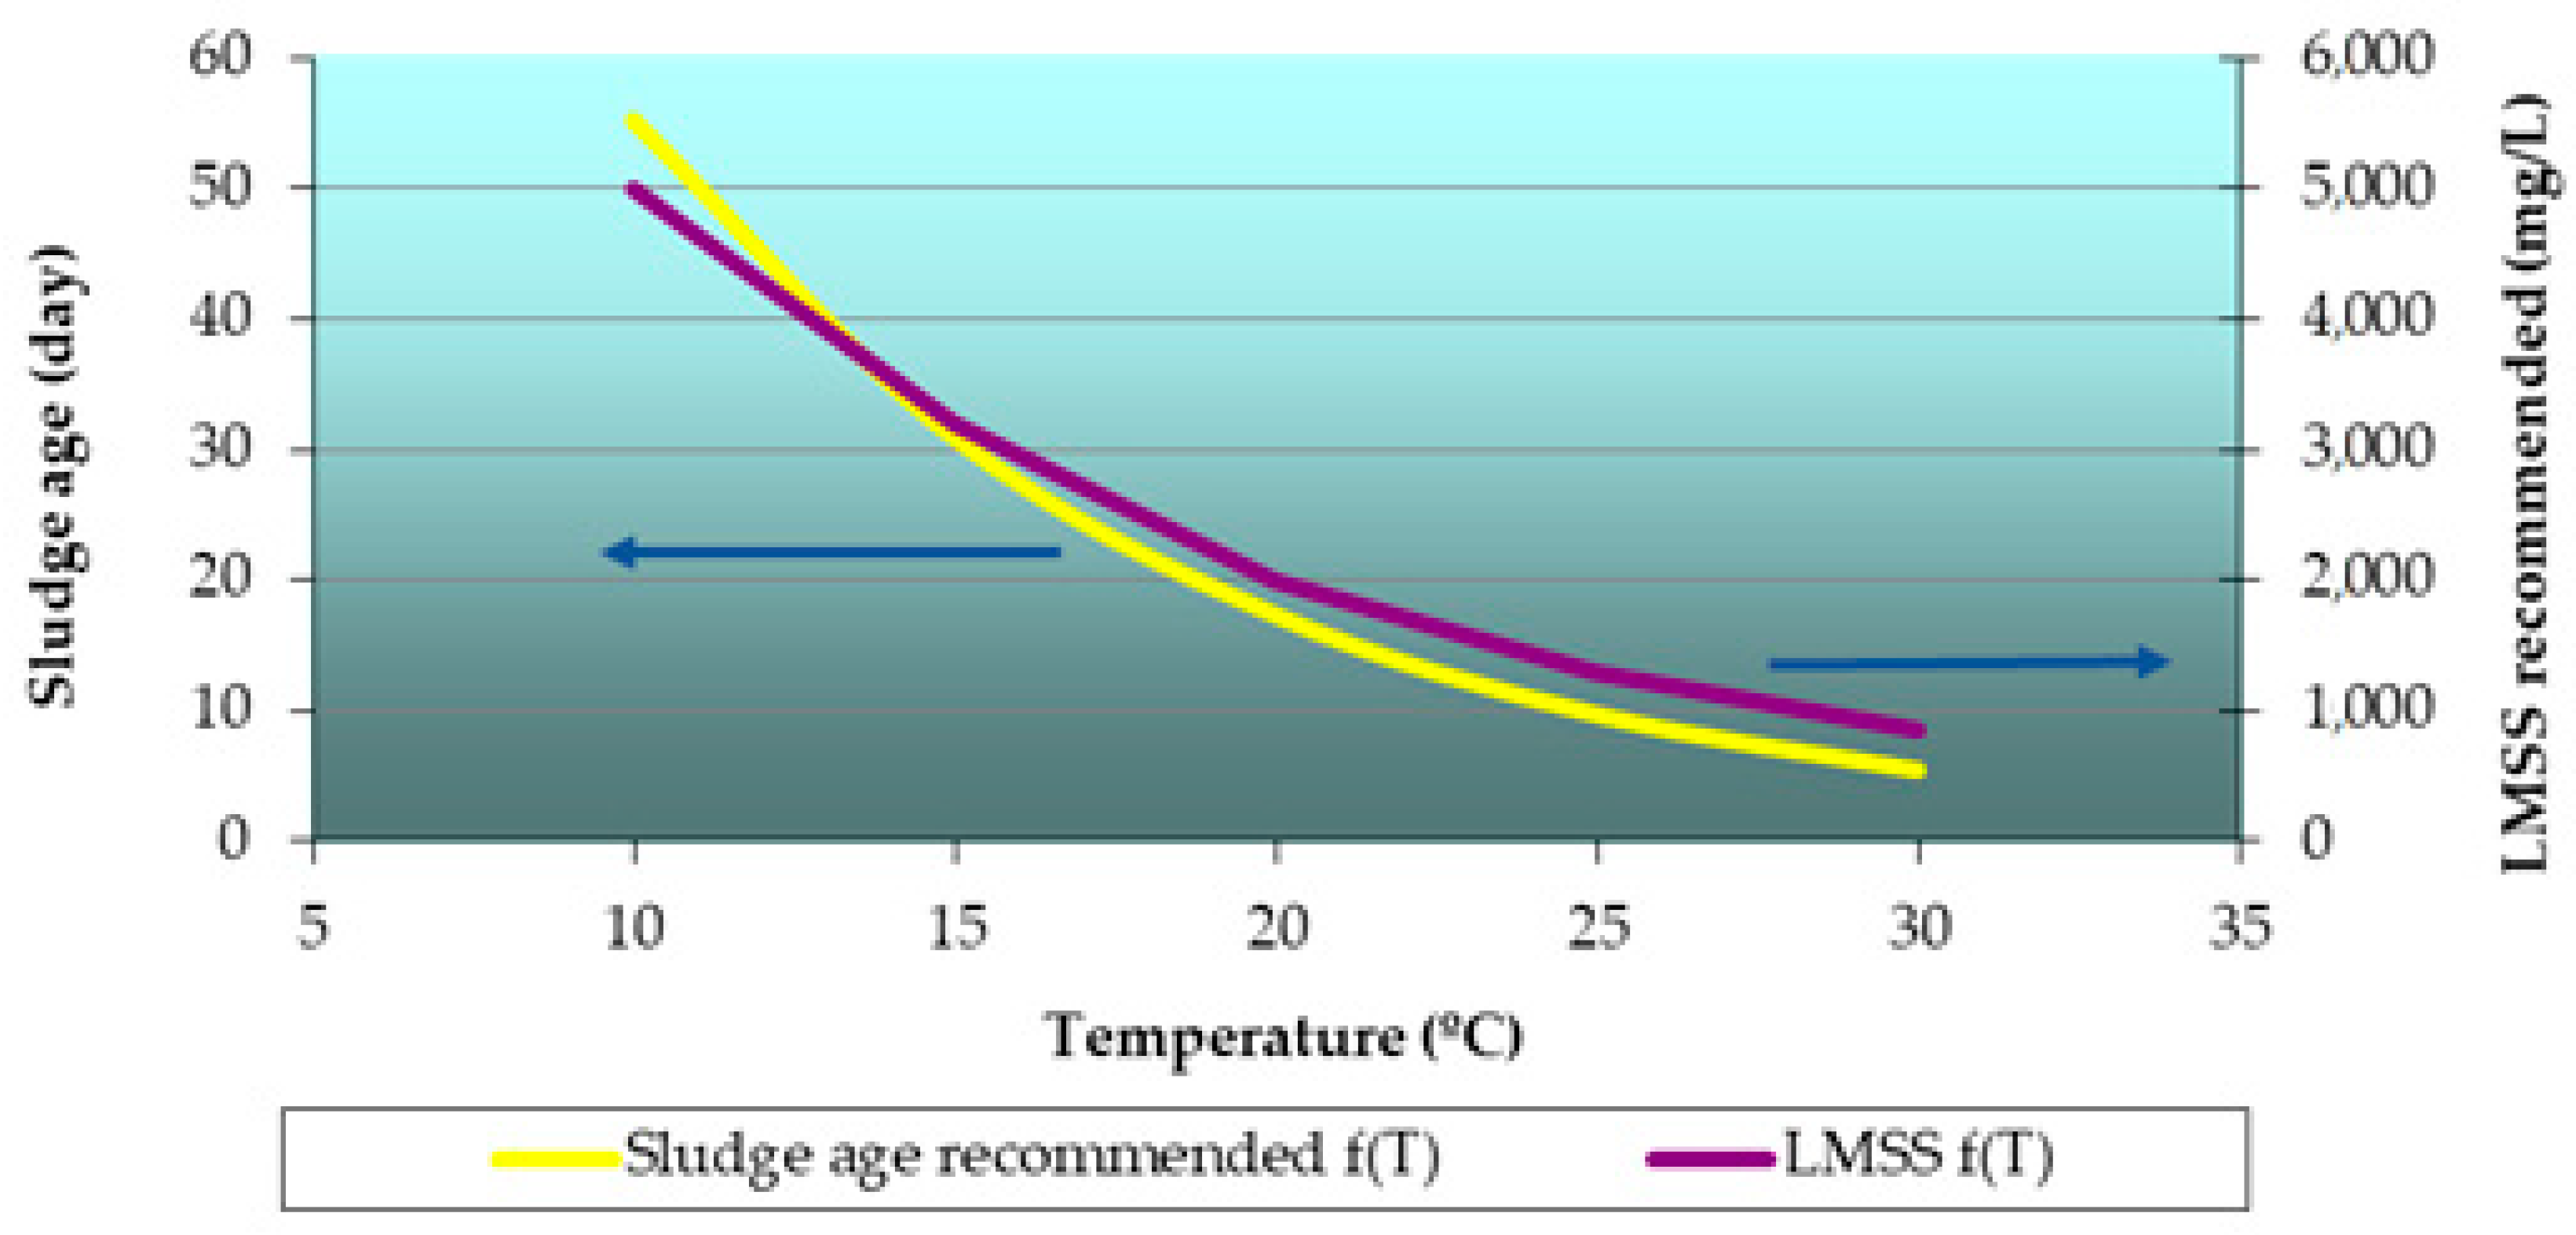
- Keeping the sludge age constant. In this working mode the desired sludge age will be specified in the SCADA. The control loop will regulate the volume of sludge purged by adjusting the running time of the pumps.
- ➢
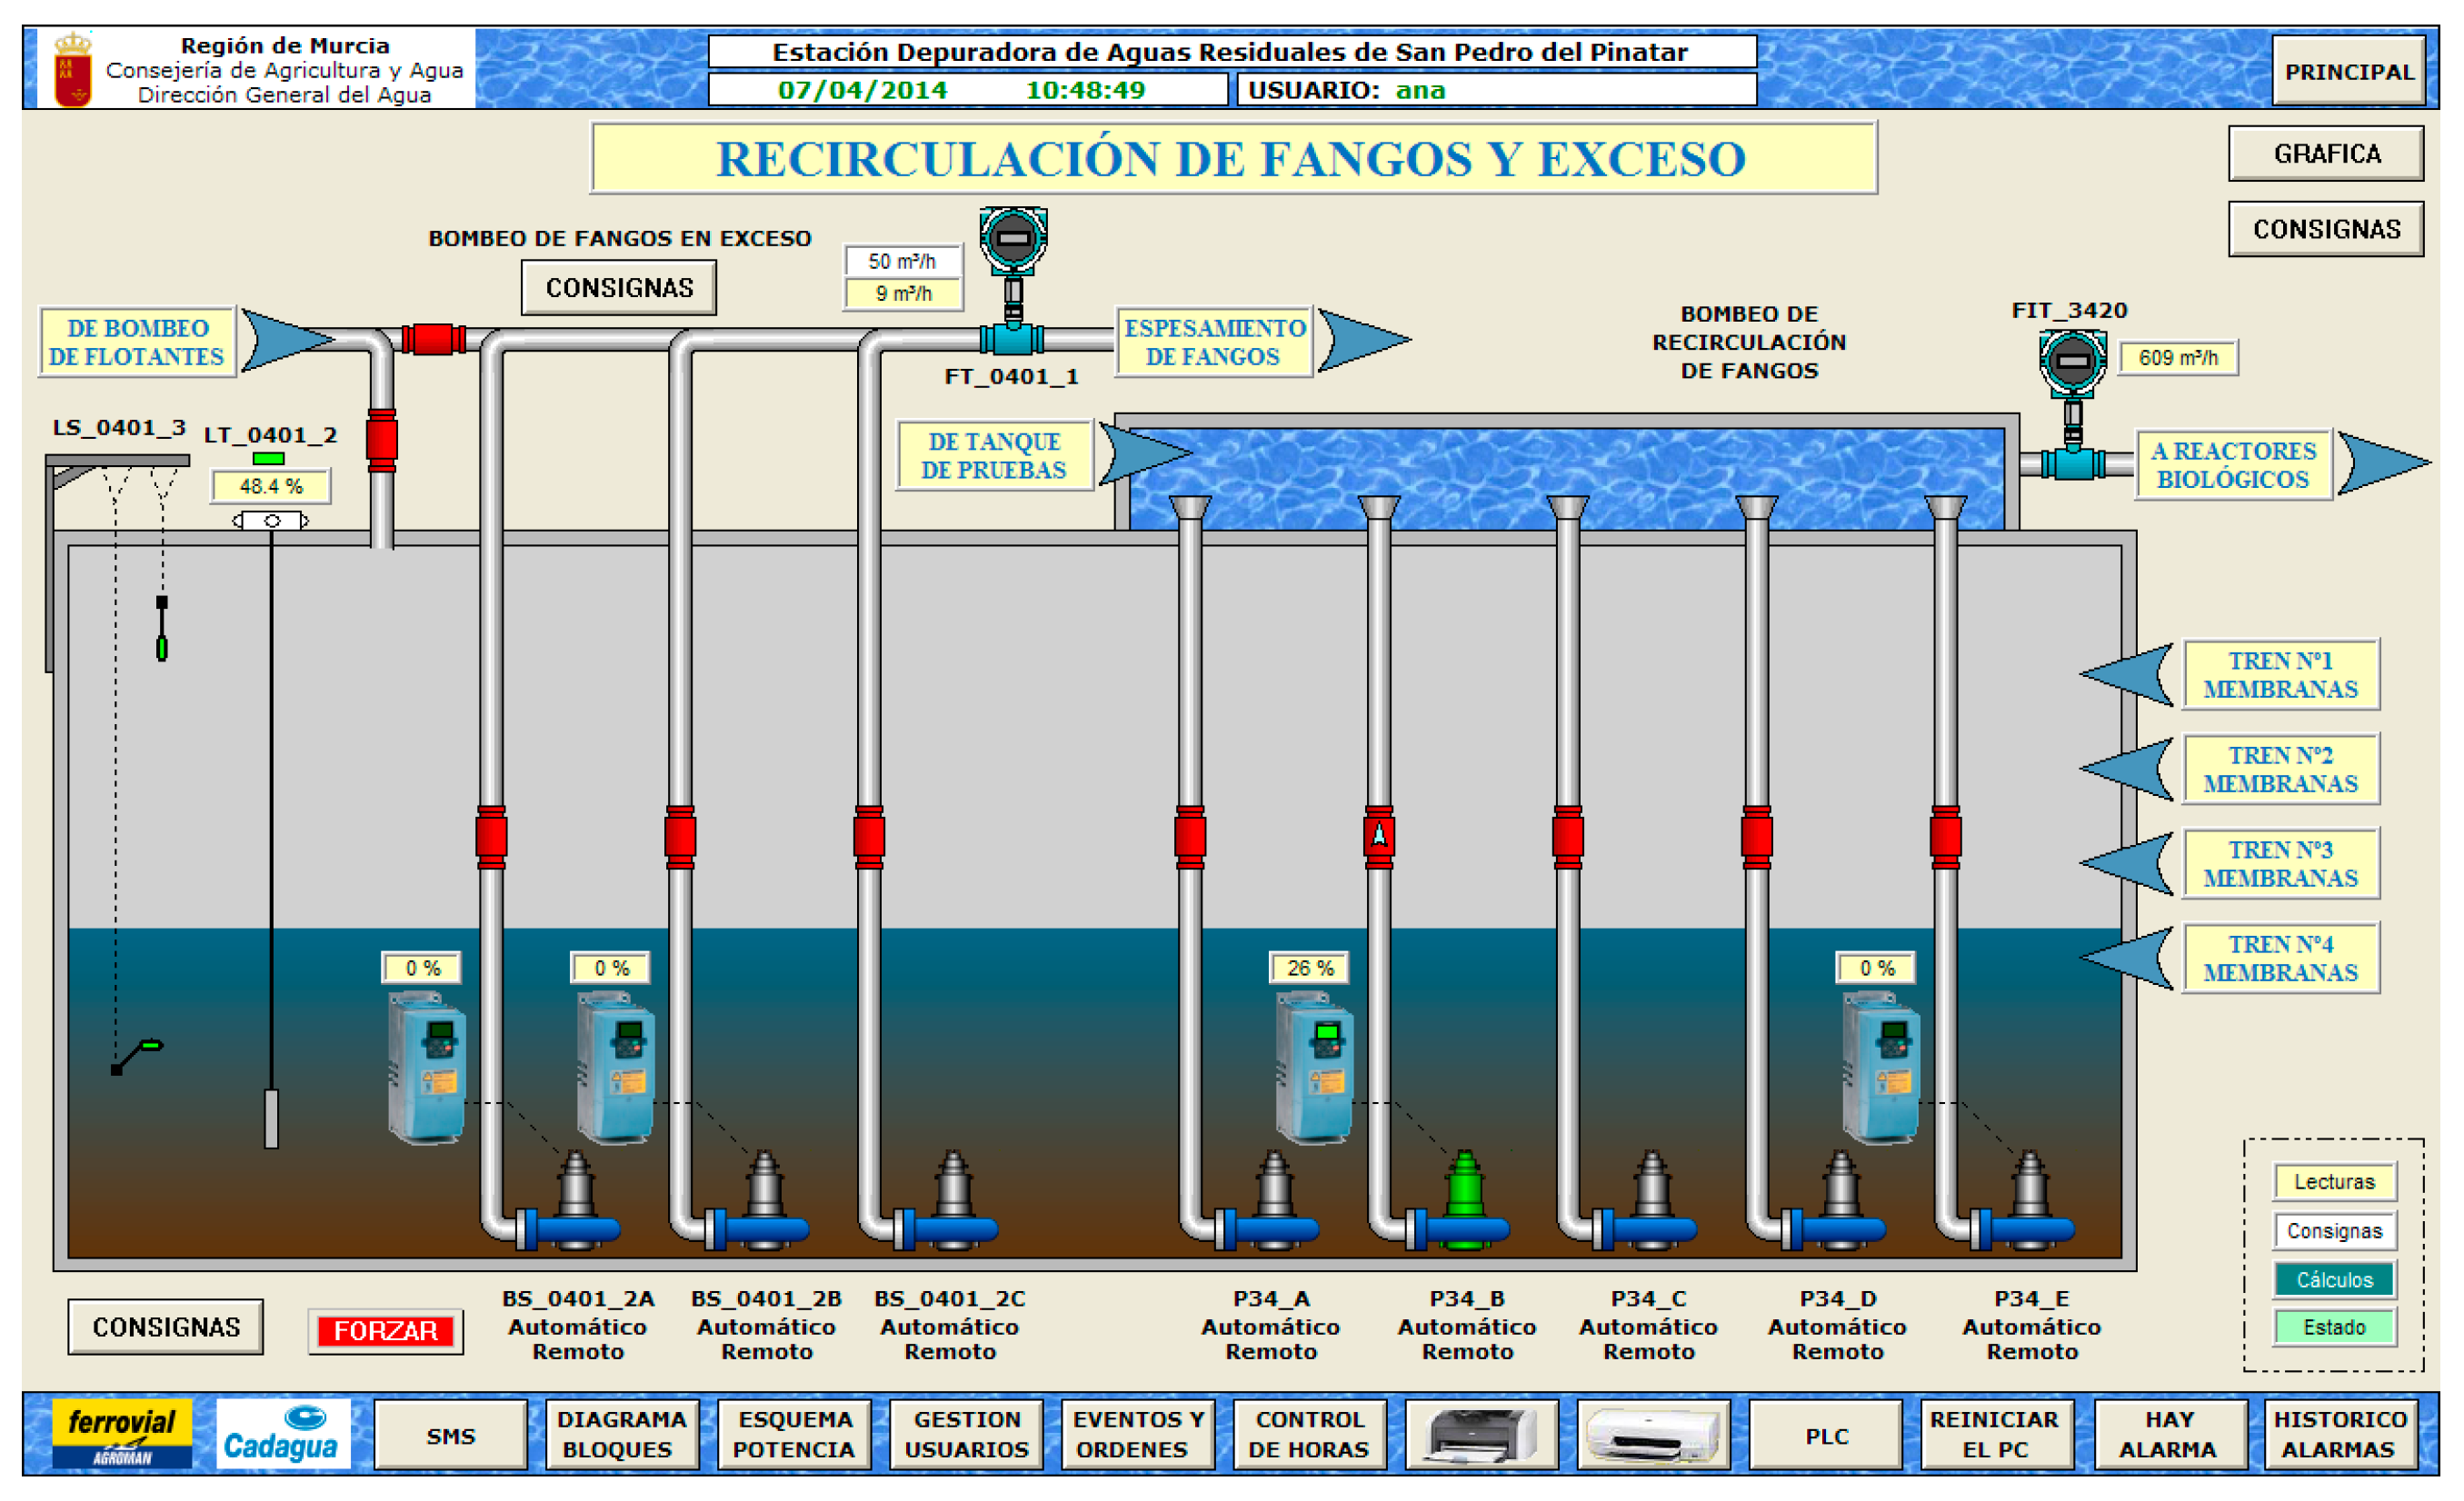
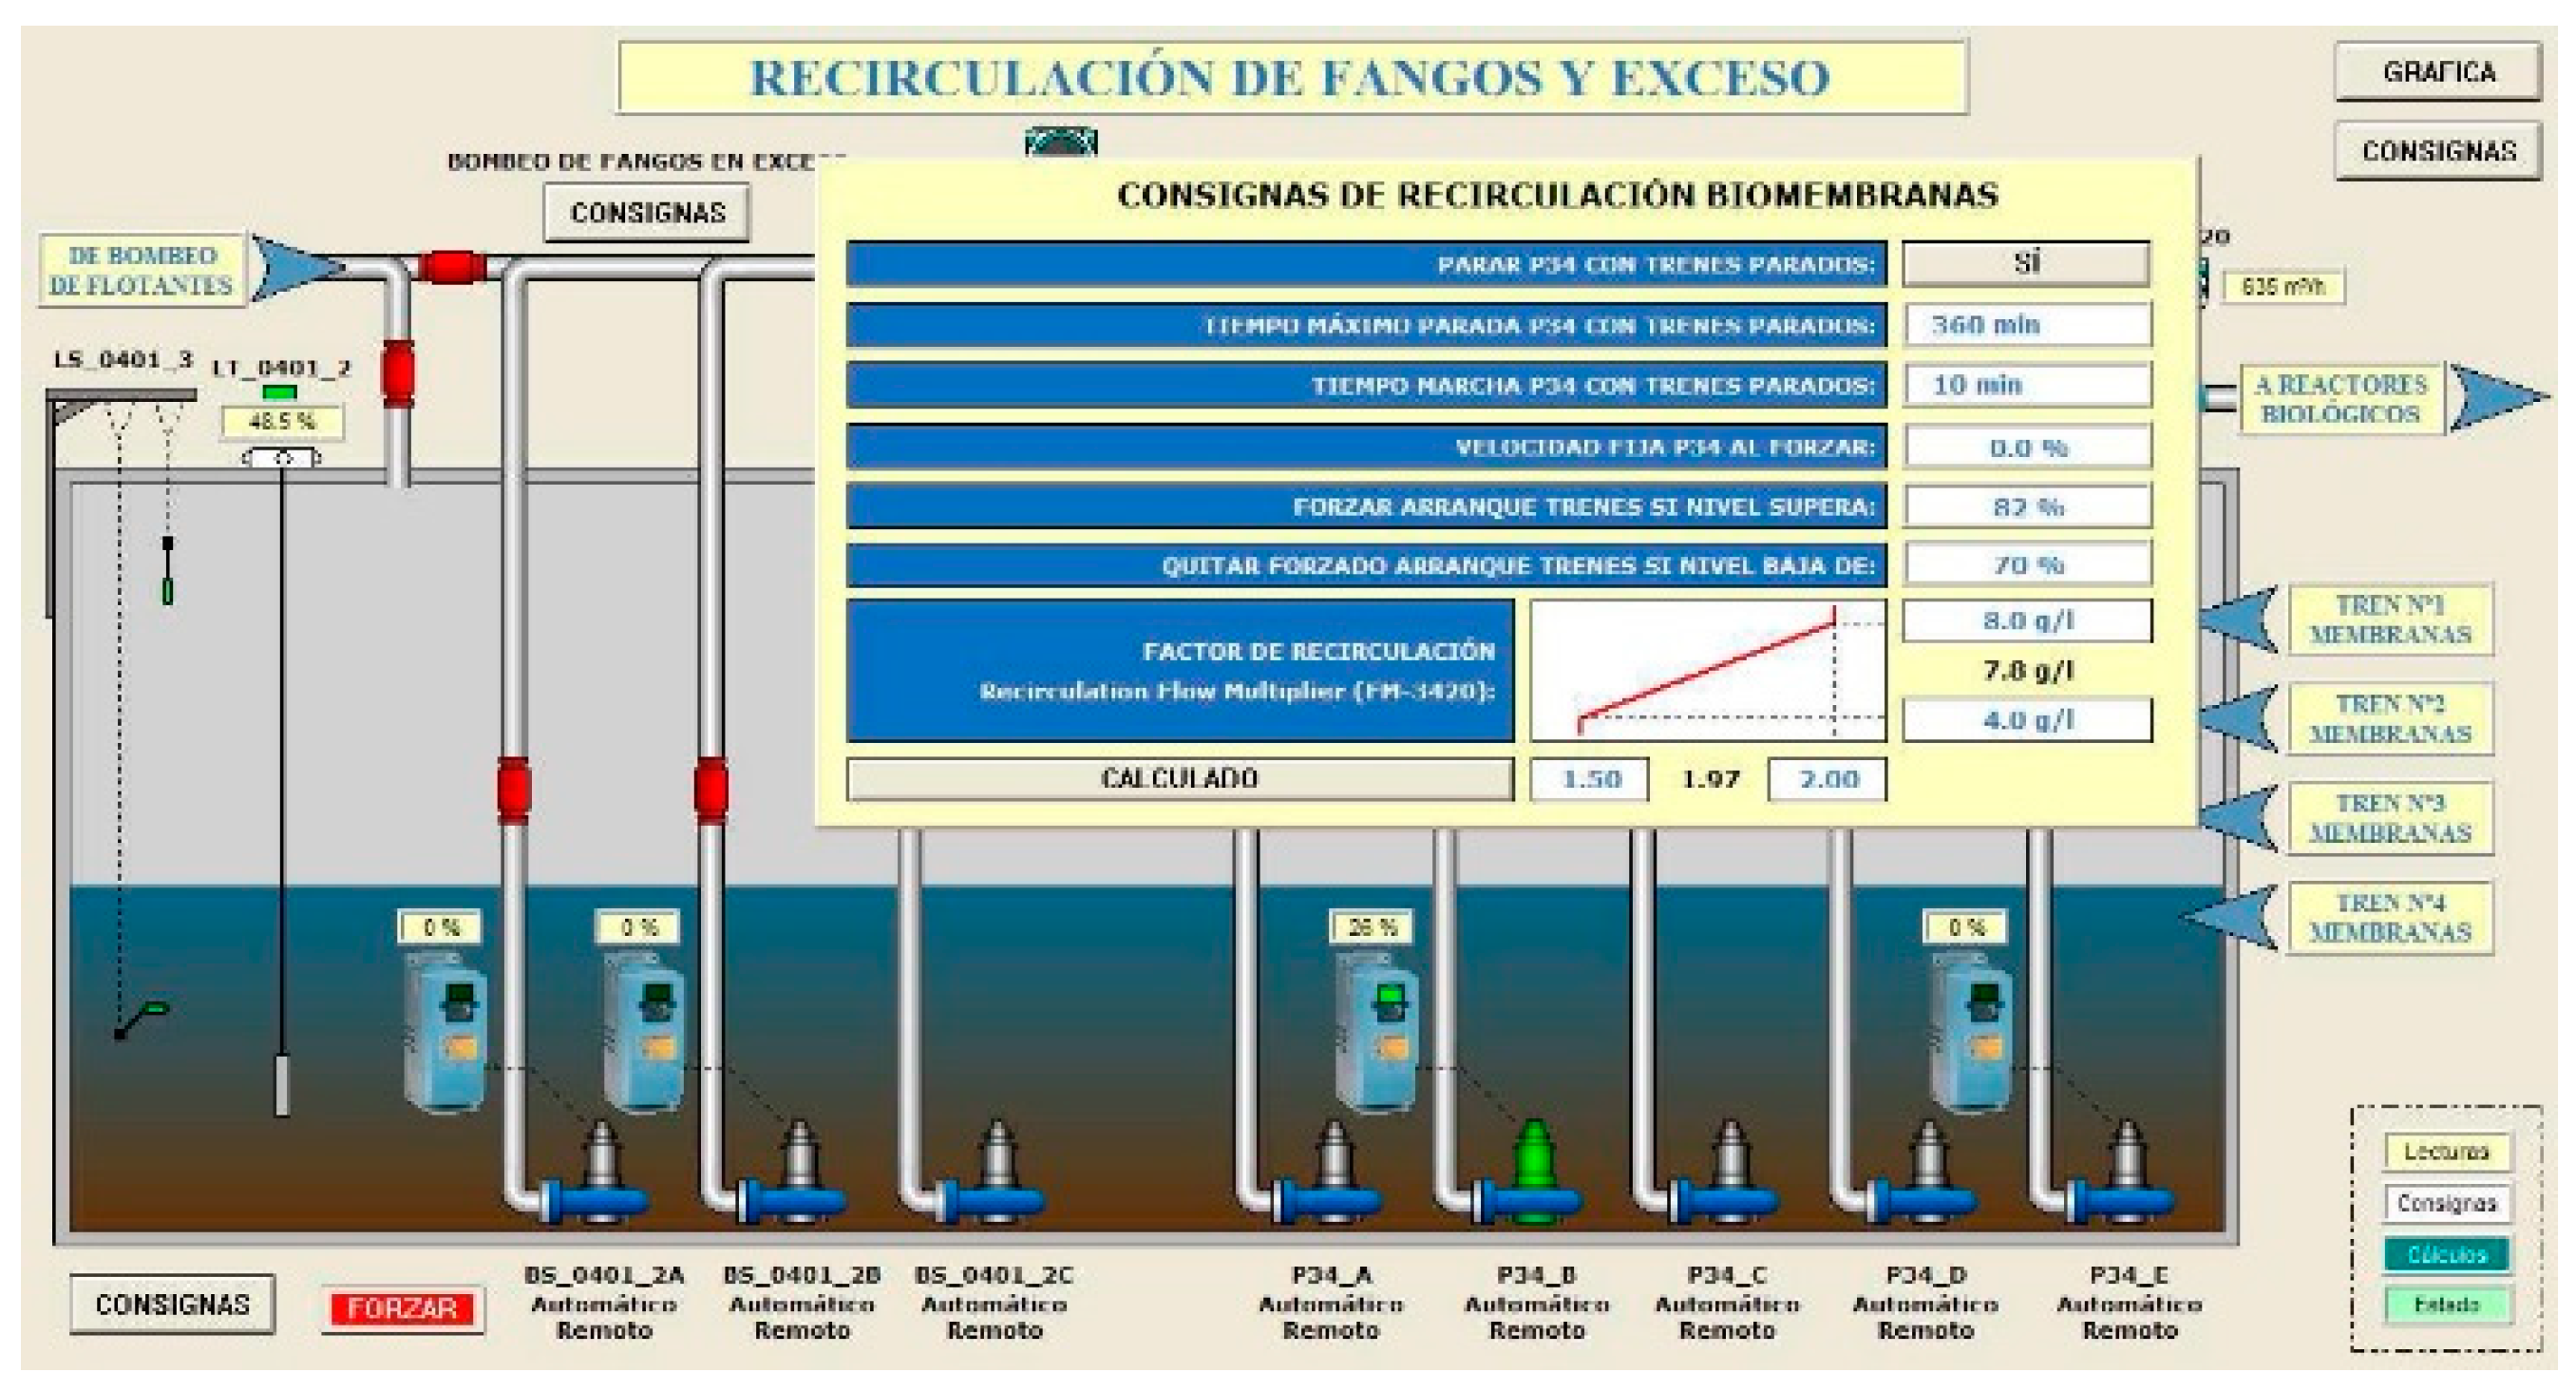
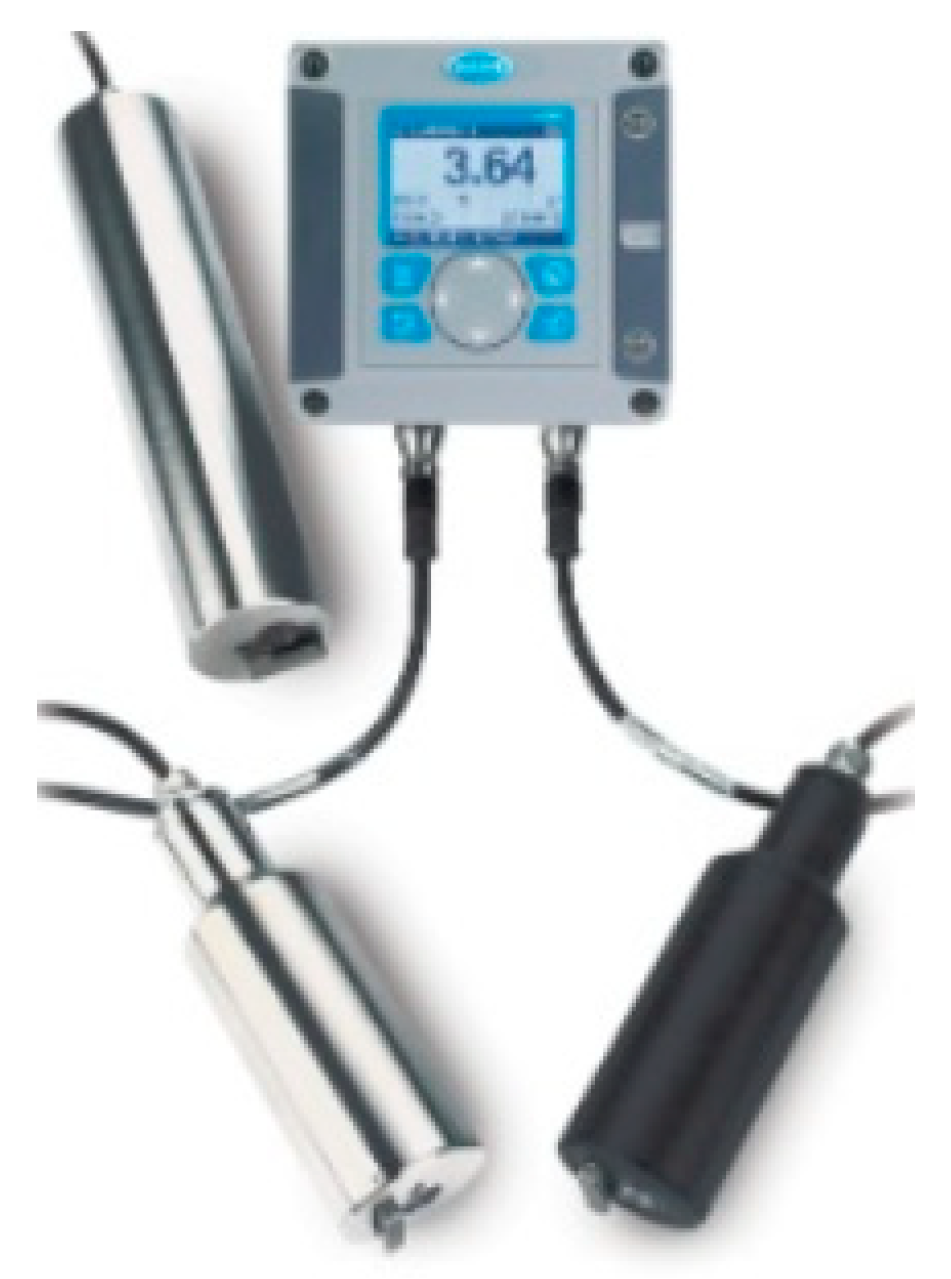
- Automatic control system of the recirculation flow depending on the suspended solids.
- Q is the inlet flow of wastewater to the biological reactor (m3/d);
- Qr is the recirculation flow rate (m3/d) and
- R is the recirculation ratio, configurable by the operator according to process needs.
- Xo is the concentration of micro-organisms in raw water or influent (mg/L);
- X is the concentration of microorganisms in the biological reactor (mg/L) and
- Xr is the concentration of microorganisms in the recirculation (mg/L).
3.4. Study on Final Energy Consumption at the WWTP
4. Results
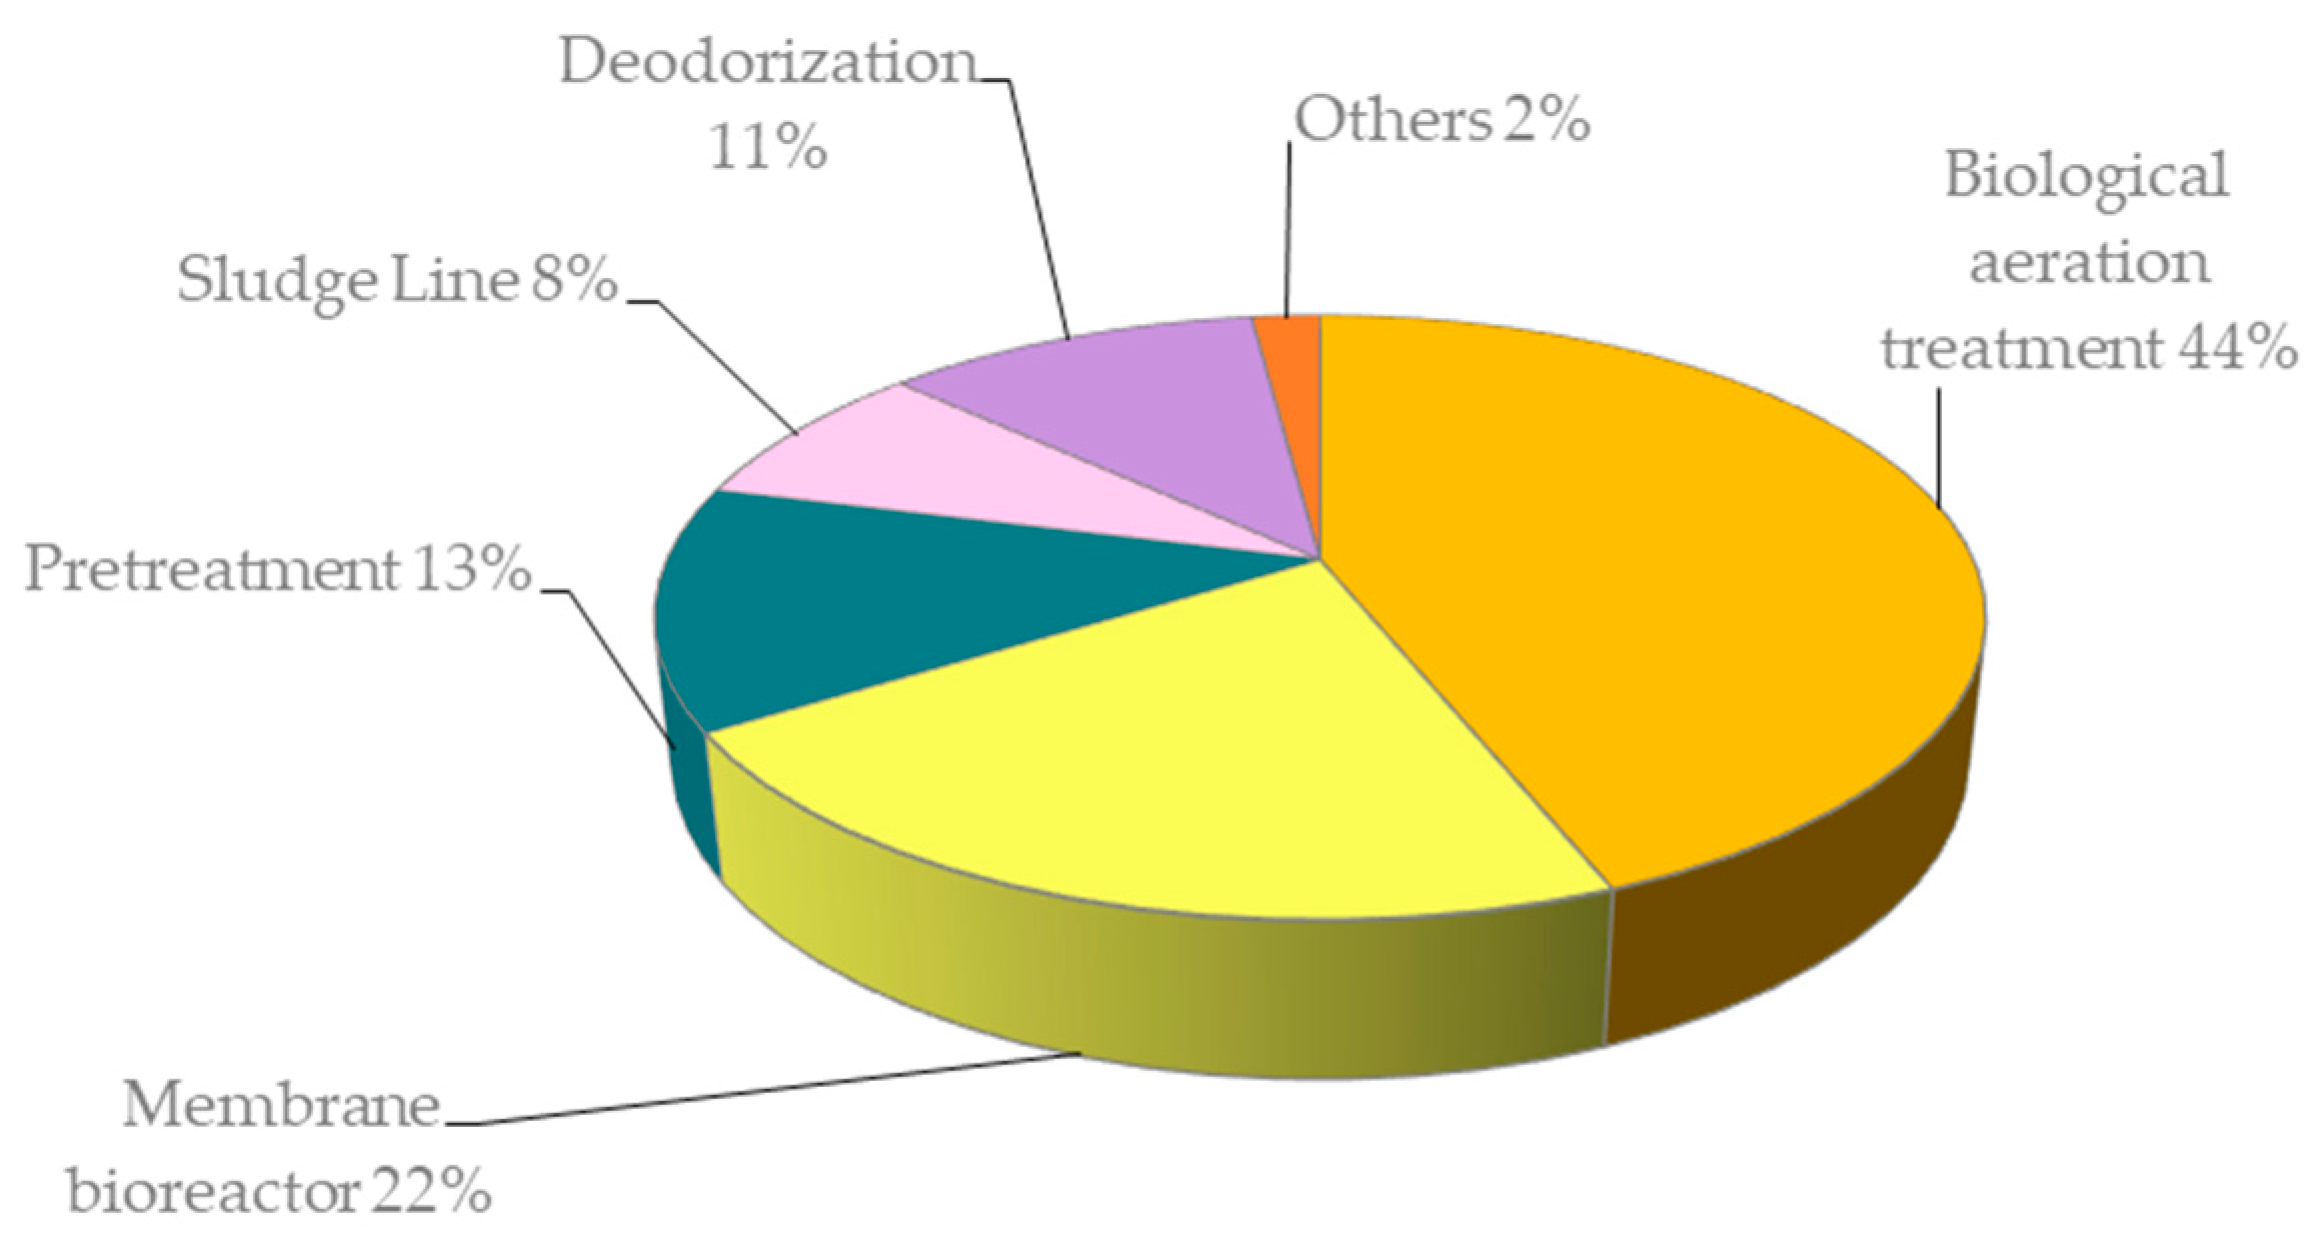
4.1. Results of the Study of the Individual Energy Consumption of the WWTP
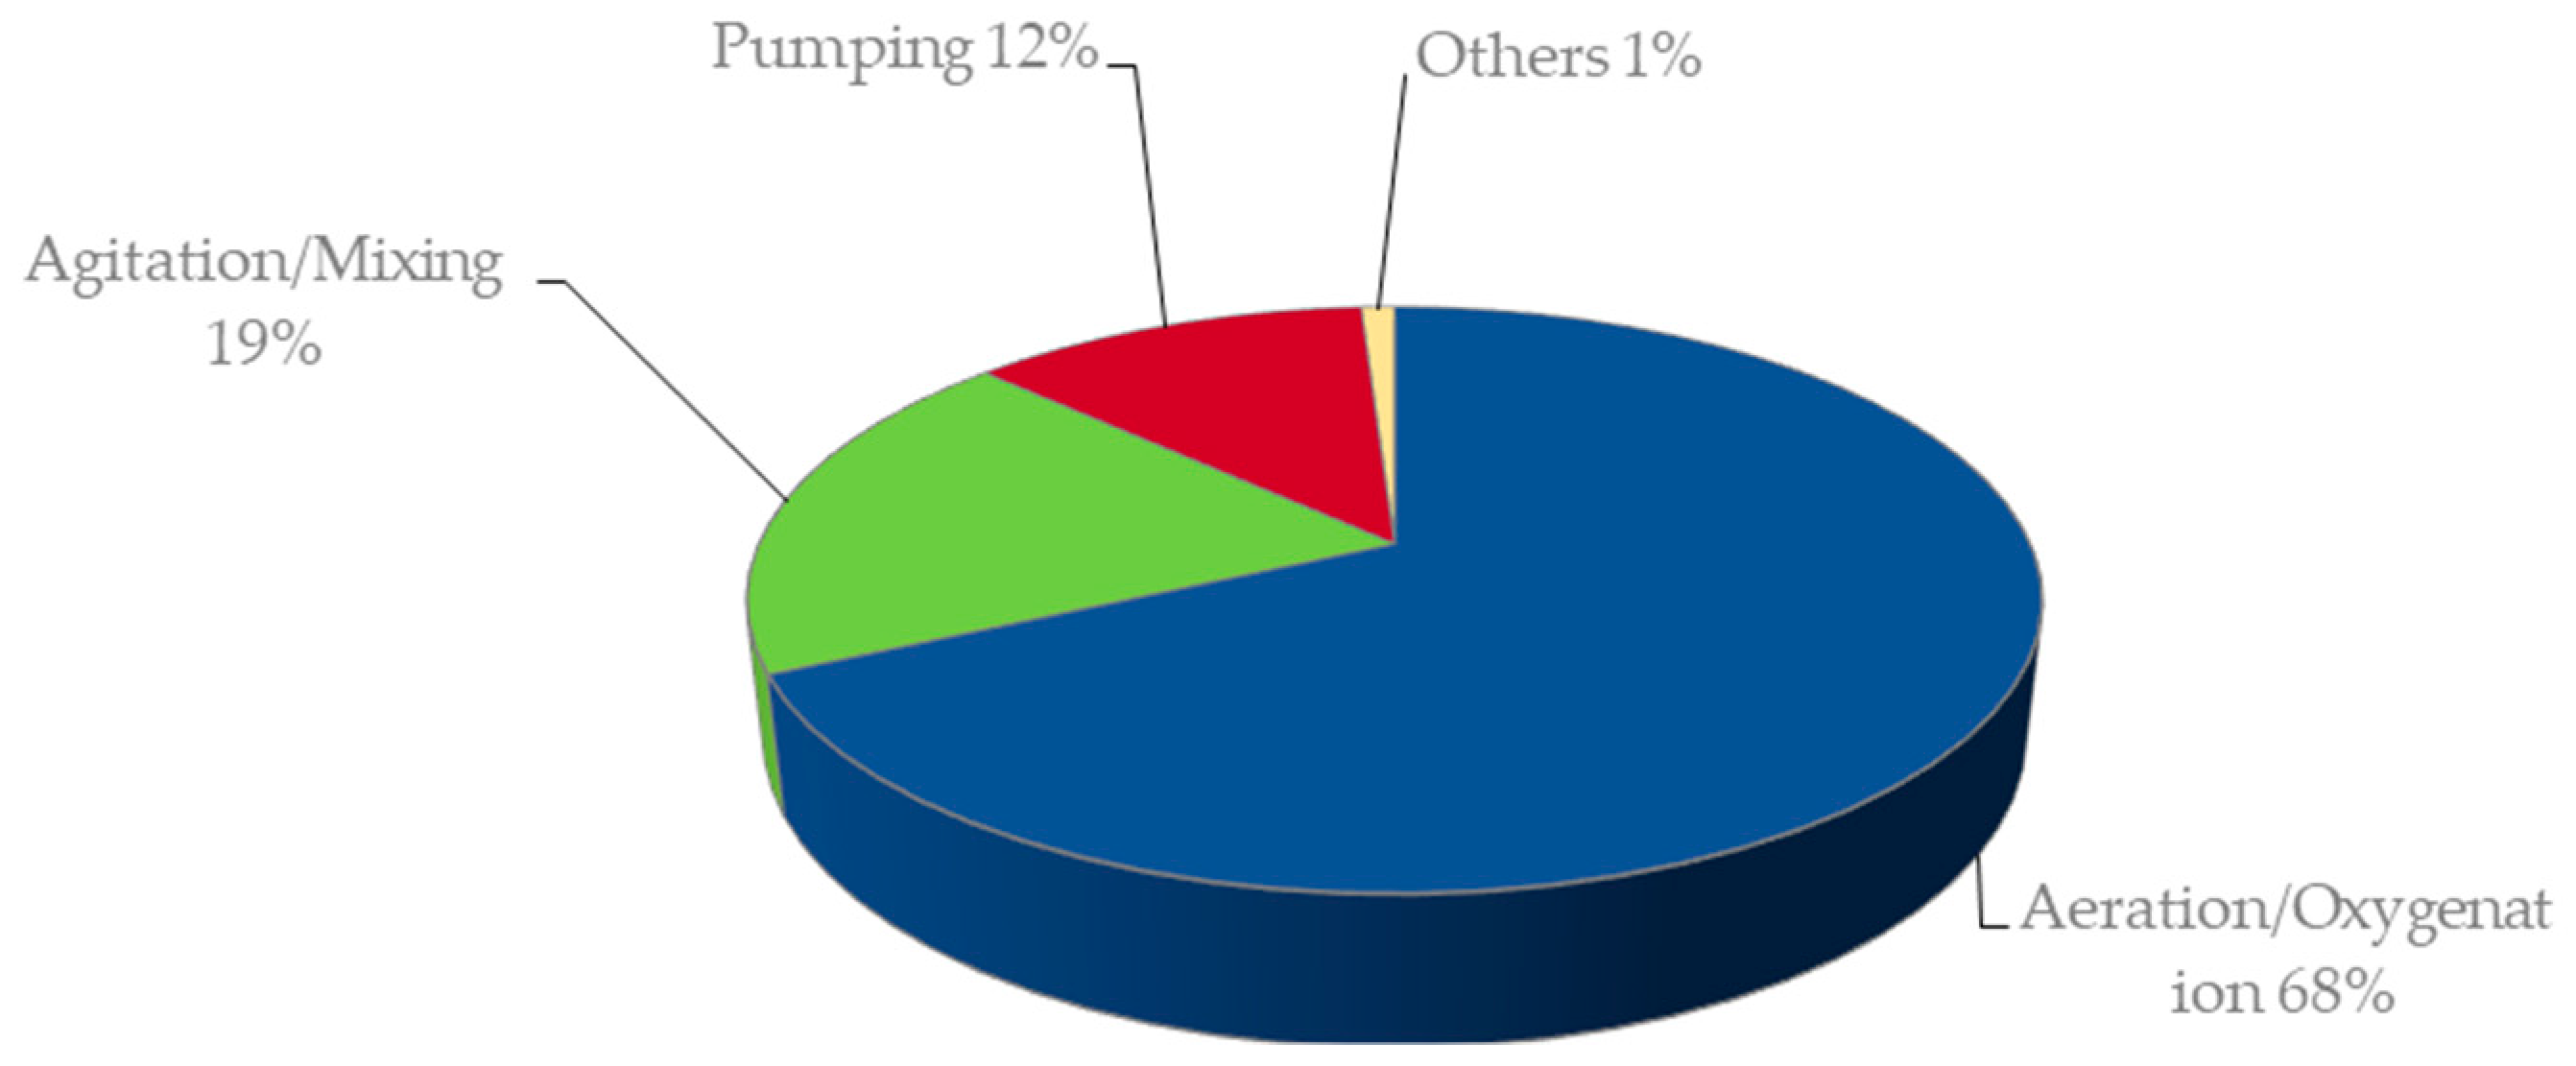
4.2. Result of the Analysis of the Installation and Main Components of the Activated Sludge Aeration System
- High working sludge age.
- Recirculation coefficient equivalent to 400% of the water flow permeated by the membranes.
- Need to adjust oxygen requirements for stabilization.
- Optimization of air requirements.
- Study of operating conditions that may interfere with aeration efficiency.
4.3. Test Results for Energy Optimization of a Biological Treatment Process
- ➢
- Automatic control system for sludge purge depending on the age of the sludge.
- ➢
- Automatic control system of the recirculation flow depending on the suspended solids.
4.4. Result of the Study on the Final Energy Consumption of the WWTP
5. Discussion and Conclusions
Author Contributions
Funding
Acknowledgments
Conflicts of Interest
References and Notes
- National Statistical Institute (NSI). Available online: http://www.ine.es/jaxi/Datos.htm?path=/t26/p067/p01/serie/l0/&file=01005.px (accessed on 12 August 2018).
- Directive 2008/105/EC of the European Parliament and of the Council of 16 December 2008 on environmental quality standards in the field of water policy, amending and subsequently repealing Council Directives 82/176/EEC, 83/513/EEC, 84/156/EEC, 84/491/EEC, 86/280/EEC and amending Directive 2000/60/EC of the European Parliament and of the Council. OJ L 2008, 358, 84–97.
- Ferrer, J.; Aguado, D.; Barat, R.; Serralta, J.; Lapuente, E. Huella Energética en el ciclo Integral del Agua en la Comunidad de Madrid; Fundación Canal de Isabel II: Madrid, Spain, 2016; Available online: http://www.madrid.org/bvirtual/BVCM019568.pdf (accessed on 1 January 2019).
- Institute for Energy Diversification and Saving. Prospective Study of Energy Consumption in the Water Sector; Ministry of Industry, Tourism and Trade: Madrid, Spain, 2010; pp. 1–111. Available online: https://www.idae.es/uploads/documentos/documentos_Estudio_de_prospectiva_Consumo_Energetico_en_el_sector_del_agua_2010_020f8db6.pdf (accessed on 1 January 2019).
- European Union. Electricity price statistics. In Eurostat Statistics Explained; 2017; ISSN 2443-8219; Available online: https://ec.europa.eu/eurostat/statistics-explained/index.php/Electricity_price_statistics (accessed on 9 January 2019).
- National Statistical Institute (NSI). Spain in Numbers 2018; NSI, Catalogue of official publications of the general administration of the state; Madrid, 2018; pp. 40–42, ISSN 2255-0410. Available online: https://www.ine.es/prodyser/espa_cifras/2018/3/ (accessed on 1 January 2019).
- European Environment Agency (EEA). Urban Wastewater Treatment; EEA: Copenhagen, Denmark, 15 December 2017; Available online: https://www.eea.europa.eu/data-and-maps/indicators/urban-waste-water-treatment/urban-waste-water-treatment-assessment-4 (accessed on 31 March 2019).
- United Nations Organization (UNO). Transforming Our World: The 2030 Agenda for Sustainable Development; UNO: New York, NY, USA, 2015; pp. 1–41, A/RES/70/1; Available online: https://sustainabledevelopment.un.org/content/documents/21252030%20Agenda%20for%20Sustainable%20Development%20web.pdf (accessed on 26 November 2018).
- Longo, S.; d´Antoni, B.M.; Bongards, M.; Chaparro, A.; Cronrath, A.; Fatone, F.; Lema, J.M.; Mauricio-Iglesias, M.; Soares, A.; Hospido, A. Monitoring and diagnosis of energy consumption in wastewater treatment plants. A state of the art and proposals for improvement. Appl. Energy 2016, 179, 1251–1268. [Google Scholar] [CrossRef]
- Doherty, E.; McNamara, G.; Fitzsimons, L.; Clifford, E. Design and implementation of a performance assessment methodology cognisant of data accuracy for Irish wastewater treatment plants. J. Clean. Prod. 2017, 165, 1529–1541. [Google Scholar] [CrossRef] [Green Version]
- Wang, H.; Yang, Y.; Keller, A.; Li, X.; Feng, S.; Dong, Y.-N. Comparative analysis of energy intensity and carbon emissions in wastewater treatment in USA, Germany, China and South Africa. Appl. Energy 2016, 184, 873–881. [Google Scholar] [CrossRef] [Green Version]
- European Parliament and of the Council. Directive 2012/27/UE of 25 October 2012 on energy efficiency, amending Directives 2009/125/EC and 2010/30/EU, and repealing Directives 2004/8/EC and 2006/32/EC. Off. J. Eur. Union 2012, 315, 1–56. [Google Scholar]
- Bertoldi, P.P.P.; Castellazzi, L.; Oikonomou, V.; Fawcett, T.; Spyrdaki, N.A.; Renders, N.; Moorkens, I. How is article 7 of the Energy Efficiency Directive being implemented? An analysis of national energy efficiency obligation schemes. In Proceedings of the ECEEE Summer Study; 2015; Volume 380, pp. 455–465. Available online: https://www.eceee.org/library/conference_proceedings/eceee_Summer_Studies/2015/2-energy-efficiency-policies-8211-how-do-we-get-it-right/how-is-article-7-of-the-energy-efficiency-directive-being-implemented-an-analysis-of-national-energy-efficiency-obligations-schemes/2015/2-380-15_Bertoldi.pdf/ (accessed on 31 March 2019).
- European Commission. Directive of the European Parliament and of the Council on the Quality of Water Intended for Human Consumption (Recast); The European Commission: Brussels, Belgium, 2018; Available online: https://eur-lex.europa.eu/legal-content/EN/TXT/?uri=CELEX%3A52017PC0753 (accessed on 31 March 2019).
- European Union (EU). Enerwater Methodology Project: Standard Method and Online Tool for Assessing and Improving the Energy Efficiency of Wastewater Treatment Plants; EU: Brussels, Belgium, 2018; Available online: http://www.enerwater.eu/wp-content/uploads/2015/10/D3.4-ENERWATER-Oct18-1.pdf (accessed on 3 July 2018).
- International Labour Office (ILO). The Agenda for Sustainable Development beyond 2015; GB.322/INS/6; ILO: Geneva, Switzerland, 19 September 2014; Volume 322, pp. 1–8. Available online: https://www.ilo.org/wcmsp5/groups/public/---ed_norm/---relconf/documents/meetingdocument/wcms_311035.pdf (accessed on 1 May 2018).
- Council Directive of 21 May 1991 concerning urban waste-water treatment (91/271/EEC). Off. J. Eur. Communities 1991, 135, 40–52.
- Albaladejo Ruiz, A.; Albaladejo Falcó, A. Parameterization of the energy consumption of sewage treatment plants (Levante Spanish). Paper No. 1. Dyna 2016, 91, 82–87. [Google Scholar] [CrossRef]
- Simón Andreu, P.P.; Lardín Mifsut, C.; Abellán Soler, M. Energy optimization in WWTPs in the Region of Murcia. Civ. Eng. 2012, 168, 93–112. [Google Scholar]
- Gali, A.; Trillo, I. Influence of aeration system design on operating energy costs. IV Technical Conference on Management of Wastewater Sanitation Systems: Energy and Sanitation. Catalan Water Agency, Barcelona, Catalonia. 1 April 2009, p. 343. Available online: http://aca.gencat.cat/web/.content/10_ACA/J_Publicacions/08-jornades/01_ponencia_gestio_EDAR_2009.pdf (accessed on 1 January 2019).
- Hardy, L.; Garrido, A.; Juana, L. Evaluation of Spain’s Water-Energy Nexus; Special Issue: Water Policy and Management in Spain. Int. J. Water Res. Dev. 2012, 28, 151–170. [Google Scholar] [CrossRef]
- Gu, Y.; Li, Y.; Li, X.; Luo, P.; Wang, H.; Wang, X.; Wu, J.; Li, F. Energy Self-sufficient Wastewater Treatment Plants: Feasibilities and Challenges. Energy Procedia 2017, 105, 3741–3751. [Google Scholar] [CrossRef]
- Chae, K.J.; Kang, J. Estimating the energy independence of a municipal wastewater treatment plant incorporating green energy resources. Energy Convers. Manag. 2013, 75, 664–672. [Google Scholar] [CrossRef]
- Olsson, G.; Meyers, R.A. Water and Energ Nexus; Encyclopedia of Sustainability Science and Technology: New York, NY, USA, 2012; pp. 11932–11946. [Google Scholar] [CrossRef]
- Hernandez Sancho, F.; Molinos Senante, M.; Sala Garrido, R. Energy efficiency in Spanish wastewater treatment plants: A non-radial DEA approach. Sci. Total Environ. 2011, 409, 2693–2699. [Google Scholar] [CrossRef] [PubMed]
- Yang, L.; Zeng, S.; Chen, J.; He, M.; Yang, W. Operational energy performance assessment system of municipal wastewater treatment plants. Water Sci. Technol. 2010, 62, 1361–1370. [Google Scholar] [CrossRef] [PubMed]
- Organización de las Naciones Unidas para la Educación, la Ciencia y la Cultura (UNESCO). Informe Anual 2014; Oficina Regional de Educación para América Latina y el Caribe (OREALC/UNESCO): Santiago de Chile, Chile, 2015; Available online: http://www.unesco.org/new/fileadmin/MULTIMEDIA/FIELD/Santiago/pdf/reporteanualfinal.pdf (accessed on 23 July 2018).
- Morenilla, J.J. Control systems and optimization of energy consumption in WWTP. XXV. In Course on Wastewater Treatment and Operation of Wastewater Treatment Plants; CEDEX: Madrid, Spain, 2007; Volume 3, p. 34. [Google Scholar]
- Racaño, A. Energy optimization of sludge treatment at Ceutí WWTP: Aeration control by means of an adaptive predictive expert control system (ADEX). In Proceedings of the V Technical Conference on Sanitation and Purification; Water Sanitation Organization of the Region of Murcia (WSERM): Murcia, Spain, 25–26 November 2009; pp. 1–59. Available online: http://www.esamur.com/historico (accessed on 20 July 2018).
- Castell, D.; García Ventoso, M.; Tormos Fibla, I.; Ferrer, C.; Morenilla, J.J.; Bernacer, I.; Basiero, A. Energy optimization of the aeration system of a WWTP. Comparative analysis of two technologies. Water Technol. 2011, 327, 2–8. [Google Scholar]
- Simón Andreu, P. Eficiencia energetic of the WWTPs of the Region of Murcia. In Proceedings of the V Technical Conference on Sanitation and Purification; Water Sanitation Organization of the Region of Murcia (WSERM): Murcia, Spain, 25–26 November 2009; pp. 1–20. Available online: http://www.esamur.com/historico (accessed on 20 July 2018).
- Ferrer Torregrosa, C.; Olovas Masip, E.; Chiva Mengod, B.; Cabedo Oliver, J.M.; Garcia Ventoso, M.; Basiero Sichet, J.A. Energy analysis of WWTP processes. Water Eng. 2004, 1, 1–10. [Google Scholar]
- Rojo, J. Possibilities of Energy Cogeneration in the WWTP of Murcia East. In Proceedings of the V Technical Conference on Sanitation and Purification, Murcia, Spain, 25–26 November 2009; Water Sanitation Organization of the Region of Murcia (WSERM); pp. 1–21. Available online: http://www.esamur.com/historico (accessed on 20 July 2018).
- Almazán Lope, J.; Ferrer Polo, J. Analysis of the Improvement of the Energetic Efficiency of the Processes of a WWTP. Master’s Thesis, Department of Hydraulic Engineering and Environment, Polytechnic University of Valencia, 2014. Available online: https://riunet.upv.es/bitstream/handle/10251/47433/TFM%20Jessica%20Almaz%C3%A1n.pdf?sequence = 1 (accessed on 23 July 2018).
- Collado, S.; Simón, P.; Lardín, C.; Abellán, M.; Polo, M.; Rancaño, A.; Laca, A.; Díaz, M. Oxygen transfer in biological wastewater treatment systems. Part 1: Basic Aspects. Water Technol. 2012, 336, 78–87. [Google Scholar]
- Trapote, A. Research on Methodologies for the Control of Wastewater Treatment Plants. Ph.D. Thesis, E.T.S. Civil Engineers, Channels and Ports, Polytechnic University of Madrid, Madrid, Spain, 2002; pp. 1–430. Available online: http://oa.upm.es/9869/1/Arturo_Trapote_Jaume_Memoria.pdf (accessed on 20 June 2018).
- Lozano, A.B.; Del Cerro, F. Energy Optimization on the Aeration of Aerobic Bioreactors: Analysis of the Biological Process, Equipment Resizing, and Implementation of a Real-Time Control System Based on the Ammonium/Nitrate Measurement (AN-ISE); Final Degree Work; Department of Chemical Engineering, University of Murcia: Murcia, Spain, 2014. [Google Scholar]
- Institute for the Diversification and Saving of Energy (IDAE). Energy Saving and Efficiency Action Plan 2011 –2020 and Annexes; Ministry of Industry: Madrid, Spain, 2011. Available online: https://www.idae.es/uploads/documentos/documentos_Annex_AP_2011-2020_661d44b9.pdf (accessed on 20 June 2018).
- Energy Strategy 2020. Available online: https://ec.europa.eu/energy/en/topics/energy-strategy-and-energy-union/2020-energy-strategy (accessed on 20 June 2018).
- Energy Strategy 2030. Available online: https://ec.europa.eu/energy/en/topics/energy-strategy-and-energy-union/2030-energy-strategy (accessed on 20 June 2018).
- Herrero Casado, E. Energy Consumption in the Debugging. Trends to Improve Energy Efficiency and Self-Sufficiency in the WWTP. Master’s Thesis, Department of Hydrology and Water Resources Management, Universities of Alcalá and King Juan Carlos, Madrid, Spain, 2018. Available online: http://www3.uah.es/master_universitario_hidrologia/archivos/Proyectos_2018.pdf (accessed on 21 April 2019).
- Gil, M. Dynamic model of active sludge processes. Int. J. Numer. Methods Calc. Des. Eng. 1990, 6, 387–395. [Google Scholar]
- Simon Andreu, P.; Lardín, C.; Moreno, B.; Ponsoda, J.; Rancaño, A. Energy optimization of sludge treatment of the WWTP of Ceuta: Part I: Selection of operating conditions. Water Technol. 2010, 322, 54–63. [Google Scholar]
- Karim, M.A.; James, L.M. A Preliminary Comparative Analysis of MBR and CAS Wastewater Treatment Systems. Int. J. Water Wastewater Treat. 2017, 3, 2381–5299. [Google Scholar]
- Malia Baró, J.; Pérez, C.; Marín Sanchez, J.M. Optimization of the biological process in a wastewater treatment plant. In Proceedings of the I Seminar on Advanced Industrial Control Applications, Madrid, Spain, 19–20 October 2005; pp. 127–155. [Google Scholar]
- Judd, S.; Judd, C.; The, M.B.R. Principles and Applications of Membrane Bioreactors in Water and Wastewater Treatment. In The MBR Book; Elsevier: Amsterdam, The Netherlands, 2006. [Google Scholar]
- Vásquez, E.D.; Prats Rico, D.; Trapote Jaume, A. Study of a Membrane Bioreactor for the Treatment of Urban Wastewater. Master’s Thesis, Higher Polytechnic School, University of Alicante, Alicante, Spain, 2015. Available online: https://iuaca.ua.es/es/master-agua/documentos/-gestadm/trabajos-fin-de-master/tfm09/tfm09-edgardo-vasquez-rodriguez.pdf (accessed on 20 January 2019).
- German Association for Water, Wastewater and Waste. Standard ATV-DVWK-A 131E Dimensioning of Single-Stage Activated Sludge Plants. In ATV-DVWK Rules and Standards; Publishing Company of ATV-DVWK, Water, Wastewater, Waste: Hennef, Germany, 2000. [Google Scholar]
- Olsson, G.; Aspergren, H.; Nielsen, M.K. Operation and control of wastewater treatment—A Scandinavian perspective over 20 years. Water Sci. Technol. 1998, 37, 1–13. [Google Scholar] [CrossRef]
- Poch, M.; Comas, J.; Rodriguez Roda, I.; Sanchez Marré, M.; Cortés, U. Designing and building real environmental decision support system. Environ. Model. Softw. 2004, 19, 857–873. [Google Scholar] [CrossRef]
- Manesis, S.A.; Sapidis, D.J.; King, E. Intelligent control of wastewater treatment plants. Artif. Intell. Eng. 1998, 12, 275–281. [Google Scholar] [CrossRef]
- Paraskeva, P.A.; Pantelakis, I.S.; Lekkas, T.D. An advanced integrated expert system for wastewater treatment plants control. Knowl.-Based Syst. 1999, 12, 355–361. [Google Scholar] [CrossRef]
- Baeza, J.A.; Gabriel, D.; Lafuente, J. Improving the nitrogen removal efficiency of an A2/O based WWTP by using an on-line knowledge based expert system. Water Res. 2002, 36, 2109–2123. [Google Scholar] [CrossRef]
- Xu, L.J.; Shi, H.C.; Ke, X.Y. Structural and functional design of WWTP operation decision support system with a case study. Water Sci. Technol. 2006, 53, 241–250. [Google Scholar] [CrossRef] [PubMed] [Green Version]
- Yong, M.; Yong Zhen, P.; Xiao Lian, W.; Shu Ying, W. Intelligent control aeration and external carbon addition for improving nitrogen removal. Environ. Model. Softw. 2006, 21, 821–828. [Google Scholar] [CrossRef]
- Turon, C.; Freixó, A.; Ripoll, F.; Clara, P.; Comas, J.; Rodriguez Roda, I.; Poch, M. Intelligent system for decision making in the management of a WWTP. Chem. Eng. 2009, 466, 116–122. [Google Scholar]
- Guerrero, J.; Guisasola, A.; Vilanova, R.; Baeza, J.A. Improving the performance of a WWTP control system by model-based setpoint optimization. Environ. Model. Softw. 2011, 26, 492–497. [Google Scholar] [CrossRef]
- Won, S.G.; Ra, C.S. Biological nitrogen removal with a real-time control strategy using moving slope changes of pH (mV) and ORP time profiles. Water Res. 2011, 45, 171–178. [Google Scholar] [CrossRef] [PubMed]
- Cristes, S.; De Prada, C.; Sarabia, D.; Gutierrez, G. Aeration control of wastewater treatment plant using hybrid NMPC. Comput. Chem. Eng. 2011, 35, 638–650. [Google Scholar] [CrossRef]
- Turon, C.; Giró, J.; Ripoll, F.; Clara, P.; Freixó, A. Advanced and intelligent control for energy saving in the biological elimination of nutrients. Chem. Eng. 2011, 490, 90–95. [Google Scholar]
- Rosas Moya, R. Energy Efficiency in Water and Sanitation Enterprises in Latin American and Caribbean Countries (Best Practices and Lessons Learned), Inter-American Development Bank Infrastructure and Environment Sector, 2011; Technical Note Number 328.
- Ferro, G.; Lentini, E. Energy Efficiency and Economic Regulation in Drinking Water and Sewerage Services; United Nations-Economic Commission for Latin America and the Caribbean (ECLAC) and German Cooperation: New York, NY, USA, 2015; Volume 170, pp. 1–70, ISSN 1680-9017; Available online: https://repositorio.cepal.org/bitstream/handle/11362/37630/S1421127_es.pdf?sequence=1&isAllowed=y (accessed on 14 February 2019).
- Chisti, Y. Pneumatically agitated bioreactors in industrial and environmental bioprocessing: Hydrodynamics, hydraulics, and transport phenomena. Am. Soc. Mech. Eng. 1998, 51, 33–112. Available online: https://appliedmechanicsreviews.asmedigitalcollection.asme.org/article.aspx?articleid=1396214 (accessed on 20 March 2019). [CrossRef]
- Matas, E.; Rancaño, A.; Carpes, G. Importance of the Control of Recirculation over Energy Optimization in an WWTP; EMASESA Metropolitan Poster: Sevilla, Spain, 2009. [Google Scholar]
- Trillo, I. Energy efficiency of aeration systems. In Proceedings of the V Technical Conference on Sanitation and Purification; Water Sanitation Organization of the Region of Murcia (WSERM): Murcia, Spain, 25–26 November 2009. Available online: http://www.esamur.com/historico (accessed on 20 June 2018).
- Yamamoto, K.; Win, K.N. Tannery wastewater treatment using a sequencing batch membrane reactor. Water Sci. Technol. 1991, 23, 1639–1648. [Google Scholar] [CrossRef]
- Rosenberger, S.; Kubin, K.; Kraume, M. Rheology of activated sludge in membrane bioreactors. Eng. Life Sci. 2002, 2, 269–275. [Google Scholar] [CrossRef]
- OMIE Energy and Economy Website. Available online: http://www.omie.es/inicio (accessed on 30 March 2019).
- Irizar, I.; Craamer, P. ArtICA4nr-Improvement of eco-efficiency and sustainability in WWTP with elimination of nutrients. In Proceedings of the Technical Conference: Energy Efficiency and Renovation of Facilities. SMAGUA, Zaragoza, Spain, 8–11 March 2016; Available online: https://www.youtube.com/watch?v=y84M43hNVXY&list=PL1WFkKgbfErcMXkH1LSvpHxqjCabgPaL&index=4 (accessed on 30 March 2019).
- Ayesa, E.; de la Sota, A.; Grau, P.; Sagarna, J.M.; Salterain, A.; Suescun, J. Supervisory control strategies for the new WWTP of Galindo in Bilbao: The long run from the conceptual design to the full-scale experimental validation. Water Sci. Technol. 2006, 53, 193–201. [Google Scholar] [CrossRef] [PubMed]
- Beltrán, S.; Irizar, I.; de la Sota, A.; Villanueva, J.M.; Ayesa, E. Model-based optimization of aeration systems in WWTP. In Proceedings of the XI IWA Conference on Instrumentation Control and Automation, Narbonne, France, 18–20 September 2013. [Google Scholar]
- De la Sota, A.; Beltrán, S.; Ayesa, E. Optimization by simulation of operation strategies for the Galindo WWTP. In Proceedings of the XXXII AEAS Technical Conference, Donostia-San Sebastián, Spain, 12–14 June 2013. [Google Scholar]


© 2019 by the authors. Licensee MDPI, Basel, Switzerland. This article is an open access article distributed under the terms and conditions of the Creative Commons Attribution (CC BY) license (http://creativecommons.org/licenses/by/4.0/).
Share and Cite
Lozano Avilés, A.B.; del Cerro Velázquez, F.; Llorens Pascual del Riquelme, M. Methodology for Energy Optimization in Wastewater Treatment Plants. Phase I: Control of the Best Operating Conditions. Sustainability 2019, 11, 3919. https://doi.org/10.3390/su11143919
Lozano Avilés AB, del Cerro Velázquez F, Llorens Pascual del Riquelme M. Methodology for Energy Optimization in Wastewater Treatment Plants. Phase I: Control of the Best Operating Conditions. Sustainability. 2019; 11(14):3919. https://doi.org/10.3390/su11143919
Chicago/Turabian StyleLozano Avilés, Ana Belén, Francisco del Cerro Velázquez, and Mercedes Llorens Pascual del Riquelme. 2019. "Methodology for Energy Optimization in Wastewater Treatment Plants. Phase I: Control of the Best Operating Conditions" Sustainability 11, no. 14: 3919. https://doi.org/10.3390/su11143919