Article

Soil Gaseous Emissions and Partial C and N Balances of Small-Scale Farmer Fields in a River Oasis of Western Mongolia

1
Organic Plant Production and Agroecosystems Research in the Tropics and Subtropics, Universität Kassel, Steinstr. 19, 37123 Witzenhausen, Germany
2
Biology Department, School of Arts and Sciences, National University of Mongolia, Youth Str. 1, Baga toiruu, 210646 Ulaanbaatar, Mongolia
*
Author to whom correspondence should be addressed.
Sustainability 2019, 11(12), 3362; https://doi.org/10.3390/su11123362
Submission received: 2 May 2019 / Revised: 4 June 2019 / Accepted: 13 June 2019 / Published: 18 June 2019
(This article belongs to the Section Sustainable Agriculture)

Abstract

:
During the last decades, Mongolian river oases were subjected to an expansion of farmland. Such intensification triggers substantial gaseous carbon (C) and nitrogen (N) losses that may aggravate disequilibria in the soil surface balances of agricultural plots. This study aims to quantify such losses, and assess the implications of these emissions against the background of calculated partial C and N balances. To this end, CO2, NH3, and N2O soil emissions from carrot, hay, and rye plots were measured by a portable dynamic closed chamber system connected to a photoacoustic multi-gas analyzer in six farms of the Mongolian river oasis Bulgan sum center. Average C and N flux rates (1313 g CO2-C ha−1 h−1 to 1774 g CO2-C ha−1 h−1; 2.4 g NH3-N ha−1 h−1 to 3.3 g NH3-N ha−1 h−1; 0.7 g N2O-N ha−1 h−1 to 1.1 g N2O-N ha−1 h−1) and cumulative emissions (3506 kg C ha−1 season−1 to 4514 kg C ha−1 season−1; 7.4 kg N ha−1 season−1 to 10.9 kg N ha−1 season−1) were relatively low compared to those of other agroecosystems, but represented a substantial pathway of losses (86% of total C inputs; 21% of total N inputs). All C and N balances were negative (−1082 kg C ha−1 season−1 to −1606 kg C ha−1 season−1; −27 kg N ha−1 season−1 to −65 kg N ha−1 season−1). To reduce these disequilibria, application of external inputs may need to be intensified whereby such amendments should be incorporated into soil to minimize gaseous emissions.

1. Introduction

During the last decades, river oases in the arid and semi-arid areas of East Asia were subjected to a strong expansion of built-up area and farmland. This land-use change was particularly pronounced in oases across western China [1,2,3,4,5], where land-use modifications were linked to strong population growth promoted by economic incentives of the Chinese government [6,7]. A similar strong trend in land-use change—but one that was smaller in extent—could be observed in Mongolian oases. For example, the built-up area of the river oasis Bulgan sum center in the Mongolian Altai Mountain Range increased from 0.7 km2 to 2.8 km2 between 1972 and 2013, while irrigated agricultural land expanded by a factor of six up to 28.9 km2 during the same period [8]. Similar to Chinese land-use modifications, these changes were triggered by a population increase (sedentarization of pastoralists) and governmental policies aiming at the expansion and intensification of crop and fodder production to enhance food self-sufficiency and mitigate livestock mortality during harsh winters through hay feeding [8]. It remains unclear how such land-use modifications will affect the fragile agroecological resources of Chinese river oases [2]. Recently, negative nutrient balances were reported for agricultural areas in the basin of the Kharaa River basin in north central Mongolia due to the non-replacement of exported nutrients through fertilizer [9]. Low fertilizer use was also observed for agricultural fields in Bulgan sum center [8]. This raises concerns that the expansion of farmland may have negatively affected balances of soil C and N inputs and outputs of agricultural plots in Bulgan sum center, which likely also applies to other Mongolian river oases.
Irrigation agriculture under arid and semi-arid climate conditions has been reported to lead to major soil gaseous emissions of C and N not only of high-input agroecosystems (i.e., high level of fertilizer and irrigation water use) [10,11], but also of low-input agroecosystems (i.e., low level of fertilizer use and irrigation water use) [12]. Owing to the remote location of Bulgan sum center, a rapid in situ method to assess C and N emissions from agricultural soils is needed. This avoids the logistically complicated sampling by glass vials or gas bags that is needed for gaschromatic sample analysis in a remote laboratory, and allows a high number of measurement repetitions across study plots. Besides increasing the statistical power [13] and avoiding the negative effects of long chamber closure time on gas diffusion and microclimate [14,15], this would address the observed high spatial heterogeneity and variability of soil properties in the floodplain [16]. A dynamic closed chamber system that is connected to a portable photoacoustic multi-gas monitor [17,18] meets these requirements and had previously shown its suitability for soil emission measurements in remote areas [19,20,21]. However, the accuracy and precision of (particularly N2O) measurements made by the photoacoustic monitor were the subject of earlier discussions [22,23] and should be considered during the interpretation of study results.
An approach to assess the specific land-use effects on agroecosystems is the calculation of C and N balances. C and N balancing is a well-established method to identify input and output pathways and detect input and output imbalances in a spatially predefined agroecosystem over a specific period (e.g., season or years) [24,25,26]. This allows the identification of corrective measures to minimize the potential negative impacts on the environment and soil fertility as done before for numerous small-scale agroecosystems in urban and peri-urban settings under arid and semi-arid climate conditions [27,28,29].
The aims of this study were to (i) quantify CO2–C and N2O–N emissions as well as the NH3–N volatilization of typical crops in the area together with soil and air temperature and humidity, (ii) assess the gaseous emissions of C and N in the context of calculated partial C and N balances, and (iii) identify measures to reduce possible gaseous C and N losses and disequilibria in partial balances exemplarily for the river oasis of Bulgan sum center in Mongolia.
Therefore, we hypothesized that low fertilizer inputs lead to low soil organic matter turnover and thus also low gaseous losses of soil C and N from the agroecosystems in the floodplain of Bulgan sum center during the growing season, despite high temperatures and frequent irrigation. Differences in emissions between crops reflect different cultivation practices and microclimatic conditions. We further hypothesized that negative partial C and N balances were the result of low but substantial gaseous emissions in combination with high harvest exports and low fertilizer inputs.
The outcomes of this study may support efforts to sustain the fertility of the floodplain soils of many similar river oases in central Asia, and thus prevent a long-term decline in crop yields threatening the food security of agro-pastoral households.

2. Materials and Methods
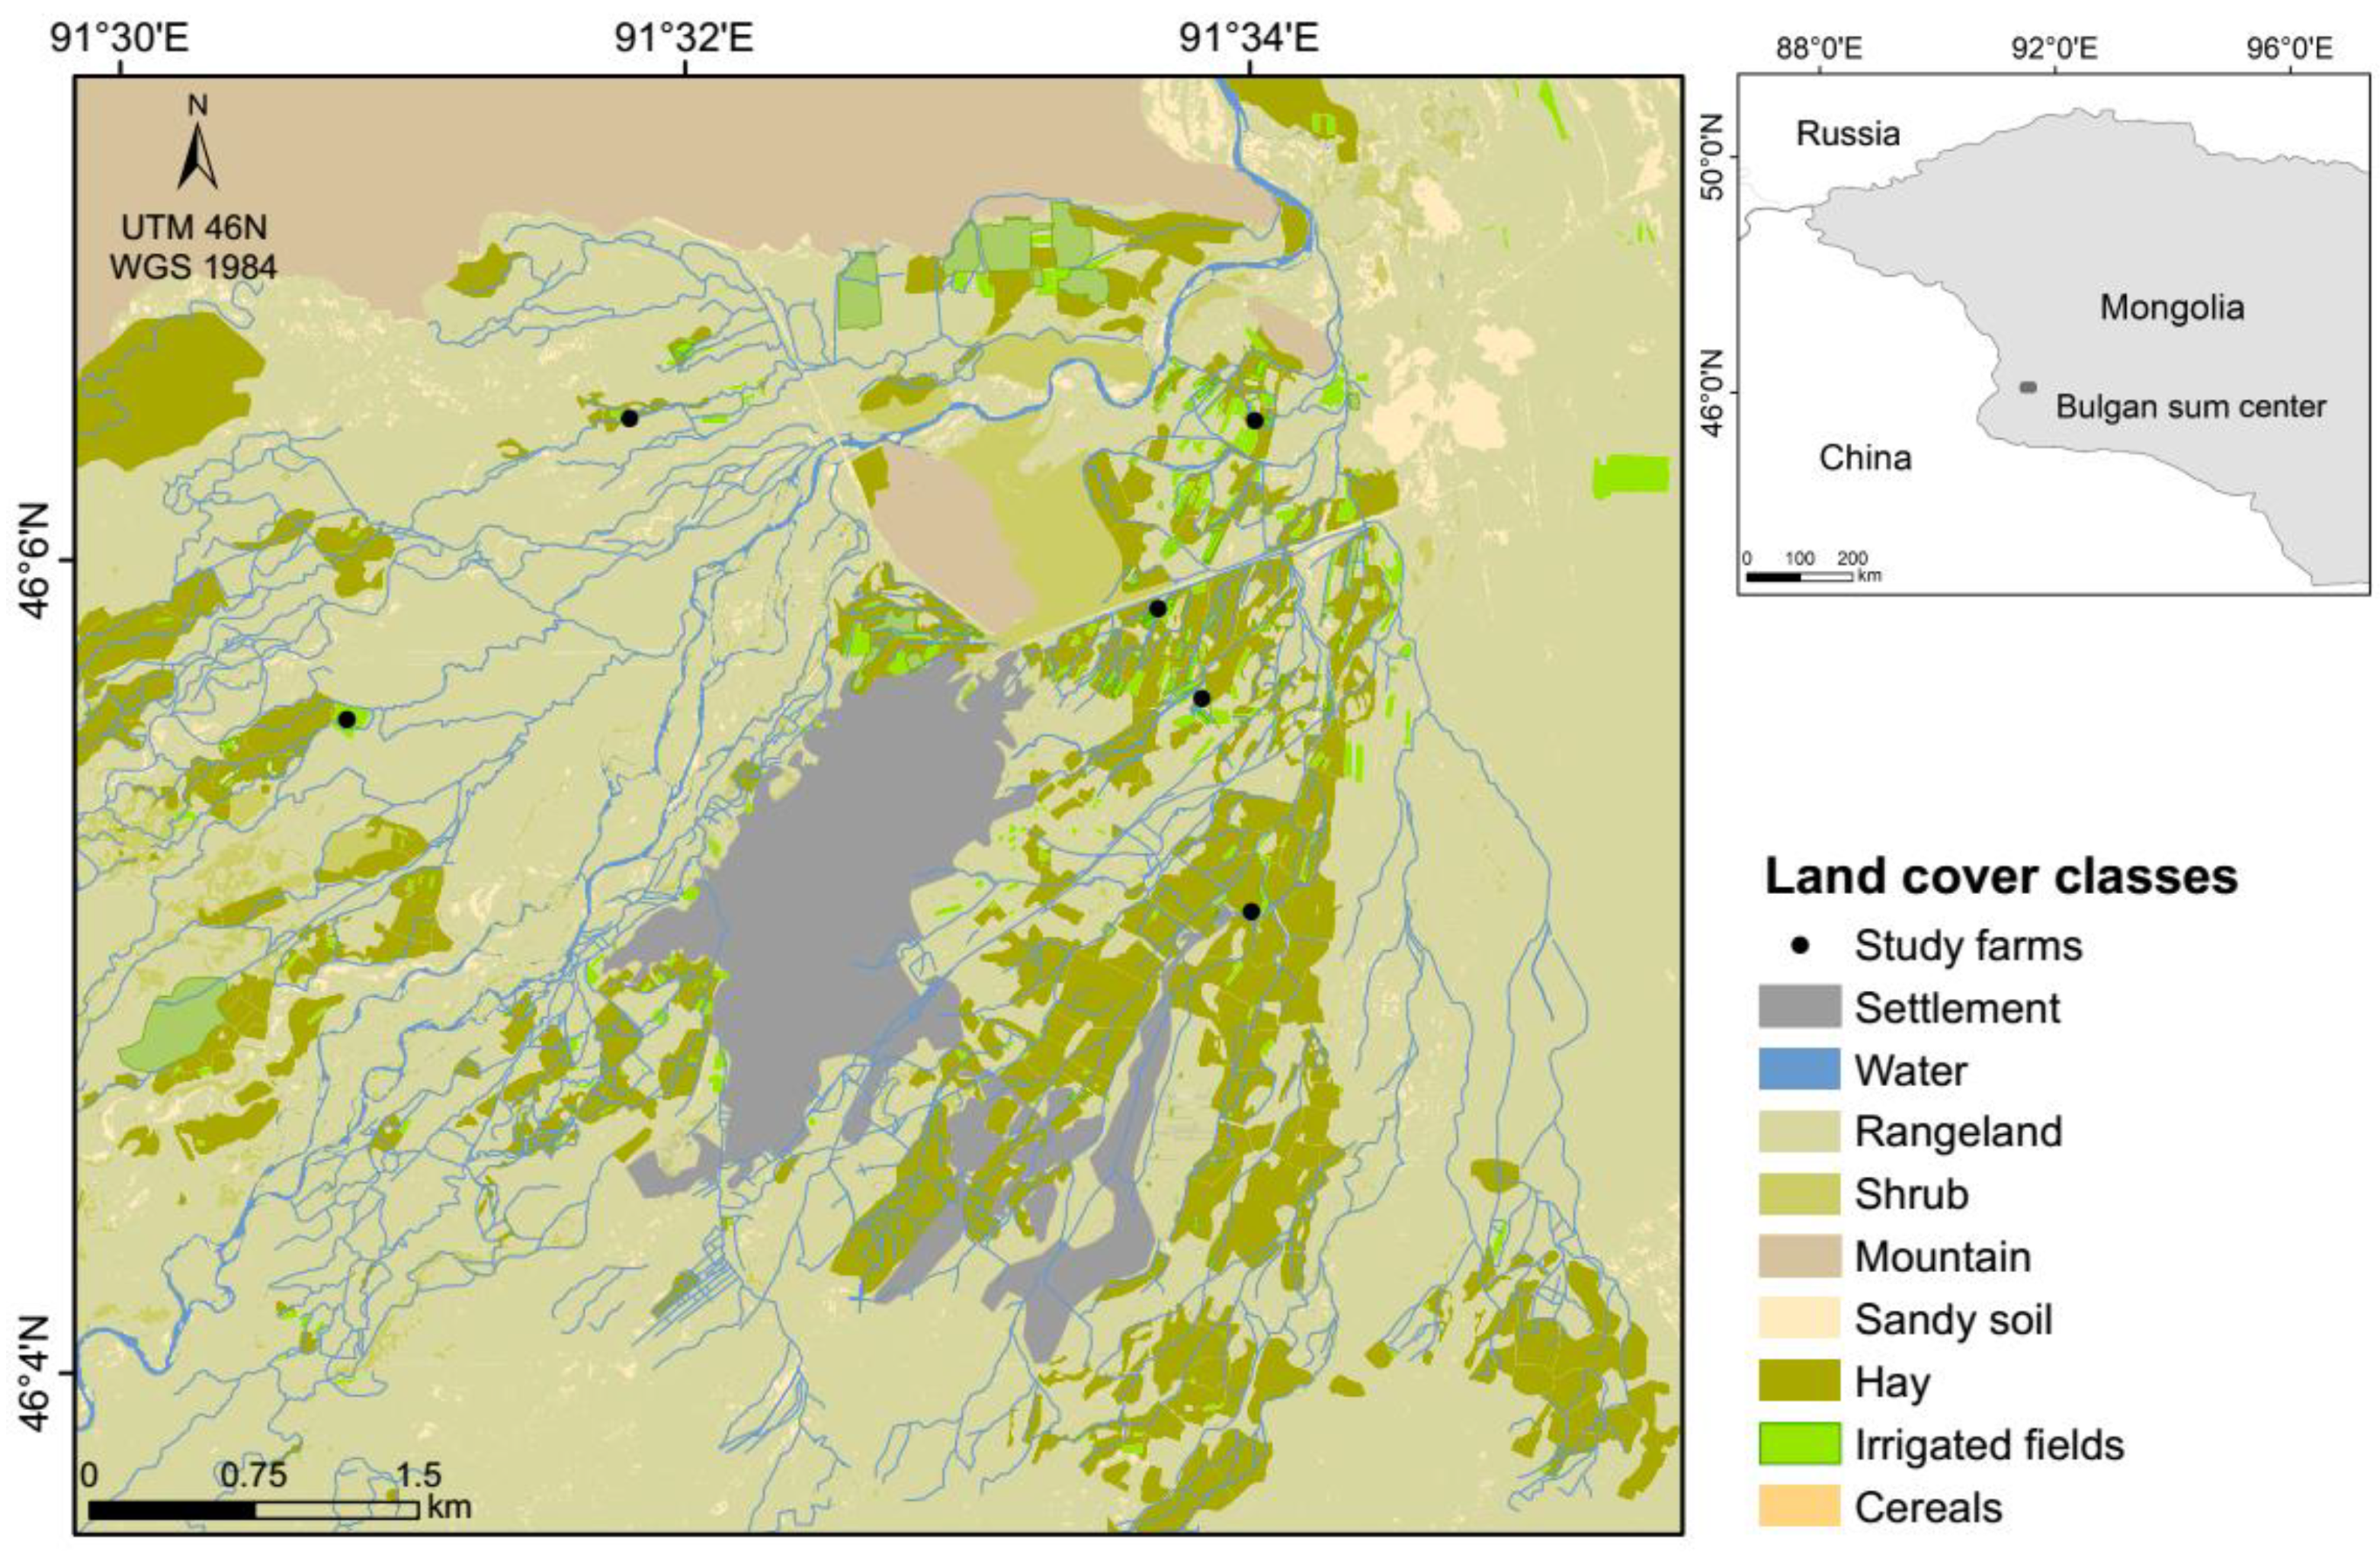
2.1. Study Site

The study has been carried out in the river oasis of Bulgan sum center, which is the administrative capital of Bulgan district, Khovd province, Western Mongolia, and lies in the transitional area between the Altai Mountain range and the Dzungarian Desert (1186 m above sea level, 46.094 N, 91.552 E). The settlement with its surrounding agriculture fields is situated in the Bulgan River floodplain (Figure 1) whose soils were classified as Fluvisols [16]. Long-term climate records for this river oasis (World Meteorological Organization (WMO) code 44265, 1963–2014) showed an average minimum and maximum monthly air temperature of −21 °C (January) and 21 °C (July), respectively, and an average annual precipitation amount of 75 mm (coefficient of variation (CV) of 45%) [30]. Precipitation was lower during the study years 2013 (48 mm a−1) and 2014 (51 mm a−1), while the average annual air temperature was 4.2 °C in 2013 and 3.5 °C in 2014, which was higher than the long-term mean of 2.5 °C (1963–2014). Due to the frost period, cropping activities in the floodplain are generally restricted to a time range from May to September, during which two-thirds of the annual amount of rainfall is recorded.
During the past two decades, the Mongolian land-use policy of expanding and (re)intensifying agriculture after the change from a socialist to a market economy in the late 1990s affected livelihood strategies and land cover in Bulgan sum center. The area of irrigated agricultural land increased in the river oasis as the local population’s livelihood successively changed from traditional transhumance systems [31] to agro-pastoral ones [8]. In 2012, 80% of the households permanently settled in the river oases, while 20% were transhumant pastoralists. The majority of settled households combined field cropping with livestock keeping (70%), whereas only 8% focused their agricultural activities exclusively on field cropping. Almost all households kept livestock (91%) comprising on average five status animals (camel and horse), 14 cattle, and 77 small ruminants (31% sheep and 69% goat). The livestock of the settled households was predominately herded externally (79%) by transhumant pastoralists against the payment of a fee that was either non-monetary in the form of hay and food, or in cash. Cropping was mainly performed on irrigated small-sized fields near the homestead. Besides fruit-bearing shrubs and trees (mainly apple (Malus domestica Borkh. nom. illeg.), plum (Prunus domestica L.), and seabuckthorn (Hippophae rhamnoides L.)), cereals (mainly rye (Secale cereale L.) and wheat (Triticum L.)), and vegetables (mainly cabbage (Brassica oleracea convar. Capitate L.), carrot (Daucus carota subsp. Sativus (Hoffm.) Schübl. et G. Martens), and potato (Solanum tuberosum L.)) were the most frequent cultivated plants [8,32]. Haymaking is common in every household [8,32]. The size of cropland per household averaged 0.29 ha, whereas hayfields were about 14 times larger (3.96 ha) [8]. The cultivation of alfalfa (Medicago sativa L.) was not observed during the study period. Almost all fields were surface-irrigated regularly (vegetables about 17 times per season, cereals about 12 times per season, and hay about eight times per season, on average) with river water that was distributed via an extensive but dilapidated network of irrigation channels [8]. The crop production system can be considered as a low-input agroecosystem system. Only 13% of the households used pesticides, and only 52% applied fertilizer (primarily goat manure). One-half of the households sold products at the local market, while the other 50% used yields for their own purposes [8].

2.2. Experimental Setup and Sampling Procedure

Based on a preliminary household survey, six typical small-scale farms were selected within the floodplain of the river oasis for the measurement of gaseous C and N emissions from soil (Figure 1). The three most important crops (carrot, hay, and rye) were cultivated in all these farms in plots having a sufficient size (8 m2) to conduct the measurements while not affecting the activities of the farmers. Four (rye and carrot) and six (hay) measuring points were selected in each plot. Thereafter, data on gaseous soil emissions of C and N were collected at the same measuring points bi-weekly in each small-scale farm between end of May and September in 2013 and 2014.
CO2–C, N2O–N, and NH3–N emissions were measured by a dynamic closed chamber system. The portable system consisted of a polytetrafluoroethylene (PTFE) coated cylindrical polyvinyl chloride (PVC) chamber (0.11-m height and 0.30-m diameter), which was connected with a photoacoustic multi-gas monitor (INNOVA 1312-5, LumaSense Technologies A/S, Ballerup, Denmark) through two 1-m long inlet and outlet PTFE tubes [20]. The outside of the chamber was covered with a layer of aluminum to diminish irradiation-derived temperature increases in the interior. The air humidity and temperature of the chamber were permanently examined by a digital thermohygrometer (PCE-313A, PCE Deutschland GmbH, Meschede, Germany) [11]. A coupling ring (PVC, 0.3-m diameter, 0.06-m height) was inserted about 25 cm into the soil one day before measurement to avoid lateral diffusion and leaks between the chamber and soil [33,34]. Memory effects were avoided by disconnecting the chamber from the coupling ring after each accumulation interval of five gas concentration readings and a subsequent aeration and flushing for four minutes [35]. The temperature of the soil was recorded three times at a depth of 0.05 m around the coupling rings during each gas emission reading by means of a digital penetration thermometer (Carl Roth GmbH & Co. KG, Karlsruhe, Germany). Soil moisture in the form of volumetric water content in 0.05 m was simultaneously measured four times using a ThetaProbe ML2x FD soil moisture sensor, which was connected to an Infield 7 unit (Meter Group AG, Munich, Germany). The water-filled pore space (WFPS) was calculated by means of the bulk density and the volumetric water content [36]. Data were collected during the coolest (between 05:00–08:00) and hottest (between 13:00–15:00) daytime to take diurnal variations of soil temperature and soil moisture into account, which both effect gaseous emissions [37]. The emission rates have been computed by dividing the difference in gas concentrations between the first and the 123rd second (data record every 61 seconds) of the measurement period by the elapsed time span of 122 seconds [20]. In rare cases of negative NH3 and N2O emission rates, values were set to zero [20]. A linear increase of gas concentrations in the chamber was assumed [38], which was supported by strong bivariate Pearson correlations between gas concentration and accumulation time [39]. The area covered by the chamber was upscaled to one hectare (g ha−1 h−1). For the measured concentration of gas molecules, the proportion of C and N was calculated.
The top soil layer (0–10 cm) was sampled at the beginning of September in 2013 and 2014. The samples represented a mixed sample from each measuring site consisting of three subsamples. To this end, air-dried samples were sieved to a mesh size smaller than 2 mm after the removal of plant roots and pooled to receive a representative sample of each farm. After removing organic matter with 10% H2O2 and carbonates with 2 M HCl, soil texture was determined by gravitational sedimentation (silt and clay particles) and wet sieving (sand particles >63 μm). A calcimeter (Calcimeter Bernard, Prolabo, Paris, France) was used for the gas volumetric measurement of carbonates after the addition of 10% HCl to soil. Total concentrations of C and N in the soil were quantified with a Vario MAX CN analyzer (Elementar Analysensysteme GmbH, Langenselbold, Germany). The difference between carbonate C and total C represented the concentration of soil organic carbon (SOC). Soil pH (H2O) was assessed at a solid-to-liquid suspension of 1:2.5. Electrical conductivity (EC) was measured by a digital conductivity meter (GMH 3430, GHM Messtechnik GmbH, Regenstauf, Germany) at a soil-to-water ratio of 1:5.

2.3. Data Processing and Statistical Analyses

The semi-monthly data of CO2–C, NH3–N, and N2O–N emission rates from soil in g ha−1 h−1 of each cultivar were averaged across the four (rye and carrot plots) and six (hay plots) measuring points of each farm. Subsequently, the average was calculated across the six farms and over the two survey years (n = six farms * two years = 12). The semi-monthly data of soil emission rates were multiplied by the period until the following measurement event. Subsequently, the results were totaled up to the end of the cultivation period to calculate the cumulative gaseous losses in kg ha−1 season−1. Results on the physical and chemical soil properties represented arithmetic means for each cultivar across all gardens over two years (n = six farms * two years = 12) and referred to oven-dry samples (105 °C, 24 h). The CV (in percentage) was determined for each cultivar and presented as an arithmetic mean (n = 3).
The Shapiro–Wilk test and the Levene test were applied to test all data for normal distribution and homogeneity of variance, respectively. According to the results, data were subjected either to a Kruskal–Wallis H test or a one-way ANOVA test to check for statistically significant differences in means between cumulative soil gaseous losses and the physical–chemical soil properties of cultivars. For a pairwise multiple comparison, the Tukey method (following the Kruskal–Wallis H test) or Holm–Sidak method (following the one-way ANOVA test) was used in case of significant differences.
Regression models were applied to check for a relationship between gaseous emissions and the independent variables WFPS, soil temperature, relative air humidity, and air temperature. As no residuals of independent variables were normally distributed, the goodness of fit was quantified by the Spearman’s rank correlation coefficient. Analyses of statistical differences were performed in Sigma Plot 12.3 (Systat Software Inc., San José, CA, USA) at a significance level of p < 0.05 (two-tailed). The same significance level was applied for the calculation of regression models using IBM SPSS Statistics 20 (IBM Inc., New York, NY, USA).

2.4. Sample Processing and Calculation of Partial C and N Balances

Partial C and N balances were calculated to evaluate the significance of gaseous emissions from the soil. Input and output fluxes of both elements were quantified and summed up for the quantification of the net change of C and N in the soil surface pool of the carrot, hay, and rye plots. The following C and N output fluxes were considered: harvest, weeding, and soil gaseous emissions, as well as the following C and N input fluxes: manure, irrigation, C-fixation through assimilation by plants, biological N2 fixation, atmospheric wet and dry deposition, and N input through seeding. Leaching was regarded as a negligible N output flux, as the low annual rainfall amount prevents leaching even under heavy irrigation [12,40].
To quantify the C and N output via harvest and weeding, biomass removed from the observation plots was measured, and samples were collected at each event, air dried, and stored in polyurethane bags for laboratory analyses. Manure was applied to all plots through droppings of roaming animals after harvest in September. In hay plots, the mass of manure was measured using a sampling frame of 0.25 m2 randomly 10 times before seeding. For carrot and rye plots, the same amount of manure application was assumed, as the manure was already incorporated into the soil. After collection, manure samples were air dried and stored in polyurethane bags for laboratory analyses. C and N input via irrigation was quantified for each plot by measuring the amount of applied water based on the number and duration of irrigation events, the flow cross-section, and velocity. Samples of irrigation water were collected into a 50-mL polyurethane bottle and put in a freezer until analysis after adding a few drops of hydrochloric acid (32%) [12]. To estimate the total C-assimilation by plants, removed above-ground biomass was multiplied by a factor of two [12]. Data on N input through seeds (4.2 kg ha−1) and biological N2 fixation (32.2 kg ha−1, symbiotic N2 fixation for fodder crops, and non-symbiotic N fixation) were taken from a nutrient balance study that was carried out in the Kharaa River basin in north central Mongolia [9]. For the quantification of N inputs through atmospheric wet and dry deposition, data were taken from a previous study on N deposition in Bulgan sum center (wet deposition of 2.8 kg ha−1 a−1, dry deposition of 6.6 kg ha−1 a−1) [41]. The C input via wet and dry deposition was estimated by a deposition trap [12]. After the growing season and evaporation of rainwater, the entire trapped material was collected and transported in a polyurethane bag for laboratory analyses.
Plant and manure samples were analyzed for C and N concentrations by means of a Vario MAX CN analyzer (Elementar Analysensysteme GmbH, Langenselbold, Germany). Total organic C and total N of liquid samples were measured by a Multi N/C 2100 analyzer (Analytik Jena AG, Jena, Germany). C and N concentrations were multiplied either with the volume of liquid samples or with the mass of solid samples dried in an oven. Data on C and N input and output fluxes were collected for the observation seasons in 2013 and 2014, and mean values were calculated over both years.

3. Results

3.1. Soil Characteristics

Physical and chemical top-soil characteristics (0–0.05 m) were rather similar across the selected fields (Table 1). Based on the portion of clay, silt, and sand that varied slightly around 15%, 42% and 43%, respectively, the soil texture was classified as a loam. Bulk density averaged 1.2 g cm−3 with a low standard deviation (0.1) and CV (10%). The Canorg value was similar for the three cultivars (0.4 mg g−1). The C/N ratio ranged between 9.2–10.4, and the pH value was with about 7.9 slightly alkaline across all cultivars. The EC ranged from 86 µS cm−1 in the carrot plots to 113 µS cm−1 in the hay plots, but this difference was not statistically significant. However, SOC and N formed two groups significantly differing from each other: hay plots showed with 19.8 mg g−1 and 1.9 mg g−1 higher SOC and N values than carrot and rye plots (10.8 mg g−1 and 1.15 mg g−1). The mean CV for the cultivars was ≤26% for almost all soil properties. The mean CV was relatively high only for SOC (26%), N (34%), and EC (53%).

3.2. Gaseous Emissions Rates of C and N and Influencing Factors

CO2–C emission rates peaked unimodally; the main period of gaseous C losses was from end of June to end of July, during which 53% of total C emissions occurred (Figure 2A). Maxima flux rates of 2221 g CO2–C ha−1 h−1 for hay fields, 2079 g CO2–C ha−1 h−1 for rye fields, and 1838 g CO2–C ha−1 h−1 for carrot fields were observed during this peak period. At the end of the cropping season, minimal flux rates of 1139 g CO2–C ha−1 h−1 for hay fields, 796 g CO2–C ha−1 h−1 for carrot fields, and 779 g CO2–C ha−1 h−1 for rye fields were recorded. C emission rates averaged 1774 g CO2–C ha−1 h−1 for hay plots, 1481 g CO2–C ha−1 h−1 for rye plots, and 1313 g CO2–C ha−1 h−1 for carrot plots.
In contrast to CO2–C, NH3–N and N2O–N flux rates followed a multimodal pattern (Figure 2B,C). Thus, NH3–N flux rates ranged between 1.6 g ha−1 h−1 for rye plots at the beginning of July and 4.3 g ha−1 h−1 for carrot plots at the end of July. N2O–N emission rates varied between 0.4 g ha−1 h−1 for rye plots at the beginning of September and 1.5 g ha−1 h−1 for carrot plots at the end of June. Highest mean NH3–N emission rates were measured in carrot plots (3.3 g ha−1 h−1), while lowest ones were observed in rye plots (2.4 g ha−1 h−1). An average of 3.0 g of NH3–N ha−1 h−1 was determined in hay plots. The same order was observed for N2O–N flux rates: the highest mean value was observed in carrot plots (1.1 g ha−1 h−1), a lower one was observed in hay plots (0.9 g ha−1 h−1), and the lowest one was recorded in rye plots (0.7 g ha−1 h−1).
Gaseous emissions rates were in many cases linearly correlated with WFPS, soil temperature, relative air humidity, and air temperature (Table 2). WFPS had a weak effect (rs ≤ 0.122, p < 0.05) on CO2–C flux rates and N2O–N flux rates or no effect (p > 0.05) for NH3–N. However, NH3–N volatilization rates were either positively correlated with the temperature of soil and air (rs = 0.414 and 0.481, p < 0.001) or negatively correlated with air humidity (rs = −0.425, p < 0.001). Moderate positive correlations were observed between (soil and air) temperature and CO2–C and N2O–N flux rates (rs ≥ 0.267 and ≤0.366, p < 0.001). N2O–N emission rates were also moderate negatively correlated with air humidity (rs = −0.309, p < 0.001).

3.3. Cumulative C and N Losses

The cumulative gaseous CO2–C emissions from hay plots were on average 4514 kg ha−1 season−1, which was about 14% higher than those of rye plots (3861 kg ha−1 season−1) and 22% higher than those of carrot plots (3506 kg ha−1 season−1; Figure 3A). In contrast, carrot plots emitted one-third more NH3–N (8.2 kg ha−1) and N2O–N (2.7 kg ha−1) over the cropping season than rye plots (5.6 kg NH3–N ha−1 and 1.8 kg N2O–N ha−1). Nitrogen losses from hay plots accumulated to 7.3 kg NH3–N ha−1 and 2.2 kg N2O–N ha−1 per season. Correspondingly, the cumulative total N emission was with 10.9 kg ha−1 season−1 32% higher for carrot plots than for rye (7.4 kg ha−1 season−1), and 12% higher than for hay (9.5 kg ha−1 season−1). Across all cultivations three-quarters of the total N was emitted in the form of NH3–N . While differences between cultivations were not statistically significant for CO2–C (p > 0.05), the cumulative NH3–N, N2O–N, and total N emissions differed between carrot and rye (p < 0.05; Holm–Sidak test for NH3–N, Tukey test for N2O–N, and total N). On average, cumulative C losses accounted for 86% of total C inputs and 67% of total C outputs (Table 3). It is noticeable that the C emissions exceeded about three times the average difference of C input and C output. The proportions of cumulative N losses averaged 21% of total N inputs and 10% of total N outputs (Table 4). Gaseous N emissions contributed about one-quarter to the total N balance.

4. Discussion

4.1. Emission Rates of C and N

Soil emission rates of CO2–C and N2O–N were within the range of reported values for cropland under temperate climate conditions (195 g CO2–C ha−1 h−1 to 3546 g CO2–C ha−1 h−1; 0.0014 g N2O–N ha−1 h−1 to 1.4987 g N2O–N ha−1 h−1), but lower for CO2–C (3027 g CO2–C ha−1 h−1 to 7740 g CO2–C ha−1 h−1) and higher for N2O–N (0.0378 g N2O–N ha−1 h−1 to 0.3166 g N2O–N ha−1 h−1) under (sub)tropical climates [15]. Compared with studies applying a similar method for capturing soil gaseous emissions, CO2–C, N2O–N, and NH3–N were within the range of reported values for irrigated farmland under arid and semi-arid climate conditions (27 CO2–C ha−1 h−1 to 5500 CO2–C ha−1 h−1; 0 g N2O–N ha−1 h−1 to 30 g N2O–N ha−1 h−1; 0.7 g NH3–N ha−1 h−1 to 21 g NH3–N ha−1 h−1) [10,11,20]. Thereby, CO2–C emission maxima were up to 2.5 times lower than those of intensively managed peri-urban gardens in Niamey, Niger [10] and organic vegetable production systems of the coastal lowlands of Oman [11], but comparable to values measured in small-scaled low input systems in the Nuba Mountains of Sudan [20]. However, maximum N emissions rates were up to 23 times (N2O–N) and five times (NH3–N) lower in Bulgan sum center compared with values in the previously mentioned studies. Captured C and N emission rates corresponded to the typical flux rate values underlining the significance of the gaseous outflow pathway also for the agroecosystem in the floodplain of the studied river oasis in Western Mongolia. At the same time, the low maximum values of emission rates pointed to a management system with low inputs.
The agroecosystems of Bulgan sum center were characterized by low or even no application of fertilizer and less irrigation water [8]. For instance, the applied amount of irrigation water per day (maximum of about 26 m3 ha−1 day−1 for carrot plots) is similar to that in the low input systems of the Nuba Mountains in Sudan (about 26 m3 ha−1 day−1) [12]. It is far lower than the water amounts used in the high-input vegetable production systems near Sohar, Oman (about 156 m3 ha−1 day−1) [42], and gardens in Niamey, Niger (minimum about 149 m3 ha−1 day−1) [28]. Fertilizing and irrigation activities directly affect gaseous flux rates in general, as emissions are triggered by soil water content as well as C and nutrient availability, besides land cover, soil pH, and soil temperature [43].
Heterotrophic soil microorganism and autotroph actors such as roots are the main source of soil-emitted CO2–C [15]. Soil respiration is mainly controlled by soil temperature and soil humidity explaining up to 89% of the temporal variation [44]. The crucial importance of both factors is also evident for the Mongolian plateau [45] and correlates positively in the present study too, although no strong relationship was observed. Root respiration varies over the season due to changes in root biomass and age [46]. It is assumed to contribute 40% to 60% to total soil respiration [47], but can account for up to 95% and 98% in the case of grasses and cereals, respectively [48]. This was clearly reflected in the observed dynamic of CO2–C emissions in Bulgan sum center over the growing season. The increase of CO2–C flux rates at the beginning of the growing season is related to the biomass increase of young roots showing a high respiratory activity, which declines with root age [15,49]. The higher root biomass in rye fields and even more in hay fields led to higher CO2–C flux rates, although these differences were not statistically significant. The higher microbial basal respiration in hay compared with vegetable plots, which was observed in a previous study in Bulgan sum center [30], contributed additionally to this difference in CO2–C emissions. The increased basal respiration was positively related to SOC, which is provided either by roots through their decomposable biomass or the exudation of C-rich organic substances into the rhizosphere [50].
Besides SOC, mineralized N, and pH, the production of N2O is largely controlled by soil moisture and oxygen availability, and soil temperature explaining 86% of the variation of N2O emissions [51]. It is also well known that the exchange of NH3–N between atmosphere and soil positively correlate with WFPS and soil temperature, apart from ammonium concentration in soil, soil cation exchange capacity, and pH value [52]. The relevance of meteorological conditions such as air temperature, solar radiation, and wind speed were also previously shown for NH3–N emissions [53]. Soil moisture expressed in form of WFPS and soil temperature correlated with N2O–N and NH3–N flux rates in Bulgan sum center, too. Highest N2O–N and NH3–N flux rates were observed in carrot plots, which were irrigated most frequently and received the largest amount of irrigation water [8], resulting in the highest average values for WFPS compared to the hay and rye plots (data not shown). Additionally, it can be assumed that the microclimate in carrot plots was more favorable for N2O–N and NH3–N emissions as the leaf canopy was not that dense compared to hay and rye plots. This led to a higher solar irradiation at the soil surface resulting in higher soil temperatures. Particularly for NH3–N emissions, the reduction of wind speed in the taller and denser plant stock of hay and rye plots may be a significant factor that likely leads to a decline of NH3–N emission rates [53]. Although concentrations of SOC and N in soil were significantly higher in hay plots, which potentially increase N2O–N and NH3–N flux rates, WFPS and soil temperature seem to override these factors. The positive correlation of N2O–N and NH3–N emission rates with air temperature could be considered as an indirect relationship, as the soil temperature in the depth of 0.05 m was strongly correlated to air temperature (data not shown). The negative correlation of air humidity with the N2O–N and NH3–N flux rates likely mirrored the inverse link between air temperature and relative air humidity.

4.2. Cumulative C and N Emissions

The low cumulative gaseous emissions reflected the low-input management system of the river oasis as well. Estimated seasonal gaseous C losses were up to 8.5 times lower than values reported from intensified agricultural systems of Niamey, Niger (25,000 to 30,000 kg CO2–C ha−1 season−1) [10], three times lower than values from Northern Oman (6200 to 10,600 kg CO2–C ha−1 260 days−1) [11], and up to 1.7 times lower than values reported for low-input systems in Sudan (5667 to 6119 kg CO2–C ha−1 a−1) [12]. Even if an output flux of 317 mg CO2–C m−2 d−1 from floodplain soils is assumed during frost periods [54], data were still substantial lower, although they are then more comparable to the estimated annual gaseous C losses of the low-input management systems in Sudan. Likewise, cumulative N emissions were 7.5 to 12.5 times lower than values reported in the previous mentioned studies (48 kg N ha−1 a−1 to 92 kg N ha−1 a−1 [10], 45–55 kg N ha−1 260 days−1 [11], and 51 kg N ha−1 a−1 to 55 kg N ha−1 a−1 [12]), even under the assumption of an emission rate of 112 µg N m−2 d−1 during frost periods [54]. NH3–N was the predominant form of emitted N across all plots, which was likely due to the alkaline pH value, as it favors a high concentration of NH3 in soil solution, and thus the potential of high volatilization rates [55]. Therefore, potential biases due to the precision and accuracy of N2O data collection by means of the photoacoustic field monitor seem to be of minor significance [22,23]. The higher accumulated CO2–C losses in hay plots and N2O–N and NH3–N losses in carrot plots over the season is caused by the higher emission rates of C and N in the respective fields due to the reasons mentioned above.

4.3. Importance of Gaseous C and N Losses

The contributions of C and N emissions to total C and total N inputs in the small-scale agroecosystems of Bulgan sum center were 86% and 21%, respectively, which were comparable to the already mentioned irrigated low-input agroecosystems of the Nuba Mountains in Sudan (64% of total C input; 32% of total N inputs) [12]. Gaseous losses accounted for two-thirds of total C losses and one-quarter of total N losses in the Nuba Mountains, which is similar to the small-scale systems in the Bulgan floodplain, too (63% and 23% of total C and N outputs in the Nuba Mountains; 67% and 10% of total C and N outputs in Bulgan sum center). The proportion of N emissions to total N inputs and outputs in a high-input agroecosystem—such as for example the irrigated urban gardens in Niamey, Niger—were with 2.5–11% and 11–48%, respectively, lower and higher compared to the plots in Mongolia [10]. These differences may be caused by the much higher N input via fertilizing and N output via harvest in Niamey.
It was shown that C and N emissions can be a major output pathway that contributes significantly to the negative partial C and N balances of the agroecosystems in Bulgan sum center, which is particularly true for C. This raises the question of how the C and N gap of the agroecosystems in Bulgan sum center could be closed, taking C and N emissions into account. Farmers could address the C and N imbalance by an increase of the input side (e.g., more fertilizer or biological N2 fixation) and/or by a reduction of the output side (e.g., reduction of emissions).
The use of organic or mineral fertilizers is not common in Mongolia, and the need for adding C and nutrients to the mostly deficient cropping systems was highlighted before [9]. The potential benefit of fertilizer addition was recently shown for agricultural fields in Bulgan sum center. Model simulations of the Soil and Water Assessment Tool (SWAT) revealed that an adequate application of goat manure and irrigation water potentially increase hay and crop yield up to 77% [8]. Farmers’ field size in Bulgan sum center averaged 4.0 ha for hay and 0.3 ha for crops leading to a total deficit of 6723 kg C and 122 kg N. A local farmer household owns 53 goats, 24 sheep, and 14 cattle on average, and thus have the potential to replace C and N deficits in their fields through manure, which would allocate sufficient C (7743 kg) and N (332 kg) during the non-growing season (210 days). The amounts of C and N were estimated under the conservative assumption of a production of 0.274 kg DM manure day−1 per goat, 0.318 kg DM manure day−1 per sheep, and 4.5 kg DM manure day−1 per cattle, with respective C and N concentrations of 44.9% and 1.7% for a goat, 42.7% and 1.8% for a sheep, and 43% and 1.9% for a cattle [56]. However, an efficient storage and handling of manure [9] and a cost-effective transportation of manure [57] would be required to leverage this potential, since the livestock of the settled households is usually herded externally by the transhumant pastoralists, whose movements between seasonal pastures can amount to about 244 km (cattle) and 412 km (small ruminants) [31].
Besides the application of organic fertilizer, the input of C and N through fodder legumes such as alfalfa may be an option to reduce gaps in hay (1606 kg C ha−1 season−1; 27 kg N ha−1 season−1) and crop fields (1246 kg C ha−1 season−1; 52 kg N ha−1 season−1). Alfalfa cultivated in monoculture under dry climate conditions was reportedly able to sequester about 560 kg C ha−1 a−1 and about 25 kg N ha−1 a−1 in an oasis of Gansu province, northwest China [58]. Under semi-arid climate conditions, about 190 kg C ha−1 a−1 and 45 kg N ha−1 a−1 were accumulated in a long-term experiment in the Shaanxi province, China [59]. Even more N (up to 29%) could be fixed to soil by alfalfa if the legume is cultivated in combination with grasses [60]. Under semi-arid and continental climate conditions, it was shown that intercropping of alfalfa and rye could result in higher fodder and degradable nutrient yields [61]. Moderate N fertilizer rates (75 kg ha−1) may increase the quality and yield of grass-alfalfa systems [62], and would be recommendable in Bulgan sum center to fully close the C and N gaps and sustain soil fertility in the long-term. In addition to the improvement of soil fertility, alfalfa could improve the nutritive value of fodder due to its high-digestibility energy and protein content [63].
The reduction of soil gaseous losses through modifications in agricultural management practices is of major significance to preserve the benefit of additional inputs and increase the use efficiency of C and N. Surface-applied manure should be avoided. The incorporation of manure below the soil surface promptly after application is a relatively straightforward and inexpensive alternative to reduce gaseous losses of NH3–N and N2O–N [64], whereby a depth of more than 0.05 cm and cool climatic conditions are recommendable [53,65]. The incorporation additionally protects manure against wind erosion and washing away during flood irrigation. Continuously manure applications can increase the SOC stock and form stable macroaggregates in the long-term [66], which may cause positive effects in terms of water infiltration and water-holding capacity [67], nutrient retention [68], and resilience to wind erosion [69]. However, the risk of increased N2O–N emissions after C additions through manure applications is still under discussion [70].
Opportunities to reduce C and N losses through changes in irrigation management are limited in the Bulgan sum center. The amounts of irrigation water used per season (66 mm for hay, 195 mm for rye, and 276 mm for carrot) and per irrigation event (8 mm for hay, and 16 mm for carrot and rye) were low, and current irrigation practices yield high water-use efficiency for crop production [8]. The high frequency of less surface water application is not likely to significantly increase CO2–C emission from soil, as shown for semi-arid steppe soils in Mongolia [71]. Likewise, N2O–N losses may not increase substantially, as reported for an irrigation experiment in New South Wales, Australia with similar soil and climate conditions. The experiment indicated almost no change in N2O–N emission rates at an irrigation level of 30 mm per event, even after urea application [72]. The common irrigation rates in the river oasis likely do not trigger the substantial volatilization of NH3–N. During an irrigation experiment of a loamy cereal field with different irrigation rates and surface applied urea in Oregon, United States (USA), a reduction of NH3–N losses of 80% of the total N was observed at an application rate of 10.3 mm, and even 95% of total N losses were observed at 19.2 mm [73]. The often promoted technique of drip irrigation may lower water consumption, but seems to increase CO2–C emissions compared to flood irrigation [74].

5. Conclusions

Although CO2–C, NH3–N, and N2O–N fluxes from the floodplain soils of the river oasis Bulgan sum center seem to be a substantial pathway for losing C and N in relation to total input and output fluxes, flux rates and cumulative losses were relatively low compared to other agroecosystems. The low fertilizing and irrigation activities did not trigger excessive gaseous losses. Differences in emission rates and cumulative losses between carrot, hay, and rye plots can be attributed to differences either in root development in the case of C or in irrigation management and microclimatic conditions in the case of N. Partial C and N balances were negative for all crops. While a change in irrigation management seems to be rather ineffective, fertilizing activities need to be intensified to reduce disequilibria in C and N input and output flows. Additionally, fertilizing should be optimized through the incorporation of manure into the soil to minimize gaseous C and N emissions. The cultivation of alfalfa might be advisable too, not only to allocate additional N to soil, but also to improve the nutritive value of fodder. Recommended or similar measures seem to be indispensable to sustain soil fertility and thus the livelihood of agro-pastoral households in the floodplain of Bulgan sum center. However, further in-depth studies on the timing and form of input applications are necessary to assess the impact of these recommendations.

Author Contributions

All authors were involved in the conceptualization of the study. G.J. and B.U. collected data and conducted lab work. G.J. and S.G.-J. analyzed data and formatted figures and tables. The text was written by G.J. and S.G.-J. and reviewed by S.G.-J. and A.B. who designed the study.

Funding

This research was funded by the International Fund for Agricultural Development IFAD, Rome, Italy (I-R-1284). Additionally, the first author was supported by a personal scholarship of the Deutscher Akademischer Austauschdienst (DAAD), Bonn, Germany.

Acknowledgments

This research was part of the WATERCOPE project. We are thankful to the farmers of Bulgan sum center for their great hospitality, unlimited patience and dedicated support. Special thanks go to Andrea Mock for her great support of data preparation. We would like to thank Nergui Soninkishig (National University of Mongolia), Nyambayar Dashzeveg (National University of Mongolia) and Togtokhbayar Norovsambuu (Mongolian University of Life Sciences) for their tireless commitment to overcome administrative and logistic challenges.

Conflicts of Interest

The authors declare no conflict of interest.

References

  1. Bruelheide, H.; Jandt, U.; Gries, D.; Thomas, F.M.; Foetzki, A.; Buerkert, A.; Gang, W.; Zhang, X.M.; Runge, M. Vegetation changes in a river oasis on the southern rim of the Taklamakan Desert in China between 1956 and 2000. Phytocoenologia 2003, 33, 801–818. [Google Scholar] [CrossRef]
  2. Liu, Y.; Chen, Y. Impact of population growth and land-use change on water resources and ecosystems of the arid Tarim River Basin in Western China. Int. J. Sustain. Dev. World Ecol. 2006, 13, 295–305. [Google Scholar] [CrossRef]
  3. Feike, T.; Mamitimin, Y.; Li, L.; Doluschitz, R. Development of agricultural land and water use and its driving forces along the Aksu and Tarim River, P.R. China. Environ. Earth Sci. 2015, 73, 517–531. [Google Scholar] [CrossRef]
  4. Wang, J.; Gao, Y.; Wang, S. Land use/cover change impacts on water table change over 25 Years in a desert-oasis transition zone of the Heihe River Basin, China. Water 2016, 8, 11. [Google Scholar] [CrossRef]
  5. Dittrich, A.; Buerkert, A.; Brinkmann, K. Assessment of land use and land cover changes during the last 50 years in oases and surrounding rangelands of Xinjiang, NW China. J. Agric. Rural Dev. Trop. 2010, 111, 129–142. [Google Scholar]
  6. Lai, H.H. China’s Western Development Program. Mod. China 2016, 28, 432–466. [Google Scholar] [CrossRef]
  7. Becquelin, N. Xinjiang in the Nineties. China J. 2000, 44, 65–90. [Google Scholar] [CrossRef]
  8. Jordan, G.; Goenster-Jordan, S.; Lamparter, G.-J.; Ulziisuren, B.; Soninkishig, N.; Schlecht, E.; Buerkert, A. Water use in agro-pastoral livelihood systems within the Bulgan River watershed of the Altay Mountains, Western Mongolia. Agric. Ecosyst. Environ. 2018, 251, 180–193. [Google Scholar] [CrossRef]
  9. Hofmann, J.; Tuul, D.; Enkhtuya, B. Agriculture in Mongolia under pressure of agronomic nutrient imbalances and food security demands: A case study of stakeholder participation for future nutrient and water resource management. In Integrated Water Resources Management: Concept, Research and Implementation; Borchardt, D., Bogardi, J.J., Ibisch, R.B., Eds.; Springer International Publishing: Cham, Switzerland, 2016; pp. 471–514. [Google Scholar]
  10. Predotova, M.; Gebauer, J.; Diogo, R.V.C.; Schlecht, E.; Buerkert, A. Emissions of ammonia, nitrous oxide and carbon dioxide from urban gardens in Niamey, Niger. Field Crops Res. 2010, 115, 1–8. [Google Scholar] [CrossRef]
  11. Siegfried, K.; Dietz, H.; Schlecht, E.; Buerkert, A. Nutrient and carbon balances in organic vegetable production on an irrigated, sandy soil in northern Oman. J. Plant Nutr. Soil Sci. 2011, 174, 678–689. [Google Scholar] [CrossRef]
  12. Goenster, S.; Wiehle, M.; Gebauer, J.; Ali, A.M.; Buerkert, A. Carbon and nutrient fluxes and balances in Nuba Mountains homegardens, Sudan. Nutr. Cycl. Agroecosyst. 2013, 100, 35–51. [Google Scholar] [CrossRef]
  13. Velthof, G.L.; Oenema, O. Nitrous oxide fluxes from grassland in the Netherlands: I. Statistical analysis of flux-chamber measurements. Eur. J. Soil Sci. 1995, 46, 533–540. [Google Scholar] [CrossRef]
  14. Davidson, E.A.; Savage, K.; Verchot, L.V.; Navarro, R. Minimizing artifacts and biases in chamber-based measurements of soil respiration. Agric. For. Meteorol. 2002, 113, 21–37. [Google Scholar] [CrossRef]
  15. Oertel, C.; Matschullat, J.; Zurba, K.; Zimmermann, F.; Erasmi, S. Greenhouse gas emissions from soils—A review. Chem. Erde Geochem. 2016, 76, 327–352. [Google Scholar] [CrossRef]
  16. Goenster-Jordan, S.; Jannoura, R.; Jordan, G.; Buerkert, A.; Joergensen, R.G. Spatial variability of soil properties in the floodplain of a river oasis in the Mongolian Altay Mountains. Geoderma 2018, 330, 99–106. [Google Scholar] [CrossRef]
  17. Christensen, J. Optical filters and their use with the type 1302 & type 1306 photoacoustic gas monitors. Brüel Kjær Tech. Rev. 1990, 2, 1–50. [Google Scholar]
  18. Christensen, J. The Brüel & Kjær photoacoustic transducer system and its physical properties. Brüel Kjær Tech. Rev. 1990, 1, 1–39. [Google Scholar]
  19. Debouk, H.; Altimir, N.; Sebastià, M.-T. Maximizing the information obtained from chamber-based greenhouse gas exchange measurements in remote areas. MethodsX 2018, 5, 973–983. [Google Scholar] [CrossRef]
  20. Goenster, S.; Wiehle, M.; Predotova, M.; Gebauer, J.; Ali, A.M.; Buerkert, A. Gaseous emissions and soil fertility of homegardens in the Nuba Mountains, Sudan. J. Plant Nutr. Soil Sci. 2015, 178, 413–424. [Google Scholar] [CrossRef]
  21. Buerkert, A.; Jahn, H.; Golombek, S.D.; Al Rawahi, M.N.; Gebauer, J. Carbon and nitrogen emissions from stored manure and cropped fields in irrigated mountain oases of Oman. J. Agric. Rural Dev. Trop. 2010, 111, 55–63. [Google Scholar]
  22. Iqbal, J.; Castellano, M.J.; Parkin, T.B. Evaluation of photoacoustic infrared spectroscopy for simultaneous measurement of N2O and CO2 gas concentrations and fluxes at the soil surface. Glob. Chang. Biol. 2013, 19, 327–336. [Google Scholar] [CrossRef] [PubMed]
  23. Rosenstock, T.S.; Diaz-Pines, E.; Zuazo, P.; Jordan, G.; Predotova, M.; Mutuo, P.; Abwanda, S.; Thiong’o, M.; Buerkert, A.; Rufino, M.C.; et al. Accuracy and precision of photoacoustic spectroscopy not guaranteed. Glob. Chang. Biol. 2013, 19, 3565–3567. [Google Scholar] [CrossRef] [PubMed]
  24. Cobo, J.G.; Dercon, G.; Cadisch, G. Nutrient balances in African land use systems across different spatial scales: A review of approaches, challenges and progress. Agric. Ecosyst. Environ. 2010, 136, 1–15. [Google Scholar] [CrossRef]
  25. Smaling, E.M.A.; Stoorvogel, J.J.; Windmeijer, P.N. Calculating soil nutrient balances in Africa at different scales—II. District Scale. Fert. Res. 1993, 35, 237–250. [Google Scholar] [CrossRef]
  26. Stoorvogel, J.J.; Smaling, E.M.A.; Janssen, B.H. Calculating soil nutrient balances in Africa at different scales—I. Supra-national scale. Fert. Res. 1993, 35, 227–235. [Google Scholar] [CrossRef]
  27. Abdalla, S.B.; Predotova, M.; Gebauer, J.; Buerkert, A. Horizontal nutrient flows and balances in irrigated urban gardens of Khartoum, Sudan. Nutr. Cycl. Agroecosyst. 2012, 92, 119–132. [Google Scholar] [CrossRef]
  28. Diogo, R.V.C.; Buerkert, A.; Schlecht, E. Horizontal nutrient fluxes and food safety in urban and peri-urban vegetable and millet cultivation of Niamey, Niger. Nutr. Cycl. Agroecosyst. 2010, 87, 81–102. [Google Scholar] [CrossRef]
  29. Safi, Z.; Predotova, M.; Schlecht, E.; Buerkert, A. Horizontal matter fluxes and leaching losses in urban and peri-urban agriculture of Kabul, Afghanistan. J. Plant Nutr. Soil Sci. 2011, 174, 942–951. [Google Scholar] [CrossRef]
  30. Goenster, S.; Gründler, C.; Buerkert, A.; Joergensen, R.G. Soil microbial indicators across land use types in the river oasis Bulgan sum center, Western Mongolia. Ecol. Indic. 2017, 76, 111–118. [Google Scholar] [CrossRef]
  31. Jordan, G.; Goenster, S.; Munkhnasan, T.; Shabier, A.; Buerkert, A.; Schlecht, E. Spatio-temporal patterns of herbage availability and livestock movements: A cross-border analysis in the Chinese-Mongolian Altay. Pastoralism 2016, 6, 1–17. [Google Scholar] [CrossRef]
  32. Tsvegemed, M.; Shabier, A.; Schlecht, E.; Jordan, G.; Wiehle, M. Evolution of rural livelihood strategies in a remote Sino-Mongolian border area: A cross-country analysis. Sustainability 2018, 10, 1011. [Google Scholar] [CrossRef]
  33. Hutchinson, G.L.; Livingston, G.P. Vents and seals in non-steady-state chambers used for measuring gas exchange between soil and the atmosphere. Eur. J. Soil Sci. 2001, 52, 675–682. [Google Scholar] [CrossRef]
  34. Rochette, P.; Ellert, B.; Gregorich, E.G.; Desjardins, R.L.; Pattey, E.; Lessard, R.; Johnson, B.G. Description of a dynamic closed chamber for measuring soil respiration and its comparison with other techniques. Can. J. Soil Sci. 1997, 77, 195–203. [Google Scholar] [CrossRef]
  35. Thomson, P.E.; Parker, J.P.; Arah, J.R.M.; Clayton, H.; Smith, K.A. Automated soil monolith-flux chamber system for the study of trace gas fluxes. Soil Sci. Soc. Am. J. 1997, 61, 1323–1330. [Google Scholar] [CrossRef]
  36. Robertson, G.P.; Groffman, P.M. Nitrogen transformations. In Soil Microbiology, Ecology, and Biochemistry, 3rd ed.; Paul, E.A., Ed.; Academic Press: Oxford, UK, 2007; pp. 341–364. [Google Scholar]
  37. Šimek, M.; Brůček, P.; Hynšt, J. Diurnal fluxes of CO2 and N2O from cattle-impacted soil and implications for emission estimates. Plant Soil Environ. 2010, 56, 451–457. [Google Scholar] [CrossRef]
  38. Conen, F.; Smith, K.A. An explanation of linear increases in gas concentration under closed chambers used to measure gas exchange between soil and the atmosphere. Eur. J. Soil Sci. 2000, 51, 111–117. [Google Scholar] [CrossRef]
  39. Jordan, G.; Predotova, M.; Ingold, M.; Goenster, S.; Dietz, H.; Joergensen, R.G.; Buerkert, A. Effects of activated charcoal and tannin added to compost and to soil on carbon dioxide, nitrous oxide and ammonia volatilization. J. Plant Nutr. Soil Sci. 2015, 178, 218–228. [Google Scholar] [CrossRef]
  40. Sangare, S.K.; Compaore, E.; Buerkert, A.; Vanclooster, M.; Sedogo, M.P.; Bielders, C.L. Field-scale analysis of water and nutrient use efficiency for vegetable production in a West African urban agricultural system. Nutr. Cycl. Agroecosyst. 2012, 92, 207–224. [Google Scholar] [CrossRef]
  41. Lv, J.; Buerkert, A.; Benedict, K.B.; Liu, G.; Lv, C.; Liu, X. Comparison of nitrogen deposition across different land use types in agro-pastoral catchments of western China and Mongolia. Atmos. Environ. 2019, 199, 313–322. [Google Scholar] [CrossRef]
  42. Siegfried, K.; Dietz, H.; Amthauer Gallardo, D.; Schlecht, E.; Buerkert, A. Effects of manure with different C/N ratios on yields, yield components and matter balances of organically grown vegetables on a sandy soil of northern Oman. Org. Agric. 2013, 3, 9–12. [Google Scholar] [CrossRef]
  43. Ludwig, J.; Meixner, F.X.; Vogel, B.; Förstner, J. Soil-air exchange of nitric oxide: An overview of processes, environmental factors, and modeling studies. Biogeochemistry 2001, 52, 225–257. [Google Scholar] [CrossRef]
  44. Qi, Y.; Xu, M. Separating the effects of moisture and temperature on soil CO2 efflux in a coniferous forest in the Sierra Nevada mountains. Plant Soil 2001, 237, 15–23. [Google Scholar] [CrossRef]
  45. Shao, C.; Chen, J.; Chu, H.; Lafortezza, R.; Dong, G.; Abraha, M.; Batkhishig, O.; John, R.; Ouyang, Z.; Zhang, Y.; et al. Grassland productivity and carbon sequestration in Mongolian grasslands: The underlying mechanisms and nomadic implications. Environ. Res. 2017, 159, 124–134. [Google Scholar] [CrossRef] [PubMed]
  46. Moyano, F.E.; Atkin, O.K.; Bahn, M.; Bruhn, D.; Burton, A.J.; Heinemeyer, A.; Kutsch, W.L.; Wieser, G. Respiration from roots and the mycorrhizosphere. In Soil Carbon Dynamics: An Integrated Methodology; Heinemeyer, A., Bahn, M., Kutsch, W., Eds.; Cambridge University Press: Cambridge, UK, 2009; pp. 127–156. [Google Scholar]
  47. Raich, J.W.; Schlesinger, W.H. The global carbon dioxide flux in soil respiration and its relationship to vegetation and climate. Tellus B 1992, 44, 81–99. [Google Scholar] [CrossRef] [Green Version]
  48. Hanson, P.J.; Edwards, N.T.; Garten, C.T.; Andrews, J.A. Separating root and soil microbial contributions to soil respiration: A review of methods and observations. Biogeochemistry 2000, 48, 115–146. [Google Scholar] [CrossRef]
  49. Ceccon, C.; Tagliavini, M.; Schmitt, A.O.; Eissenstat, D.M. Untangling the effects of root age and tissue nitrogen on root respiration in Populus tremuloides at different nitrogen supply. Tree Physiol. 2016, 36, 618–627. [Google Scholar] [CrossRef] [PubMed]
  50. Kuzyakov, Y.; Cheng, W. Photosynthesis controls of rhizosphere respiration and organic matter decomposition. Soil Biol. Biochem. 2001, 33, 1915–1925. [Google Scholar] [CrossRef]
  51. Schindlbacher, A. Effects of soil moisture and temperature on NO, NO2, and N2O emissions from European forest soils. J. Geophys. Res. 2004, 109, 1137. [Google Scholar] [CrossRef]
  52. Cameron, K.C.; Di, H.J.; Moir, J.L. Nitrogen losses from the soil/plant system: A review. Ann. Appl. Biol. 2013, 162, 145–173. [Google Scholar] [CrossRef]
  53. Mkhabela, M.S.; Gordon, R.; Burton, D.; Smith, E.; Madani, A. The impact of management practices and meteorological conditions on ammonia and nitrous oxide emissions following application of hog slurry to forage grass in Nova Scotia. Agric. Ecosyst. Environ. 2009, 130, 41–49. [Google Scholar] [CrossRef]
  54. Brooks, P.D.; Schmidt, S.K.; Williams, M.W. Winter production of CO2 and N2O from alpine tundra: Environmental controls and relationship to inter-system C and N fluxes. Oecologia 1997, 110, 403–413. [Google Scholar] [CrossRef] [PubMed]
  55. Harrison, R.; Webb, J. A review of the effect of N fertilizer type on gaseous emissions. Adv. Agron. 2001, 73, 65–108. [Google Scholar] [CrossRef]
  56. Tsevegmed, M. Herd Management and Livestock Productivity in the Altai Region of Western Mongolia. Ph.D. Thesis, University of Kassel, Witzenhausen, Germany, 2016. [Google Scholar]
  57. Jones, D.L.; Cross, P.; Withers, P.J.A.; DeLuca, T.H.; Robinson, D.A.; Quilliam, R.S.; Harris, I.M.; Chadwick, D.R.; Edwards-Jones, G.; Kardol, P. Nutrient stripping: The global disparity between food security and soil nutrient stocks. J. Appl. Ecol. 2013, 50, 851–862. [Google Scholar] [CrossRef]
  58. Su, Y.Z. Soil carbon and nitrogen sequestration following the conversion of cropland to alfalfa forage land in northwest China. Soil Tillage Res. 2007, 92, 181–189. [Google Scholar] [CrossRef]
  59. Zhou, Z.; Zhang, X.; Gan, Z. Changes in soil organic carbon and nitrogen after 26 years of farmland management on the Loess Plateau of China. J. Arid Land 2015, 7, 806–813. [Google Scholar] [CrossRef] [Green Version]
  60. Burity, H.A.; Ta, T.C.; Faris, M.A.; Coulman, B.E. Estimation of nitrogen fixation and transfer from alfalfa to associated grasses in mixed swards under field conditions. Plant Soil 1989, 114, 249–255. [Google Scholar] [CrossRef]
  61. Zhang, J.; Yin, B.; Xie, Y.; Li, J.; Yang, Z.; Zhang, G. Legume-cereal intercropping improves forage yield, quality and degradability. PLoS ONE 2015, 10, e0144813. [Google Scholar] [CrossRef] [PubMed]
  62. Xie, K.-Y.; Li, X.-L.; He, F.; Zhang, Y.-J.; Wan, L.-Q.; David, B.H.; Wang, D.; Qin, Y.; Gamal, M.A.F. Effect of nitrogen fertilization on yield, N content, and nitrogen fixation of alfalfa and smooth bromegrass grown alone or in mixture in greenhouse pots. J. Integr. Agric. 2015, 14, 1864–1876. [Google Scholar] [CrossRef]
  63. Higginbotham, G.E.; Stull, C.L.; Peterson, N.G.; Rodiek, A.V.; Reed, B.A.; Guerrero, J.N. Alfalfa utilization by livestock. In Irrigated Alfalfa Management in Mediterranean and Desert Zones; Summers, C.G., Putnam, D.H., Eds.; University of California: Oakland, CA, USA, 2008. [Google Scholar]
  64. Sommer, S.G.; Hutchings, N.J. Ammonia emission from field applied manure and its reduction—Invited paper. Eur. J. Agron. 2001, 15, 1–15. [Google Scholar] [CrossRef]
  65. Webb, J.; Pain, B.; Bittman, S.; Morgan, J. The impacts of manure application methods on emissions of ammonia, nitrous oxide and on crop response—A review. Agric. Ecosyst. Environ. 2010, 137, 39–46. [Google Scholar] [CrossRef]
  66. Su, Y.-Z.; Wang, F.; Suo, D.-R.; Zhang, Z.-H.; Du, M.-W. Long-term effect of fertilizer and manure application on soil-carbon sequestration and soil fertility under the wheat–wheat–maize cropping system in northwest China. Nutr. Cycl. Agroecosyst. 2006, 75, 285–295. [Google Scholar] [CrossRef]
  67. Kay, B.D. Soil structure and organic carbon: A review. In Soil Processes and the Carbon Cycle; Lal, R., Kimble, J.M., Follett, R.F., Stewart, B.A., Eds.; CRC Press: Boca Raton, FL, USA, 2018; pp. 169–197. [Google Scholar]
  68. Jiao, Y.; Whalen, J.K.; Hendershot, W.H. No-tillage and manure applications increase aggregation and improve nutrient retention in a sandy-loam soil. Geoderma 2006, 134, 24–33. [Google Scholar] [CrossRef]
  69. Biyensa, G.; Demissie, A.; Lemma, B. Susceptibility of soil to wind erosion in arid area of the Central Rift Valley of Ethiopia. Environ. Syst. Res. 2015, 4, 10. [Google Scholar] [CrossRef]
  70. Zhou, M.; Zhu, B.; Wang, S.; Zhu, X.; Vereecken, H.; Brüggemann, N. Stimulation of N2O emission by manure application to agricultural soils may largely offset carbon benefits: A global meta-analysis. Glob. Chang. Biol. 2017, 23, 4068–4083. [Google Scholar] [CrossRef] [PubMed]
  71. Mariko, S.; Urano, T.; Asanuma, J. Effects of irrigation on CO2 and CH4 fluxes from Mongolian steppe soil. J. Hydrol. 2007, 333, 118–123. [Google Scholar] [CrossRef]
  72. Jamali, H.; Quayle, W.C.; Baldock, J. Reducing nitrous oxide emissions and nitrogen leaching losses from irrigated arable cropping in Australia through optimized irrigation scheduling. Agric. For. Meteorol. 2015, 208, 32–39. [Google Scholar] [CrossRef]
  73. Holcomb, J.C.; Sullivan, D.M.; Horneck, D.A.; Clough, G.H. Effect of irrigation rate on ammonia volatilization. Soil Sci. Soc. Am. J. 2011, 75, 2341. [Google Scholar] [CrossRef]
  74. Guo, S.; Qi, Y.; Peng, Q.; Dong, Y.; He, Y.; Yan, Z.; Wang, L. Influences of drip and flood irrigation on soil carbon dioxide emission and soil carbon sequestration of maize cropland in the North China Plain. J. Arid Land 2017, 9, 222–233. [Google Scholar] [CrossRef] [Green Version]
Figure 1. Location of the study area within Mongolia (right) and a detailed land-cover map of the river oasis of Bulgan sum center (2013), which includes the location of the study farms (left); modified map based on [8].
Sustainability 11 03362 g001
Figure 2. Soil gaseous emission rates of CO2–C (A), NH3–N (B), and N2O–N (C) from carrot, hay, and rye fields of small-scale farms in the river oasis of Bulgan sum center, Western Mongolia during the growing season 2013/2014. Each data point represents the arithmetic mean; error bars show ± one standard error (n = 12).
Sustainability 11 03362 g002
Figure 3. Seasonal (June to September) cumulative soil gaseous CO2–C (A) and NH3–N and N2O–N (B) emissions from carrot, hay, and rye fields of small-scale farms in the river oasis Bulgan sum center, Western Mongolia (2013/2014, n = 12, error bars show ± one standard error). Different small letters indicate a significant difference for NH3–N losses (p < 0.05; Holm–Sidak test) and for N2O–N losses (p < 0.05; Tukey test). Different capital letters indicate a significant difference for total N losses (p < 0.05; Tukey test).
Sustainability 11 03362 g003
Table 1. Selected physical and chemical soil properties of carrot, hay, and rye fields of small-scale farms in the river oasis Bulgan sum center, Western Mongolia (2013/2014).
Sustainability 11 03362 i001
Table 2. Spearman’s rank correlation coefficients of linear relationships between soil gaseous emission rates (CO2–C, N2O–N, and NH3–N in g h−1 ha−1) and soil water-filled pore space (WFPS in %, n = 380), soil temperature in 0.05-m depth (SoilTemp in °C, n = 432), relative air humidity (AirHumidity in %, n = 446), and air temperature (AirTemp in °C, n = 447) of small-scale farms in the river oasis Bulgan sum center, Western Mongolia in 2013/2014.
Sustainability 11 03362 i002
Table 3. Carbon (C) input fluxes, C output fluxes, and partial C balances for carrot, hay, and rye fields of small-scale farms in the river oasis of Bulgan sum center, Western Mongolia (2013/2014). The fluxes comprise C input through manure (Fertilizer), flood irrigation (Irrigation), C assimilation by plants (C-fixation), and atmospheric wet and dry deposition (Deposition), and C output through harvest and weeding (Biomass) and soil gaseous emission of CO2–C (Emission).
Sustainability 11 03362 i003
Table 4. Nitrogen (N) input fluxes, N output fluxes, and partial N balances for carrot, hay, and rye fields of small-scale farms in the river oasis of Bulgan sum center, Western Mongolia (2013/2014). The fluxes comprise N input through manure (Fertilizer), flood irrigation (Irrigation), biological N fixation (N–fixation), atmospheric wet and dry deposition (Deposition), sowing (Seeds), and N output through harvest and weeding (Biomass) and soil gaseous emission of NH3–N and N2O–N (Emission).
Sustainability 11 03362 i004

