Evaluation Model for Investment in Solar Photovoltaic Power Generation Using Fuzzy Analytic Hierarchy Process


1
Department of Earth Resources and Environmental Engineering, Hanyang University, Seoul 04763, Korea
2
Transaction Advisory Services, Ernst & Young Han Young, Seoul 07241, Korea
*
Author to whom correspondence should be addressed.
†
These authors contributed equally to this work and should be regarded as co-first authors.
Sustainability 2019, 11(10), 2905; https://doi.org/10.3390/su11102905
Submission received: 30 April 2019
/
Revised: 16 May 2019
/
Accepted: 19 May 2019
/
Published: 22 May 2019
(This article belongs to the Section Economic and Business Aspects of Sustainability)
Abstract
:Owing to rapid growth in the Asian solar photovoltaic (PV) power market, decision-making models are required to develop efficient investment strategies. Previous studies have largely focused on technological conditions and macroeconomic indicators, but not on the increasing needs of the financial sector. In this study, we developed an evaluation model of solar PV investment and financial factors at the project level. The model applies the fuzzy analytic hierarchy process and selects appropriate evaluation indicators for investment by emphasizing financial factors such as access to finance and exit strategies after the initial investment. Furthermore, we derived the relative importance of the indicators for each stakeholder. Stakeholder analysis enables comparison by quantifying the risks of each market participant. Economic factors (71.57%) were selected as the most important evaluation factors, followed by policy factors (16.26%), and technical factors (12.17%). Higher weights were assigned to indicators that directly affect profitability. Stakeholders showed significant differences in policy factors. Power generation companies showed higher weight values in policy factors than other groups. Quantification of differences in perceptions provides basic data for establishing effective investment strategies and developing policies. Therefore, the proposed model will contribute to more efficient solar PV project development.
1. Introduction
Solar photovoltaic (PV) power is the fastest growing renewable energy source, accounting for over 37% of the expansion of global renewable capacity between 2012 and 2017 [1]. Solar PV power is modularized better than other renewable energy sources, and can increase the grid connectivity of projects while lowering the investment critical mass of construction costs; thus it provides relatively high investment expandability [2]. According to the International Energy Agency [1], solar PV power in Asia will account for more than 50% of the increase in total renewable energy sources in the next 5 years. More than 60% of the total capacity of new solar PV facilities is expected to be installed in Asia. Policy factors in major Asian countries are forming an environment that is favorable for the expansion of solar PV power. All major Asian countries including Indonesia, Vietnam, Japan, and South Korea are promoting various support policies. China has stopped the feed-in-tariff (FIT) system but is expected to maintain the current level of solar PV expansion because of existing infrastructure investments. China’s solar PV capacity is expected to almost triple from 131 GW in 2017 to 386 GW in 2023 [1]. The expansion of solar PV in India is accelerating because of its economic attractiveness and the continued policy support. India is expected to have the third largest solar PV capacity in the world, and its capacity additions in 2018–2023 are expected to be 63 GW [1]. In South Korea, the fast expansion of solar PV power is anticipated as a response to the Renewable Energy 3020 policy of the new government [3]. Therefore, rapid growth of the solar PV market in Asia in the near future will bring many investment opportunities; the participation of financial investors (Financial investors refer to investors or investment institutions that provide investment funds for profit to businesses) in the market has already been greatly increasing. According to the Financial Times [4], the renewable energy field was the third largest sector for direct investment in 2016, amounting for USD 77.1 billion, which is 10% of total direct investments, and solar PV power has the fastest-growing capacity and investment size [1].
The growth of the solar PV market necessitates the development of a decision-making tool for efficient establishment and evaluation of investment strategies. However, previous research has mostly focused on technical aspects such as site selection [5,6,7,8,9,10,11,12,13,14,15,16,17], sustainability assessment [18,19,20,21], and solar PV technology selection [22,23,24,25]. Previous research on investment and policy aspects [26,27,28,29,30,31,32,33], feasibility study [34,35,36,37,38] and constructing investment indicators [39,40] is limited to the econometric analysis of parameters that affect the expansion of renewable power generation including solar PV. However, these studies have mainly focused on macroeconomic aspects. Consequently, their results cannot be applied to the establishment and evaluation of efficient investment strategies at the project level and pose limitations when used by financial investors for the evaluation of individual projects.
To overcome these limitations, we developed an evaluation model for investment in solar PV power at the project level and derived relative weights for each indicator. In this study, we applied structured interviews for experts in energy and power generation industries and the fuzzy analytic hierarchy process (AHP). Using expert interviews, we proposed investment evaluation indicators that should be considered for efficient investment in solar PV projects from the financial investment perspective. Fuzzy AHP can also consider the fuzziness of decision makers [41,42]. Fuzzy AHP was applied to derive weights for each indicator.
The major contributions of this study include the following:
- (1)
- An evaluation model focusing on solar PV investments at the project level was developed. Previous studies mainly focused on technology and policy factors, such as site selection, sustainability evaluation, solar PV technology selection, or macroeconomic aspects. Research on evaluation models for investment decision-making at the project level has been limited. Hence, herein, we constructed indicators appropriate for investments in solar PV power at the project level considering the financial factors and risk factors and quantified the relative importance of each indicator.
- (2)
- The indicators proposed in this paper are universally applicable to projects in various countries because they have been created through a review of previous studies and interviews with financial investors and developers who have invested in solar PV projects in various countries as well as experts in power generation companies and scholars. The indicators used in previous studies and newly considered indicators through expert interviews were categorized. Then, the appropriate indicators for the project level evaluation were selected and constructed through expert interviews. For this purpose, in this study, we constructed indicators that reflect the economic and technical common characteristics of solar PV power projects and policy factors of specific countries. Therefore, quantitative and rational evaluations are possible using the proposed evaluation model.
- (3)
- In this study, we derived the relative importance of each indicator for stakeholders (power generation companies, financial investors, and researchers). To expand the investments in efficient solar PV power, various market participants as well as the operators should be considered and their characteristics should be analyzed because each stakeholder may have a different purpose and thus possess a different investment strategy. Analyzing these differences is critical in the establishment of efficient investment strategies and the development solar PV projects. Consequently, we quantified the indicators and their relative importance among power generation companies and financial investors participating in the actual operation and investment in solar PV projects.
In this study, we constructed an investment decision-making model for solar PV investment using the fuzzy AHP. This is the first study that focuses on the solar PV investment, quantifies the differences in the perspectives of market participants, and presents their implications. The remainder of this paper is organized as follows: Section 2 describes the methodology. Section 3 describes the indicators comprising the model. Section 4 presents the evaluation results and discusses the policy implications of the results. Finally, Section 5 presents the conclusions of this study.
2. Research Methods
The AHP is a decision-making technique proposed by Saaty [43] to determine the weights of the indicators in various fields. It quantifies the qualitative factors and derives the relative importance of each constructed indicator. The methodological validity of the AHP has been proven [41]. The AHP plays an important role in solving problems in the real world [44], but it does not consider the fuzziness of decision-makers [45] and thus can produce biased results [46]. The calculation method of the AHP proposed by Saaty [43] is based on crisp judgement [47,48]. However, the preferences of every human in the real world have some uncertainty and fuzziness. Therefore, it is very challenging to quantitively evaluate the decision making process of humans [49]. The fuzzy AHP, which is a comprehensive extension of the classic AHP method, can overcome the limitations of AHP by considering the fuzziness of the decision maker [42]. The fuzzy AHP provides a more adequate explanation of the decision-making process than the traditional AHP method [41,42,50]. For this reason, we calculated the relative importance of each indicator using the fuzzy AHP.
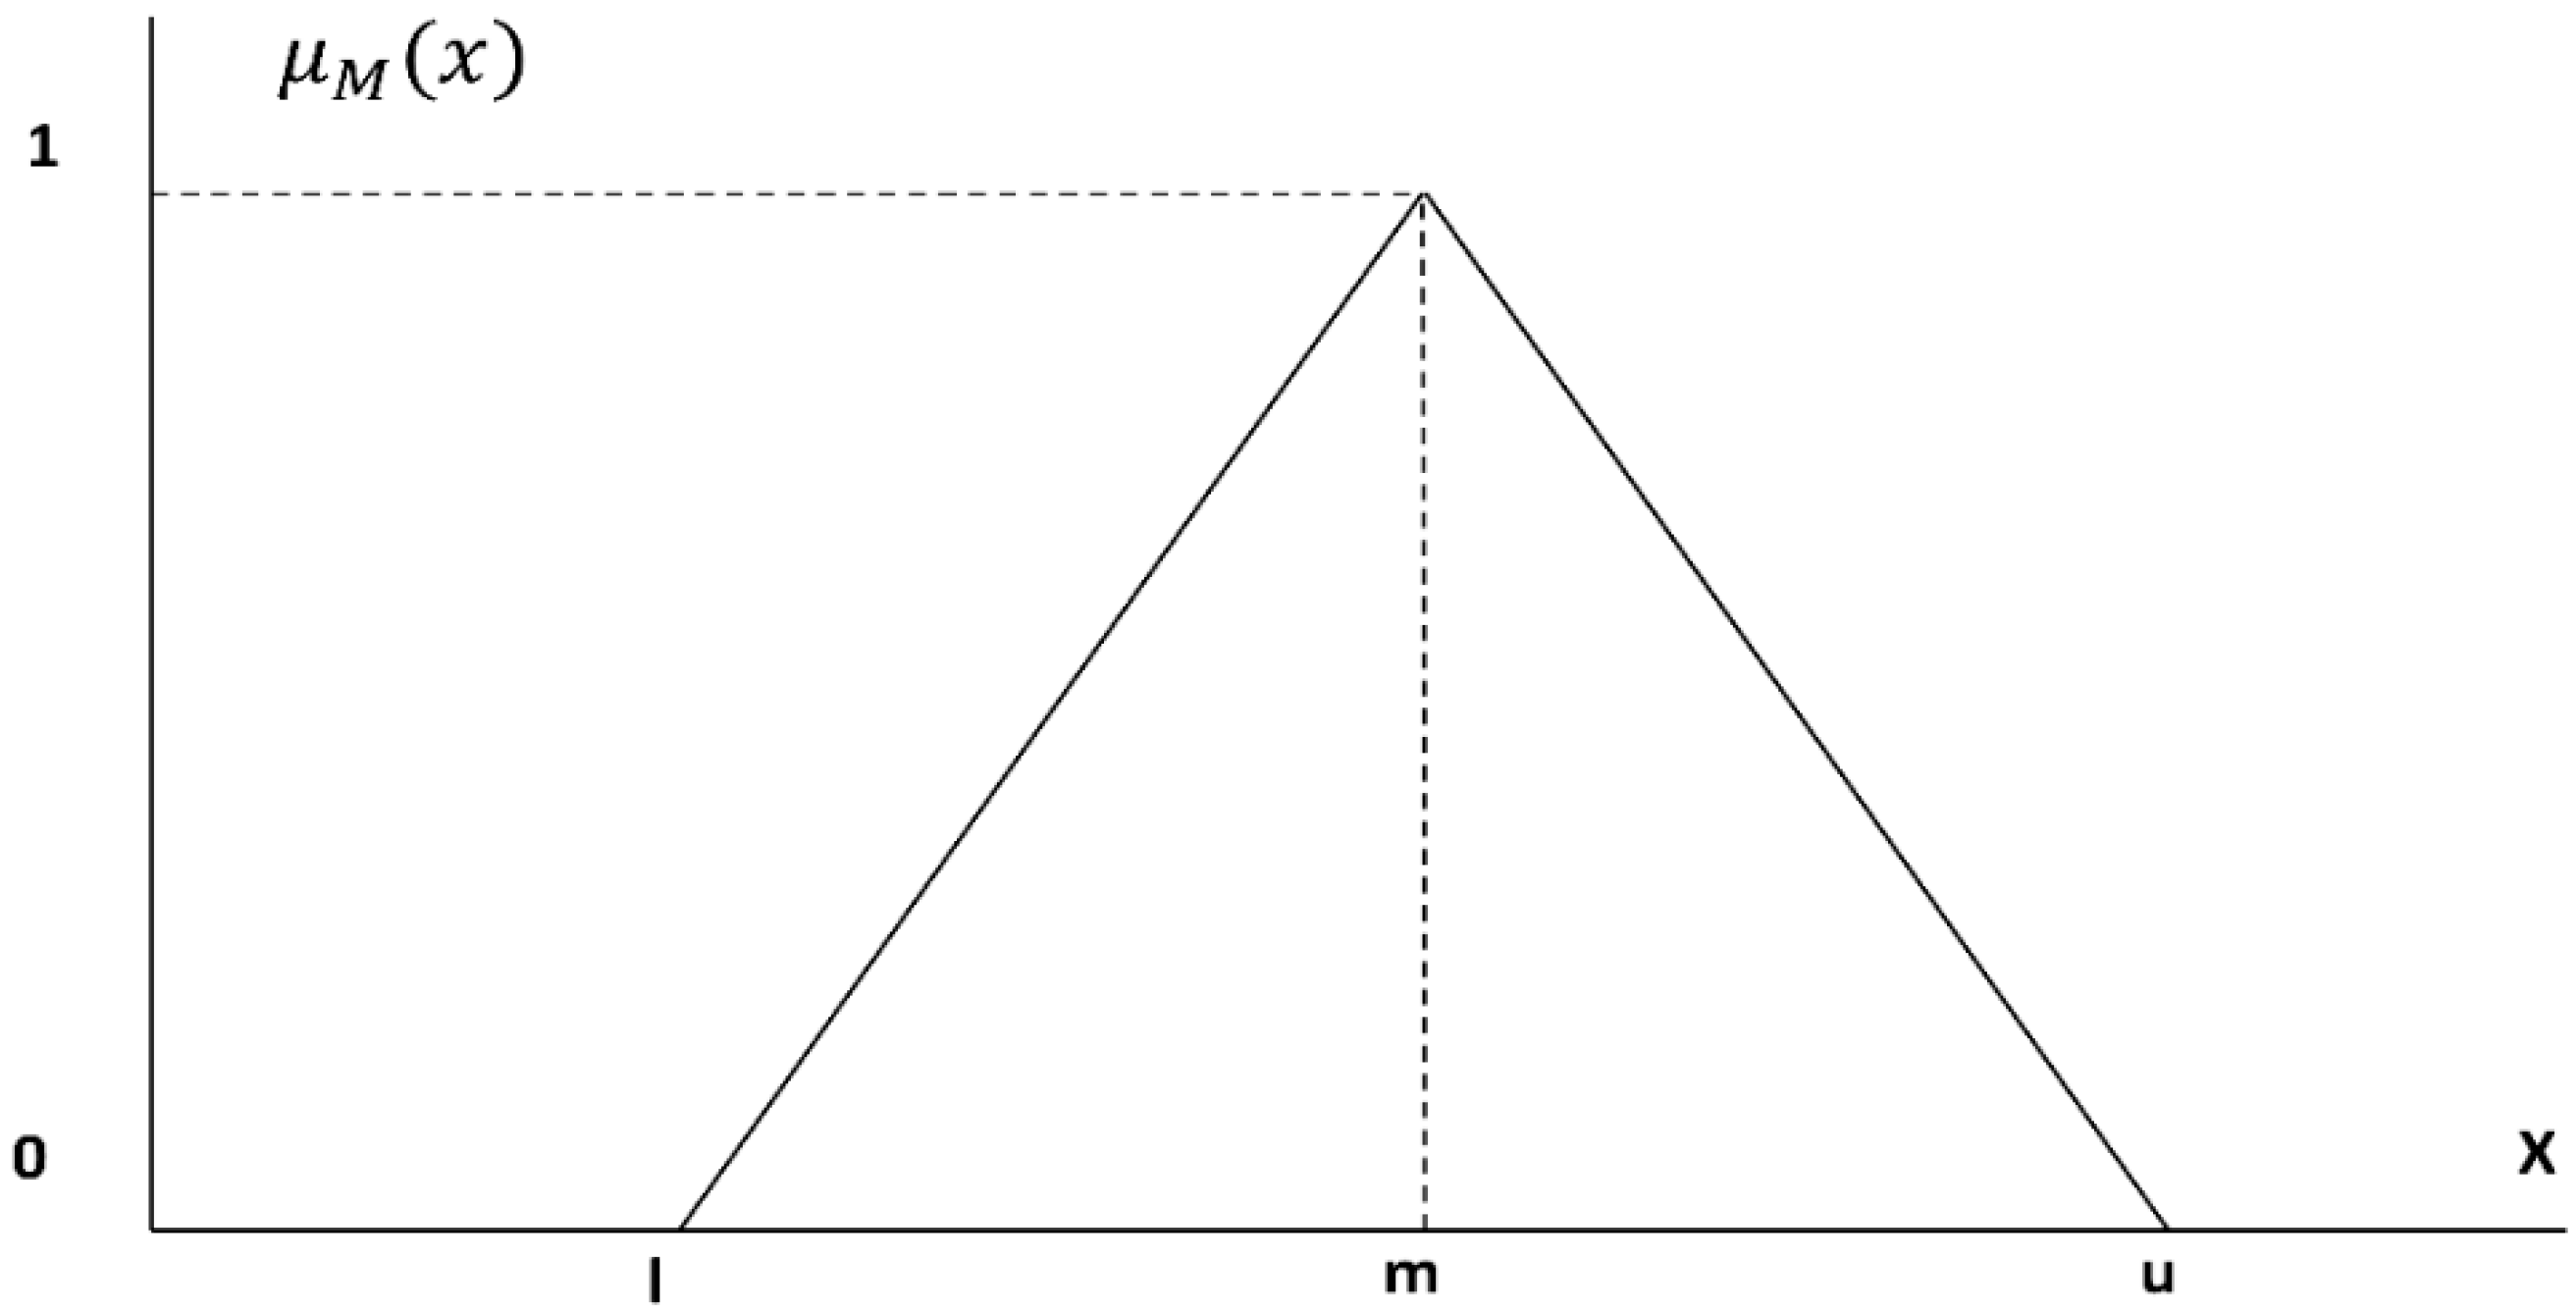
In the fuzzy AHP, the decision-maker fuzziness is expressed as a range of values, for which a triangular fuzzy number is often used. The triangular fuzzy number is composed of three values, (Figure 1). Here, and are the lower and upper limits of the membership function, and is the point where the center value of the fuzzy number , where .
The membership function of triangular fuzzy number can be defined as in Equation (1).
For the two triangular fuzzy numbers and , if and , their operations are performed as follow;
Among the various fuzzy calculation methods, we used the calculation method proposed by Chang [51] that introduced a range analysis method using a triangular fuzzy number for a pairwise comparison measure. The extended analysis of Chang [51] can be presented as follows.
Step 1: The fuzzy composite extended value for the -th element is defined in Equation (6).
Here, is defined as Equation (7).
where, is defined in Equation (8).
Here, is calculated by the inverse number of Equation (9).
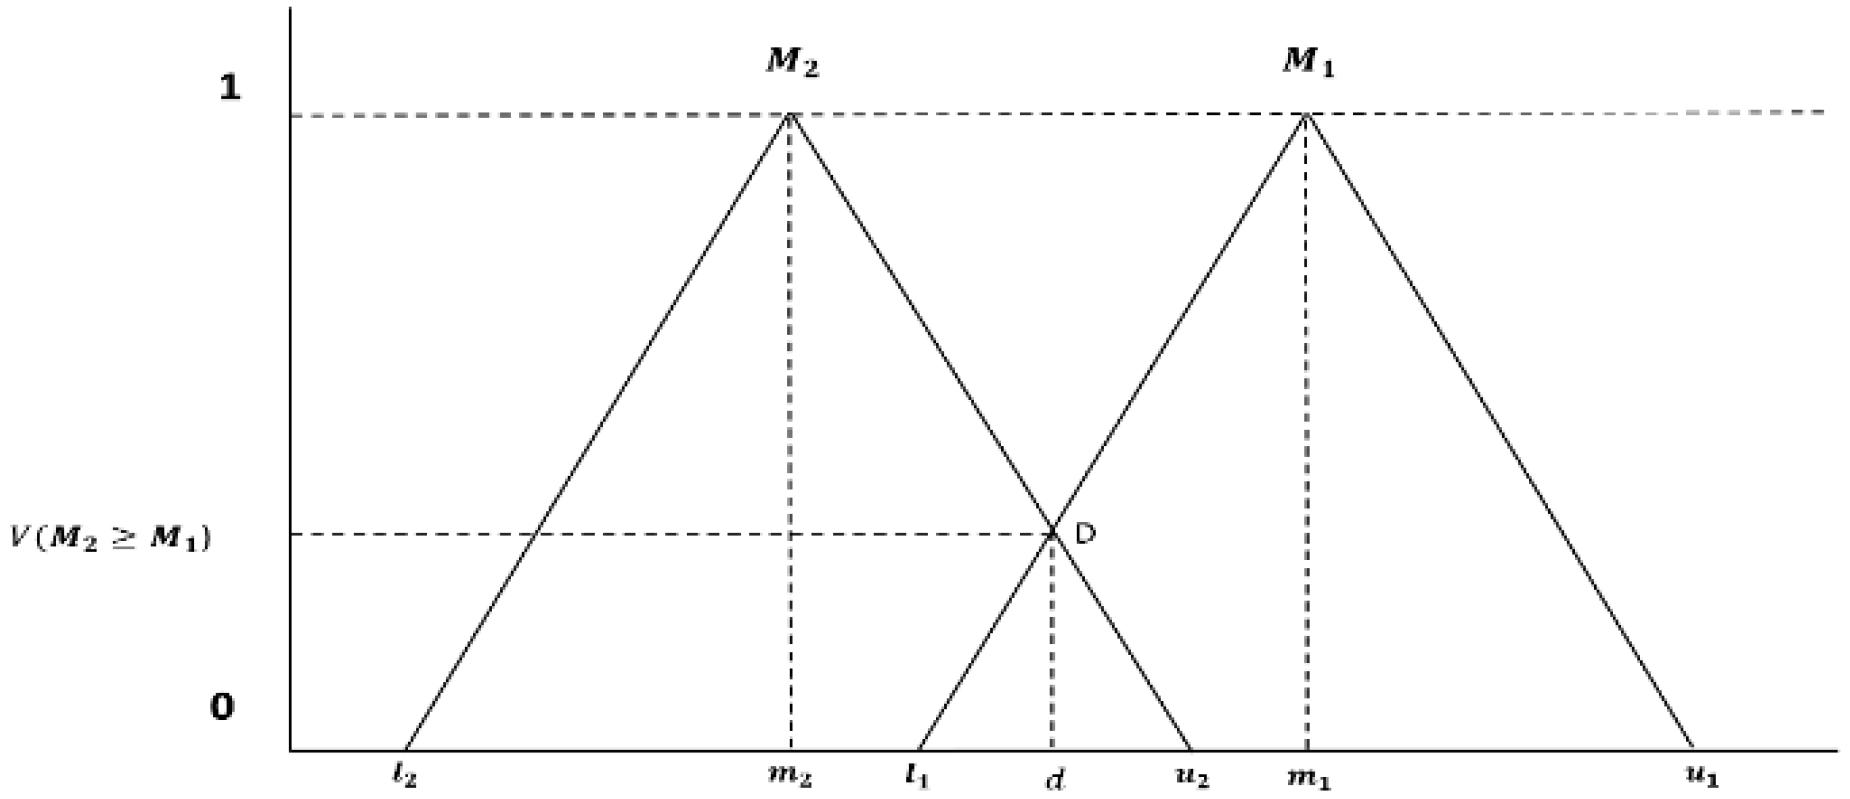
Step 2: The degree of probability of the triangular fuzzy number is defined in Equation (10).
As shown in Figure 2, is the ordinate of D, which is the largest intersection between and .
Step 3: The degree of probability that the triangular fuzzy number is larger than the other fuzzy number and is defined in Equation (11).
Assuming Equation (12),
if, the weight vector of each element is expressed as Equation (13):
where .
Step 4: The normalized weight vector of each element can be determined through normalization in Equation (14):
where is a non-fuzzy number.
The consistency test of the fuzzy AHP is identical to that of the AHP process [52].
3. Investment Evaluation Indicators and Hierarchy Structure
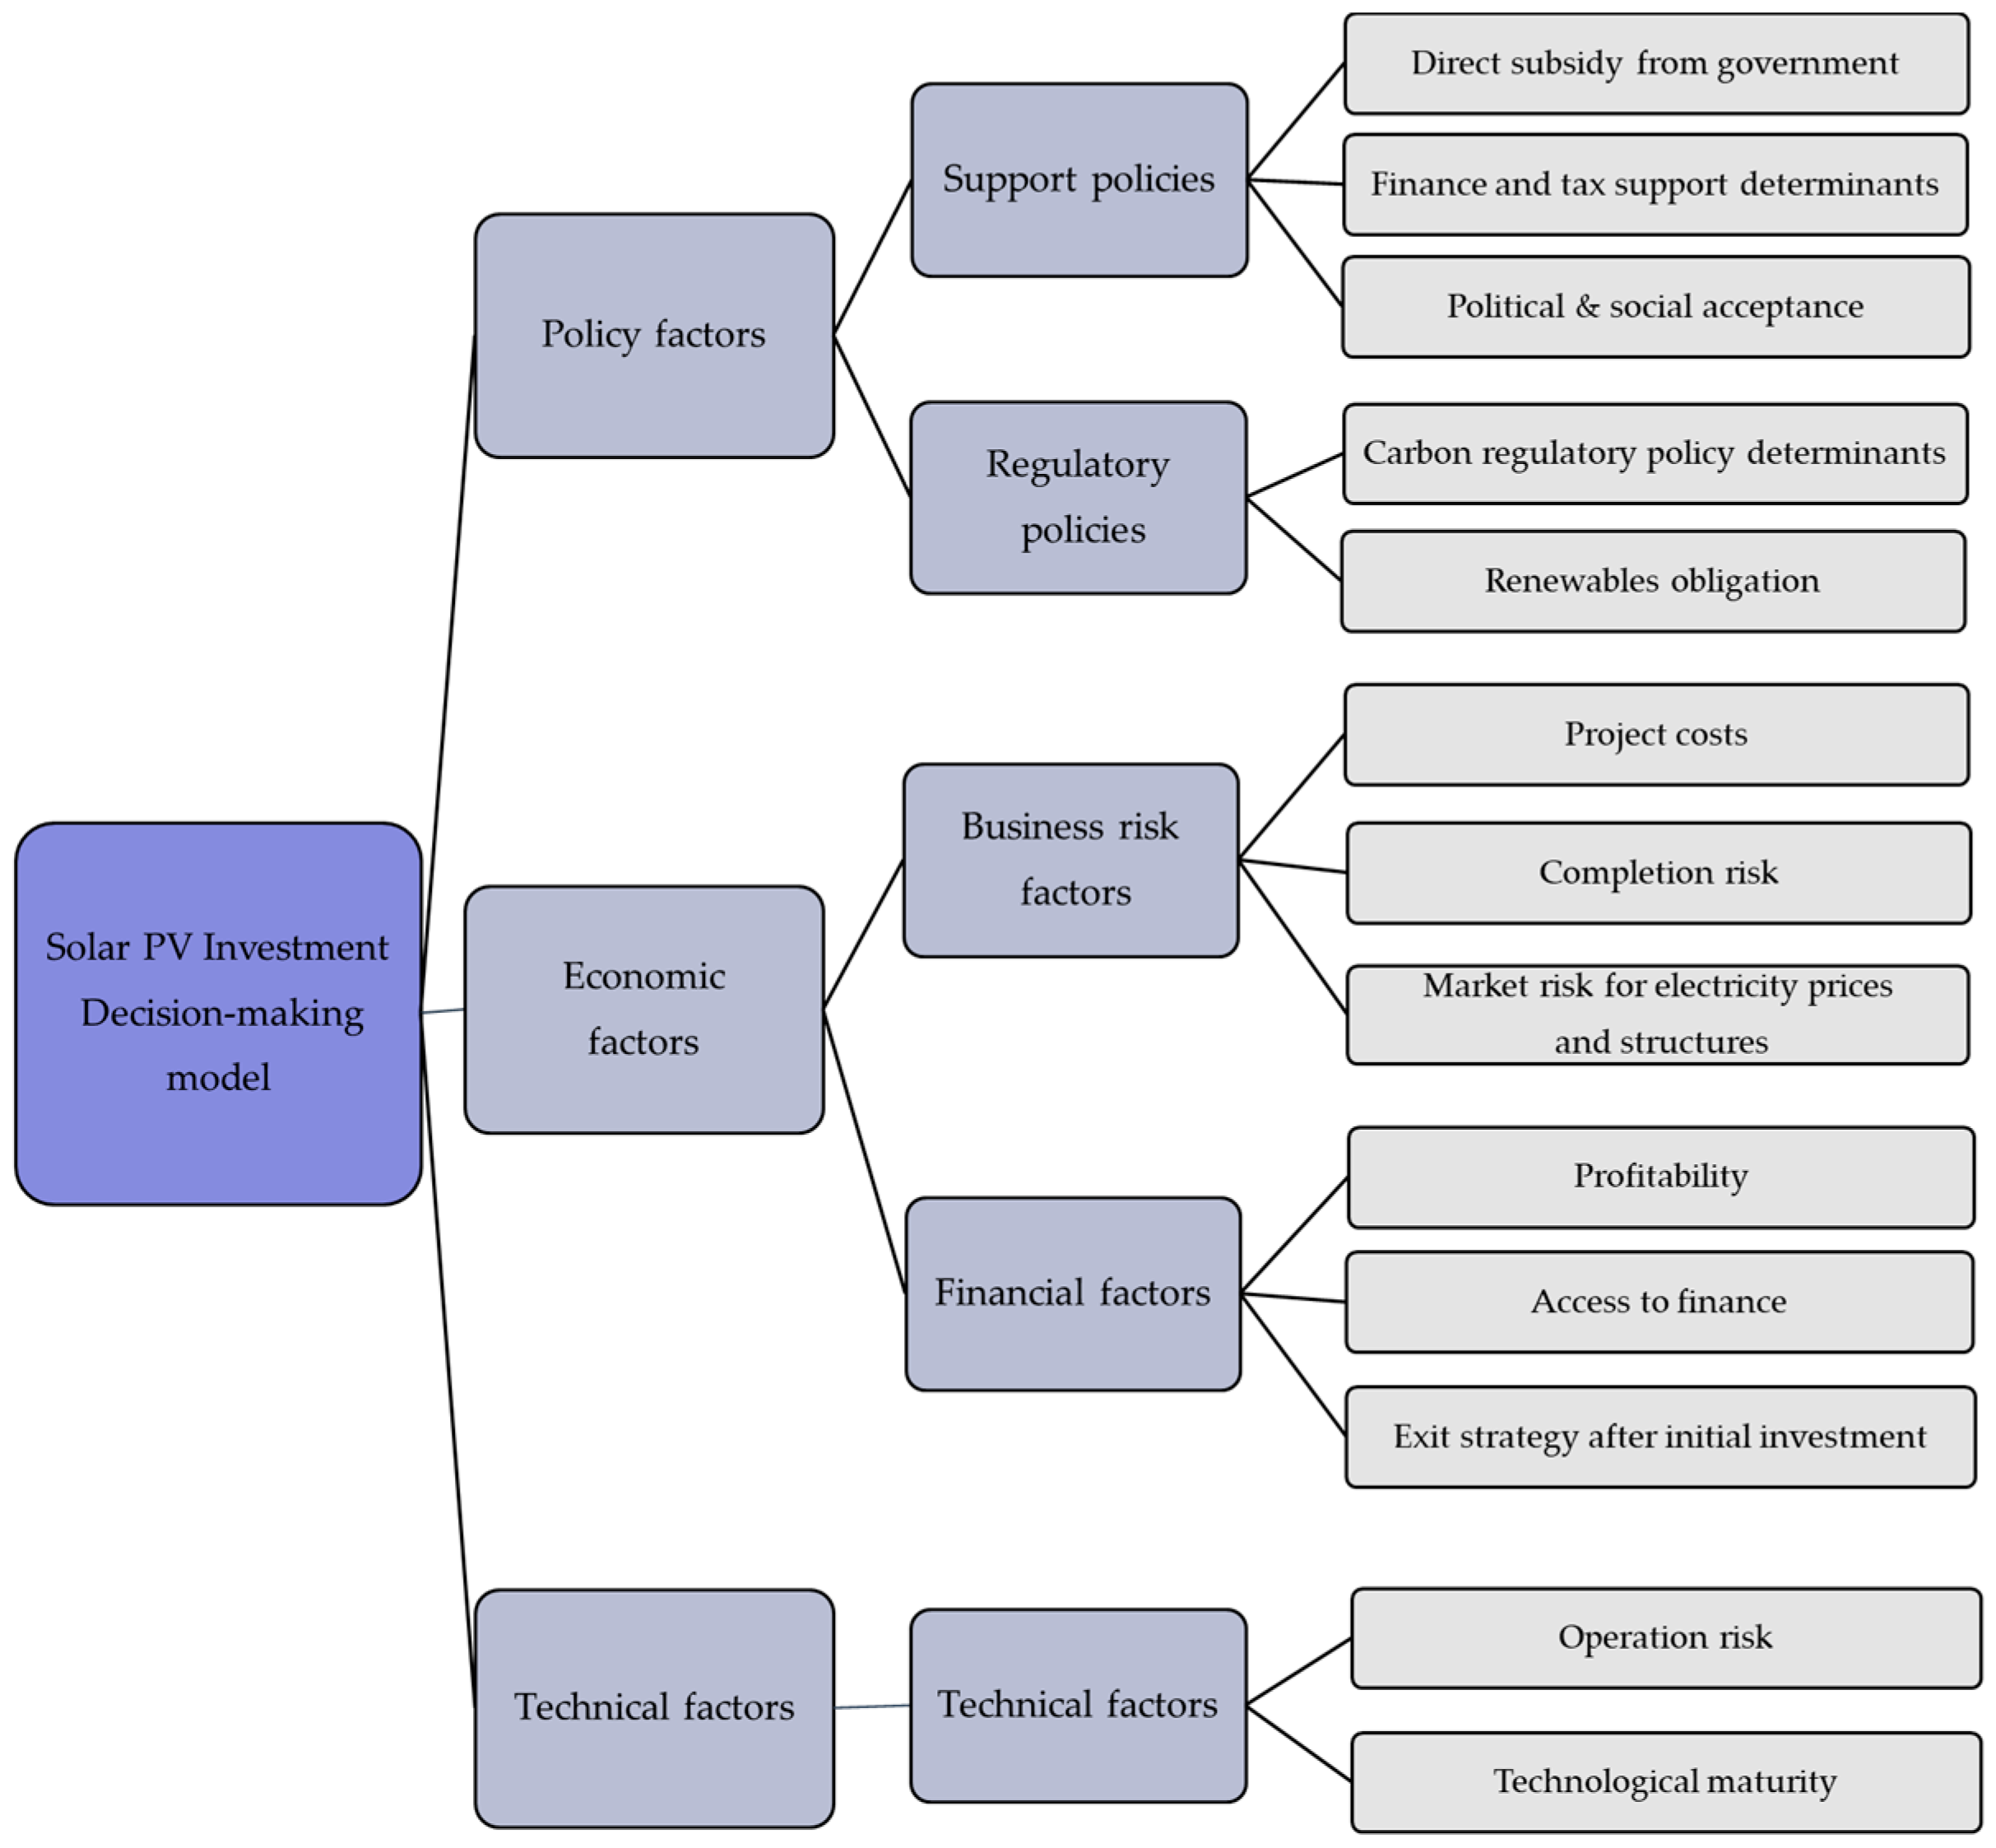
In this study, a structural hierarchy diagram was formulated as shown in Figure 3 by classifying the main factors considered for investment. There are three layers of evaluation indicators for investment in a solar PV power project. The first layer consists of three categories of indicators: policy factors, economic factors, and technical factors. The second layer consists of five sub-indicators of the first layer: support policies, regulatory policies, business risk factors, financial factors, and technical factors. The third layer consists of 13 sub-indicators of the second layer: direct subsidy from government [29,39,40,53,54,55], finance and tax support determinants [31,39,40,56,57,58,59,60], political & social acceptance [22,38,39,40,60,61,62,63,64,65], carbon regulatory policy determinants [2,38,65,66,67], renewables obligation [2,40,57,68], project costs [22,58,59,60,64,65,69,70], completion risk [2,22,58,59], market risk for electricity prices and structures [22,29,58,65], profitability [2,37,64,67,70], access to finance [39,40,58,61,64,71], exit strategy after initial investment, operation risk [22,58,64,65,67,72], and technological maturity [22,58,59,65].
The purpose of this study is to construct evaluation indicators for investment in solar PV power and quantify the relative importance of each indicator through a comparison of the characteristics and differences in the perspectives of each stakeholder. Previous studies on the construction and evaluation of investment indicators focused on technical or macroeconomic aspects. However, the evaluation indicators proposed in this study are designed at the project level and selected based on discussions with experts in the energy sector and on previous studies on the characteristics of solar PV industry, market participators, and power market for investment. Table 1 lists the proposed indicators and outlines the previous studies related to these indicators.
The first layer is composed of policy factors and economic factors. Policy factors refer to the policies that are directly or indirectly related to the expansion of PV power generation. Economic factors refer to the cost and profit of the PV power generation sources. Technical factors refer to the technical characteristics in terms of the operation of a PV power generation project. Table 2 describes the first layer in detail.
3.1. Policy Factors
Policy factors refer to policies that are directly or indirectly related to the expansion of solar PV power. They are composed of support policy determinants, which are carried out to promote solar PV power, and regulatory policy determinant, which are socially regulated to promote the supply of renewable energies such as carbon regulatory policy determinants and renewables obligations.
3.1.1. Support Policies
Support policies refer to policies that are carried out to promote the expansion of solar PV energy. The governments of various Asian countries are expanding support to the Solar PV power. Deriving the relative importance of numerous support policies currently enforced or planned and all factors representing them is practically impossible. It can also cause a problem in the consistency of responses by confusing the respondents in the AHP survey. Therefore, this study classifies the support policies into three categories:
Direct Subsidy from Government
Direct subsidy from the government is a system that provides cash or in-kind support for a portion according to the notified rate for power generation facilities using solar PV power sources. Representative direct subsidy from the government includes FIT and Renewable Energy Certificate (REC). These indicators have been used in previous studies [31,39,40,56,57,58,59,60], which named this sub-indicator as a subsidy support system, or the FIT and REC support system. In addition, various direct subsidies from the government are being promoted and increasing in size, such as additional issuance of RECs, guaranteed grid connection of renewable power plants under 1 MW, abolishment of upper limit of the electricity trading volume of private power generation, cash settlement for surplus electricity, and improvement of accessibility to infrastructure. Asian countries are also expanding direct government subsidies to increase solar PV power [1]. The expansion of direct subsidies is an important factor to consider because it can greatly improve the feasibility of solar PV power projects.
Financial and Tax Support Determinants
Besides direct subsidies, governments are attempting to expand the supply of solar PV power through funding and direct/indirect tax benefits. Previous studies [31,39,40,56,57,58,59,60] named this indicator as a tax incentive or financial support. Representative financial and tax support determinants related to solar PV power include loan support systems and tax credits. A loan support system provides long-term low-interest loans to consumers who want to use solar PV power and to developers who build renewable energy facilities. The tax support system deducts a certain percentage of the investment amount from the taxes of corporations or individuals who invest in renewable energy. The accessibility and feasibility of solar PV investments are improved as the finance and tax support determinants are expanded.
Political and Social Acceptance
This indicator evaluates the political and social acceptance of solar PV. This indicator represents the sustainability and intensity of social acceptability for establishing and implementing various support policies to promote solar PV supply. It also represents the sustainability and intensity of social acceptance for easing regulations and legal procedures. The higher the preference for the indicator, the stronger the policy support for solar PV and the easier it will be to carry out the project. Previous studies [22,38,39,40,60,61,62,63,64,65] named this indicator as political acceptance or social acceptance.
3.1.2. Regulatory Policies
Regulatory policies promote the expansion of solar PV supply by imposing compulsory obligations to businesses in the power generation sector through legislation, enforcement decrees, and ordinances. In this study, we classified them into mandatory rate allocation systems including the renewable portfolio standard and carbon regulatory policy determinants as explained in the following sections.
Carbon Regulatory Policy Determinants
Carbon regulatory policy determinants enforce power generation companies and stakeholders to pay the cost of emitting greenhouse gases that the allocated volume to achieve the reduction goal for greenhouse gases. Carbon regulatory policies have been considered extensively in previous studies [2,38,65,66,67] because they determine both sustainability and economic value. Policies to reduce greenhouse gases include the emissions trading system, carbon tax, subsidies, direct regulations, and voluntary agreements. We selected carbon regulatory policy as a regulatory indicator because it has been the main indicator that affects solar PV power in a positive direction [20].
Renewables Obligation
Unlike FIT, which is a subsidy system, the renewables obligation means a mandatory requirement to maintain a certain amount of renewable energy supply (mainly to suppliers). Representative renewables obligations for renewable energy include Renewable Portfolio Standards (RPS) [73], renewable fuel standards, and a renewable heat obligation. These regulations make the installation of renewable power plants obligatory and expand the renewable power capacity [73]. RPS is the representative of these systems where the suppliers are the owners of the power generation facilities of a certain size and the number of obligatory RPS suppliers and the duty ratio are increasing every year. RPS has several advantages; the market size is certain and the policy can be implemented by directly linking the CO2 emissions reduction target and the quota because the goals are set based on the power generation capacity or the amount of renewable energy. There are many studies [2,40,57,68] that address the RPS as an indicator, and renewables obligation including RPS can have a large effect on the investment environment for solar PV power. Therefore, the environment for the investors and power plant constructors will expand when the renewables obligation is enforced more intensely.
Table 3 lists the indicators comprising the policy factors and provides their descriptions.
3.2. Economic Factors
Economic factors consist of business risk factors related to the project performance and financial factors representing direct profitability.
3.2.1. Business Risk Factors
Business risk factors are composed of project costs, completion risk, and market risk for electricity prices and structures, and are related to direct economic risks that can occur during project performance.
Project Costs
Project costs include the investment cost and the scale required to perform a project, including the startup cost, direct investment cost, and the operations and maintenance (O&M) cost. Startup cost means the cost required for setting up the project. Direct investment cost includes the facilities cost, construction cost, grid connection construction cost, and land acquisition cost. O&M cost is the cost associated with the operating and maintaining the project. The project cost determines the overall feasibility of the project, which has been addressed in many related studies [22,58,59,60,64,65,69,70].
Completion Risk
Completion risk is associated with the possibility that construction can be completed within the planned construction budget within the planned construction period. Therefore, completion risk includes schedule overrun, cost overrun, and the interruption of construction. Power generation projects often experience schedule overruns and cost overruns due to various problems such as licensing problems and complaints of residents [74]. The operation of power plants needs to be preceded by the normal completion of power plants, which is a factor that has a great effect on feasibility. The completion risk has been addressed in previous studies [2,22,58,59] that evaluated the feasibility of projects. Other studies [74,75] have also addressed the schedule overrun and cost overrun that occur in solar PV and power infrastructure. Operational issues such as a grid connection are also a major completion risk.
Market Risk for Electricity Prices and Structures
The market risk for electricity prices and structures refer to the policy variations in market factors that can affect the project such as the electricity price variability and electricity price structure. Currently, the feasibility of most solar PV power projects is achieved by the long-term subsidies or government policy factors [2]. This means that the feasibility of the project can fluctuate greatly when the subsidy system or power purchasing conditions are changed due to policy instability. Therefore, it is essential to consider the energy pricing decisions, the price decision structure of REC, power purchase contracts, and subsidies. Thus, this study selected this factor as a business factor. This indicator has been addressed in many studies [22,29,58,65].
3.2.2. Financial Factors
Financial factors include the profitability and exit strategy after the initial investment on solar PV projects. They are composed of indicators of how easily new funds can be obtained for projects, and indicators for measuring the profitability of the projects. These factors consist of profitability, access to finances, and the exit strategy after the initial investment.
Profitability
Profitability is an indicator for measuring the profitability of solar PV power projects and refers to the net present values (NPVs) and internal rates of return (IRRs) of development and operation projects. The profitability indicator is determined by comprehensively reflecting the macroeconomic factors such as the interest rates of the investing country, credit risk, and the exchange rate. The macroeconomic indicators that belong to the profitability indicators have been addressed in studies on project feasibility and the classification of risk factors [2,37,64,67,70].
Access to Finances
Access to finances indicates the loan financing conditions such as the loan period, fixed or variable interest rate, and the debt service coverage ratio (DSCR). Access to finance is an important factor to consider because it can improve the feasibility of solar PV power projects. There are a few previous studies that selected this factor as an indicator [39,40,58,61,64,71].
Exit Strategy after Initial Investment
The more diverse and easier the exit strategies after initial investment are, the easier it is to manage the expected profits and risks of the project. Since the purpose of this study is to develop evaluation indicators for investment, we included the exit strategy after initial investment in the evaluation indicators unlike previous studies. This indicator refers to the convenience and conditions for selling or trading projects such as the ease of trading of shares in development or operation projects and initial public offering (IPO). The higher the exit strategy after initial investment is, the more active the financial investments and reinvestments take place. This factor has a positive effect on expanding the solar PV market. Furthermore, the exit strategy after initial investment is an indispensable element of a project as a financial device for risk mitigation [76].
Table 4 lists the indicators for economic factors and their descriptions.
3.3. Technical Factors
Technical factors influence the installation and operation of solar PV power plants. Solar PV power is dependent on natural conditions such as solar radiation; thus, the variability of power generation can be significant. Therefore, the operational risks related to technological maturity should be considered before investing, and this study included the operation risk and technological maturity as the evaluation indicators.
3.3.1. Operational risks
As mentioned above, the operational risks of solar PV power projects refer to all technical risks that may occur during operation such as low power generation due to the difficulty of controlling natural forces. The capacity factor is a typical operational risk factor. These technical risks can cause gaps between the expected profits and actual profits [25]. Operational risks have been considered major evaluation factors for solar PV power projects in most previous studies [22,58,64,65,67,72].
3.3.2. Technological Maturity
When the technological maturity level is higher, project development, operation, and risk management become easier. Therefore, technological maturity is considered one of the major factors. This factor considers the extent of the application of the technology related to solar PV power, i.e., at the local, national, or international level. The higher the technological maturity, the lower the installation cost and operational risks. This can have significant effects on both the project operators and financial investors. This indicator has been considered in many studies because large technological changes occur in solar PV power projects [22,58,59,65].
Table 5 lists the indicators and descriptions of technical factors.
4. Results and Discussion
4.1. Expert Organization
The 74 respondents, were classified into three categories depending on their organization: researchers, power generation companies, and financial investors. To maintain the reliability of the analysis, we selected the experts according to the following criteria. For the “power generation companies” group, experts who have worked for at least 10 years in the development and investment of power generation projects were selected. For the “researchers” group, professors in relevant fields in the universities or researchers who have a Ph.D. with at least 6 years of research experience were selected. For the “financial investors” group, experts who have worked for at least 5 years in the investment field in the power generation and energy industry were selected.
4.2. Consistency of Responses
The number of samples and the ratio of each category of respondents to the total samples are summarized in Table 6. This table also shows the consistency test result of the 74 respondents. We applied a CR criterion of 0.15, in which is consistent with many previous studies [41,49,77]. The number of respondents who did not maintain the consistency of responses was 39. Thus, our subsequent analysis results refer to the responses of the other 35 experts.
4.3. Fuzzy AHP Analysis Results
The weights of the final layer factors are calculated by multiplying the relative weights of the sub-indicators of each layer and then summing them up. The sum of the final hierarchical elements is 1. We analyzed the results using the method of Chang [51], which has been used and validated in many previous studies [41,47].
Table 7 shows the analysis results of the first layer. Economic factors (71.57%) were selected as the most important evaluation factors, followed by policy factors (16.26%) and technical factors (12.17%). The higher weights were assigned to the indicators that directly affect profitability. Since the purpose of this study is to determine the relative importance of investment indicators and develop an evaluation model for decision-making on solar PV investments, it is appropriate to assign higher weights to economic factors. Moreover, investment will not be pursued if the project has no economic value even if all the other conditions are met. Furthermore, renewable energy sources including solar PV still have high power generation costs than other traditional sources such as coal and nuclear power. As a result, the economic value of a solar PV power project tends to be largely dependent on the policy support of the government. Therefore, policy factors showed the second highest relative importance.
For policy factors, support policies (81.43%) showed higher importance than regulatory policies (18.57%) (Table 7) because support policies have a greater direct effect on profitability than regulatory policies at the project level. This suggests that for efficient supply of solar PV power to develop further in the future, establishing support policies can have a greater effect than regulatory policies.
Expert analysis results (Table 7) also show that the experts consider that an appropriate support policy is ultimately more helpful for the effective expansion of solar PV. In general, the largest problem in the preparation of policies for the expansion of renewable energy supply has always been whether they should focus on support policies represented by FIT or on regulatory policies represented by RPS. The respondents state that support policies are more effective than regulatory policies. This has been discussed and demonstrated in previous econometric analysis studies. Therefore, the results of this study derived through the multi-criteria decision theory are consistent with previous studies [26,27,28,29,30,31,32,33,40] that support policies have a greater impact on the supply of renewable energy than regulatory policies.
Financial factors (79.95%) were more important than business factors (20.05%) (Table 7). This is because profitability, access to finance, and exit strategy after initial investment, which comprises the financial factors are most directly related to the expected profit, which is an indicator that is considered first in investments. Furthermore, the exit strategy after the initial investment is a critical factor in the investment stage. Thus, these weights suggest that financial factors are considered first in reality. This tendency is also reflected in this study.
Business risk factors also affect the project feasibility, but they are more indirect risk factors and thus have lower relative importance than financial factors in investment decision-making. This is interpreted as a result of the greater importance given to the financial factors that more directly indicate profitability at the project level. Furthermore, the uncertainties about cost factors in solar PV investments have reduced compared to the past as the experiences of solar PV investments have increased.
Figure 4 shows the relative importance of the third layer, where profitability (43.16%) is regarded as the most important factor. Since economic factors showed the highest importance in the first layer, profitability is the most important determinant. Next, project costs (9.27%) and exit strategy after initial investment (8.39%) and were more important than other indicators. This result implies that direct profits expected in the future and cost factors that can affect profitability and the project performance are considered more important than the risk factors that are easier to predict in the early stages of a solar PV power project. Along with project costs (9.27%), the exit strategy after initial investment (8.39%) showed higher importance than other factors because the exit strategy in financial investment can lower project risks and increase profits [76].
One indicator that showed unusual results among the economic factors is the market risk for electricity prices and structures (3.72%). This indicator showed lower relative importance unlike other sub-indicators of the economic factors that showed higher importance. This can be interpreted as follows. The risk of profit fluctuation has decreased compared to the past years, and it has become easier to manage risks and predict project profitability as more project cases have accumulated. The other small categories of policy factors and technical factors showed importance values in the range of 0.70% to 7.92%. Among them, two indicators of regulatory factors, carbon regulatory policy determinants (0.70%) and renewables obligation (2.32%) showed much lower relative importance values than other indicators because the effect of the regulatory system is smaller than that of the direct subsidies (7.92%) in the decision-making for the investment and supply of solar PV power projects. Thus, these results suggest that for effective supply and adequate investments of solar PV power, a thorough analysis and forecasting of the support system and profitability should be performed.
4.4. Detailed Analysis Results by Group
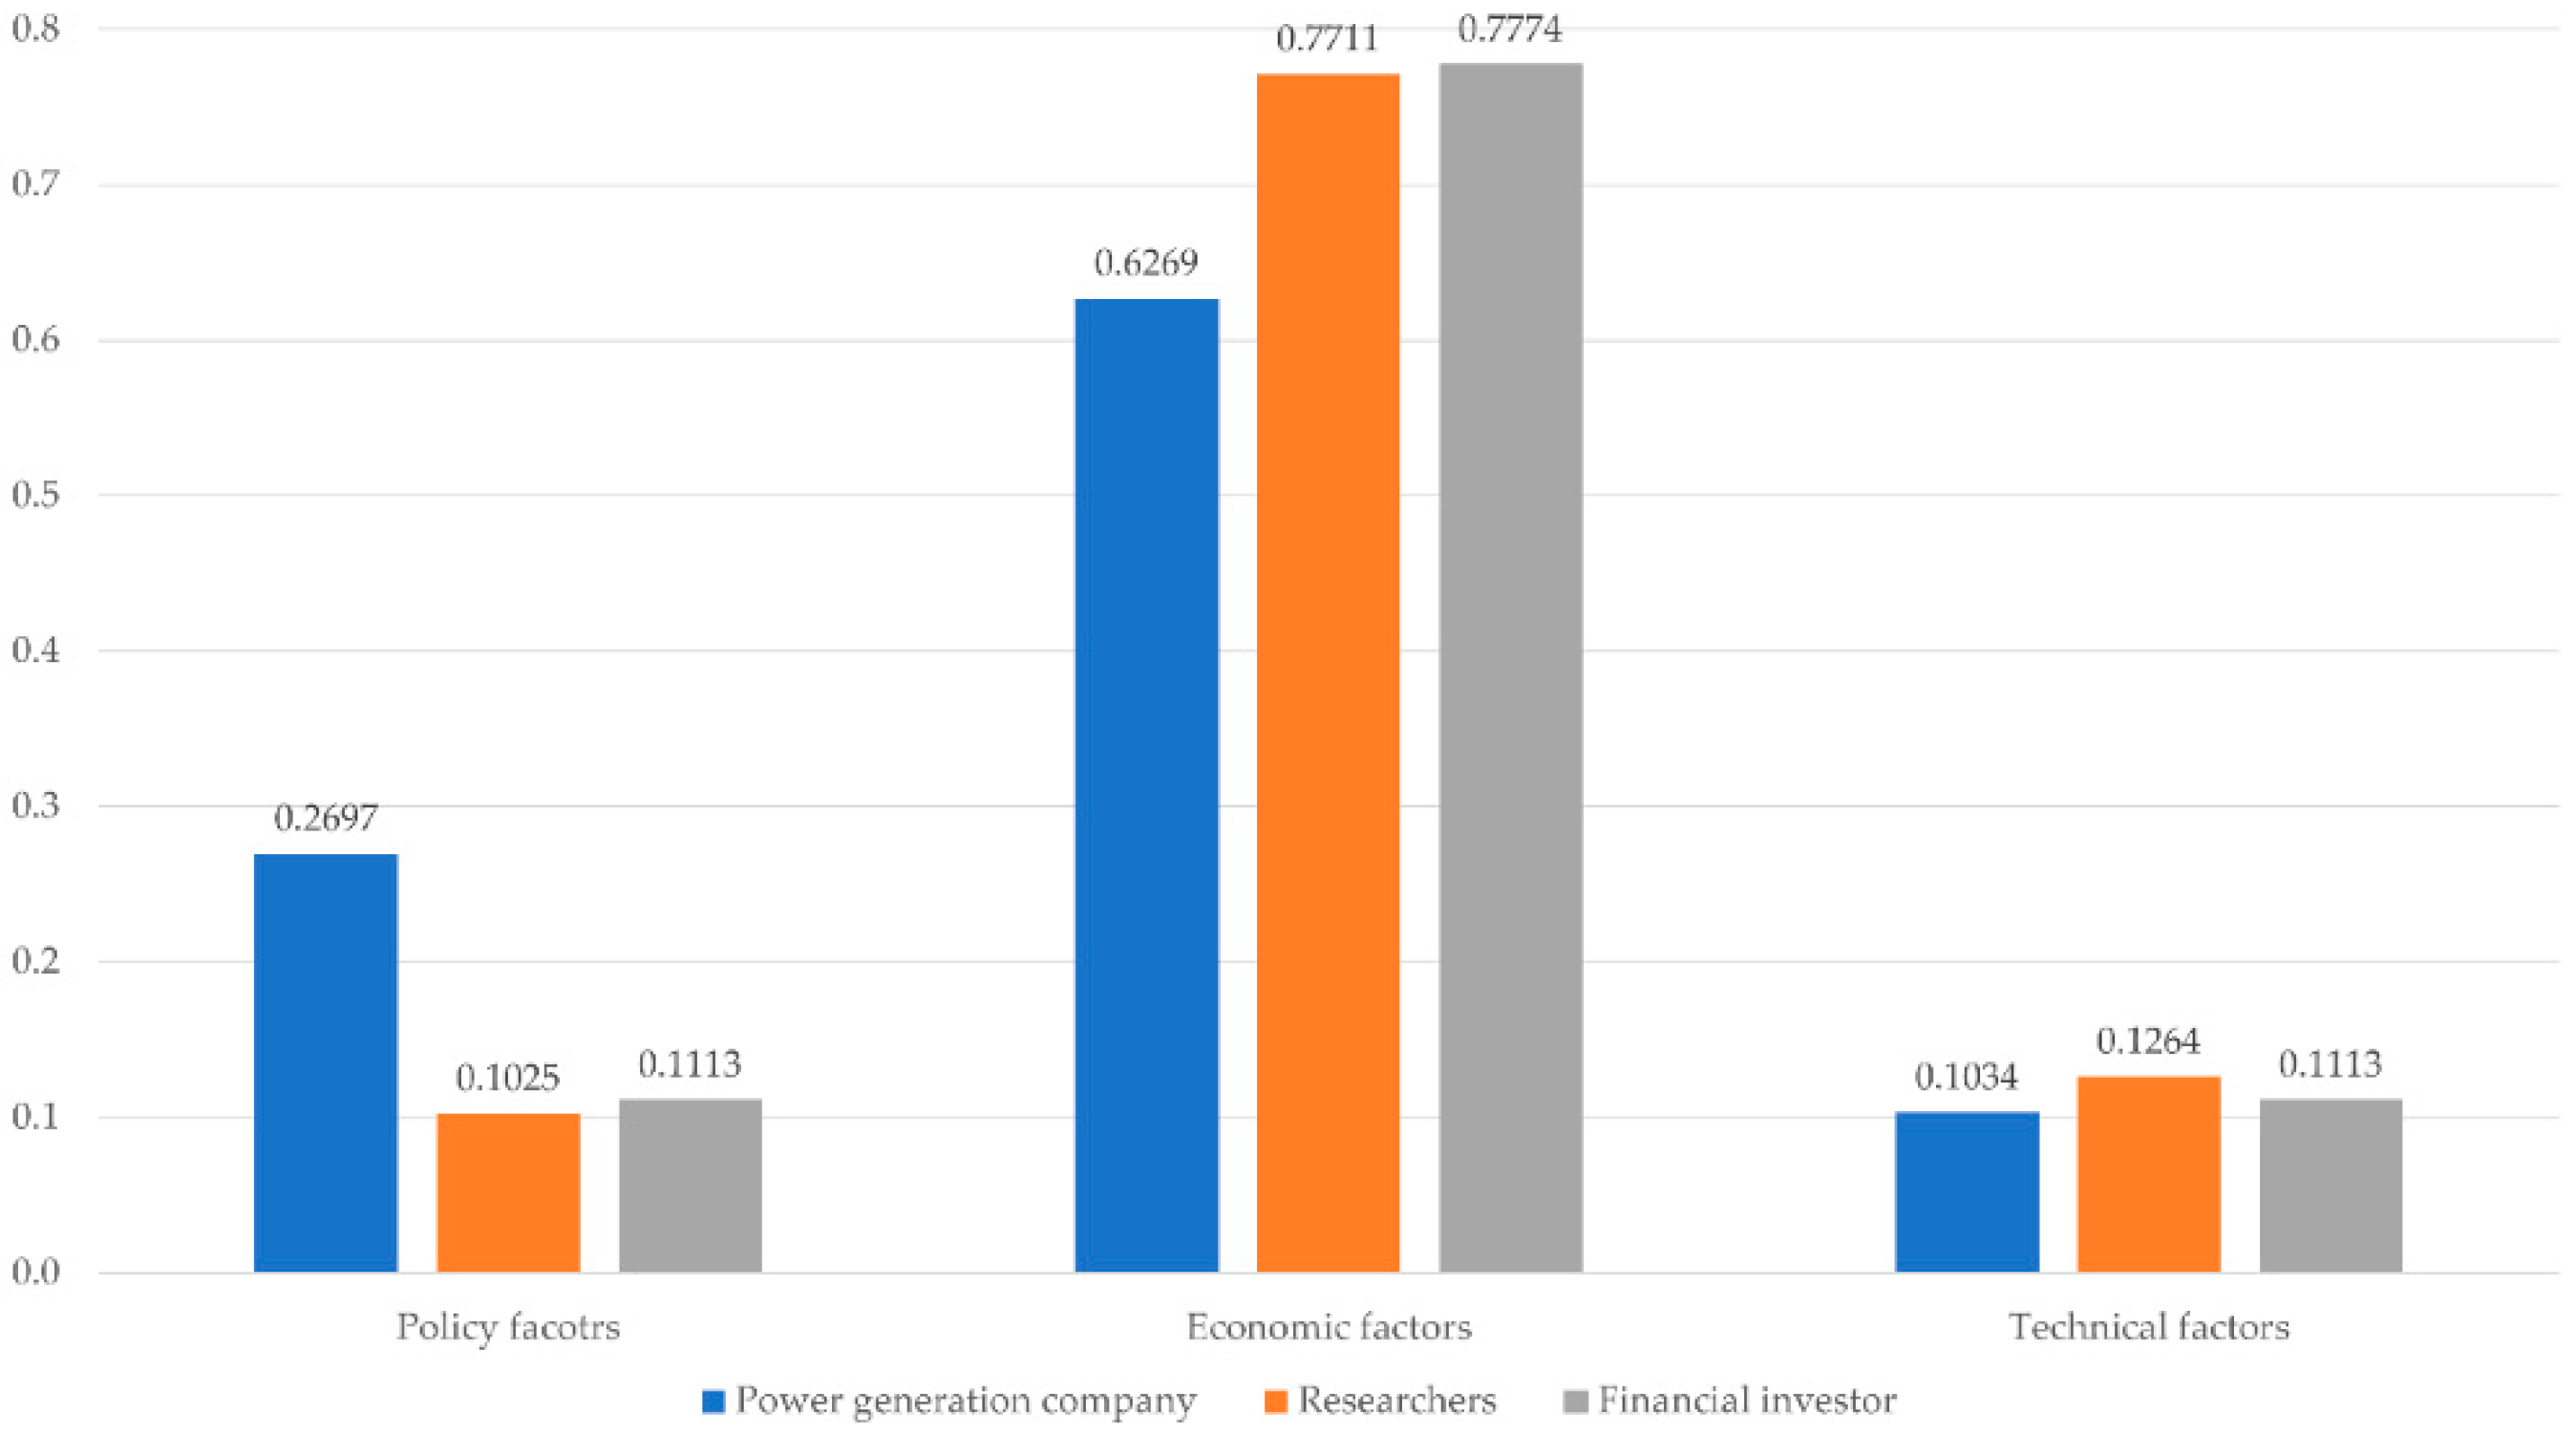
There are various interested parties in the solar PV power market, which consists of financial investors and power generation companies that operate power plants. It is important to analyze the different perspectives of stakeholders participating in the solar PV power market as the solar PV power market is rapidly expanding and there are a variety of market participants. Despite the common goal of investment or solar PV supply, individual stakeholders may perceive the relative importance of each factor differently. Therefore, in this study, we analyzed the differences in the perspectives of academic experts in fields that are directly or indirectly related to policy establishment and investment as well as financial investors and power generation company representatives who are the main players in the solar PV power market. The survey was performed separately for each group of stakeholders. The differences in perceptions of each group were quantified for the establishment of policies and investment indicators related to solar PV power in the future. Figure 5 shows the relative importance of the first layer for each stakeholder group.
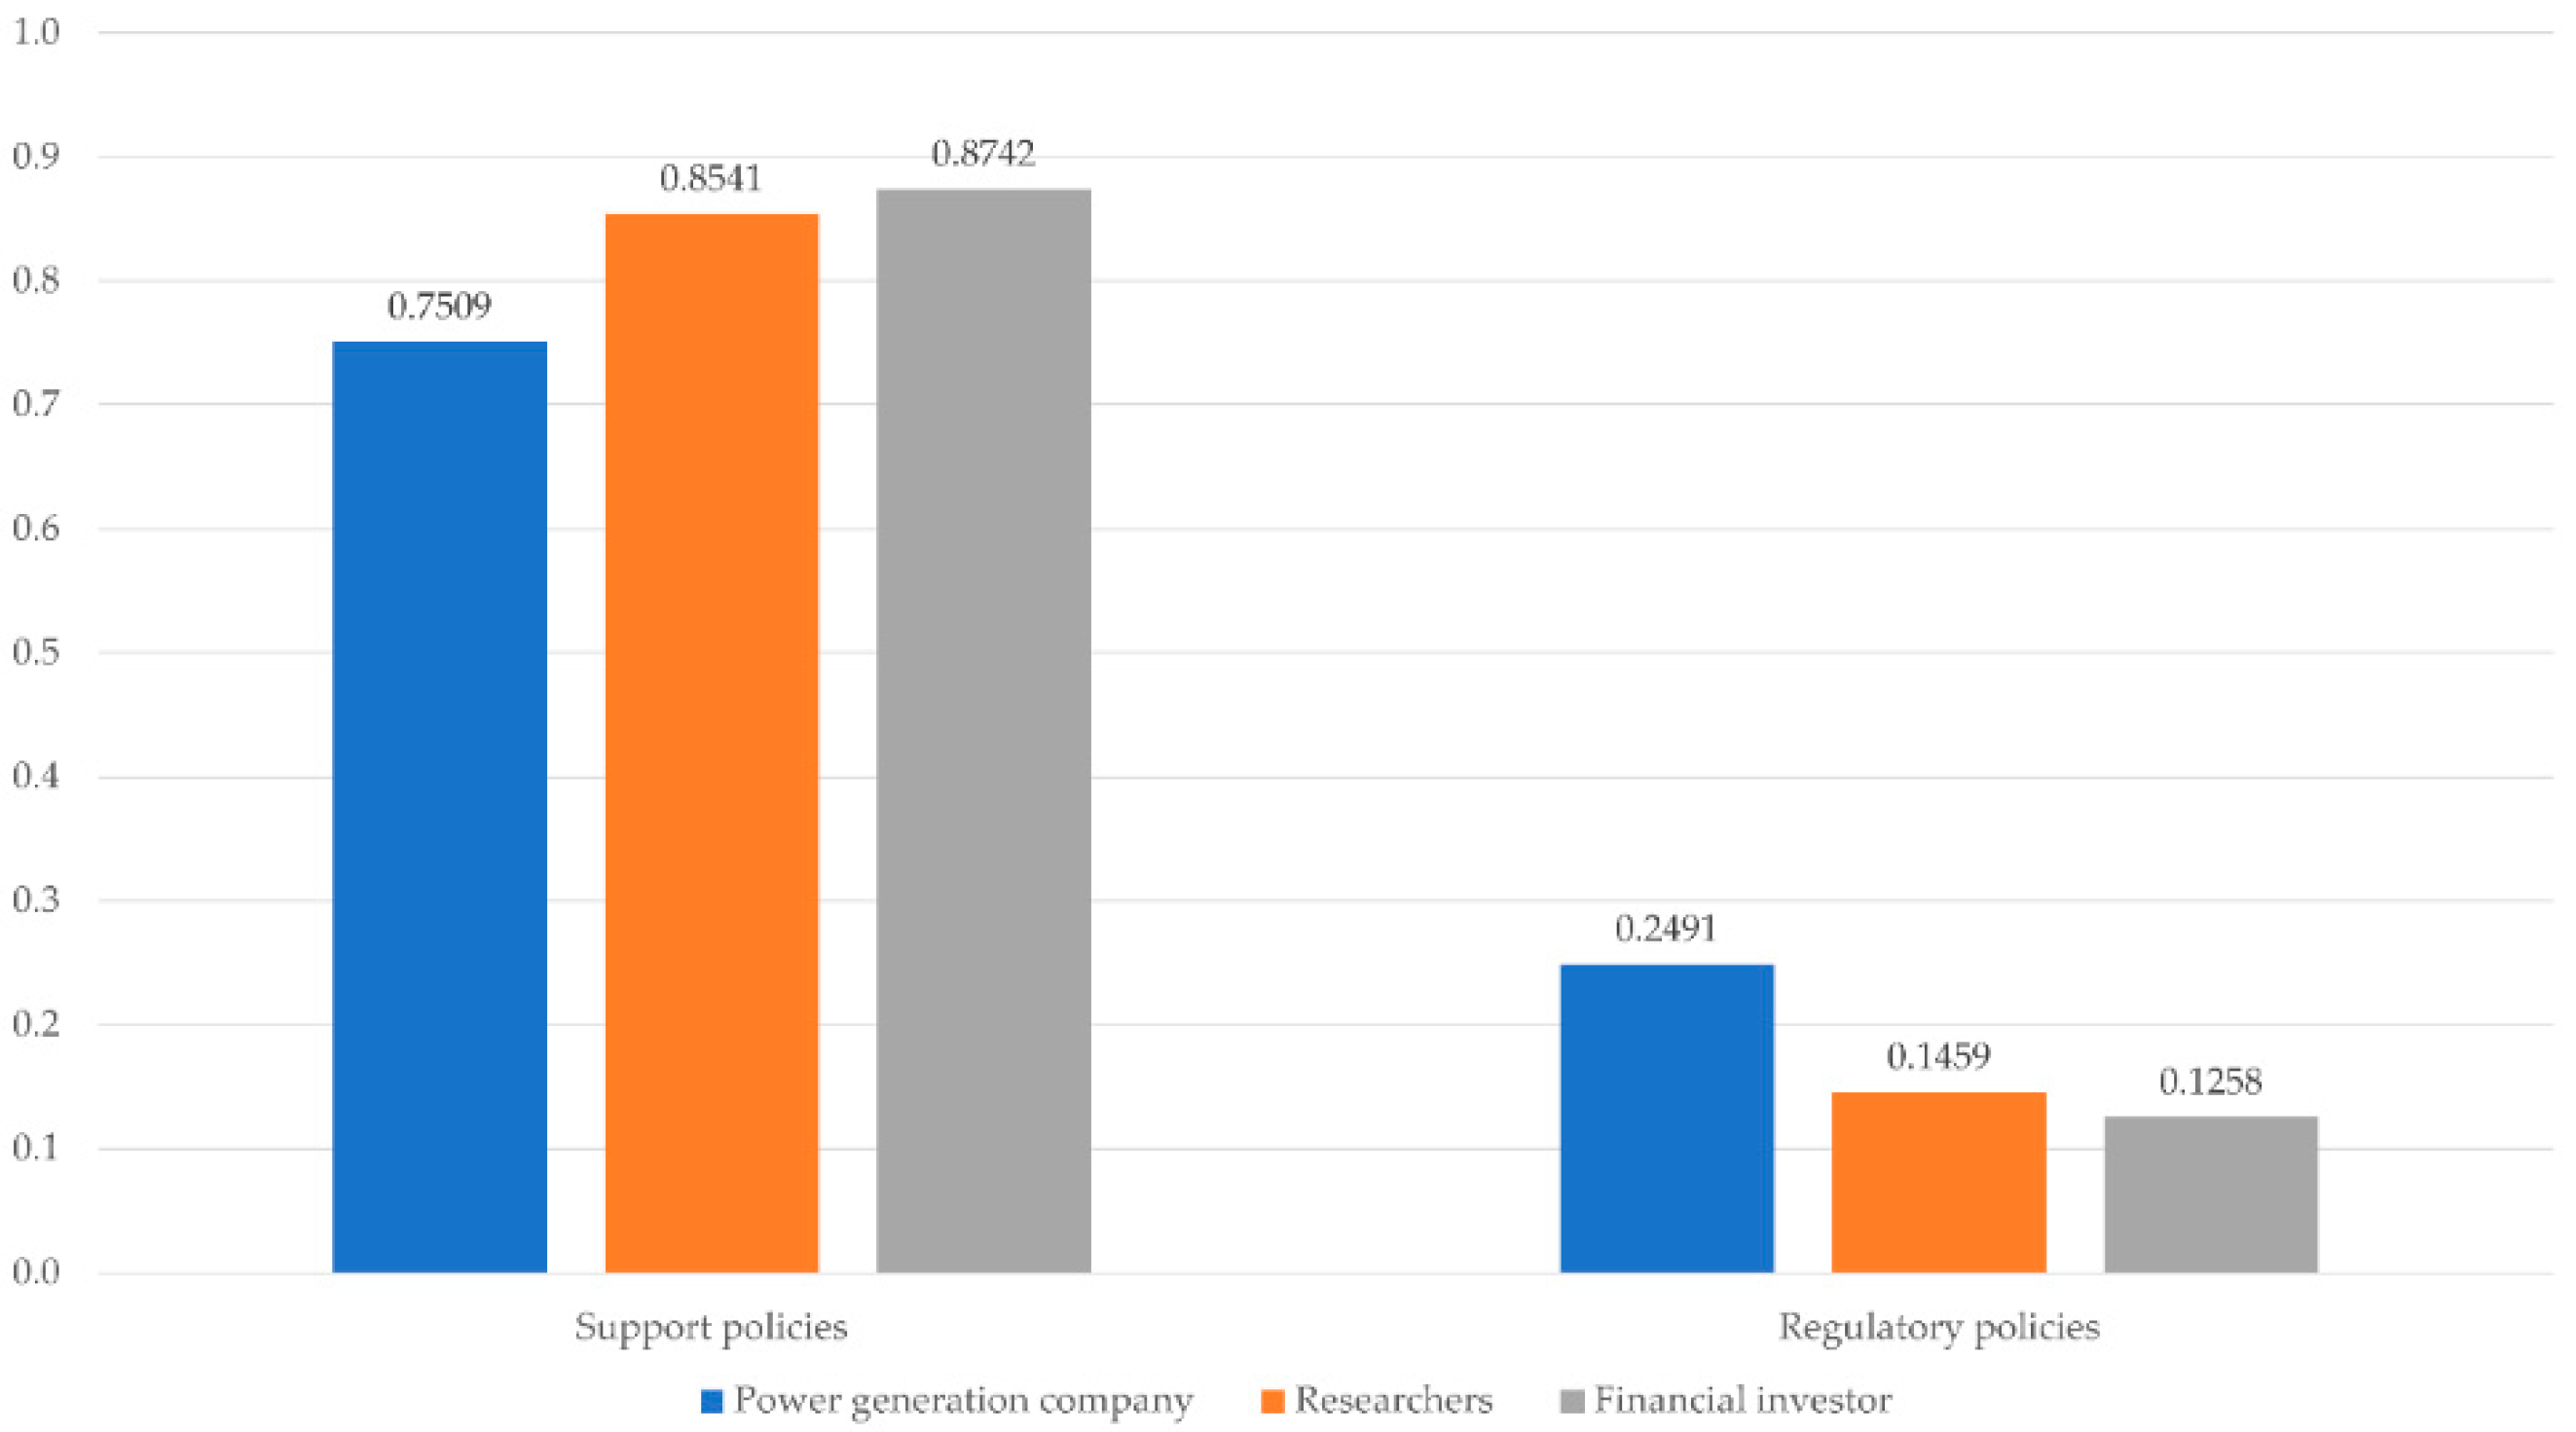
Similar to the integrated results (Table 7 and Figure 4), economic factors showed the highest weight for all three stakeholders. For power generation companies, policy factors, economic factors, and technical factors showed the weight values of 26.97%, 62.69%, and 10.34%, respectively. For financial investors, the values were 11.13%, 77.74%, and 11.13%, and for researchers, 10.25%, 77.11%, and 12.64%, respectively. The groups showed significant differences in policy factors. Power generation companies showed higher importance in policy factors and lower importance in technical factors than the other groups because power generation companies are most directly affected by policy factors. For example, with the introduction of the RPS system in South Korea, power generation companies are obligated to install and operate renewable power generation facilities. In this respect, higher importance was assigned to policy factors for power generation companies who tend to receive greater effects of policy regulations than other stakeholders. Furthermore, policy factors can be important owing to the nature of the utility industry where many corporations are owned by the government. Figure 6 shows the analysis result of the policy factors by each stakeholder group.
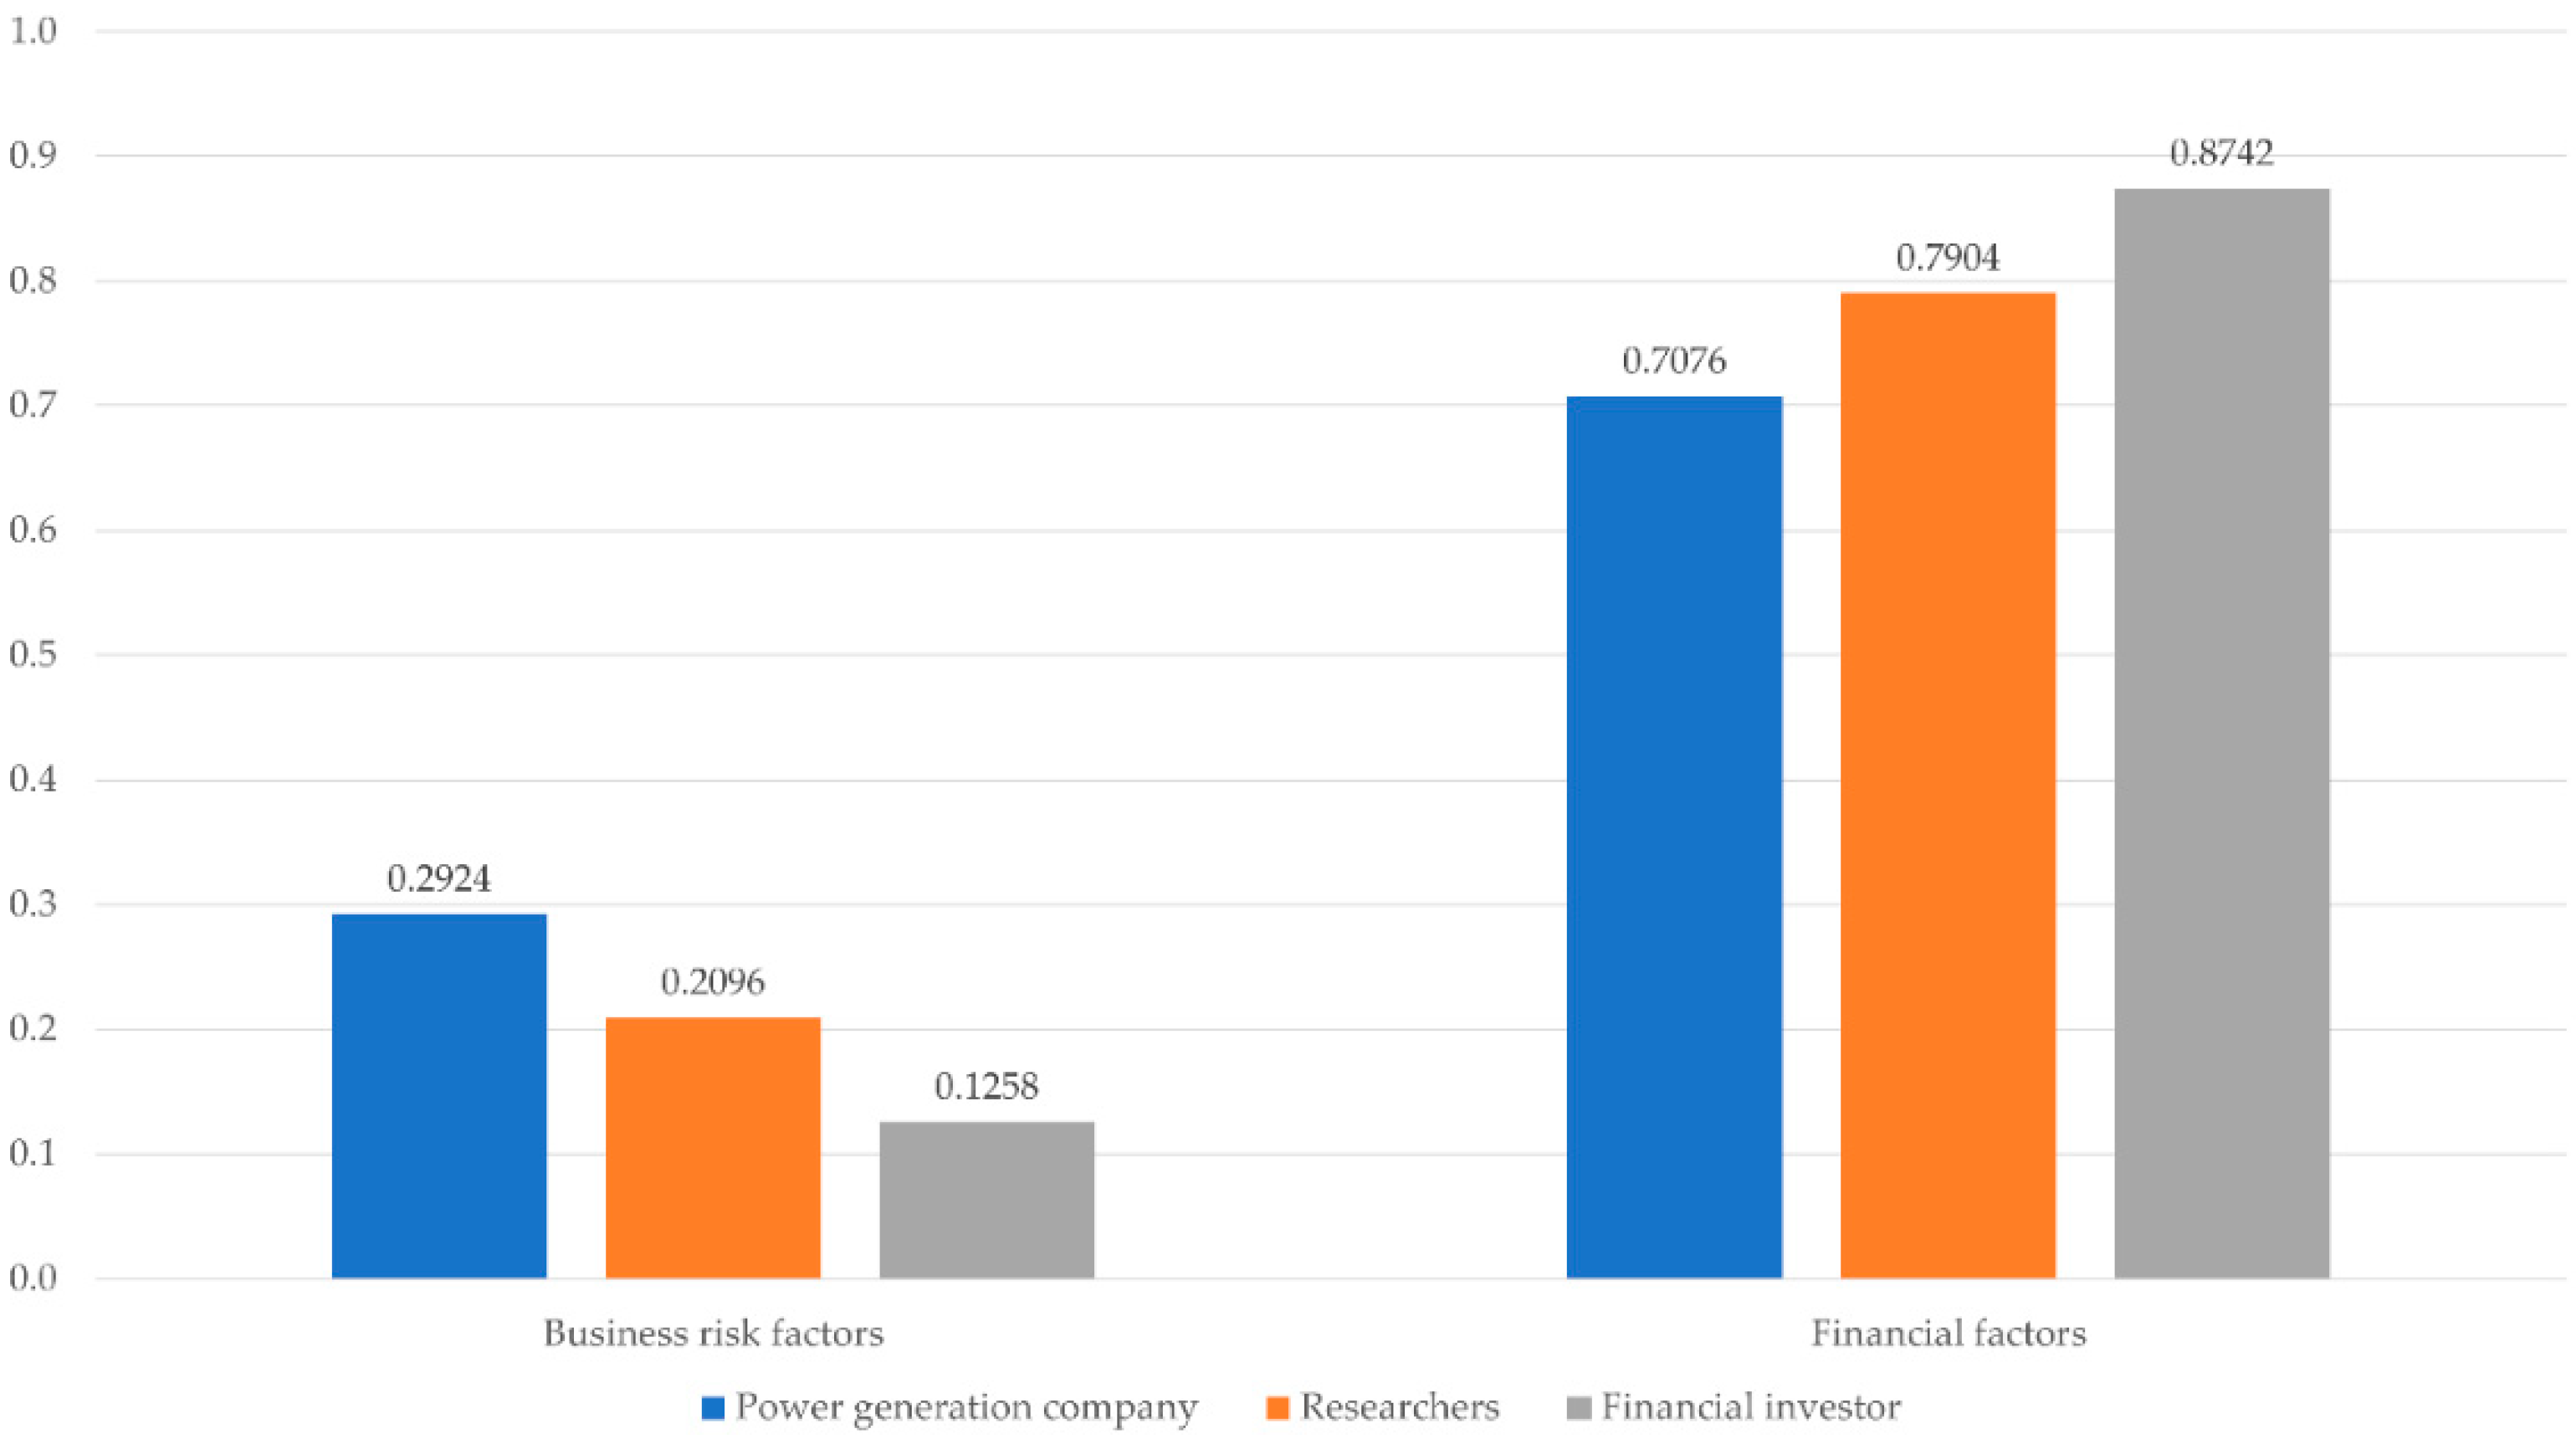
A higher weight was assigned to the support policies than the regulatory policies for all three groups. This is the same as the result of the integrated analysis and proves that support policies have a greater effect on the economic value of projects than regulatory policies. Power generation companies assigned a higher weight to regulatory policies than other stakeholders because they are more directly affected by the regulatory policies of the government. Figure 7 shows the results for the economic factors by stakeholder group.
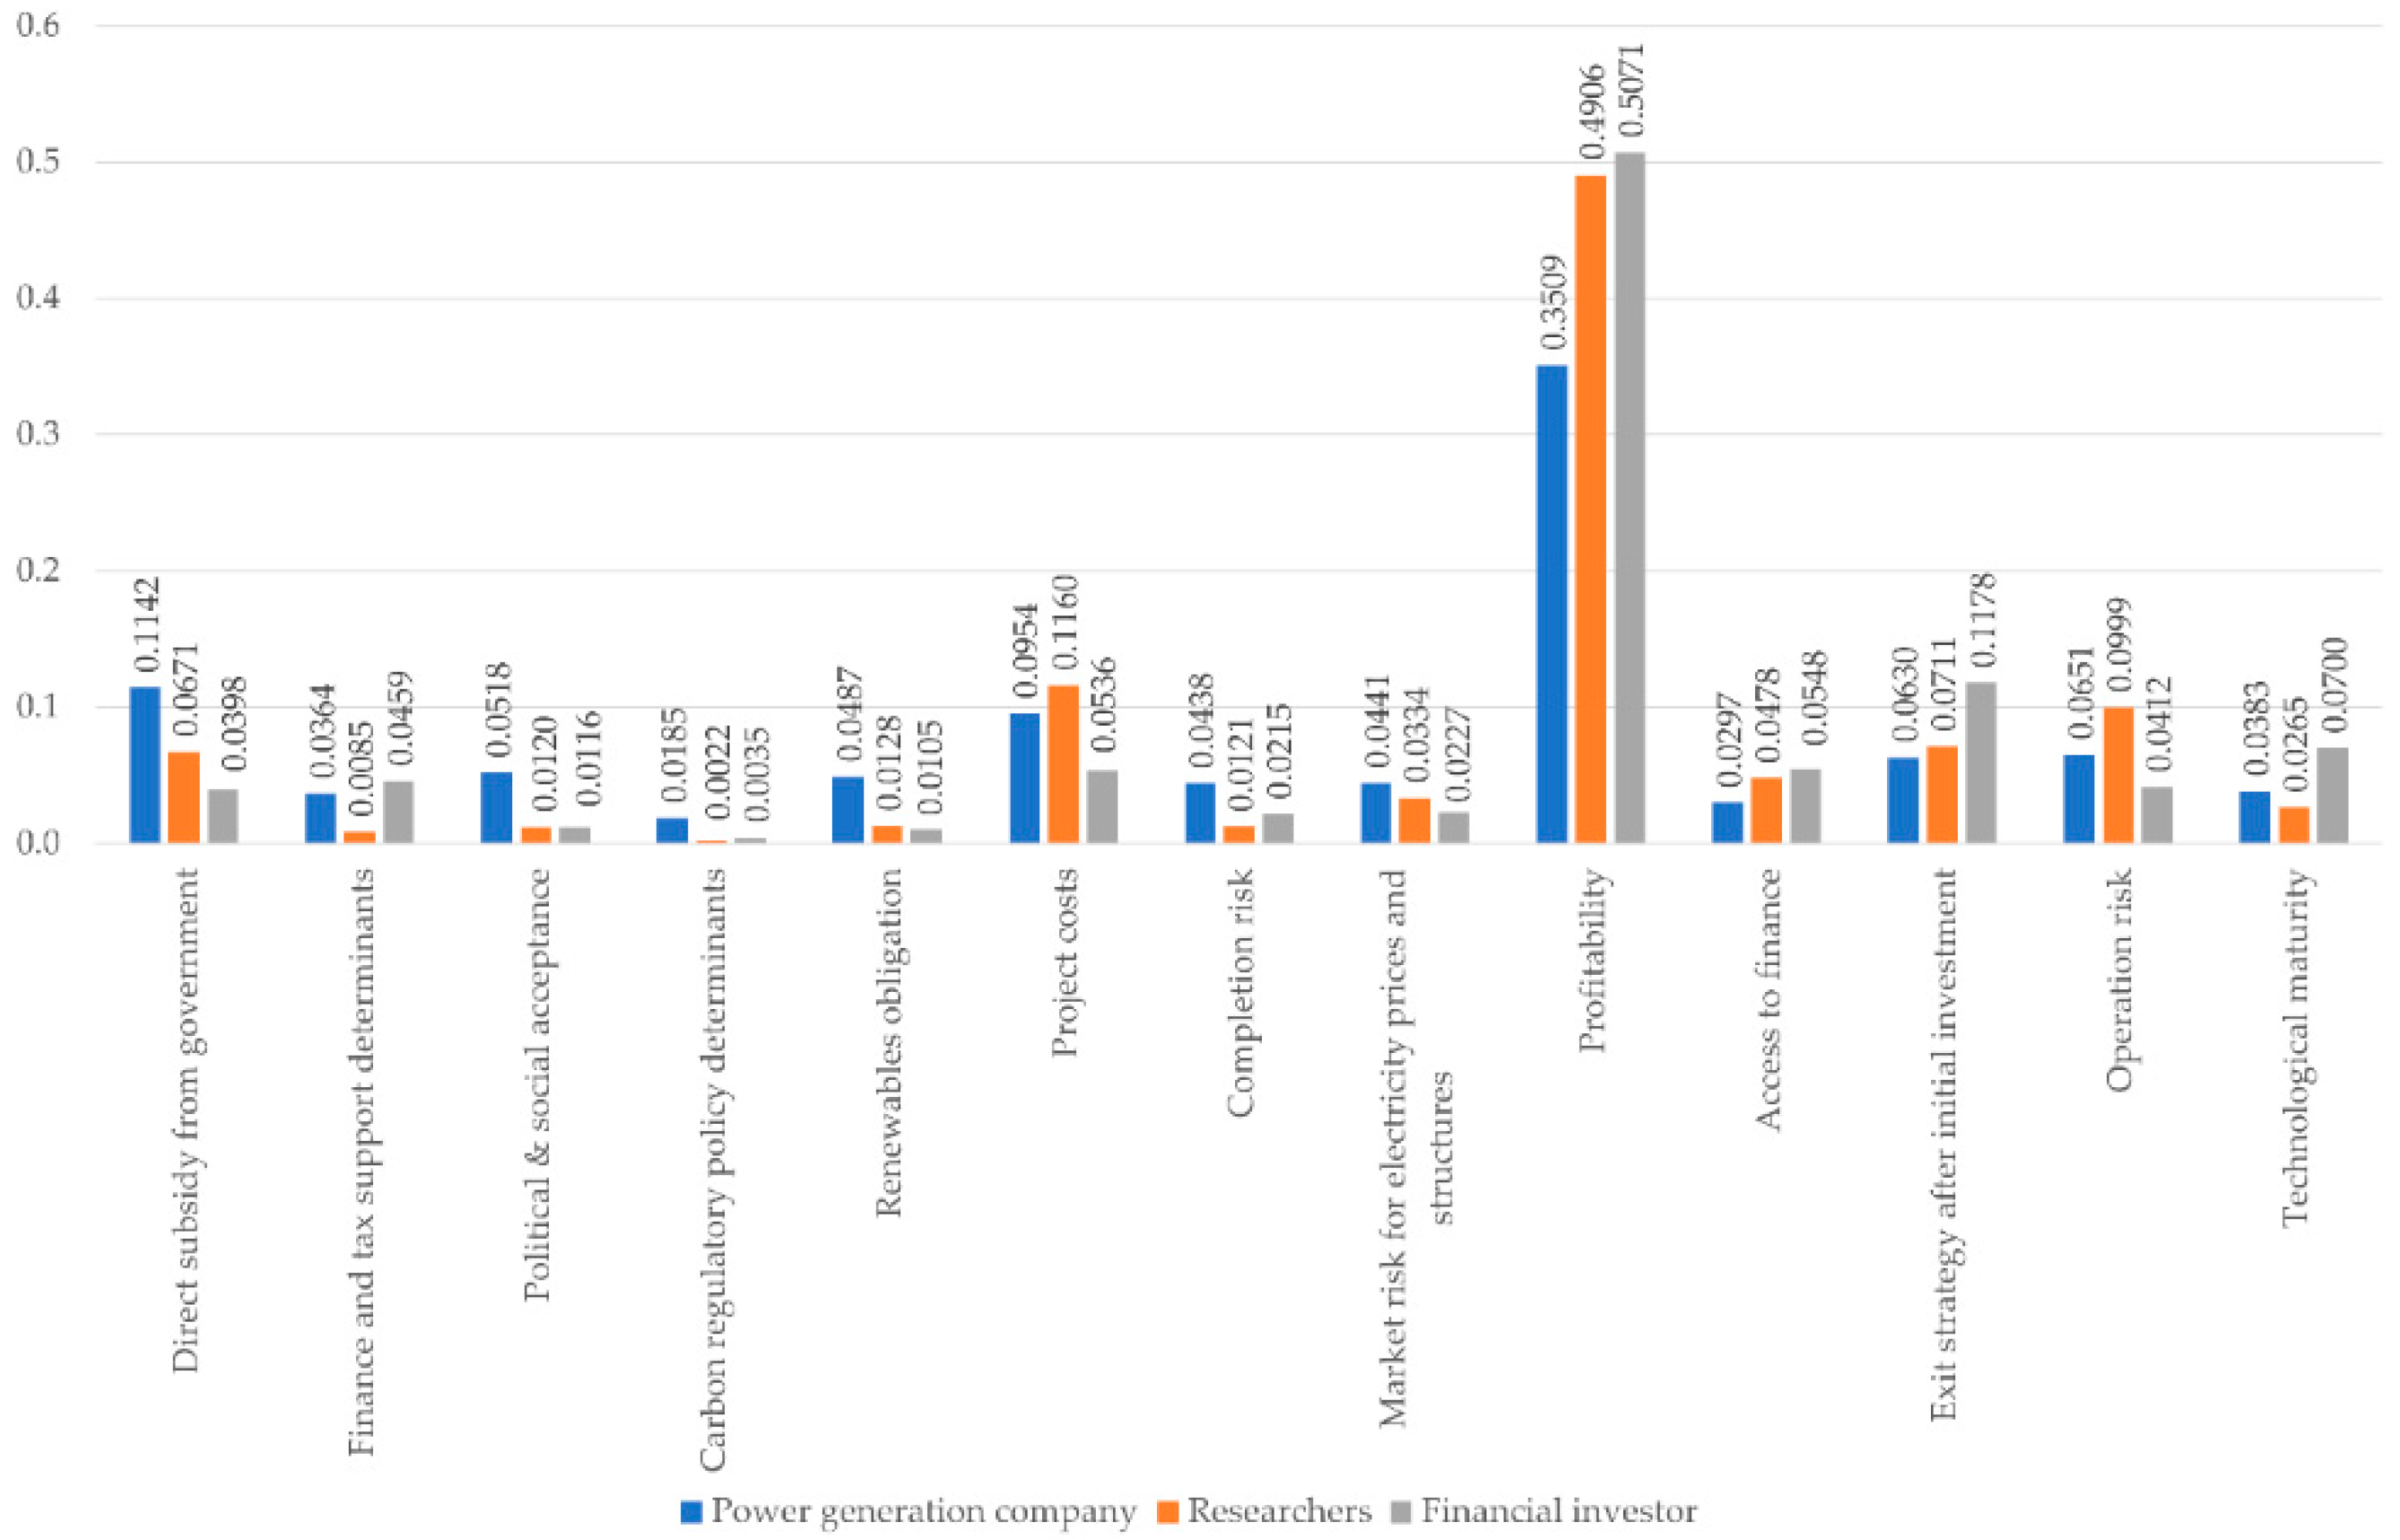
The groups showed considerable differences in the perception of the sub-factors of economic factors. Power generation companies showed different results from the other two stakeholder groups. The financial investors and researchers assigned higher importance to financial factors than business factors, which coincided with the integrated analysis results shown in Figure 4. This reflects the characteristic of financial investors who invest for profits. The power generation companies assigned higher importance to business factors than other stakeholders because they must have a certain power generation capacity to meet regulatory and power production needs. The researchers fell between the other two groups. These differences in the perception of policy factors and economic factors among the three groups are analyzed in more detail by comparing the importance values for the third layers (Figure 8).
The stakeholders that show the most significant difference are the power generation companies. They present very different results for profitability, access to finances, and completion risk than other stakeholders. Power generation companies (35.09%) assign lower relative importance to profitability than other stakeholders (49.06%, 50.71%) Some power generation companies that belong to the government are obligated to build renewable power plants due to regulations, unlike financial investors who focus on generating profits through financial investments. This difference decreases the relative importance of profitability for them. Furthermore, the prediction of the profit ratio has become easier as the market has matured. For loan financing, various policy factors are used to stabilize the profit structure of solar PV power, which has a profit fluctuation to expand solar PV supply. For example, South Korea is temporarily enforcing a system that requires payment of a fixed price for 20 years after bidding for a total price of the REC and system marginal price. This facilitates the prediction of the profit ratio, reduces fluctuations in project profitability, and increases the access to finances.
Power generation companies, which must carry out the entire process from the initial investment stage to the operation of power plants, assigned a lower weight to the profitability indicator because they bear a higher project risk burden than other stakeholders. Power generation companies (4.38%) also assigned much higher importance to the completion risk than other stakeholders (1.21%, 2.15%) because they are the ones who are responsible for receiving licenses for construction and are aware of the fact that many interruptions in construction may be caused by civil complaints and other problems. As a result, they assigned higher importance to the completion risk indicator than other stakeholders. Recently, the construction of solar PV power plants has often been interrupted and delayed due to many civil complaints in the license and operation process by the destruction of facilities. Power generation companies perceive the risks from these factors to be more important. Power generation companies assigned a higher weight to policy factors such as political & social acceptance, carbon regulatory policy determinants, and renewable obligation than other stakeholders because they are more directly affected by the regulatory policies of the government. For power generation companies, political & social acceptance, carbon regulatory policy determinants, and renewable obligation showed the weight values of 5.18%, 1.85%, and 4.87%, respectively. For researchers, the values were 1.20%, 0.22%, and 1.28%, and for financial investors, the values were 1.16%, 0.35%, and 1.05%, respectively. Financial investors (5.36%) and power generation companies (9.54%) assigned lower importance to the project costs than researchers (11.60%) because it has become easier to predict cost overrun and schedule overrun with the accumulation of previous investment experiences in solar PV projects.
Using the results of the analysis, we can quantify and identify the relative importance of risk factors in project performance perceived by stakeholders. Therefore, the results of this study can be used as an important reference for the efficient progression of solar PV projects. Furthermore, the results have a high utility value because they enable the consideration and quantification of primary risk factors for solar PV projects.
5. Conclusions
The solar PV power market is growing rapidly and thus it is critical to establish efficient investment strategies, including adequate distribution of resources and risk management. The governments of many countries are implementing various support policies to expand solar PV power sources and increase investment in solar PV power. Investments in solar PV power account for more than 50% of all renewable energy investments and their sizes have greatly increased in recent years [1]. In this study, we developed evaluation indicators focusing on the financial factors for investment in solar PV power and derived the relative importance of these indicators. The evaluation indicators and the model developed can be used as a decision tool for future investments because they are appropriate for solar PV investments at the project level, unlike the models of previous studies that focused on macroeconomic parameters or technical factors. Furthermore, our indicators reflect the general characteristics of solar PV power projects and the distinct characteristics of policies through a survey of experts. The weights of the indicators are highly reliable because they were derived from data collected from a select group of experts using the fuzzy AHP methodology. In this study, we found that financial indicators have a higher weight than other indicators. Unlike this study, previous studies did not emphasize the composition of financial indicators. Therefore, it is difficult to directly compare with previous studies, but the analysis results of this study showed that the indicators of financial aspects such as profitability and exit strategy after initial investment are actually very high weights. This suggests that financial aspects should be considered in more detail in evaluations related to solar PV power project and policy.
We also quantified the relative importance of the indicators for different groups (power generation companies, financial investors, researchers) and compared the perceptual differences among stakeholders. Individual stakeholders may perceive the relative importance of each factor differently. The group analysis enables comparisons by quantifying the risks of each market participant. In group analysis, Economic factors showed the highest weight for all three stakeholders. However, the sub-factors of economic factors and the regulatory indicator showed considerable differences in perceptions. The financial investors assigned higher importance to financial factors than to business factors. The power generation companies however assigned higher importance to business factors than to other stakeholders. These differences show that perceptions of risk can vary greatly depending on the characteristics of each stakeholder. Analyzing these differences is important for developing solar PV projects. Therefore, the tool developed in this study can be used to establish efficient investment strategies or for decision-making as it enables the comparison of needs among various market participants.
Author Contributions
Conceptualization, B.K., J.K. (Juhan Kim) and J.K. (Jinsoo Kim); Data curation, B.K. and J.K. (Jinsoo Kim); Formal analysis, B.K. and J.K. (Jinsoo Kim); Methodology, J.K. (Juhan Kim) and J.K. (Jinsoo Kim); Supervision, J.K. (Jinsoo Kim); Writing—original draft, B.K. and J.K. (Jinsoo Kim); Writing—review & editing, J.K. (Jinsoo Kim).
Funding
This work was supported by the Human Resources Development program (No. 20194010201860) of the Korea Institute of Energy Technology Evaluation and Planning (KETEP) grant funded by the Korea government Ministry of Trade, Industry and Energy.
Conflicts of Interest
The authors declare no conflict of interest.
References
- International Energy Agency (IEA). Market Report Series: Renewables 2018; International Energy Agency: Paris, France, 2018. [Google Scholar]
- Michelez, J.; Rossi, N.; Blazquez, R.; Martin, J.M.; Mera, E.; Christensen, D.; Peineke, C.; Graf, K.; Lyon, D.; Stevens, G. Risk Quantification and Risk Management in Renewable Energy Projects; Altran, Arthur D. Little, Report Commissioned by IEA Renewable Energy Technology Deployment; Altran GmbH & Co. KG: Germany, 2011; Available online: http://iea-retd.org/wp-content/uploads/2011/11/RISK-IEA-RETD-2011-6.pdf (accessed on 21 May 2019).
- The Ministry of Trade, Industry and Energy (MOTIE). Renewable Energy 3020 Implementation Plan; The Ministry of Trade, Industry and Energy: Sejong, Korea, 2017.
- Financial Times. The fDi REPORT 2017 Global Greendield Investment Trends; The Financial Times Ltd.: London, UK, 2017. [Google Scholar]
- Akkas, O.P.; Erten, M.Y.; Cam, E.; Inanc, N. Optimal site selection for a solar power plant in the Central Anatolian Region of Turkey. Int. J. Photoenergy 2017, 2017, 7452715. [Google Scholar] [CrossRef]
- Al Garni, H.Z.; Awasthi, A. Solar PV power plant site selection using a GIS-AHP based approach with application in Saudi Arabia. Appl. Energy 2017, 206, 1225–1240. [Google Scholar]
- Al Garni, H.Z.; Awasthi, A. A fuzzy AHP and GIS-based approach to prioritize utility-scale solar PV sites in Saudi Arabia. In Proceedings of the 2017 IEEE International Conference on Systems, Man, and Cybernetics (SMC), Banff, AB, Canada, 5–8 October 2017; pp. 1244–1249. [Google Scholar]
- Asakereh, A.; Soleymani, M.; Sheikhdavoodi, M.J. A GIS-based Fuzzy-AHP method for the evaluation of solar farms locations: Case study in Khuzestan province, Iran. Sol. Energy 2017, 155, 342–353. [Google Scholar] [CrossRef]
- Díaz-Cuevas, P.; Camarillo-Naranjo, J.M.; Pérez-Alcántara, J.P. Relational spatial database and multi-criteria decision methods for selecting optimum locations for photovoltaic power plants in the province of Seville (southern Spain). Clean Technol. Environ. Policy 2018, 20, 1889–1902. [Google Scholar] [CrossRef]
- Kahraman, C.; Otay, I. Solar PV power plant location selection using a Z-fuzzy number based AHP. Int. J. Anal. Hierarchy Process 2018, 10. [Google Scholar] [CrossRef]
- Lee, A.; Kang, H.-Y.; Liou, Y.-J. A hybrid multiple-criteria decision-making approach for photovoltaic solar plant location selection. Sustainability 2017, 9, 184. [Google Scholar] [CrossRef]
- Merrouni, A.A.; Elalaoui, F.E.; Mezrhab, A.; Mezrhab, A.; Ghennioui, A. Large scale PV sites selection by combining GIS and Analytical Hierarchy Process. Case study: Eastern Morocco. Renew. Energy 2018, 119, 863–873. [Google Scholar] [CrossRef]
- Noorollahi, E.; Fadai, D.; Akbarpour Shirazi, M.; Ghodsipour, S. Land suitability analysis for solar farms exploitation using GIS and fuzzy analytic hierarchy process (FAHP)—A case study of Iran. Energies 2016, 9, 643. [Google Scholar] [CrossRef]
- Ozdemir, S.; Sahin, G. Multi-criteria decision-making in the location selection for a solar PV power plant using AHP. Measurement 2018, 129, 218–226. [Google Scholar] [CrossRef]
- Samanlioglu, F.; Ayağ, Z. A fuzzy AHP-PROMETHEE II approach for evaluation of solar power plant location alternatives in Turkey. J. Intell. Fuzzy Syst. 2017, 33, 859–871. [Google Scholar] [CrossRef]
- Sánchez-Lozano, J.M.; Teruel-Solano, J.; Soto-Elvira, P.L.; García-Cascales, M.S. Geographical Information Systems (GIS) and Multi-Criteria Decision Making (MCDM) methods for the evaluation of solar farms locations: Case study in south-eastern Spain. Renew. Sustain. Energy Rev. 2013, 24, 544–556. [Google Scholar] [CrossRef]
- Vafaeipour, M.; Zolfani, S.H.; Varzandeh, M.H.M.; Derakhti, A.; Eshkalag, M.K. Assessment of regions priority for implementation of solar projects in Iran: New application of a hybrid multi-criteria decision making approach. Energy Convers. Manag. 2014, 86, 653–663. [Google Scholar] [CrossRef]
- Ahmad, S.; Tahar, R.M. Selection of renewable energy sources for sustainable development of electricity generation system using analytic hierarchy process: A case of Malaysia. Renew. Energy 2014, 63, 458–466. [Google Scholar] [CrossRef]
- Guerrero-Liquet, G.; Sánchez-Lozano, J.; García-Cascales, M.; Lamata, M.; Verdegay, J. Decision-making for risk management in sustainable renewable energy facilities: A case study in the Dominican republic. Sustainability 2016, 8, 455. [Google Scholar] [CrossRef]
- Phillips, J. Determining the sustainability of large-scale photovoltaic solar power plants. Renew. Sustain. Energy Rev. 2013, 27, 435–444. [Google Scholar] [CrossRef]
- Sindhu, S.; Nehra, V.; Luthra, S. Solar energy deployment for sustainable future of India: Hybrid SWOC-AHP analysis. Renew. Sustain. Energy Rev. 2017, 72, 1138–1151. [Google Scholar] [CrossRef]
- Balo, F.; Şağbanşua, L. The selection of the best solar panel for the photovoltaic system design by using AHP. Energy Procedia 2016, 100, 50–53. [Google Scholar] [CrossRef]
- Kuthanazhi, V.; Rao, A.B. Selection of photovoltaic modules for off-grid rural application based on analytical hierarchy process (AHP). In Proceedings of the 2012 38th IEEE Photovoltaic Specialists Conference, Austin, TX, USA, 3–8 June 2012; pp. 2888–2893. [Google Scholar]
- Sheikh, N.; Kocaoglu, D.F. A comprehensive assessment of solar photovoltaic technologies: Literature review. In Proceedings of the 2011 PICMET’11: Technology Management in the Energy Smart World (PICMET), Portland, OR, USA, 31 July–4 August 2011; pp. 1–11. [Google Scholar]
- Van de Kaa, G.; Rezaei, J.; Kamp, L.; de Winter, A. Photovoltaic technology selection: A fuzzy MCDM approach. Renew. Sustain. Energy Rev. 2014, 32, 662–670. [Google Scholar] [CrossRef]
- Aguilar, F.X.; Cai, Z. Exploratory analysis of prospects for renewable energy private investment in the US. Energy Econ. 2010, 32, 1245–1252. [Google Scholar] [CrossRef]
- Bolkesjø, T.F.; Eltvig, P.T.; Nygaard, E. An econometric analysis of support scheme effects on renewable energy investments in Europe. Energy Procedia 2014, 58, 2–8. [Google Scholar] [CrossRef]
- Cicea, C.; Marinescu, C.; Popa, I.; Dobrin, C. Environmental efficiency of investments in renewable energy: Comparative analysis at macroeconomic level. Renew. Sustain. Energy Rev. 2014, 30, 555–564. [Google Scholar] [CrossRef]
- Eyraud, L.; Clements, B.; Wane, A. Green investment: Trends and determinants. Energy Policy 2013, 60, 852–865. [Google Scholar] [CrossRef]
- Kilinc-Ata, N. The evaluation of renewable energy policies across EU countries and US states: An econometric approach. Energy Sustain. Dev. 2016, 31, 83–90. [Google Scholar] [CrossRef]
- Murovec, N.; Erker, R.S.; Prodan, I. Determinants of environmental investments: Testing the structural model. J. Clean. Prod. 2012, 37, 265–277. [Google Scholar] [CrossRef]
- Polzin, F.; Migendt, M.; Täube, F.A.; von Flotow, P. Public policy influence on renewable energy investments—A panel data study across OECD countries. Energy Policy 2015, 80, 98–111. [Google Scholar] [CrossRef]
- Keeley, A.R.; Ikeda, Y. Determinants of foreign direct investment in wind energy in developing countries. J. Clean. Prod. 2017, 161, 1451–1458. [Google Scholar] [CrossRef]
- Padmanathan, K.; Govindarajan, U.; Ramachandaramurthy, V.K. Multiple criteria decision making (MCDM) based economic analysis of solar PV system with respect to performance investigation for Indian market. Sustainability 2017, 9, 820. [Google Scholar] [CrossRef]
- Jun, L.; Rui, L.; Min, L.; Gu, J.-M.; Zhi, Z. The investment risk weight calculation of photovoltaic power projects based on improved multi-level analytical hierarchy process. In Proceedings of the IEEE PES Innovative Smart Grid Technologies, Tianjin, China, 21–24 May 2012; pp. 1–5. [Google Scholar]
- Nematollahi, O.; Kim, K.C. A feasibility study of solar energy in South Korea. Renew. Sustain. Energy Rev. 2017, 77, 566–579. [Google Scholar] [CrossRef]
- Nigim, K.; Munier, N.; Green, J. Pre-feasibility MCDM tools to aid communities in prioritizing local viable renewable energy sources. Renew. Energy 2004, 29, 1775–1791. [Google Scholar] [CrossRef]
- Sindhu, S.; Nehra, V.; Luthra, S. Investigation of feasibility study of solar farms deployment using hybrid AHP-TOPSIS analysis: Case study of India. Renew. Sustain. Energy Rev. 2017, 73, 496–511. [Google Scholar] [CrossRef]
- Keeley, A.R.; Matsumoto, K.I. Relative significance of determinants of foreign direct investment in wind and solar energy in developing countries–AHP analysis. Energy Policy 2018, 123, 337–348. [Google Scholar] [CrossRef]
- Keeley, A.R.; Matsumoto, K.I. Investors’ perspective on determinants of foreign direct investment in wind and solar energy in developing economies—Review and expert opinions. J. Clean. Prod. 2018, 179, 132–142. [Google Scholar] [CrossRef]
- Kim, J.; Lee, J.; Kim, B.; Kim, J. Raw material criticality assessment with weighted indicators: An application of fuzzy analytic hierarchy process. Resour. Policy 2019, 60, 225–233. [Google Scholar] [CrossRef]
- Özdağoğlu, A.; Özdağoğlu, G. Comparison of AHP and Fuzzy AHP for the Multi-Criteria Decision Making Processes with Linguistic Evaluations. İstanbul Ticaret Üniversitesi Fen Bilimleri Dergisi 2007, 6, 65–85. [Google Scholar]
- Saaty, T.L. The Analytic Hierarchy Process: Planning, Priority Setting, Resource Allocation; McGraw-Hill International Book Company: New York, NY, USA, 1980. [Google Scholar]
- Triantaphyllou, E.; Mann, S.H. Using the analytic hierarchy process for decision making in engineering applications: Some challenges. Int. J. Ind. Eng. Appl. Pract. 1995, 2, 35–44. [Google Scholar]
- Kahraman, C.; Cebeci, U.; Ruan, D. Multi-attribute comparison of catering service companies using fuzzy AHP: The case of Turkey. Int. J. Prod. Econ. 2004, 87, 171–184. [Google Scholar] [CrossRef]
- Korea Development Institute (KDI). Study on Multi-Criteria Analysis for Preliminary Feasibility Study (II); Korea Development Institute: Seoul, Korea, 2001. [Google Scholar]
- Kim, J.; Kim, J. Optimal Portfolio for LNG Importation in Korea Using a Two-Step Portfolio Model and a Fuzzy Analytic Hierarchy Process. Energies 2018, 11, 3049. [Google Scholar] [CrossRef]
- Mikhailov, L. Deriving priorities from fuzzy pairwise comparison judgements. Fuzzy Sets Syst. 2003, 134, 365–385. [Google Scholar] [CrossRef]
- Heo, E.; Kim, J.; Boo, K.-J. Analysis of the assessment factors for renewable energy dissemination program evaluation using fuzzy AHP. Renew. Sustain. Energy Rev. 2010, 14, 2214–2220. [Google Scholar] [CrossRef]
- Wang, Y.-M.; Luo, Y.; Hua, Z. On the extent analysis method for fuzzy AHP and its applications. Eur. J. Oper. Res. 2008, 186, 735–747. [Google Scholar] [CrossRef]
- Chang, D.-Y. Applications of the extent analysis method on fuzzy AHP. Eur. J. Oper. Res. 1996, 95, 649–655. [Google Scholar] [CrossRef]
- Golden, B.L.; Wasil, E.A.; Harker, P.T. The analytic hierarchy process. In Applications and Studies; Springer: Berlin/Heidelberg, Germany, 1989. [Google Scholar]
- Abdmouleh, Z.; Alammari, R.A.; Gastli, A. Review of policies encouraging renewable energy integration & best practices. Renew. Sustain. Energy Rev. 2015, 45, 249–262. [Google Scholar]
- Ang, G. Overcoming Barriers to International Investment in Clean Energy. In Debate the Issues: Investment; Love, P., Ed.; OECD Publishing: Paris, France, 2016; Available online: https://doi.org/10.1787/9789264242661-18-en (accessed on 21 May 2019).
- Jacobsson, S.; Lauber, V. The politics and policy of energy system transformation—Explaining the German diffusion of renewable energy technology. Energy Policy 2006, 34, 256–276. [Google Scholar] [CrossRef]
- Mourelatou, A.; Research, B.E.; Limited, C. Renewable Energies: Success Stories; Office for Official Publications of the European Communities: Copenhagen, Denmark, 2001; Available online: https://www.eea.europa.eu/ds _resolveuid/6SZ2DCA0UJ (accessed on 21 May 2019).
- Romano, A.A.; Scandurra, G.; Carfora, A.; Fodor, M. Renewable investments: The impact of green policies in developing and developed countries. Renew. Sustain. Energy Rev. 2017, 68, 738–747. [Google Scholar] [CrossRef]
- Aragonés-Beltrán, P.; Chaparro-González, F.; Pastor-Ferrando, J.-P.; Pla-Rubio, A. An AHP (Analytic Hierarchy Process)/ANP (Analytic Network Process)-based multi-criteria decision approach for the selection of solar-thermal power plant investment projects. Energy 2014, 66, 222–238. [Google Scholar] [CrossRef]
- Lee, A.H.; Chen, H.H.; Kang, H.-Y. Multi-criteria decision making on strategic selection of wind farms. Renew. Energy 2009, 34, 120–126. [Google Scholar] [CrossRef]
- Zhao, Z.; Huang, W. Multi-objective Decision-making on Wind Power Projects Based on AHP Method. In Proceedings of the 2011 International Conference on Computer Distributed Control and Intelligent Environmental Monitoring, Changsha, China, 19–20 February 2011; pp. 242–245. [Google Scholar]
- Painuly, J.P. Barriers to renewable energy penetration; a framework for analysis. Renew. Energy 2001, 24, 73–89. [Google Scholar] [CrossRef]
- Pîrlogea, C. Barriers to investment in energy from renewable sources. Econ. Ser. Manag. 2011, 14, 132–140. [Google Scholar]
- Reiche, D.; Bechberger, M. Policy differences in the promotion of renewable energies in the EU member states. Energy Policy 2004, 32, 843–849. [Google Scholar] [CrossRef]
- Çolak, M.; Kaya, İ. Prioritization of renewable energy alternatives by using an integrated fuzzy MCDM model: A real case application for Turkey. Renew. Sustain. Energy Rev. 2017, 80, 840–853. [Google Scholar] [CrossRef]
- Haddad, B.; Liazid, A.; Ferreira, P. A multi-criteria approach to rank renewables for the Algerian electricity system. Renew. Energy 2017, 107, 462–472. [Google Scholar] [CrossRef]
- San Cristóbal, J. Multi-criteria decision-making in the selection of a renewable energy project in spain: The Vikor method. Renew. Energy 2011, 36, 498–502. [Google Scholar] [CrossRef]
- Tasri, A.; Susilawati, A. Selection among renewable energy alternatives based on a fuzzy analytic hierarchy process in Indonesia. Sustain. Energy Technol. Assess. 2014, 7, 34–44. [Google Scholar] [CrossRef]
- Menanteau, P.; Finon, D.; Lamy, M.-L. Prices versus quantities: Choosing policies for promoting the development of renewable energy. Energy Policy 2003, 31, 799–812. [Google Scholar] [CrossRef]
- Kengpol, A.; Rontlaong, P.; Tuominen, M. Design of a decision support system for site selection using fuzzy AHP: A case study of solar power plant in north eastern parts of Thailand. In Proceedings of the 2012 PICMET’12: Technology Management for Emerging Technologies, Vancouver, BC, Canada, 29 July–2 August 2012; pp. 734–743. [Google Scholar]
- Cannemi, M.; García-Melón, M.; Aragonés-Beltrán, P.; Gómez-Navarro, T. Modeling decision making as a support tool for policy making on renewable energy development. Energy Policy 2014, 67, 127–137. [Google Scholar] [CrossRef]
- Alfaro, L.; Kalemli-Ozcan, S.; Volosovych, V. Why doesn’t capital flow from rich to poor countries? An empirical investigation. Rev. Econ. Stat. 2008, 90, 347–368. [Google Scholar] [CrossRef]
- Jha, S.K.; Puppala, H. Prospects of renewable energy sources in India: Prioritization of alternative sources in terms of Energy Index. Energy 2017, 127, 116–127. [Google Scholar] [CrossRef]
- Lyon, T.P.; Yin, H. Why do states adopt renewable portfolio standards?: An empirical investigation. Energy J. 2010, 31, 133–157. [Google Scholar] [CrossRef]
- Sovacool, B.K.; Nugent, D.; Gilbert, A. Construction cost overruns and electricity infrastructure: An unavoidable risk? Electr. J. 2014, 27, 112–120. [Google Scholar] [CrossRef]
- Sovacool, B.K.; Gilbert, A.; Nugent, D. An international comparative assessment of construction cost overruns for electricity infrastructure. Energy Res. Soc. Sci. 2014, 3, 152–160. [Google Scholar] [CrossRef]
- Agrawal, A. Risk mitigation strategies for renewable energy project financing. Strateg. Plan. Energy Environ. 2012, 32, 9–20. [Google Scholar] [CrossRef]
- Heo, E.; Kim, J.; Cho, S. Selecting hydrogen production methods using fuzzy analytic hierarchy process with opportunities, costs, and risks. Int. J. Hydrogen Energy 2012, 37, 17655–17662. [Google Scholar] [CrossRef]
Figure 1.
Triangular fuzzy number M.

Figure 2.
Intersection of and .

Figure 3.
Structural hierarchy diagram of solar PV investment evaluation indicators.

Figure 4.
Analysis results for the third layer.

Figure 5.
Analysis results for the first layer of each stakeholder group.

Figure 6.
Analysis results for policy factors by stakeholder group.

Figure 7.
Analysis results for economic factors by stakeholder group.

Figure 8.
Comparison of the third layer by stakeholder group.


Table 1.
Composition of indicators and related previous studies.
| Indicators | Previous Studies | ||
|---|---|---|---|
| Policy factors | Support policies | Direct subsidy from government | Eyraud, Clements and Wane [29], Keeley and Matsumoto [39], Keeley and Matsumoto [40], Abdmouleh, Alammari and Gastli [53], Ang [54], Jacobsson and Lauber [55] |
| Finance and tax support determinants | Murovec, Erker and Prodan [31], Keeley and Matsumoto [39], Keeley and Matsumoto [40], Mourelatou, Research and Limited [56], Romano, Scandurra, Carfora and Fodor [57], Aragonés-Beltrán, Chaparro-González, Pastor-Ferrando and Pla-Rubio [58], Lee, Chen and Kang [59], Zhao and Huang [60] | ||
| Political & social acceptance | Balo and Şağbanşua [22], Sindhu, Nehra and Luthra [38], Keeley and Matsumoto [39], Keeley and Matsumoto [40], Zhao and Huang [60], Painuly [61], Pîrlogea [62], Reiche and Bechberger [63], Çolak and Kaya [64], Haddad, Liazid and Ferreira [65] | ||
| Regulatory policies | Carbon regulatory policy determinants | Michelez, Rossi, Blazquez, Martin, Mera, Christensen, Peineke, Graf, Lyon and Stevens [2], Sindhu, Nehra and Luthra [38], Haddad, Liazid and Ferreira [65], San Cristóbal [66], Tasri and Susilawati [67] | |
| Renewables obligation | Michelez, Rossi, Blazquez, Martin, Mera, Christensen, Peineke, Graf, Lyon and Stevens [2], Keeley and Matsumoto [40], Romano, Scandurra, Carfora and Fodor [57], Menanteau, Finon and Lamy [68] | ||
| 29 Economic factors | Business risk factors | Project costs | Balo and Şağbanşua [22], Aragonés-Beltrán, Chaparro-González, Pastor-Ferrando and Pla-Rubio [58], Lee, Chen and Kang [59], Zhao and Huang [60], Çolak and Kaya [64], Haddad, Liazid and Ferreira [65], Kengpol, Rontlaong and Tuominen [69], Cannemi, García-Melón, Aragonés-Beltrán and Gómez-Navarro [70] |
| Completion risk | Michelez, Rossi, Blazquez, Martin, Mera, Christensen, Peineke, Graf, Lyon and Stevens [2], Balo and Şağbanşua [22], Aragonés-Beltrán, Chaparro-González, Pastor-Ferrando and Pla-Rubio [58], Lee, Chen and Kang [59] | ||
| Market risk for electricity prices and structures | Balo and Şağbanşua [22], Eyraud, Clements and Wane [29], Aragonés-Beltrán, Chaparro-González, Pastor-Ferrando and Pla-Rubio [58], Haddad, Liazid and Ferreira [65] | ||
| Financial factors | Profitability | Michelez, Rossi, Blazquez, Martin, Mera, Christensen, Peineke, Graf, Lyon and Stevens [2], Nigim, Munier and Green [37], Çolak and Kaya [64], Tasri and Susilawati [67], Cannemi, García-Melón, Aragonés-Beltrán and Gómez-Navarro [70] | |
| Access to finance | Keeley and Matsumoto [39], Keeley and Matsumoto [40], Aragonés-Beltrán, Chaparro-González, Pastor-Ferrando and Pla-Rubio [58], Painuly [61], Çolak and Kaya [64], Alfaro, Kalemli-Ozcan and Volosovych [71] | ||
| Exit strategy after initial investment | No previous study | ||
| Technical factors | Technical factors | Operation risk | Balo and Şağbanşua [22], Aragonés-Beltrán, Chaparro-González, Pastor-Ferrando and Pla-Rubio [58], Çolak and Kaya [64], Haddad, Liazid and Ferreira [65], Tasri and Susilawati [67], Jha and Puppala [72] |
| Technological maturity | Balo and Şağbanşua [22], Aragonés-Beltrán, Chaparro-González, Pastor-Ferrando and Pla-Rubio [58], Lee, Chen and Kang [59], Haddad, Liazid and Ferreira [65] | ||
Table 2.
Components of the first layer.
| Main Categories | Description |
|---|---|
| Policy factors | Policy factors refer to policies that are directly or indirectly related to the expansion of solar PV power. They are composed of support and regulatory policy determinants. |
| Economic factors | Economic factors refer to the financial cost and profit of the solar PV power sources. They are composed of business risk factors related to the direct risks of the project and the financial factors for evaluating the economic value of the project. |
| Technical factors | Technical factors refer to the technical characteristics in terms of the operation of a solar PV power project. They are composed of operation risks related to the characteristics of solar PV power dependent on natural forces and the technical maturity of solar PV power. |
Table 3.
Indicators of policy factors and descriptions.
| First Layer | Second Layer | Third Layer | Description |
|---|---|---|---|
| Policy factors | Support policies | Direct subsidy from government | The central or local government provides cash or in-kind supports according to the notified ratio based on the laws for houses, facilities, and general businesses using renewable energy sources (solar PV). |
| Financial and tax support | This system supports the expansion of renewable energy sources (solar PV) through funding (except direct subsidy) and direct or indirect tax benefits. Representative financial and tax support determinants related to renewable energy include loan support system, tax credit, and accelerated depreciation. | ||
| Political & social acceptance | Sustainability and intensity of regulatory improvement and social acceptability for legal procedures and regulations of the energy industry to promote the supply of renewable energy (solar PV). This indicator evaluates the political and social acceptance of renewable energy. | ||
| Regulatory policies | Carbon regulatory policy determinants | This system means billing and regulations for carbon emissions from power generation sources. The basis of this system is various regulatory and promoting factors that are considered in market participation. The more intense a regulatory policy is, the higher the ease of supply for environmentally friendly power sources becomes. | |
| Renewables obligation | This system imposes obligatory renewable energy amount above a certain value through laws or enforcement decree for related stakeholders (mainly suppliers) of renewable energy (solar PV). The investment environment for specific power generation sources can be made easy by allocating a quota for each renewable energy source. |
Table 4.
Indicators for economic factors and descriptions.
| First Layer | Second Layer | Third Layer | Description |
|---|---|---|---|
| Economic factors | Business risk factors | Project costs (Startup costs, direct investment cost, O&M cost) |
|
| Completion risk |
| ||
| Market risk for electricity prices and structures |
| ||
| Financial factors | Profitability |
| |
| Access to finance |
| ||
| Exit strategy after initial investment |
|
Table 5.
Indicators and descriptions of technical factors.
| First Layer | Second Layer | Third Layer | Description |
|---|---|---|---|
| Technical factors | Technical factors | Operational risks |
|
| Technological maturity |
|
Table 6.
Number of respondents and consistency analysis result.
| Classification of AHP Respondents by Organization | ||||
|---|---|---|---|---|
| Financial Investors | Researchers | Power Generation Companies | Total | |
| Number of respondents (persons) | 21 | 19 | 34 | 74 |
| Number of respondents with CR < 0.15 (persons) | 10 | 11 | 14 | 35 |
| Consistency passing ratio | 47.62% | 57.89% | 41.18% | 47.30% |
Table 7.
Fuzzy AHP result.
| Policy Factors | Economic Factors | Technical Factors | |||||||
|---|---|---|---|---|---|---|---|---|---|
| 0.1626 | 0.71757 | 0.1257 | |||||||
| Support Policies | Regulatory Policies | Business Risk Factors | Financial Factors | Technical Factors | |||||
| 0.8143 | 0.1857 | 0.2005 | 0.7995 | 1 | |||||
| Direct subsidy from government | 0.5984 | Carbon regulatory policy determinants | 0.2313 | Project costs | 0.5854 | Profitability | 0.7743 | Operation risk | 0.6038 |
| Finance and tax support determinant | 0.2086 | Renewables obligation | 0.7687 | Completion risk | 0.1796 | Access to finance | 0.0752 | Technological maturity | 0.3962 |
| Political & social acceptance | 0.1930 | Market risk for electricity price and structure | 0.2350 | Exit strategy after initial investment | 0.1505 | ||||
© 2019 by the authors. Licensee MDPI, Basel, Switzerland. This article is an open access article distributed under the terms and conditions of the Creative Commons Attribution (CC BY) license (http://creativecommons.org/licenses/by/4.0/).
Share and Cite
MDPI and ACS Style
Kim, B.; Kim, J.; Kim, J. Evaluation Model for Investment in Solar Photovoltaic Power Generation Using Fuzzy Analytic Hierarchy Process. Sustainability 2019, 11, 2905. https://doi.org/10.3390/su11102905
AMA Style
Kim B, Kim J, Kim J. Evaluation Model for Investment in Solar Photovoltaic Power Generation Using Fuzzy Analytic Hierarchy Process. Sustainability. 2019; 11(10):2905. https://doi.org/10.3390/su11102905
Chicago/Turabian StyleKim, BumChoong, Juhan Kim, and Jinsoo Kim. 2019. "Evaluation Model for Investment in Solar Photovoltaic Power Generation Using Fuzzy Analytic Hierarchy Process" Sustainability 11, no. 10: 2905. https://doi.org/10.3390/su11102905
Note that from the first issue of 2016, this journal uses article numbers instead of page numbers. See further details here.