Abstract
Food security in Sub-Saharan Africa (SSA) is dependent on complex networks of interconnected actors and the flows of resources (biomass, capital) and information among them. However, the degree to which actors and value chains of different crops are in fact interconnected and their current systemic influence on food security are unclear. Therefore, the concept of “value webs” to better capture the complexity within the networks emerges. Biomass-based value webs of selected crops in Ghana, Nigeria, and Ethiopia are modeled using the systems analysis software iMODELER and by eliciting factors as well as their interconnections through participatory stakeholder workshops. Furthermore, a generic model was created compiling the country models to identify overarching system dynamics with supporting and hindering factors impacting food security in SSA. Findings from the country models show highly complex value webs, suggesting that the predominant value chain approach may oversimplify actual structures and resource flows in real life settings. However, few interconnections within the value webs link the actors and flows of different crops, contradicting predictions emerging from other research. Results from the generic model allow for a critical reflection on the relation between value web dynamics and food security policy in SSA. Current national and regional policy trends targeting market integration, mechanization, and reduction of post-harvest losses are supported by model results.
1. Introduction
Improving food security in Sub-Saharan Africa (SSA) is central to the achievement of objectives behind the Malabo Declaration [1], the Sustainable Development Goals (SDGs) [2], and Africa’s Agenda 2063 [3]. There are significant gains to be made before achieving these goals, however, as SSA continues to have the highest proportion of food-insecure people of any region globally at 23% undernourished in 2016, the situation having worsened since 2010 [4]. In addition, according to the latest progress report on achieving the SDGs [5], thirteen countries in SSA experienced high or moderately high domestic food prices relative to historic levels in 2016, reducing people’s access to food.
The role of agricultural systems in improving food security in SSA is undeniable and has long been the focus of policy efforts, e.g., [6]. Agriculture is the most important sector for African economies. On average, it accounts for more than 25% of GDP [7], employs around 57% of the continent’s total labor force, and constitutes the primary source of income for 90% of the rural population [8]. The potential for development and inclusive growth within this sector thus represents an opportunity for both increasing the availability of food as well as generating incomes through food and non-food biomass-based products [9,10,11]. Because biomass is a renewable resource, its increasing role is promising for sustainable growth and food security [11,12].
Biomass can be classified into food, feed, sources of energy, and raw materials for industry, the increasing demand of which represents both a unique opportunity and critical challenge for SSA countries [11]. Although there is an abundance of both potential human labor and natural resources that can be leveraged for economic growth in the region [13,14,15], demand for biomass-based products is also closely tied to food security through the crops from which they are derived. Food security, in turn, is embedded within a network of other overarching factors such as health, welfare, employment, income, environmental degradation, markets, and culture [9,10,16].
Policy interventions for increasing food security are always parts of complex systems and must face inevitable trade-offs and unintended effects. The need to understand these systems is thus crucial, particularly with a predicted increase in demand and economic integration of biomass-based products and the potential for newly emerging interconnections in value chains [11,12]. The flows of goods and capital between actors specializing in agricultural production, collecting, transport, storage, processing, sale, and consumption are expected to merge and form more complex systems with feedback loops and non-linear interactions [11]. Rather than value chains, the complexity described may require adopting the concept of a biomass-based value web, defined by Virchow et al. [11] (p. 229) as, “…the production and processing of both food and non-food biomass from locally adapted crops within flexible, efficient and sustainable production, processing, trading and consumption systems”.
Despite the expected utility of the concept of value webs and its emergence and establishment in business-oriented fields [17,18,19,20], there is only limited empirical evidence to support its adoption in the context of biomass production and food security, though this is growing. Poku et al. [21] mapped the cassava value web in Ghana and Adeyemo et al. [22] that of Nigeria, with findings from both works suggesting that increased actor coordination and market integration could have positive outcomes for food security. Scheiterle et al. [23] use systems modeling and in-depth interviews to examine the case of sugarcane in Brazil’s bioeconomy. The concept and method proved effective at identifying a need for targeted incentives and improvement in terms of linking knowledge institutions with industry. Loos et al. [24] look at the demand and market integration of natural fibers from plantain residue from a value web perspective in Ghana, while Lin et al. [25] perform a similar analysis focusing on the bamboo sector in Ethiopia. Neumann et al. [26] examine the systemic effects of changes in labor and land productivity in relation to money flows and food security.
The research described demonstrates that a more holistic understanding of actors and their interconnections using the value web approach is possible and can allow for evidence-based policy recommendations. However, the use of value chains remains more prevalent [27,28,29,30,31,32]. Furthermore, the aforementioned studies have focused only on one crop, disregarding the emerging potential of more integrated multicrop value webs leveraging demand for food, feed, energy, or industrial material [11]. Along with limiting the concept of value webs to single crops, research has also been limited only to primary actors and flows of resources.
Our research thus aims to address these gaps by using an explorative systems modeling approach to determine the degree to which complex multicrop biomass-based value web structures have formed and their influence on food security. To the authors’ knowledge, there has been no prior research using a participatory causal systems modeling approach to map and analyze multicrop biomass-based value webs in relation to food security.
The research presented here is thus guided by the following key questions: (1) Are biomass-based value webs a more appropriate conceptualization of exchanges among actors than traditional value chains? (2) Are there interactions among factors describing multicrop value webs and to what degree are they integrated? These two research questions are addressed by the creation of country-specific value webs for Ghana, Nigeria, and Ethiopia. A third research question is addressed by merging the individual country models into a generic SSA model and further analyzing it through the lens of food security: (3) What are the current supporting and hindering factors within biomass-based value webs that influence food security across SSA, and how do they relate to current policy efforts?
Based on prior research [23,24,25], we expect the concept of the value web to perform well in terms of revealing otherwise neglected interactions and the complexity of interconnections among actors and flows. We aim to test the hypothesis that a greater integration of value web factors across crops has occurred. This is a reasonable assumption in light of increasing demand for multipurpose biomass uses and because a greater integration of resource and information flows and actors should improve market efficiency. The relations between specific factors within the value webs in terms of supporting or hindering progress towards food security in relation to current policy is unknown. It is crucial to both create baselines and generate data that can be used for future monitoring and evaluation [33,34], as well as determine the causal effect of factors that support or hinder food security and their relation to current or potential policy options across SSA. By using an explorative modeling approach driven by stakeholder knowledge, we aim to produce such evidence.
2. Methods
2.1. Participatory Systems Analysis
The systems analysis software iMODELER [35] is used to create qualitative systems models of biomass-based value webs in relation to food security. First, participatory stakeholder workshops were conducted in Ghana, Nigeria, and Ethiopia to describe the factors (factor is the terminology used for iMODELER—it is synonymous with node or variable in other systems modeling approaches) and interconnections of their respective national biomass-based value webs. Mapping causal connections between key factors identified in the workshops provides insight regarding the degree to which value chains of selected crops used for food and non-food products have become interconnected into value webs. These country models are aggregated to allow for the creation of a generic model to provide insight into the impacts of policy options for food security across SSA. The influence of overarching supporting and hindering factors on food availability and access are identified through systems modeling. Lastly, the generic model results are compared to expert rankings to better understand the relations between model output and current policy trends.
2.2. Case Study Countries
The biomass-based value webs of Ghana, Nigeria, and Ethiopia were selected for the systems modeling analysis (Figure 1). The selection of these African case study countries is based on a combination of three criteria: (1) high potential for biomass production, (2) prevalence of hunger, and (3) number of agro-food companies and markets. Large swathes of Ghana and Nigeria are within the Sudanian Savanna zone that crosses the African continent in an East–West direction directly south of the Sahelian zone and is characterized by ideal climatic conditions for biomass production. Likewise, the extensive agroforestry systems and bamboo market of Ethiopia also have high potential for an increased role in improving food security in SSA [28,36].
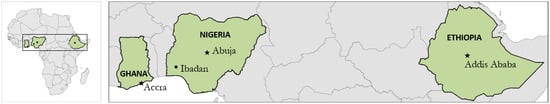
Figure 1.
Sub-Saharan African case study countries. Participatory stakeholder workshops were conducted in Accra, Ghana; Ibadan, Nigeria; and Addis Ababa, Ethiopia to create the biomass-based value web models.
These three Sub-Saharan African countries continue to suffer from food insecurity despite sharing high rates of overall national economic growth (averages of 6.24%, 9.02%, and 6.6% annual percentage GDP growth rate 2000–2017, respectively) [37]. In the Global Food Security Index rankings of 113 countries [38], Ghana ranks 76th overall, while Nigeria and Ethiopia are at 92nd and 99th, respectively, with significantly poorer ranks related to food access rather than food availability in all three countries. However, there is a high potential for benefiting from increasing demand in biomass-based products since the agricultural sectors account for 23%, 24%, and 46% of total GDP in Ghana, Nigeria, and Ethiopia, respectively [29,39], with a growing proportion derived from non-food biomass products [9]. Significant investments in the countries’ agricultural sectors along with an increasing number of active agro-food companies increase the need for inclusive policy options with an emphasis on food security [9].
The value webs of Ghana and Nigeria included maize, plantain, and cassava, and in Ethiopia, maize, enset, and bamboo. These crops, despite differences such as seasonal cycles, nutritional value, and cultural importance, can be considered the most important crops in terms of their availability for consumption and ability to generate income in the case study countries, considering both food and non-food uses [29,31,32,40].
2.3. Biomass-Based Value Web Modeling
2.3.1. Country Models: Ghana, Nigeria, and Ethiopia
Two 2-day workshops were conducted in Ghana (Accra) and Ethiopia (Addis Ababa), and one in Nigeria (Ibadan), in the period between 2014 and 2017. The three-year research process allowed for iterative methodological adjustment based on stakeholder feedback and data analysis following each workshop, which consisted of between 10 and 20 stakeholders. Stakeholders remained in contact regarding data analysis, and reviews of past findings were presented during follow-up workshops. Participants were invited through local partners and by exploiting existing institutional networks in an effort to capture a diversity of stakeholder perspectives. A wide breadth of knowledge was drawn from, representing farmers’ associations, ministries of food and agriculture, food research institutes, food marketing institutions, food policy programs, seed enterprises, NGOs, and university institutes, among others.
Two different 2-stage approaches were applied to adequately develop the models through participation of the invited stakeholders. Most participants were retained for the second stage of model creation, although some changes in stakeholders present did occur. In Ethiopia, the second workshop was used to continue building and elaborating the model generated during the first workshop. In Ghana, the second workshop used a model with a reduced set of factors from the first workshop as a starting point and was not limited to the prior three model crops. There were therefore two separate models describing the value web of Ghana, one crop-specific (Ghana 1) and one generalized (Ghana 2), as well as one model each from Nigeria and Ethiopia (see Appendix A).
It should be noted that the discrepancies in approaches to model creation reflect a research design for model building that was both explorative and pragmatic in terms of answering the research questions. Such a design was necessary given the novelty of the research approach and corresponding lack of best-practice methodological evidence on which it could otherwise be based. Thus, different approaches were used in order to exclude the possibility of biased results from a single constant yet potentially flawed methodology. In Ethiopia, a higher degree of specificity in the model was achieved by further building on the same model in each workshop. It was hypothesized that revealing any interconnections among crops within the value web may be dependent on such specificity. The second model in Ghana (Ghana 2) was created without limiting stakeholder input to specific crops, to likewise test the hypothesis that the value web may yield different findings.
The iMODELER software allows for the directional connection of factors to represent causality by using the basic question of “What (may) lead(s) to more or less of the factor now or in the future?” [41]. By starting with the target factors of food security, availability, and access, the workshop participants were asked by a moderator to consider what leads to more and what leads to less of these targets, while considering actors and flows of biomass, capital, and information.
Accordingly, the modeling starts with general factors and connections that are further detailed in the following modeling steps (Figure 2).
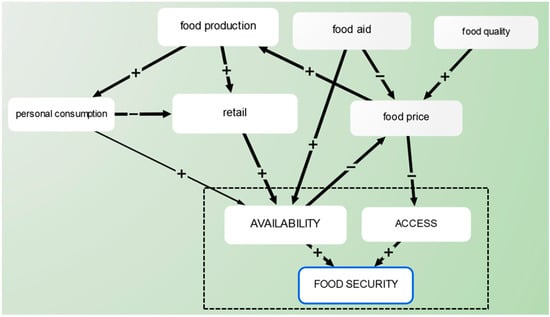
Figure 2.
Example of factors and factor connections leading to food security. The dashed box includes pre-existing targets into which relevant causal factors could be connected. Such causal factors were added to the model in a step-wise process based on inputs from workshop participants.
Here, for example, an increase in food production leads to more retail, which leads to more (food) availability. Each connection is evaluated only on its immediate connections, therefore rather than attempting to logically create flows, they emerge through the sum of individual connections [29]. For example, an increase in food aid leads to less (lower) food price, and a higher food price leads to less access.
Throughout the workshops, the models were projected onto a screen and new factors and connections were added by a moderator. Stakeholder discussion and agreement allowed for continuous expansion until input for possible further causal connections was exhausted. Through the process of consensus and exhaustive “tracing backward” from food security, the factors and connections were completed. The models created in the stakeholder workshops were finalized through a desk-top validation to check for erroneous connections and factor names. By visually examining and tracing the connections among factors representing actors and flows of the crops included in the modeling, the degree to which the individual value chains are in fact integrated within a value web system is determined.
2.3.2. Generic Model: Sub-Saharan Africa
The original country models were aggregated into a generic model representing overarching factors and connections of SSA biomass-based value webs. The generic model describes and allows for an analysis of the current (generalized) system dynamics regarding supporting and hindering factors for food security. Rather than focusing on specific crops, it is based on the identification of cross-cutting factors for extraction from the country models. The participatory and explorative nature of the modeling led to a number of factors and connections that would not duly represent an aggregated SSA biomass-based value web. Therefore, a process of reducing the number of factors in the models was carried out using the three criteria of (1) relevance, (2) level of detail, and (3) redundancy.
Factors were extracted, grouped, and again subjected to possible removal based on relevance to food security and biomass production, resulting in 82 final factors. These were then used as the input for a matrix in order to map out all pre-existing causal connections from the country models and determine potential further connections. Because some of the factors from the country models are unique, there was no basis for any prior causal connection for these factors from the workshops, and therefore the authors’ judgment was relied upon. The factors and connections in the matrix were converted into iMODELER to create the generic model with 82 factors and 213 connections (Table 1).

Table 1.
Process steps for creating the generic model of Sub-Saharan Africa, based on factors from the four country models (with one from each of the two workshops in Ghana).
The generic model is analyzed using the qualitative systems analysis features of iMODELER to determine the influence of each factor within the web on the targets of availability and access leading to food security. iMODELER allows for the relative weighting of one factor on another based on the degree of causal influence between them. This means that the model does not assume that all factors and factor connections are equal in terms of causal importance, but rather, that they can be defined by stakeholder input.
Weights, when aggregated along a chain towards the target factors, provide a total value representative of that factor’s influence on the target. Total weight absolute value sums of 100 for factors that connect to or cause the same subsequent factor are assumed in this analysis. For example, both of the two incoming factors retail and food production are given an equal weight (50) in terms of (positive) causal influence regarding increasing availability. At only one hierarchical level, factor weights are equal to their influence on the target (Figure 3).
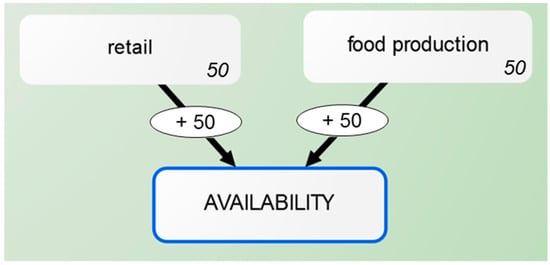
Figure 3.
Weights of retail and food production on the target availability are shown in the ovals embedded in the arrows and are both 50. Because there are no intermediary factors, the influence (shown within the rectangular factor boxes) of retail and food production on the target remain unchanged.
At subsequent hierarchical levels, the influence of any given factor (INF) on the target is multiplied by the weight(s) (divided by 100) of factors along the path towards the target. Because there can be many paths in a system, this is calculated as the aggregated sum of each individual path (X):
The starting factor weight (SW) is multiplied by the weights of subsequent factors along the path (W). This means that scores are both a function of (1) a factor’s distance in number of intermediary connections to the target factors, (2) weights of the intermediary connections, (3) sign (+/−) of these connections, and (4) number of paths to be summed.
Thus, at the next hierarchical level, the factors personal consumption, restricted access to markets, arable land, and challenge of seasonality are filtered through retail and food production before reaching availability. In this example, with only one path from each factor to the target, arable land was identified by stakeholders to be four times more important in terms of “causing” food production when compared to challenge of seasonality (Figure 4).
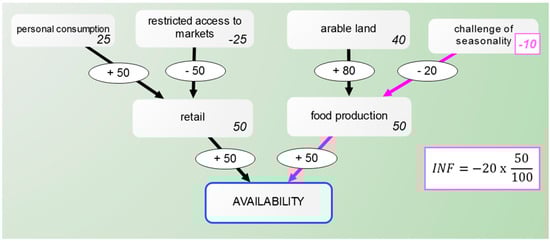
Figure 4.
Weights of all factors along the second hierarchical level are (left to right in ovals) 50, −50, 80, and −20, and their influence on availability is reduced by the weights of the intermediary factors retail (50) and food production (50) along the paths towards the target availability. The calculation of influence (INF) for the factor challenge of seasonality is provided in the rectangle on the right.
Weighting is conducted in the generic model by standardizing to sums of 100 for factors with multiple incoming connections (2 factors = 50 each, 3 factors = 33.3 each, etc.). For exogenous factors (factors with no incoming connections on the outer edges of the model), weights are reduced from 100 to either 75 or 50 depending on the weights originally identified by stakeholders during the creation of the country models and by determining the potential for missing factors.
To analyze the relative influence of the system’s factors in relation to food security, first all of the unique factors in the web that can be the focus of targeted policy interventions to improve food security are identified. These are labeled as either “supporting” or “hindering”, based on their known relation to food security. All other factors that are not readily manageable through policy intervention or largely represented by other considered factors are deemed “neutral”. For example, increase access to market for smallholders was identified as a supporting factor, post-harvest loss as a hindering factor, and transportation as a neutral factor. Although transportation could potentially be promoted through policy, it is labeled as neutral because it is both broad and already largely represented by the supporting factor road infrastructure. The five most influential and least influential supporting factors and the five most influential and least influential hindering factors with relation to the targets of availability and access (20 total factors) within the generic systems model were extracted and analyzed. This provides a relative description of their current influence within a generalized value web in relation to food security.
Results from the generic model were tested using a ranking exercise conducted by stakeholders of the most and least influential supporting and hindering factors for both availability and access. This allows for a reflection on relevant policy in SSA based on the generic model results. By asking stakeholders to rank the factors in terms of what is most important for supporting or hindering food security, their perception of the best options for policy strategies was elicited. The stakeholders are experts representing government and research entities dedicated to the agricultural sector of Ghana and familiar with the wider SSA context. Although the generic model is not limited to input from the workshops held in Ghana, the output strongly reflects the Ghanaian context of food security, allowing for a regional extrapolation of results.
3. Results and Interpretation
3.1. Multicrop Value Web Models
Extensive system models of the biomass-based value webs in the three case study countries were created. The participatory format and explorative approach yielded large models with a high degree of complexity of interconnections (Table 2). Differences among country models are a function of the national biomass-based value webs, the crops modeled, and the expertise of the stakeholders. Moreover, the Ethiopian model was expanded within an additional workshop, accounting for its larger size.
Table 2.
Number of factors and connections from the four models created for the three case study countries—Ghana, Nigeria, and Ethiopia.
The numerous factors with non-linear casual connections within the value web models suggest that the linear value chain concept may be an oversimplification. Thus, adopting a value web approach has merit in terms of describing the actual interconnections among actors and flows of matter, capital, and information as a basis for understanding complex problems like food security. Connections among crop-specific (e.g., maize) actors such as smallholders, collectors, processors, and consumers are interconnected and form feedback loops with food and non-food products. In the Ethiopian model alone, there are 18,564 loops, some incorporating as many as 15 different factors.
Despite the complexity of the models, findings show very few direct interconnections within the value webs describing different crops in the case study countries. The factors representing actors and flows of products for each crop are generally ramified within the models, with e.g., cassava smallholders, collectors, transporters, and processors in Nigeria practicing their livelihoods and limiting exchanges with other crop-specific actors. By assigning colors to factors directly relevant to the different crops and arranging the factors by clusters of connections, the cassava factors (a; white) stand alone and are mostly disconnected from those of other crops, as is the case for the internal interconnections of maize (b; yellow) and plantain (c; green) factors (Figure 5).
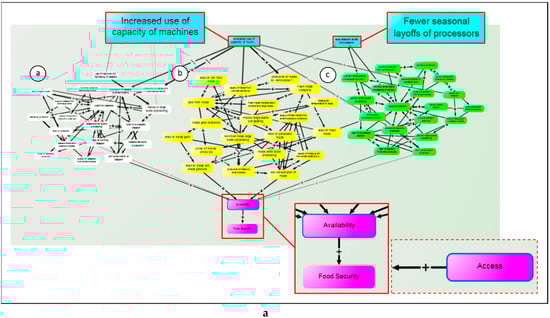
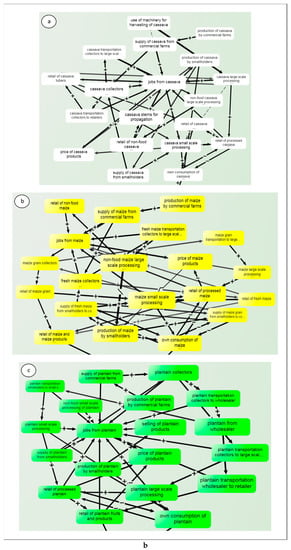
Figure 5.
Excerpt schema of Nigerian biomass-based value web with cassava ((a); white), maize ((b); yellow) and plantain ((c); green) factors leading to Availability. Access (dashed red box) also connects to food security in the model but has been filtered out from the display. Two non-crop-specific factors connect the otherwise ramified crop-specific value webs (blue), increased use of capacity of machines and fewer seasonal layoffs of processors. Factors and connections can be further explored in iMODELER using the link provided in the supplementary material.
The factors relevant to each crop are connected through more general supporting factors (blue) that would benefit webs of multiple crops. For example, increased use of capacity of machines can lead to increased production of all of the crops, while fewer seasonal layoffs of processors would influence jobs related to maize and plantain but is not connected to the cassava web because cassava allows for more flexible planting and harvesting times [31]. However, the majority of actors and flows pertain to crop-specific factors, exhibiting only sparse integration among crops.
The importance of such general overarching factors that do in fact connect across crops in the value webs should not be discounted. For example, the factor transportation infrastructure from the Ethiopian model is highly embedded in the system as it provides for smallholders, collectors, government agencies, enables export trade, and allows for increased market access for rural actors [42] (Figure 6). The importance of transportation and connectivity for SSA value webs is well documented, e.g., [21,43], and similar factors can also be found in the Ghanaian and Nigerian models.
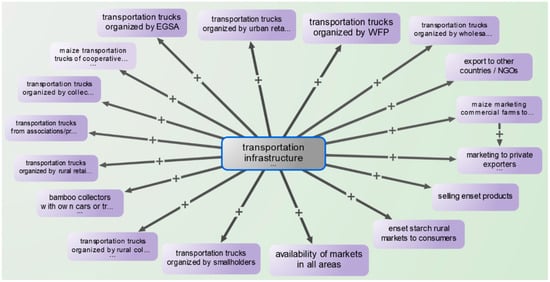
Figure 6.
Excerpt of the Ethiopian model with the factor transportation infrastructure and its 17 outgoing connections.
The country models provide a resource for further research or targeted interventions with specific components of the value webs (e.g., transportation infrastructure) while also representing a baseline for better understanding the systemic role of biomass in shifting national economies.
3.2. Generic Value Web Model and Policy Trends
The generic model represents the aggregated significant and non-crop-specific factors and connections from the country value webs in a systems model within which each factor’s degree of influence on food availability and access can be quantified. Because the generic model is originally derived from stakeholder input, determining the influence of factors and connections using iMODELER provides a description of their current influence within the value webs in relation to food security.
Enough similarity exists in the factors and flows of the country models to generalize, albeit with a significant reduction in detail, leaving the final generic model with 82 factors (including the three target factors availability of and access to food, as well as food security) and 213 connections. Excluding the three target factors, a total of 41 supporting factors, 17 hindering factors, and 21 neutral factors were identified. For both availability and access, the five supporting factors with the most influence and five supporting factors with the least influence (Table 3), as well as the five hindering factors with the most influence and five hindering factors with the least influence (Table 4), were extracted and interpreted.
Table 3.
Supporting factors with the most and least influence on availability and access.
Table 4.
Hindering factors with the most and least influence on availability and access.
Several patterns emerge from the model output of supporting factors. First, there are clear differences in the order of factors between availability and access. Only the factors food aid and streamline processes (i.e., improving the efficiency of exchanges among actors) are currently highly influential for both availability and access. Food aid was directly linked to availability and can act to reduce food prices. Although food aid can also reduce incomes for local market traders [44], the model recognizes a reduction in food prices as an improvement for food security, highlighting the need for contextual model interpretation. The factor streamline processes can lead to fewer losses during storage, transport, and retail and is highly embedded in the model, with nine direct connections.
The role of information for farmers is highly influential in the model for availability, as it can act to reduce losses and maximize profits by leveraging market prices. For access, the strength of reduced prices and increased incomes are illustrated by the factors increase export of commodities, implement subsidies, and improve food processing techniques. These three factors are some of the least influential for availability given that their effects on prices and incomes are only connected to food production through further indirect connections, as represented in the model.
The least influential supporting factors are generally those that are being prioritized within national and regional food security policy in SSA. Increasing exports is perhaps the most pervasive of the factors across national and regional policy documents, particularly with regard to increasing regional trade within Africa [3,14,45,46,47,48,49,50,51,52]. The roles of improve unique selling points of processed products along with improve food processing techniques are also specifically highlighted in policy briefs [50,53] and reflect the aspiration of greater market integration for smallholders and the desired shift from primarily subsistence to more commercial agriculture across SSA [1,3,45,50,53,54]. Likewise, market integration is often directly tied to the objective of promoting partnerships, particularly as a means of integrating smallholders into value webs [55] by bringing together farmers, agribusiness, and civil society, as laid out in the Malabo Declaration [1].
The least influential factors for access are perhaps even more related to current policy efforts, particularly with the push for increased market access and use of farm machinery [1,3,45,50,51,52,53,54,55,56]. The African Union Commission’s Agenda 2063 report [3] (p. 3) states under action point 13 that “the hand hoe will be banished by 2025 and the sector will be modern…”, and the latest report from the Malabo Montpellier Panel is entitle “Mechanized: Transforming Africa’s Agriculture Value Chains” [52]. At a national level, in both Ghana and Nigeria, mechanization is one explicit component of development policies, considered a major constraint to current agricultural productivity [56,57]. To a lesser extent, the roles of land title holdings for economic growth and increasing productivity are recognized [46,58], as well as the importance of farmer training [3,14,50].
Although there are fewer total hindering factors (n = 17), the degree of overlap is still significant between the most influential hindering factors for both availability and access, with four of the five factors shared (Table 4).
The hindering factors tend to represent direct losses associated with the lack of a physical abundance of food and income generated through the value webs. The only factors that are not shared as highly influential are impacts of weather extremes for availability and overpriced food for access, two factors directly implicated in a loss of production and inability to purchase, respectively. Overpriced food, similar to the supporting factor implement subsidies, is among the least influential for availability and most influential for access. This output is a result of the factor implement subsidies leading to less food price, which directly connects to access in the generic model. In fact, policies around subsidies in SSA are variable across countries, but there is a general call for moving away from most forms of subsidies as a means of achieving the general regional consensus of increased trade [46]. Their role, however, is still prominent in many SSA countries, with input subsidies in particular being a significant part of agricultural development policies [46].
Contrary to the supporting factors, the hindering factors with the most influence are generally those that are receiving the most recent policy attention. This is appropriate given that the hindering factors identified by experts represent the current situation and the most negatively influential factors should be mitigated. Post-harvest loss and challenge of seasonality are highly influential across both availability and access. The role of subsidies for minimizing the effects of overpriced food on consumers spiked across SSA following the food price crisis in 2007/2008, and these policies continue to be prominent across the region [46]. Likewise, post-harvest losses [1] (p. 3) and dealing with climate variability [1] (p. 5) are featured in recent policy documents.
The findings and interpretation were tested by subjecting the most and least supporting (Table 3) and hindering factors (Table 4) to a ranking exercise with stakeholders. When experts were asked to rank the most and least influential factors based on their current importance for either supporting or hindering efforts towards improved food security, a number of factors “flipped”, either from being highly influential in the model to lowly ranked in the workshop, or vice versa (Table 5).
Table 5.
Supporting and hindering factors for availability and access that are identified as either high influence in the model and of low importance for sustainable food security by expert stakeholders, or of low influence in the model and high importance by expert stakeholders.
Several highly influential factors in the model were judged to be of relatively low importance by the stakeholders when prioritizing efforts to improve food security. The factor food aid, for example, was highly influential in the model as it can directly increase availability and access, but it received a low rank of importance in the stakeholder exercise. This reflects both the lack of demand for food aid in Ghana and its perception by stakeholders as relatively unimportant for sustainable improvement of food security. This demonstrates the need for interpreting the output factors from the generic model as functions of direct and indirect influence rather than on the basis of the sustainable importance for effectuating change. Factors seen to have a more direct market impact such as implement subsidies, promote partnerships, improve unique selling point of processed products, improve food processing techniques, and increase access to market for smallholders were highly ranked by the stakeholders but of low influence in the model.
The experts agreed to a lack of agency in regard to certain factors, and therefore, a lack of current efforts regarding seasonality, weather, and to a certain degree losses at retail and thus gave related factors low rankings. Land use, transportation and prices were judged and prioritized as modifiable through policy intervention and given higher ranks. It is evident that while the models do not account for feasibility, the experts rely on more contextual and historic knowledge with consideration of behavioral and governmental agency.
4. Discussion
4.1. From Value Chains to Multicrop Value Webs
Highly complex value webs with, however, a lack of integration among crop-specific factors, are two principal findings demonstrated by the country models. The concept of a value web as a more realistic approximation of actual interconnections is supported. This adds to a growing body of evidence that simplistic and linear value chains may be inadequate in the context of actors and exchanges of food and non-food biomass [11,21,22,23,24,25,26]. The finding is also in line with predictions of increased complexity among actors and exchanges [11].
However, a lack of integration across crop-specific factors in the country models was surprising given the potential gains in efficiency and an increasing domestic and international demand for food and non-food biomass-based products. This suggests either that predictions made by [11,59] may overemphasize the degree of eventual integration or that such integration is yet to occur. It is unclear why this is the case, particularly given the potential benefit of increased efficiency. However, based on stakeholder input and understanding of the value webs in the case study countries, several theories can be posited. Because of the economic importance, reliability, and sheer size of the markets of the crops modelled, the value webs can accommodate a number of actors that are all able to make a profit without moving towards the diversification of biomass-derived income. Taking Ghana as an example, the value webs of cassava and maize have been described [29,31,43] and show a number of interlinked institutions and industries respective to each crop, with significant flows of money and co-dependent actors. While this may be the case with other crops to some extent, there is less total available profit and thus less incentive for specialization. A further explanation involves the crops chosen for the modeling—they all play unique roles in their social-ecological systems and respective biomass economies, with relatively little overlap in terms of products made from multiple crops. Contrarily, the value webs of other crops, for example maize and wheat, can be connected through cereal processors [40]. Despite the current dynamics, the rapidly increasing demand for biomass in SSA, partly driven by new uses in the form of non-food or industrial products, could incentivize further interlinkages in the value webs [9,14,40]. However, growing markets with space for new actors do not necessarily require maximum efficiency for substantial profit, and thus the necessary incentive may only develop over time. Tracking these changes will be crucial for management decisions regarding cascading and circular uses of biomass for sustainable resource use [60] as well as monitoring and evaluation of policy options [31,33], and the country models provide useful baselines in this sense.
Furthermore, although crop-specific factors do not show significant integration, the models demand the consideration of more overarching factors that are often neglected but highly interlinked (e.g., processing capacity and transportation infrastructure). The findings here are not surprising given past research. Poku et al. [21] used a systems mapping approach for the cassava value web in Ghana and similarly found that highly connected factors such as road infrastructure and access to information by means of public services currently have pervasive effects on the cost of food and its availability. The ability of extreme weather and climate variability (particularly regarding seasonality) to undermine agricultural systems is also well understood [61,62] and emerged as an influential factor for food security in the generic model.
4.2. Generic Model Results and Food Security Policy in SSA
Overall, the generic model performed well and is interpretable in terms of mapping out the current landscape of supporting and hindering factors and their current influence as embedded within a larger biomass-based value web system. Although both availability of and access to food are problematic in the case study countries, scores from the Global Food Security Index [37] indicate that affordability, similar to access, is even more problematic than availability in Ghana, Nigeria, and Ethiopia. Based on these scores, it is likely that the supporting factors, particularly for access (Table 3), are currently misaligned within the actual value webs. In other words, the factors with the least current influence should be more emphasized in policy to effectuate future change. This is reasonable given that the model dynamics are based on stakeholder input describing the present realities within the countries and extrapolated to SSA. As opposed to attempting to leverage those factors that currently exert more direct influence, sustainable and transformative policy should rather be prioritized and weaker supporting factors bolstered. Therefore, efforts to increase their impact have the potential to improve food security by shifting the current dynamics of biomass-based value webs. Findings generally suggest that current overarching trends regarding efforts to improve food security in SSA are accordant with where resources are best allocated.
This interpretation is further supported by the expert ranking exercise (Table 5). There were fewer changes between model output of influence and expert determination of importance among hindering factors, but those factors that did change positions show the similar trend of representing current policy efforts. While the highly influential factors in the model represent general dynamics, the least influential factors as well as the ranking exercise tend to reflect current policies. Furthermore, the model does not account for feasibility, while the experts rely on more contextual and historic knowledge with a consideration of behavioral and governmental agency.
Several of the hindering factors (Table 4) demonstrate one limitation of generalizing across the diversity of SSA countries. The influence of “market queens”, a term from Ghana that represents women leaders who function essentially as cartels to skew market signals and limit market entrance, is high for both access and availability. Despite its specificity, the factor is included in the generic model to represent the prevalence of both price control and instability within markets across SSA [63]. Similarly, the factor mining (legal and illegal) is not a significant issue in Ethiopia but plays a role in soil and general environmental degradation in Ghana, Nigeria, and other SSA countries [64,65].
4.3. Model Limitations and Future Outlook
The findings, along with the model, should be considered generalized and descriptive of broad overall trends, whereas smaller scale spatial and temporal dynamics are often responsible for the effectiveness of programs and projects to improve food security [66]. While the process of creating the generic model was conducted to best capture trends across SSA, the original data in the form of stakeholder input originally represent Ghana, Nigeria, and Ethiopia. Nevertheless, the agro-ecology of these countries just south of the Sahel allows for potential increased agricultural production, and regional dynamics are therefore crucial for SSA food security.
Along with being generalized, both the model output in terms of influencing factors as well as the expert ranking exercise are inherently based on potentially biased stakeholder perceptions. For instance in Ghana, some research has shown that in the case of the “market queens”, their negative reputation is not entirely justified as they can also provide a social safety net [67], whereas their negative influence in the generic model was very high for both availability and access. In addition, it is possible that the influence of more insidious or slow-acting deleterious effects of the hindering factors in particular are underweighted. For example, neither country model workshop stakeholders nor the experts during the ranking exercise in Ghana weighted factors like corruption, mining, other land uses, and cultural barriers highly. While it is possible that the effects are relatively minor compared to other factors, it could also be that their undervaluation is a result of their effects being less salient.
Understanding what exactly accounts for the influence of specific factors within the generic model requires analyzing individual causal pathways. One determinant of factor influence within the models is a factor’s distance to the target factors (i.e., availability and access) in terms of number of intermediary connections. Although many intermediary connections with high weights could equate to more influence than few connections with low weights, in the generic model a greater distance on average resulted in reduced factor influence. The average distances in number of connections to the target for the five most influential supporting and hindering factors are 2.2 and 3.2, respectively, while the five least influential are 3.6 and 3.8, respectively. This is theoretically sound, as the hindering factor overpriced food, for example, more directly affects access, as opposed to mining or process inefficiencies. If this criterion of directness is a legitimate indicator of influence in actual biomass-based value webs as presented here, one way to increase the influence of the least influential supporting factors would be policy options that more directly link these factors to availability and access. For example, if the effects of promoting loans to smallholders or land title holdings can more directly influence access, then food security as a whole would be improved.
Determining best practices in this sense requires more focused and spatially explicit research. This is important when considering trade-offs in policy contexts. However, the utility of the models in terms of drawing out specific recommendations is challenging due to their size and complexity. For this purpose, model segments can be focused on or the models adjusted by adding, removing, or changing factors and connections based on context or new data. The biomass-based value webs for Ghana, Nigeria, and Ethiopia, as well as the generic model for SSA, are accessible in iMODELER through links provided as supplementary material, and their continued use and development is encouraged for specific research or policy agendas. Furthermore, all of the supporting and hindering factors in the generic model were identified by stakeholders from the case study countries and should therefore be closely considered in research or policy contexts designed at improving food security.
5. Conclusions
Findings suggest that the shift from a value chain to a value web perspective more accurately represents the actual interconnections of biomass actors and flows in SSA countries. However, there is currently a lack of integration among actors dealing with different crops, with interconnections in the models primarily due to overarching general factors. Results from a generic systems model suggest that current trends in efforts towards improving food security in SSA are at least nominally appropriate. This is based on the current dynamics of biomass-based value webs as identified by stakeholders in Ghana, Ethiopia, and Nigeria and compiled into a generic model for SSA. Specifically, results correspond to the policy trends of promoting increased access to and success within markets for smallholders as well as reducing the impacts of post-harvest losses and climate variability. Notwithstanding model assumptions and limitations, increasing the impact of supporting factors while mitigating those with the most current detrimental influence should make gains in this regard.
Future research should focus on the utility of the models or sub-sections of the models to inform specific research or policy queries. Duplication studies using other crops or scales below the national level should be conducted. These may result in different findings and would thus better position this research in terms of its contribution to understanding SSA biomass-based value webs. Furthermore, such studies could be useful for developing methodological and interpretative best practices. Lastly, the methods described could be replicated in the future to determine how value web dynamics change and the relation of these changes to policy initiatives such as increased mechanization and regional cooperation.
It will become increasingly important to consider a holistic range of factors to better understand complex potential trade-offs and plan for improved food security. The models should be viewed within the spatial-temporal context in which the data were acquired and as providing a baseline for inevitable future changes.
Author Contributions
Conceptualization, M.D., K.N., K.A., and C.T.; Data curation, C.C.A., M.D., and K.N.; Formal analysis, C.C.A. and M.D.; Funding acquisition, M.D.; Investigation, C.C.A., M.D., K.N., K.A., and C.T.; Methodology, C.C.A., M.D., and K.N.; Project administration, M.D.; Resources, M.D. and K.N.; Software, C.C.A. and K.N.; Supervision, M.D.; Visualization, C.C.A.; Writing—original draft, C.C.A.; Writing—review editing, C.C.A., M.D., K.N., K.A., and C.T.
Funding
This research was funded by the German Federal Ministry of Education and Research (BMBF) through the collaborative project “Improving food security in Africa through increased system productivity of biomass-based value webs (BiomassWeb)”. This project is part of the GlobE—Research for the Global Food Supply Programme (grant no. 031A258A).
Acknowledgments
The authors would like to thank all of the workshop participants and those who supported the project, as well as the German Federal Ministry of Education and Research (BMBF) for funding this research.
Conflicts of Interest
The authors declare no conflict of interest.
Appendix A
- Generic Model:http://www.imodeler.info/ro?key=CE7ubGF9etOpqrx2cp8JM2w
References
- African Union. Malabo Declaration on Accelerated Agricultural Growth and Transformation for Shared Prosperity and Improved Livelihoods; African Union: Malabo, Guinea Bissau, 2014; Available online: https://au.int/en/documents/20150617-2 (accessed on 11 May 2018).
- United Nations. Transforming Our World: The 2030 Agenda for Sustainable Development; Resolution Adopted by the General Assembly; United Nations: Rome, Italy, 2015. [Google Scholar]
- African Union Commission. Agenda 2063: The Africa We Want. Popular Version; African Union Commission: Addis Ababa, Ethiopia, 2015; Available online: https://au.int/en/Agenda2063/popular_version (accessed on 3 April 2018).
- FAO. Food and Agriculture: Driving Action across the 2030 Agenda for Sustainable Development; FAO: Rome, Italy, 2017; Available online: http://www.fao.org/sustainable-development-goals/news/detail-news/en/c/901768/ (accessed on 11 April 2018).
- United Nations Economic and Social Council. Progress towards the Sustainable Development Goals: Report of the Secretary-General; United Nations Economic and Social Council: New York, NY, USA, 2017; Available online: https://sustainabledevelopment.un.org/ (accessed on 26 July 2018).
- African Union. Maputo Declaration on Agriculture and Food Security in Africa. Maputo, Mozambique; African Union: Malabo, Guinea Bissau, 2003; Available online: http://www.nepad.org/resource/au-2003-maputo-declaration-agriculture-and-food-security (accessed on 14 July 2018).
- Alliance for a Green Revolution in Africa (AGRA). Africa Agriculture Status Report: Progress towards Agricultural Transformation in Africa; Alliance for a Green Revolution in Africa: Nairobi, Kenya, 2016; Available online: https://agra.org/aasr2016/ (accessed on 10 September 2018).
- Kanu, B.S.; Salami, A.O.; Numasawa, K. Inclusive growth: An imperative for African agriculture. Afr. J. Food Agric. Nutr. Dev. 2014, 14, 3. [Google Scholar]
- Allen, T.; Heinrigs, P. Emerging Opportunities in the West African Food Economy; OECD Publishing: Paris, France, 2016; Volume 1. [Google Scholar]
- Nebe, S. Bio-Based Economy in Europe: State of Play and Future Potential: Part 2 Summary of Position Papers Received in Response to the European Commission’s Public On-Line Consultation; European Commission: Brussels, Brussels, 2011. [Google Scholar] [CrossRef]
- Virchow, D.; Beuchelt, T.D.; Kuhn, A.; Denich, M. Biomass-based value webs: A novel perspective for emerging bioeconomies in Sub-Saharan Africa. In Technological and Institutional Innovations for Marginalized Smallholders in Agricultural Development; Springer: Cham, Switzerland, 2016; pp. 225–238. [Google Scholar] [CrossRef]
- El-Chichakli, B.; von Braun, J.; Lang, C.; Barben, D.; Philp, J. Policy: Five cornerstones of a global bioeconomy. Nat. News 2016, 535, 221. [Google Scholar] [CrossRef]
- Ahenkan, A.; Osei-Kojo, A. Achieving sustainable development in Africa: Progress, challenges and prospects. Int. J. Dev. Sustain. 2014, 3, 162–174. [Google Scholar]
- Hollinger, F.; Staatz, J.M. Agricultural Growth in West Africa: Market and Policy Drivers; FAO and AfDB: Rome, Italy, 2015; Available online: http://www.fao.org/policy-support/resources/resources-details/en/c/447562/ (accessed on 11 June 2018).
- Morris, M.; Binswanger-Mkhize, H.P.; Byerlee, D. Awakening Africa’s Sleeping Giant: Prospects for Commercial Agriculture in the Guinea Savannah Zone and Beyond; The World Bank: Washington, DC, USA, 2009. [Google Scholar] [CrossRef]
- Burchi, F.; Fanzo, J.; Frison, E. The role of food and nutrition system approaches in tackling hidden hunger. Int. J. Environ. Res. Public Health 2011, 8, 358–373. [Google Scholar] [CrossRef]
- Allee, V. Reconfiguring the value network. J. Bus. Strategy 2000, 21, 36–39. [Google Scholar] [CrossRef]
- Kelly, E.; Marchese, K. Supply chains and value webs. In Business Ecosystems Come of Age; Business Trends Series. Available online: https://www2.deloitte.com/content/dam/insights/us/articles/platform-strategy-new-level-business-trends/DUP_1048-Business-ecosystems-come-of-age_MASTER_FINAL.pdf (accessed on 11 May 2018).
- Smith, R.W.; Broxterman, W.E.; Murad, D.S. Understanding Value Webs as a New Business Modeling Tool: Capturing & Creating Value in Adhesives; The Adhesive & Sealant Council: Las Vegas, NV, USA, 2000. [Google Scholar]
- Stabell, C.B.; Fjeldstad, Ø.D. Configuring value for competitive advantage: On chains, shops, and networks. Strateg. Manag. J. 1998, 19, 413–437. [Google Scholar] [CrossRef]
- Poku, A.G.; Birner, R.; Gupta, S. Is Africa ready to develop a competitive bioeconomy? The case of the cassava value web in Ghana. J. Clean. Prod. 2018. [Google Scholar] [CrossRef]
- Adeyemo, T.A.; Abass, A.; Amaza, P.; Okoruwa, V.; Akinyosoye, V.; Salman, K.K. Increasing smallholders’ intensity in cassava value web: Effect on household food security in Southwest Nigeria. In Proceedings of the Conference on International Research on Food Security, Natural Resource Management and Rural Development, Organised by the Humboldt-Universitat, Berlin, Germany, 16–18 September 2015. [Google Scholar]
- Scheiterle, L.; Ulmer, A.; Birner, R.; Pyka, A. From commodity-based value chains to biomass-based value webs: The case of sugarcane in Brazil’s bioeconomy. J. Clean. Prod. 2018, 172, 3851–3863. [Google Scholar] [CrossRef]
- Loos, T.; Hoppe, M.; Dzomeku, B.; Scheiterle, L. The Potential of Plantain Residues for the Ghanaian Bioeconomy—Assessing the Current Fiber Value Web. Sustainability 2018, 10, 4825. [Google Scholar] [CrossRef]
- Lin, J.; Gupta, S.; Loos, T.K.; Birner, R. Opportunities and Challenges in the Ethiopian Bamboo Sector: A Market Analysis of the Bamboo-Based Value Web. Sustainability 2019, 11, 1644. [Google Scholar] [CrossRef]
- Neumann, K.; Anderson, C.C.; Denich, M. Food Security in Sub-Saharan Africa: An increase of labor productivity vs. an increase of land productivity. In preparation.
- Tortoe, C.; Quaye, W.; Akonor, P.T.; Oduro-Yeboah, C.; Buckman, E.S. Analysis of Plantain Biomass-Based Value Chain in Selected Regions in Ghana. Afr. J. Sci. Technol. Innov. Dev. 2019. submitted. [Google Scholar]
- Mekonnen, Z.; Worku, A.; Yohannes, T.; Alebachew, M.; Kassa, H. Bamboo Resources in Ethiopia: Their value chain and contribution to livelihoods. Ethnobot. Res. Appl. 2014, 12, 511–524. [Google Scholar] [CrossRef]
- Angelucci, F. Analysis of Incentives and Disincentives for Maize in Ghana; Technical Notes Series; MAFAP; FAO: Rome, Italy, 2012; Available online: http://www.fao.org/in-action/mafap/resources/detail/en/c/394295/ (accessed on 16 July 2018).
- Angelucci, F. Analysis of Incentives and Disincentives for Cassava in Ghana; Technical Notes Series; MAFAP; FAO: Rome, Italy, 2013; Available online: http://www.fao.org/in-action/mafap/resources/detail/en/c/394295/ (accessed on 21 July 2018).
- Ayanwale, A.B.; Fatunbi, A.O.; Ojo, M.P. Baseline Analysis of Plantain (Musa sp.) Value Chain in Southwest of Nigeria; FARA Research Report; FARA: Accra, Ghana, 2018; Volume 3, p. 84. [Google Scholar]
- Kassahun, T. Review of bamboo value chain in Ethiopia. Int. J. Afr. Soc. Cult. Tradit. 2014, 2, 52–67. [Google Scholar]
- Balié, J.; Nelgen, S. A Decade of Agriculture Policy Support in Sub-Saharan Africa. A Review of Selected Results of the Monitoring and Analysing Food and Agricultural Policies; MAFAP: Rome, Italy, 2016. [Google Scholar]
- Angelucci, F.; Balié, J.; Gourichon, H.; Mas Aparisi, A.; Witwer, M. Monitoring and Analysing Food and Agricultural Policies in Africa; FAO: Rome, Italy, 2013. [Google Scholar]
- Neumann, K. ‘Know why’ thinking as a new approach to systems thinking. Emerg. Complex. Organ. 2013, 15, 81–93. Available online: https://www.questia.com/library/journal/1P3-3115959041/know-why-thinking-as-a-new-approach-to-systems-thinking (accessed on 8 January 2018).
- The World Bank, World Bank National Accounts Data. GDP Growth (Annual %). 2017. [Data File]. Available online: https://data.worldbank.org/indicator/ny.gdp.mktp.kd.zg (accessed on 20 July 2018).
- Economist Intelligence Unit. Global food Security Index; Economist Intelligence Unit: London, UK, 2017; Available online: https://foodsecurityindex.eiu.com/ (accessed on 10 May 2018).
- FAO. FAO Statistical Yearbook 2014: Africa Food and Agriculture; FAO: Accra, Ghana, 2014; Available online: http://www.fao.org/economic/ess/ess-publications/ess-yearbook/en/#.W60jMmNoSUk (accessed on 11 June 2018).
- National Bureau of Statistics. Nigerian Gross Domestic Product Report: Q4 and Full Year 2017; National Bureau of Statistics: Abuja, Nigeria, 2017. Available online: http://nigerianstat.gov.ng/elibrary (accessed on 22 July 2018).
- Ministry of Food and Agriculture (MoFA). Agriculture in Ghana. Facts and Figures 2015; Ministry of Food and Agriculture: Statistics Research and Information Directorate (SRID): Accra, Ghana, 2016. Available online: http://mofa.gov.gh/site/# (accessed on 3 April 2018).
- Neumann, K.; Anderson, C.; Denich, M. Participatory, explorative, qualitative modeling: Application of the iMODELER software to assess trade-offs among the SDGs. Econ. Open-Access Open-Assess. E-J. 2018, 12, 1–19. [Google Scholar] [CrossRef]
- Akinwale, A.A. The menace of inadequate infrastructure in Nigeria. Afr. J. Sci. Technol. Innov. Dev. 2010, 2, 207–228. [Google Scholar]
- Tadesse, G.; Shively, G. Food aid, food prices, and producer disincentives in Ethiopia. Am. J. Agric. Econ. 2009, 91, 942–955. [Google Scholar] [CrossRef]
- OECD/UNDP/AfDB. African Economic Outlook 2014: Global Value Chains and Africa’s Industrialization; Organisation for Economic Co-operation and Development, United Nations Development Programme, African Development Bank: Tunis, Tunisia, 2014. [Google Scholar] [CrossRef]
- United Nations Economic Commission for Africa. Urbanization and Industrialization for Africa’s Transformation: Economic Report on Africa; United Nations: Addis Ababa, Ethiopia, 2017; Available online: https://www.uneca.org/publications/economic-report-africa-2017 (accessed on 5 May 2018).
- Alliance for a Green Revolution in Africa (AGRA). Business Pathways to the Future of Smallholder Farming in the Context of Transforming Value Chains; International Food Policy Research Institute Africa Agriculture Status Report 2017; AGRA: Nairobi, Kenya, 2017; Available online: https://agra.org/aasr2017/chapter-2/ (accessed on 29 June 2018).
- African Union Commission. Implementation Strategy and Roadmap to Achieve the 2025 Vision on CAADP; African Union: Addis Ababa, Ethiopia, 2014; Available online: http://www.nepad.org/resource/implementation-strategy-and-road-map-achieve-2025-vision-caadp (accessed on 18 July 2018).
- New Partnership for Africa’s Development (NEPAD). Agriculture in Africa: Transformation and Outlook; NEPAD: Pretoria, South Africa, 2014; Available online: http://www.nepad.org/resource/agriculture-africa-transformation-and-outlook (accessed on 13 July 2018).
- United Nations Economic Commission for Africa. Economic Report on Africa 2013: Making the Most of Africa’s Commodities: Industrializing for Growth, Jobs and Economic Transformation; United Nations: Addis Ababa, Ethiopia, 2013; Available online: https://repository.uneca.org/handle/10855/22095 (accessed on 7 July 2018).
- United Nations Economic Commission for Africa. Assessing Regional Integration in Africa VI: Harmonizing Policies to Transform the Trading Environment; United Nations: Addis Ababa, Ethiopia, 2013; Available online: https://repository.uneca.org/handle/10855/22176 (accessed on 7 July 2018).
- United Nations Economic Commission for Africa. Economic Report on Africa 2015—Industrializing through trade. Addis Ababa; United Nations: Addis Ababa, Ethiopia, 2015; Available online: https://repository.uneca.org/handle/10855/22767 (accessed on 7 July 2018).
- Malabo Montpellier Panel. Mechanized: Transforming Africa’s Agriculture Value Chains; Malabo Montpellier Panel: Dakar, Senegal, 2018; Available online: https://www.mamopanel.org/resources/reports-and-briefings/mechanized-transforming-africas-agriculture-value-/ (accessed on 2 July 2018).
- African Development Bank. African Development Report 2015: Growth, Poverty and Inequality Nexus: Overcoming Barriers to Sustainable Development; African Development Bank: Abidjan, Côte d’Ivoire, 2016; Available online: https://www.afdb.org/en/documents/document/african-development-report-2015-growth-poverty-and-inequality-nexus-overcoming-barriers-to-sustainable-development-89715/ (accessed on 19 May 2018).
- African Development Bank. African Economic Outlook 2018; African Development Bank: Tunis, Tunisia, 2018; Available online: https://www.afdb.org/en/knowledge/publications/african-economic-outlook/ (accessed on 21 July 2018).
- Badiane, O.; Ulimwengu, J. Africa Agriculture Status Report 2017. 2017. Available online: https://agra.org/aasr2017/ (accessed on 28 July 2018).
- Benin, S. Impact of Ghana’s agricultural mechanization services center program. Agric. Econ. 2015, 46, 103–117. [Google Scholar] [CrossRef]
- FAO. Mechanization for Rural Development: A Review of Patterns and Progress around the World; Integrated Crop Management: Rome, Italy, 2013; Volume 20. [Google Scholar]
- OECD/FAO. OECD-FAO Agricultural Outlook 2016-2025: Special Focus: Sub-Saharan Africa; OECD Publishing: Paris, France, 2016. [Google Scholar] [CrossRef]
- Von Braun, J. Addressing the food crisis: Governance, market functioning, and investment in public goods. Food Secur. 2009, 1, 9–15. [Google Scholar] [CrossRef]
- Carus, M.; Dammer, L. The Circular Bioeconomy—Concepts, Opportunities, and Limitations. Ind. Biotechnol. 2018, 14, 83–91. [Google Scholar] [CrossRef]
- Intergovernmental Panel on Climate Change (IPCC). Climate Change 2014—Impacts, Adaptation and Vulnerability: Food Security and Food Production Systems; Cambridge University Press: Cambridge, UK, 2014; A Report of the Intergovernmental Panel on Climate Change; IPCC: Cambridge, UK, 2014; Available online: http://www.ipcc.ch/report/ar5/wg2/ (accessed on 22 July 2018).
- Wheeler, T.; Von Braun, J. Climate change impacts on global food security. Science 2013, 341, 508–513. [Google Scholar] [CrossRef] [PubMed]
- Poulton, C.; Kydd, J.; Dorward, A. Overcoming market constraints on pro-poor agricultural growth in Sub-Saharan Africa. Dev. Policy Rev. 2006, 24, 243–277. [Google Scholar] [CrossRef]
- Hilson, G. Small-scale mining, poverty and economic development in sub-Saharan Africa: An overview. Resour. Policy 2009, 34, 1–5. [Google Scholar] [CrossRef]
- Reichl, C.; Schatz, M.; Zsak, G. World mining data. Miner. Prod. Inter-Natl. Organ. Comm. World Min. Congr. 2014, 32, 1–261. [Google Scholar]
- De Graaff, J.; Kessler, A.; Nibbering, J.W. Agriculture and food security in selected countries in Sub-Saharan Africa: Diversity in trends and opportunities. Food Secur. 2011, 3, 195–213. [Google Scholar] [CrossRef]
- Scheiterle, L.; Birner, R. Gender, knowledge and power: A case study of Market Queens in Ghana. In Proceedings of the 2018 Annual Meeting, Washington, DC, USA, 5–7 August 2018; No. 274125. Agricultural and Applied Economics Association: Washington, DC, USA, 2018. [Google Scholar]
© 2019 by the authors. Licensee MDPI, Basel, Switzerland. This article is an open access article distributed under the terms and conditions of the Creative Commons Attribution (CC BY) license (http://creativecommons.org/licenses/by/4.0/).