Firm Growth and R&D in the Korean Pharmaceutical Industry


1
Graduate School of Management of Technology, Korea University, 145, Anam-ro, Seongbuk-gu, Seoul 02841, Korea
2
Department of Industrial Management Engineering, Korea University, 145, Anam-ro, Seongbuk-gu, Seoul 02841, Korea
3
Division of Industrial Management Engineering, Korea University, 145, Anam-ro, Seongbuk-gu, Seoul 02841, Korea
*
Author to whom correspondence should be addressed.
Sustainability 2019, 11(10), 2865; https://doi.org/10.3390/su11102865
Submission received: 13 April 2019
/
Revised: 16 May 2019
/
Accepted: 17 May 2019
/
Published: 20 May 2019
(This article belongs to the Special Issue Innovation and the Development of Enterprises)
Abstract
:We explore the impact of research and development (R&D) on sales growth rate with firm-specific factors under the Korean pharmaceutical industry structure using listed Korea pharmaceutical company data from 2007 to 2018 with the quantile regression technique. We find that R&D intensity has a positive effect on firm growth rate while R&D scale a negative effect on the firm growth rate at the upper quantile, whereas the result is opposite at the lower quantile. Firm size has a mixed relationship with sales growth at the upper quantile, thus Gibrat’s law is rejected in the Korean pharmaceutical industry. Firm age has a negative relationship with the sales growth rate at the upper quantile, which shows the consistent result with previous research that young firms grow faster. Patent persistence has a negative relationship with sales growth at the upper quantile, while a positive effect at the lower quantile. We show that young firms and firms with high R&D intensity contribute to the high growth rate, while the relationship is not clear at the lower quantile. Therefore, policy implication in this research is that the government should pay attention to encouraging and supporting R&D investment activities and small firms as well as consider ways to enhance patent rights.
1. Introduction
Firm growth studies have been one of the central topics among many researchers [1]. Firm growth rates show heterogeneity across firms and are very hard to predict. For instance, growth regression shows a typically low or modest effect on firm growth rates [2]. Still, the progress of firm growth research has been limited [3]. The theoretical framework of firm growth dates back to Gibrat’s law of proportionate effect that growth rates are independent of firm size. An enormous amount of empirical studies tested the validity of Gibrat’s law but delivered mixed evidence [4]. Recently, empirical research on the relationship between innovation and firm growth has been carried out [5]. Innovation has been considered as a critical driver for firm growth across industries. However, empirical studies have shown mixed results on the impact of innovation on firm growth.
Part of the reason is that the research used different measures of performance such as sales, employment, asset, profit, and productivity with different data and methodology as well as various types of independent variables such as innovation, business cycle, and advertising capital [6,7,8]. Research and development (R&D) has been used as a representative proxy of innovation activities but the effects of R&D on firm growth are different for various types of firms [9]. The impact of R&D on firm growth in young/old and small and medium-sized enterprise (SME)/large firms has been studied and recently many researchers have shown attention to high growth firms due to its economic and policy importance even with the drawback of the short period of persistence [10,11,12].
Quantile regression has been used to show the relationship in more detail in the heterogeneity of firm growth, in contrast to the traditional mean relationship between firm growth and independent variables [9,10,13].
The pharmaceutical industry provides an excellent opportunity to study the long-term dynamics of the industry where R&D and innovation play an essential role in the performance of the firms [9], thus we researched the relationship between innovative activities and high growth firms under the pharmaceutical industry structure.
In addition, since the industry structure could provide a clue, though not to causality, to understand better the relationship between high growth firms and innovation [9], we looked into the competition and concentration in the Korean pharmaceutical industry.
We find the relationship between R&D and growth for high growth and low growth firms in the Korean pharmaceutical industry using quantile regression techniques considering both firm-specific and industry-specific factors. We focus on pharmaceutical firms listed on the Korea stock market from 2007 to 2018.
The structure of this article is as follows. Section 2 summarizes previous researches regarding firm growth. Section 3 explains the data we used for analysis and Section 4 highlights quantile regression to draw implication for high growth firms. Section 5 shows the results, and then Section 6 concludes with some suggestions for further research.
2. Literature Review and Hypotheses
We review theoretical and empirical articles about firm growth and factors that have an impact on it, specifically firm size, firm age, R&D, and industry structure. Very little in theories of firm growth has been testable like in optimum firm size and Penrose’s managerial limit to growth. Thus, empirical investigation based on data has been used in many cases to rationalize the stylized facts of firm growth [7,14].
2.1. Firm Size, Age, and Growth
An important early theory about firm growth is Gibrat’s law that firm growth rate as a dependent variable is only proportional to the initial size of the firm as an independent variable. The firm growth rate could be a stochastic process in Gibrat’s law, which does not reconcile with the optimal firm size theory of traditional corporate theory. That is to say, the probability of change rate for all companies over specific periods is the same in the industry regardless of the initial firm sizes. Those indicators are used as alternative proxies for firm growth such as sales, employment, profit, asset, productivity, and innovation. While some studies support Gibrat’s law [15], numerous articles showed negative [16,17,18,19], or even a positive relationship [20] between firm size and firm growth rate. Mansfield showed that Gibrat’s law is analytically convenient but is not very empirically valid and is difficult to rely on as a theory of firm size distribution [21].
Stanley et al. rejected Gibrat’s law by analyzing the statistical properties of growth rates and found out that the growth rate has an exponential form unlike Gaussian distribution assumed by Gibrat’s law [22]. Following this, studies of the firm growth rate have emerged, and as a stylized result the firm growth rate dispersion is tent shaped [23,24,25,26,27]. As studies into growth rate distribution show that it has a tent shaped distribution rather than a Gaussian distribution, quantile regression has been recommended for firm growth studies [28].
Compared to the effect of size on firm performance, the age effect on firm performance has been less studied and is still not at a maturity phase because the data are not sufficient enough to study systematically [29]. However, it is widely considered firm age is a valid explanatory variable and there is a negative relationship between firm age and firm performance [19,30], though firm age could be a proxy for other causal variables such as routinization, learning curve, and so on because those variables are very hard to measure [31].
2.2. R&D, Innovation and Growth
A large number of research extends the regression model of Gibrat’s law by adding various determinants for the firm growth to show a statistically significant relationship [9,39,40,41,42,43,44,45]. The relationship between R&D, innovation, and growth has been an important topic because it justifies the corporate R&D investment and national R&D policy. Numerous research has been conducted, but the relationship between R&D and firm growth is mixed [11]. Many articles are showing a positive, neutral, or negative relationship between R&D and corporate growth [11,46,47,48,49].
The impact of R&D and innovation on firm performance shows considerable heterogeneity in various types of firms with different characteristics such as R&D intensity, innovation persistence, size, and so on [10,11,13,46,50,51,52,53]. Thus, the effect of R&D or innovation on growth should be considered together with a variety of enterprise factors. For example, Demirel and Mazzucato showed that the impact of R&D on growth in the pharmaceutical industry, which has high barriers to entry and is dependent on the size of the company and company characteristics such as patents and patents consistency. Falk showed that R&D intensity has a significantly positive impact on firm performance using Austrian data with the least absolute deviation estimator. Matthias Deschryvere considers the role of innovation persistence in analyzing R&D investment and growth relationship in SMEs and large firms using Finnish data with vector auto-regression model.
A recent study suggests that it is necessary to analyze factors that affect growth, focusing on fast-growing firms rather than small firms contributing to improving understanding of relevant growth process, though they have several challenges to be useful due to difficulty in prediction, lack of persistence, complicated relationship with other factors, and so on [54,55,56,57,58,59,60,61]. Coad, Segarra, and Teruel showed that young firms had a significant effect of R&D on performance in the upper growth quantile, while a negative effect of R&D on performance at lower growth quantile through the quantile regression analysis with the survey for Spanish companies [56]. Micheline Goedhuys and Leo Sleuwaegen paid attention to both HGFs (high growth firms) and SDFs (strongly declining firms) and showed that R&D has a positive effect on high quantile firms but a negative effect on low quantile firms [57]. Demir et al. identified five growth drivers for high growth firms based on a systematic review of empirical literature [60].
2.3. Competition, Industry Structure, and Growth
Firm performance through innovation hinges on industry structure. However, the relationship between competition on innovation has been still controversial [62]. For example, Schumpeter emphasized the critical role for innovation activities of entrepreneurial firms in the competitive market at first and large incumbents of monopoly power later, which could be labeled as Schumpeter Mark I and Schumpeter Mark II or constructive destruction and constructive accumulation [63,64].
In several studies of the relationship between industrial structure and innovation, it was found that there is a nonlinear relationship with an inverted U-shape between innovation and firm concentration [65,66] and in a modest degree of concentration R&D spending is the highest. The reason is that when the competition is intense, incentives to invest in innovation are low because the appropriability of innovation is low, and when concentration is high, firms tend to protect current market without pressure on innovation because of inertia and to maintain appropriability through patents [65,67]. This relationship between innovation and industrial structure varies across industries, and as the industry matures, it also changes over time.
2.4. Hypotheses Development
We derive hypotheses related to the effect of R&D on firm growth rate based on the theoretical and empirical background in the previous research we reviewed.
2.4.1. Relationship between Firm Size, Age, and Firm Growth
The first hypothesis we tested was whether firm size had an impact on firm growth rate in the Korean pharmaceutical industry. There has been a strand of study to test the validity of Gibrat’s law using various data from different countries across industries both in the product and service sectors. Some of the research supports Gibrat’s law, whereas others are against it. We test whether Gibrat’s law is valid in the Korean pharmaceutical industry by examining the relationship between sales and firm growth rate in the Korean pharmaceutical industry.
Hypothesis 1.
The probability of firm growth rate change over specific periods is the same in the Korean pharmaceutical industry regardless of the initial firm sizes.
The next challenge that we address is the relationship between firm age and firm growth rate because young firms are not necessarily small firms, though they are considered closely related in some research. Young firms have different characteristics compared to older firms with some positive effect and other negative effects on firm growth rate. For example, young firms have no organizational inertia and are at less risk of cannibalization of the market share of existing products, while they lack routines, established product portfolio, and business experience. It is widely regarded that young firms are entrepreneurial and show faster growth in terms of productivity, sales, and employee, resulting in overall economic growth. Therefore, it would be meaningful to test the argument young firms grow faster in the Korean pharmaceutical industry.
Hypothesis 2.
Firm age has a negative effect on firm growth for high growth firms in the Korean pharmaceutical industry.
2.4.2. Relationship between R&D and Firm Growth
A lot of study has been conducted to show the relationship between innovation activities and firm growth rate recently. Some of them has been focusing on the effect of R&D expenditure on the firm growth rate for high growth firms since high growth firms have been drawing special interest not only from companies but also from government and academics.
Though there have been some limitations of knowledge on high growth firms, it is widely expected that R&D expenditure has a positive effect on the firm growth rate for high growth firms, i.e., at upper quantile among all the firms. We therefore hypothesize;
Hypothesis 3a.
R&D intensity has a positive effect on the firm growth rate at the upper quantiles of the growth distribution for all firms.
It is also worthwhile to test whether the firms at the upper quantile have a larger positive effect of R&D intensity on firm growth rate than the firms at a lower quantile when we consider only firms with a growth rate above the industry average. Based on the result, we could argue whether the effect of R&D expenditure on firm growth rate is different across the level of growth.
Thus, our next hypothesis is:
Hypothesis 3b.
For firms with a growth rate above industry average, R&D intensity has a larger positive effect on firm growth rate at the upper quantiles of the growth distribution.
3. Data and Descriptive Analysis
3.1. Data
We used an electronic disclosure system, DART (Data Analysis, Retrieval, and Transfer System), to gather financial data on all pharmaceutical companies listed on the KOSPI (KOrea composite Stock Price Index) and KOSDAQ (KOrea Securities Dealers Automated Quotation) market. Among the listed 98 pharmaceutical companies, after cleansing data with missing information, we finally selected 59 companies from 2007 to 2018 with all available data for our selected variables. By only using the continuing firms during the same analysis period, we tried to get statistical consistency. We collected data from DART on the pharma company name, sales, assets, R&D expenditure, number of employees, and established years. We used WIPSON website (www.wipson.com) for patent data, especially about patent persistence years for the selected companies. We deflated the financial data to the 2015 level to obtain real values.
3.2. Variables
We described the variables used for the analysis in this section. We present a summary of the statistics of the data used in the analysis and the correlation between the variables in Table 1 and Table 2.
Firm growth is a function of several variables such as firm size, firm age, patent, R&D, and so on. We calculated annual growth rate using log difference of annual sales revenue. Growth could be measured in various ways such as asset or employment, but we used the sales growth rate for the convenience of comparison with previous works of literature. The other main variables were firm size, firm age, R&D intensity, R&D scale, and patent persistence.
For firm size, we used one time lagged log of sales for controlling autocorrelation [18,71,72]. We established the year for firm age and used the log of age following Brown et al. [73].
R&D intensity was calculated with R&D expenditure divided by one-period lag firm size and by one period lag asset, respectively, and then those two combined into a single composite index using principal component analysis (PCA) to avoid potential bias focusing on any individual calculation method. Another R&D variable was the R&D scale, which shows whether the company spends more or less than its competitors in the dataset as a comparative measure. It is a dummy variable which controls the effect of above-average R&D spending while controlling the effect of R&D intensity. If the spending was equal to or less than the average in the dataset, then it becomes 0 and 1 in the case of above-average [9].
We used patent persistence as a dummy variable to measure innovation activity. The patent could be used as a proxy for innovation output if a company has a patent consecutively over the past 4 years, then the dummy variable equals 1.
We also used the growth level dummy variable whose value is 1 if a firm growth rate is above industry median and 0 otherwise.
3.3. Preliminary Descriptive Analysis of High Growth Firms
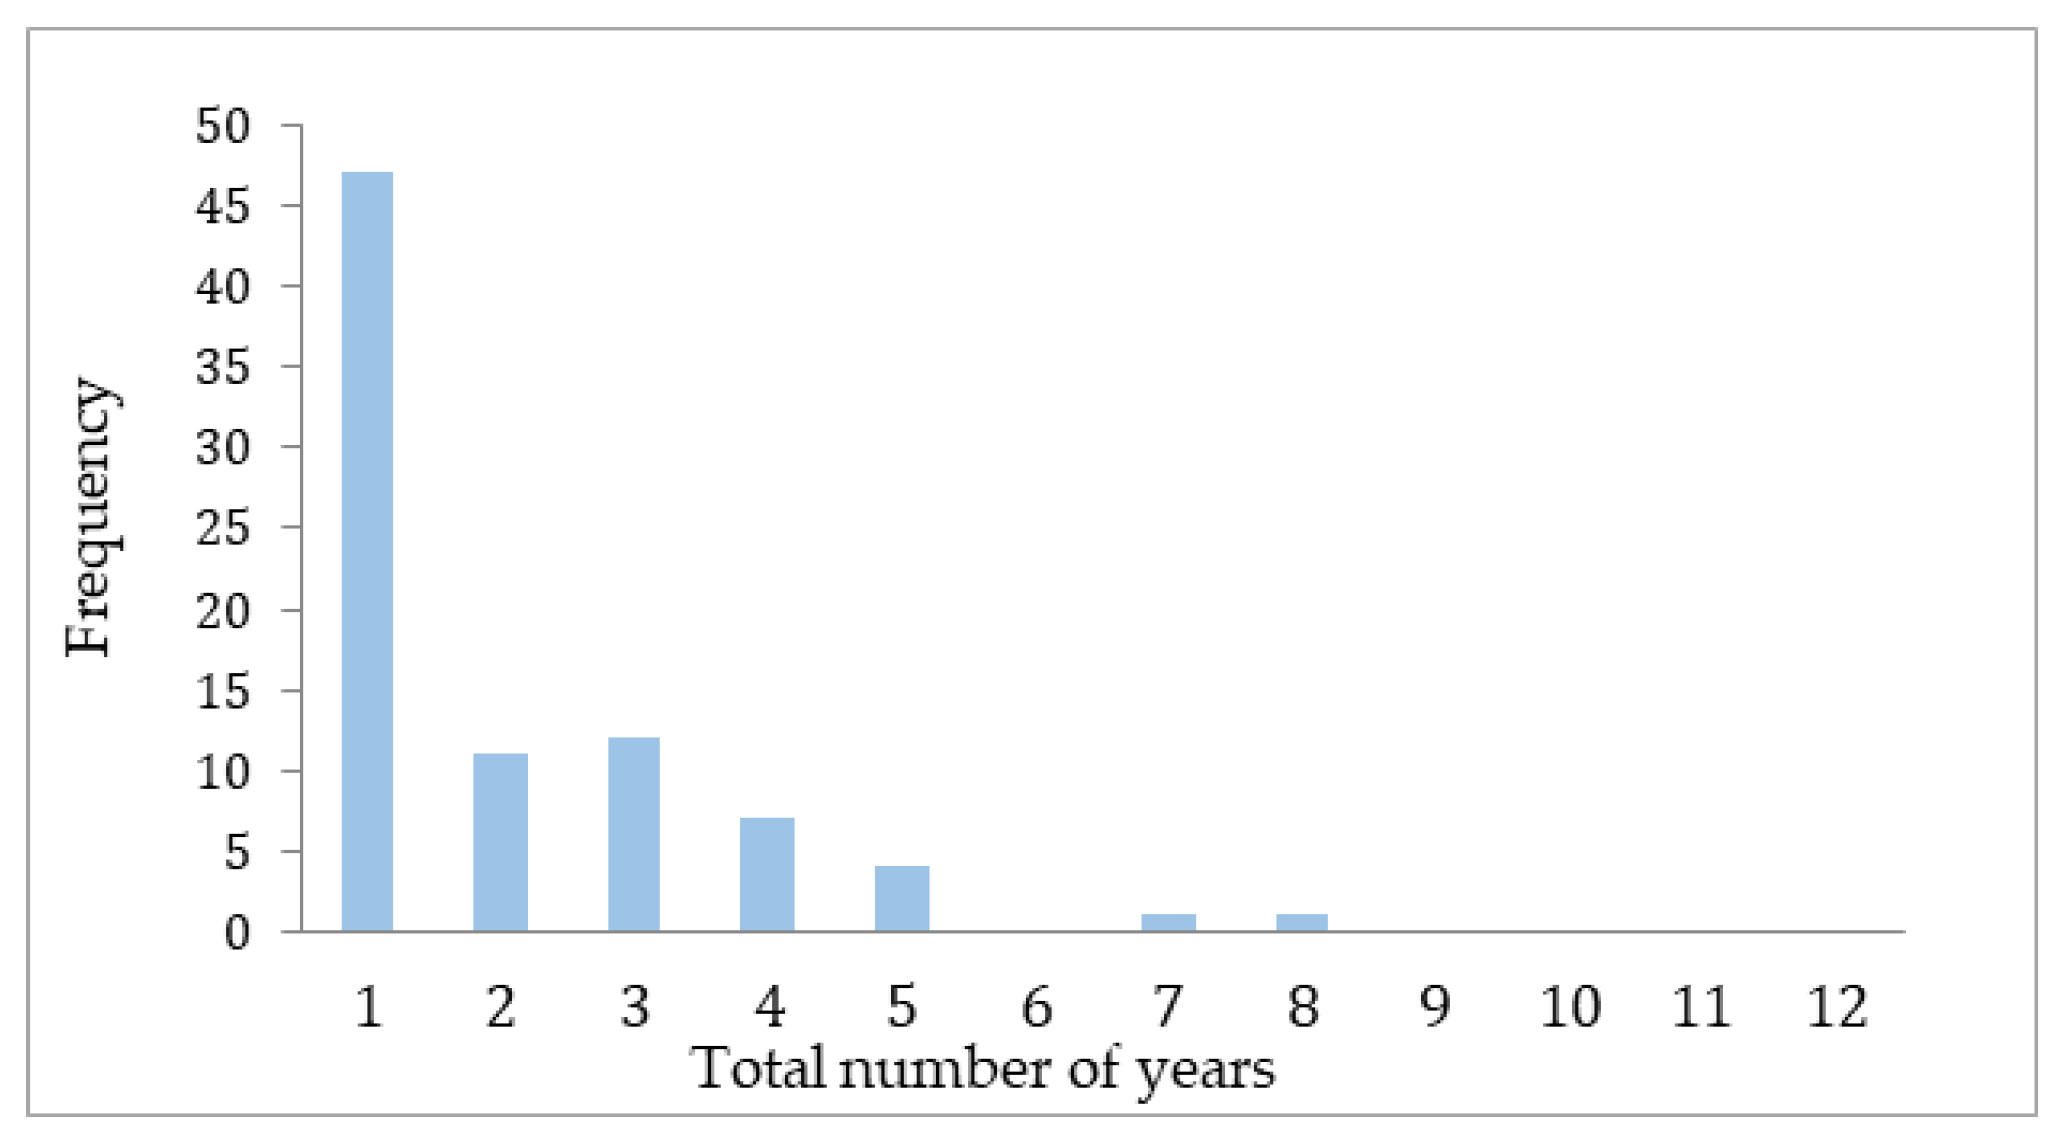
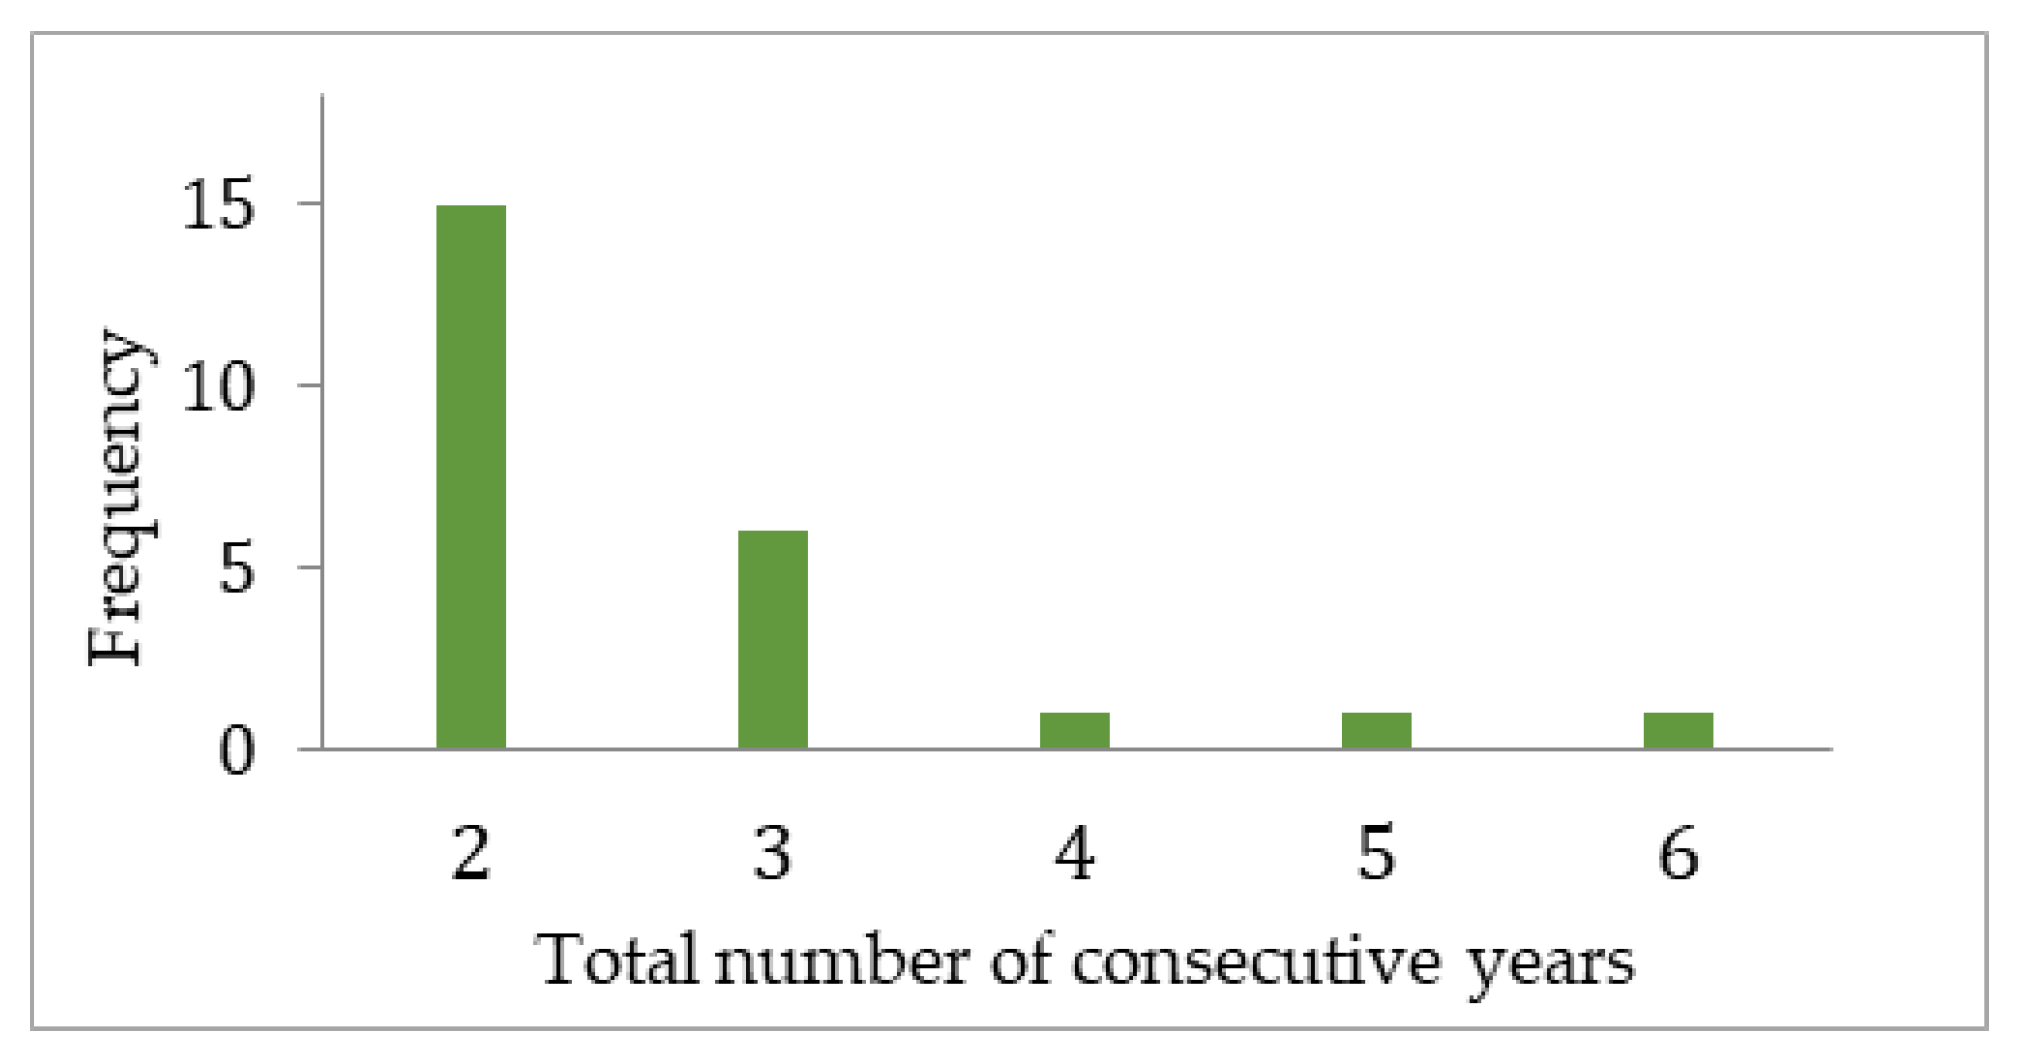
Looking at both the total number of years and consecutive years with firms showing high growth performance during the analysis period of 10 years in Figure 1 and Figure 2, we could see that the period classified as a high growth firm with a top performance was very short. Therefore, it was worthwhile to examine the characteristics of high growth firms than firms themselves with high sales growth rates.
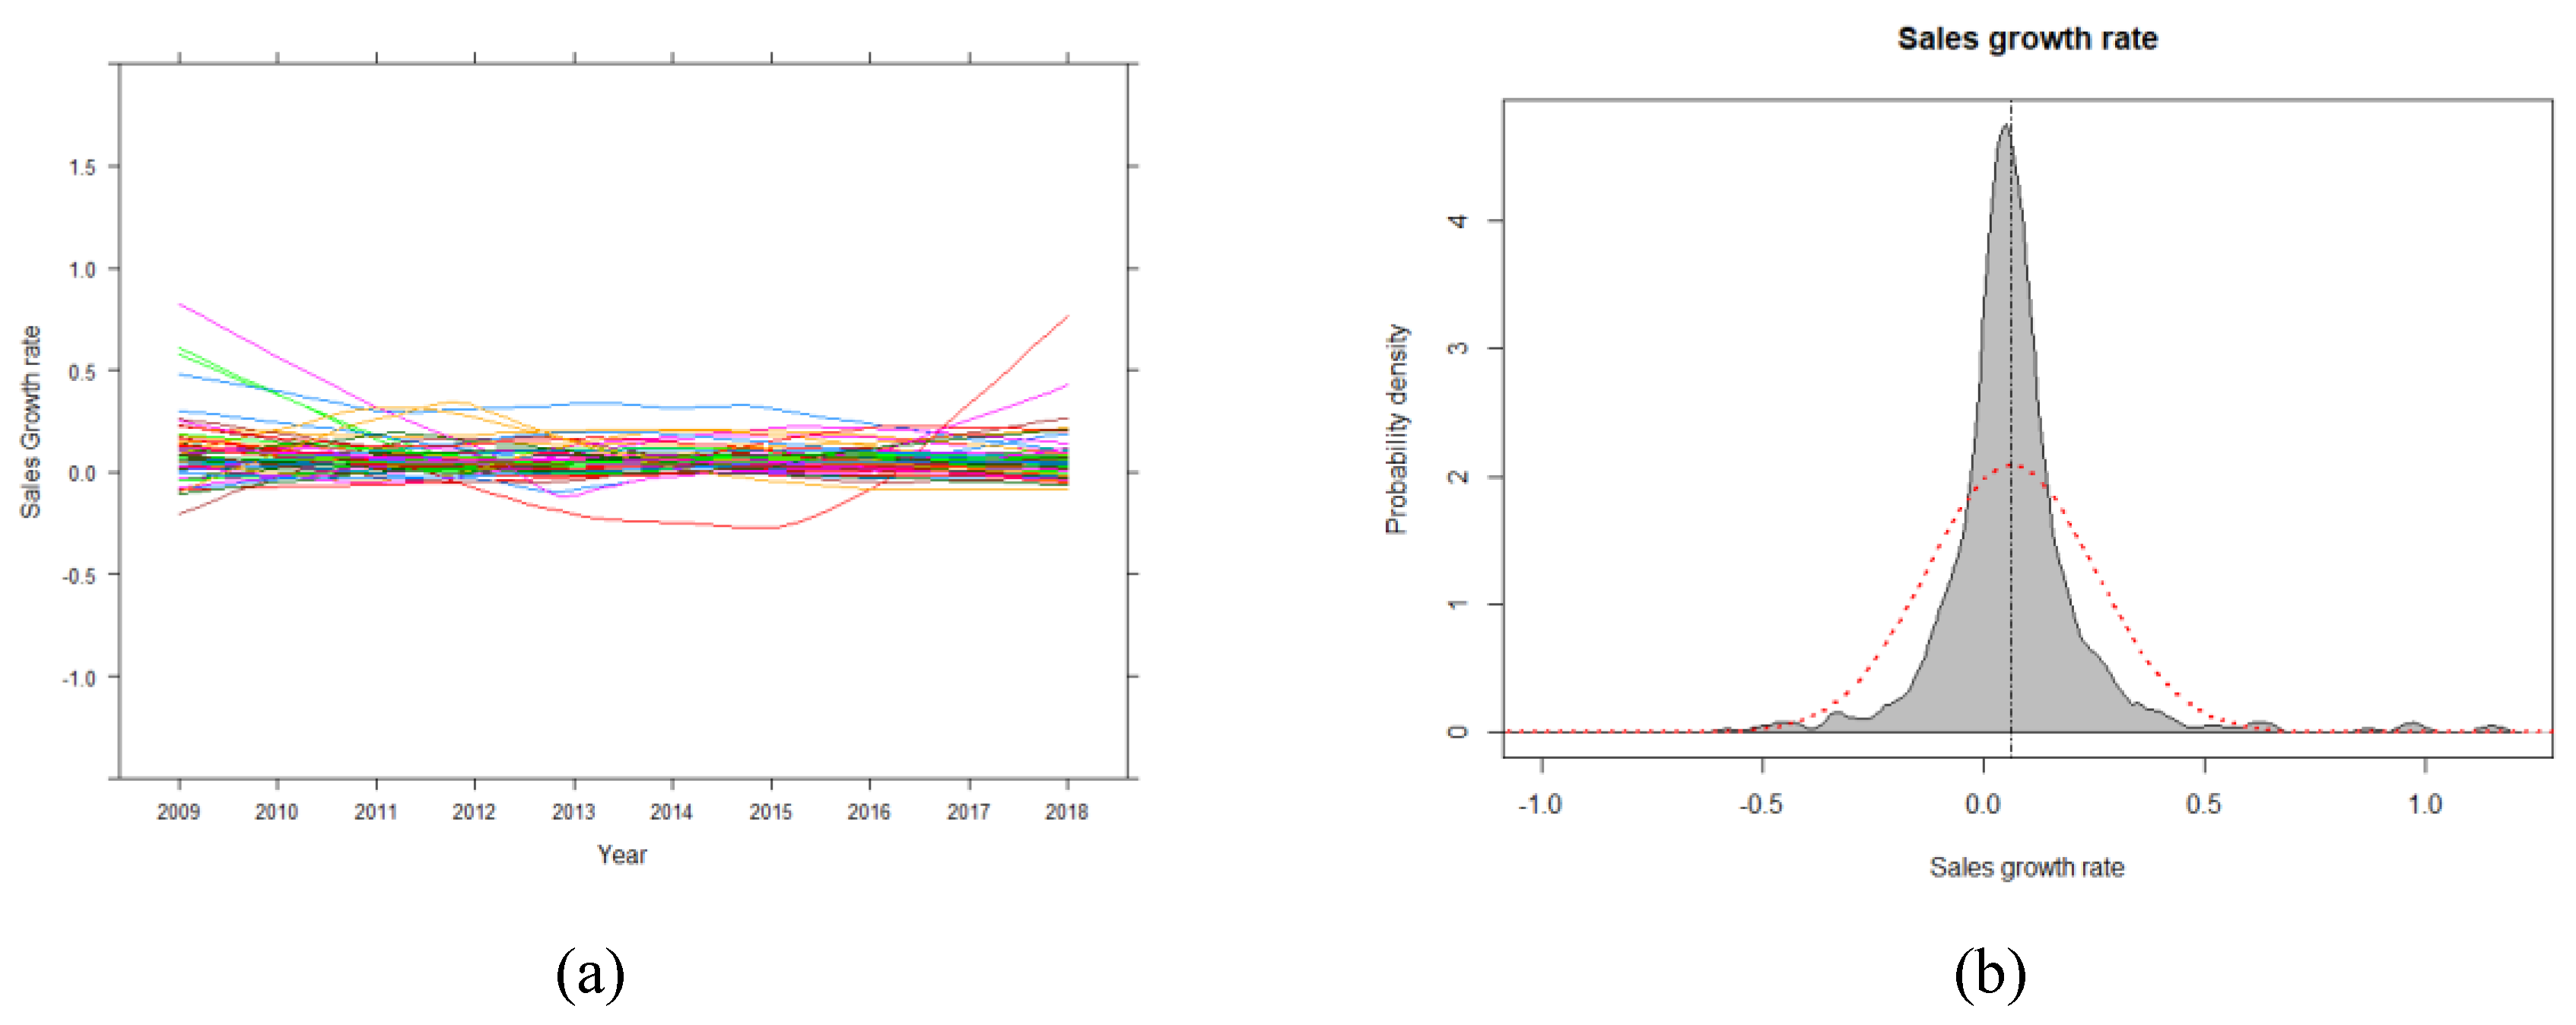
Next, we reviewed the pattern of sales growth rate over time, density plot, and kurtosis plot. The plots showed a variety of firm growth over time, therefore, we should use a better approach than OLS (Ordinary Least Square) to analyze the relationship between firm growth rate and innovation activities.
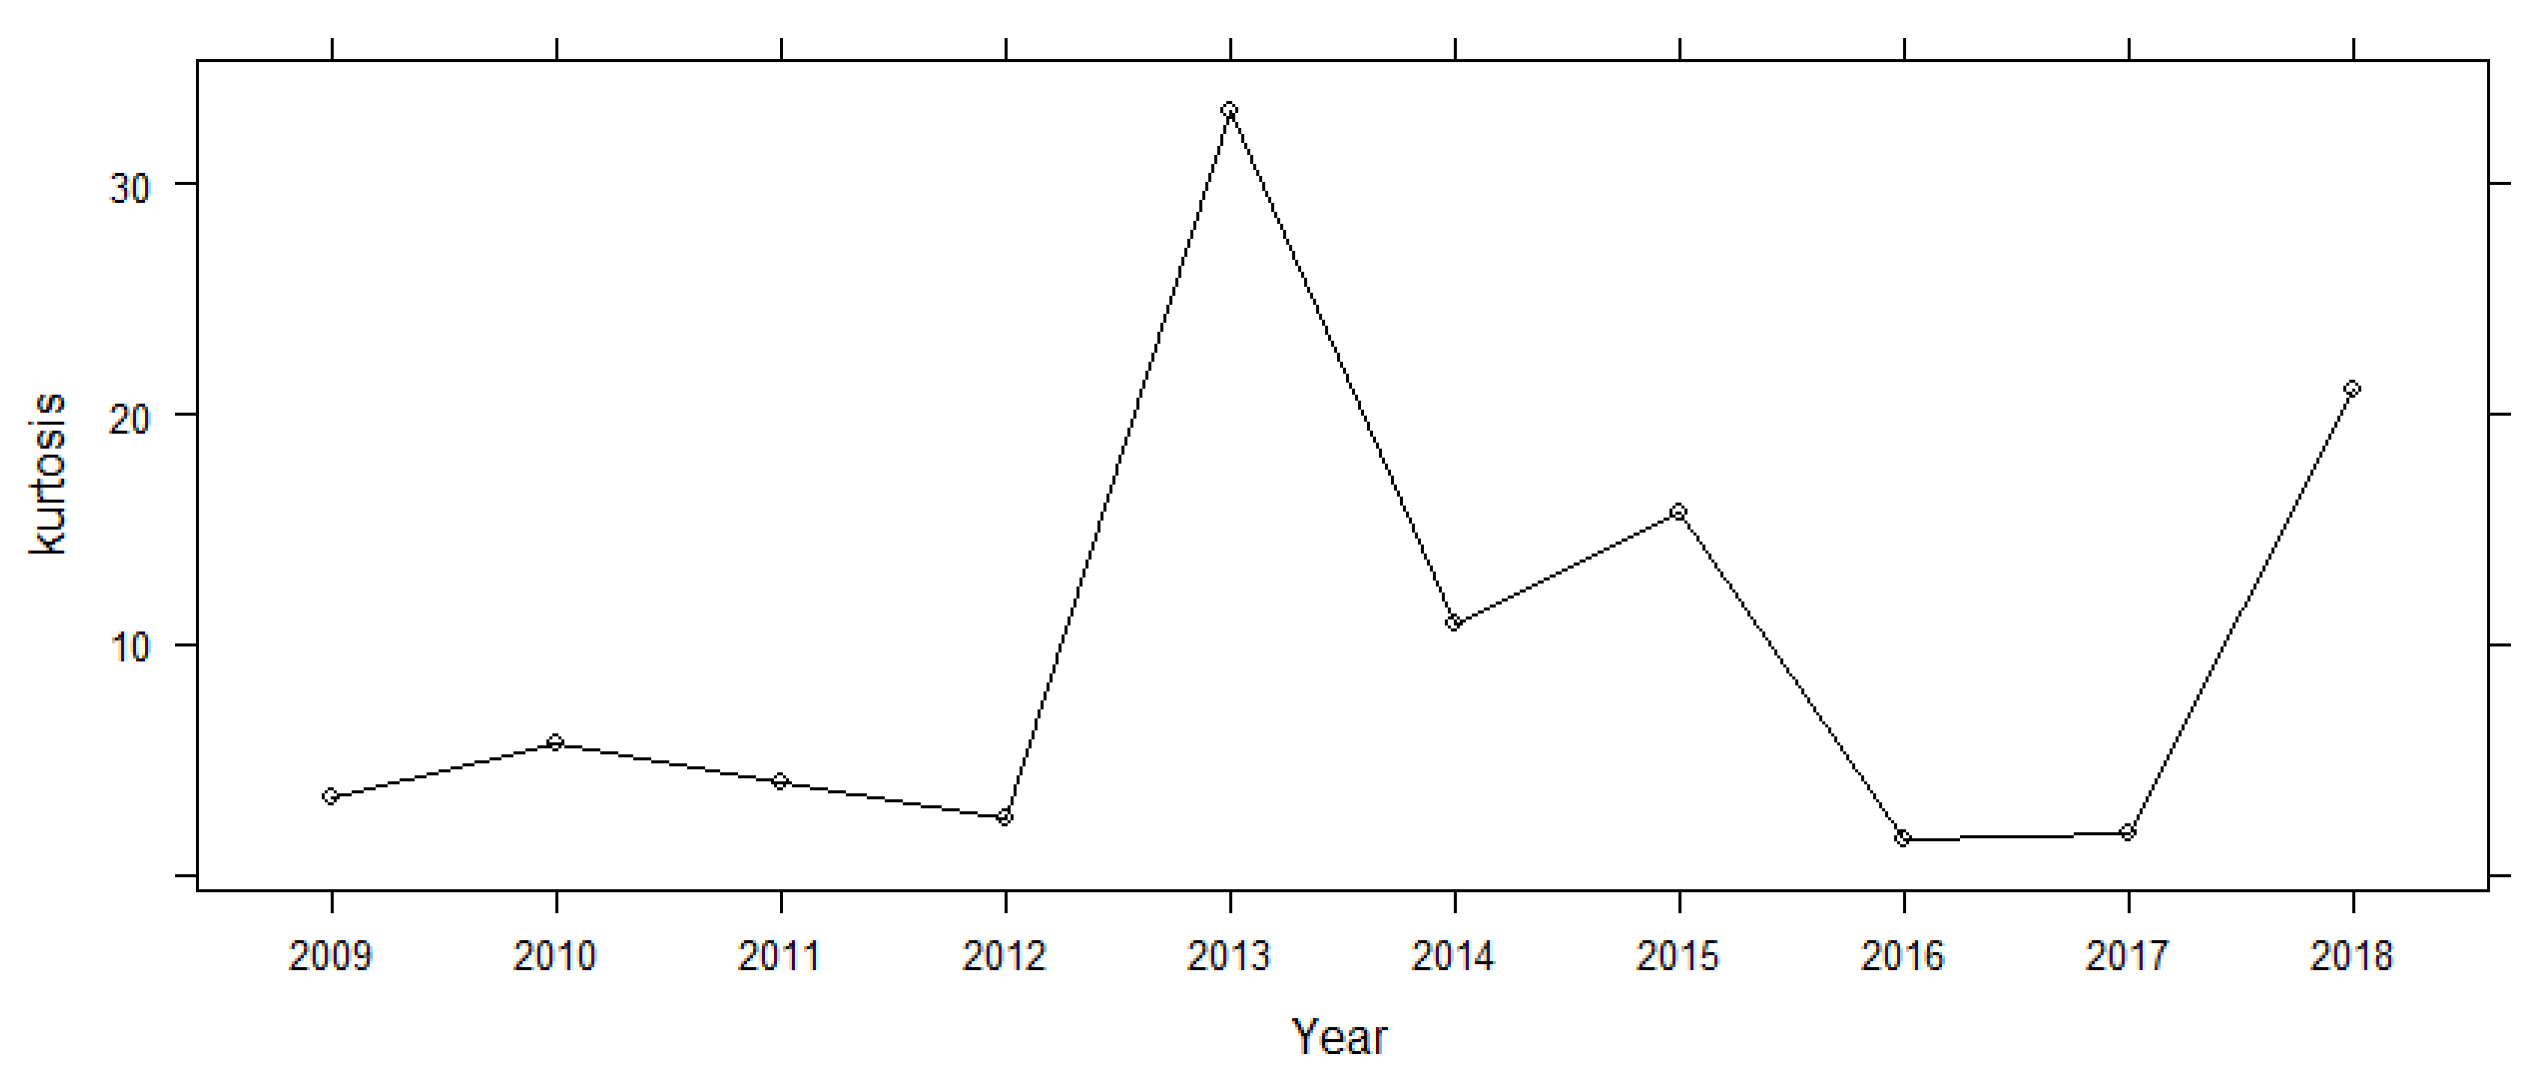
With the shape of Figure 3, the firm growth rate has some outliers, and the firm growth rate distribution is right-skewed. High kurtosis in Figure 4 indicates that the firm growth rate distribution has a resemblance to the Laplace distribution rather than the Gaussian distribution.
Meanwhile, there is a considerable variation in the firm size, growth rate, R&D intensity, and firm age even in the high growth firms like in Table 1. Therefore, it is hard to analyze accurately the relationship between the firm growth rate and R&D and innovation activities by OLS showing simple average relation.
3.4. Preliminary Analysis of Dynamics and Competitive Environment
One of the features in the Korean pharmaceutical industry is the ratio of sales of small and medium-sized Enterprise (SME) against non-SME is significantly low during the analysis period. It started at 58% in 2007 and stayed at 41% in 2018 in term of the number of SME (Table 3).
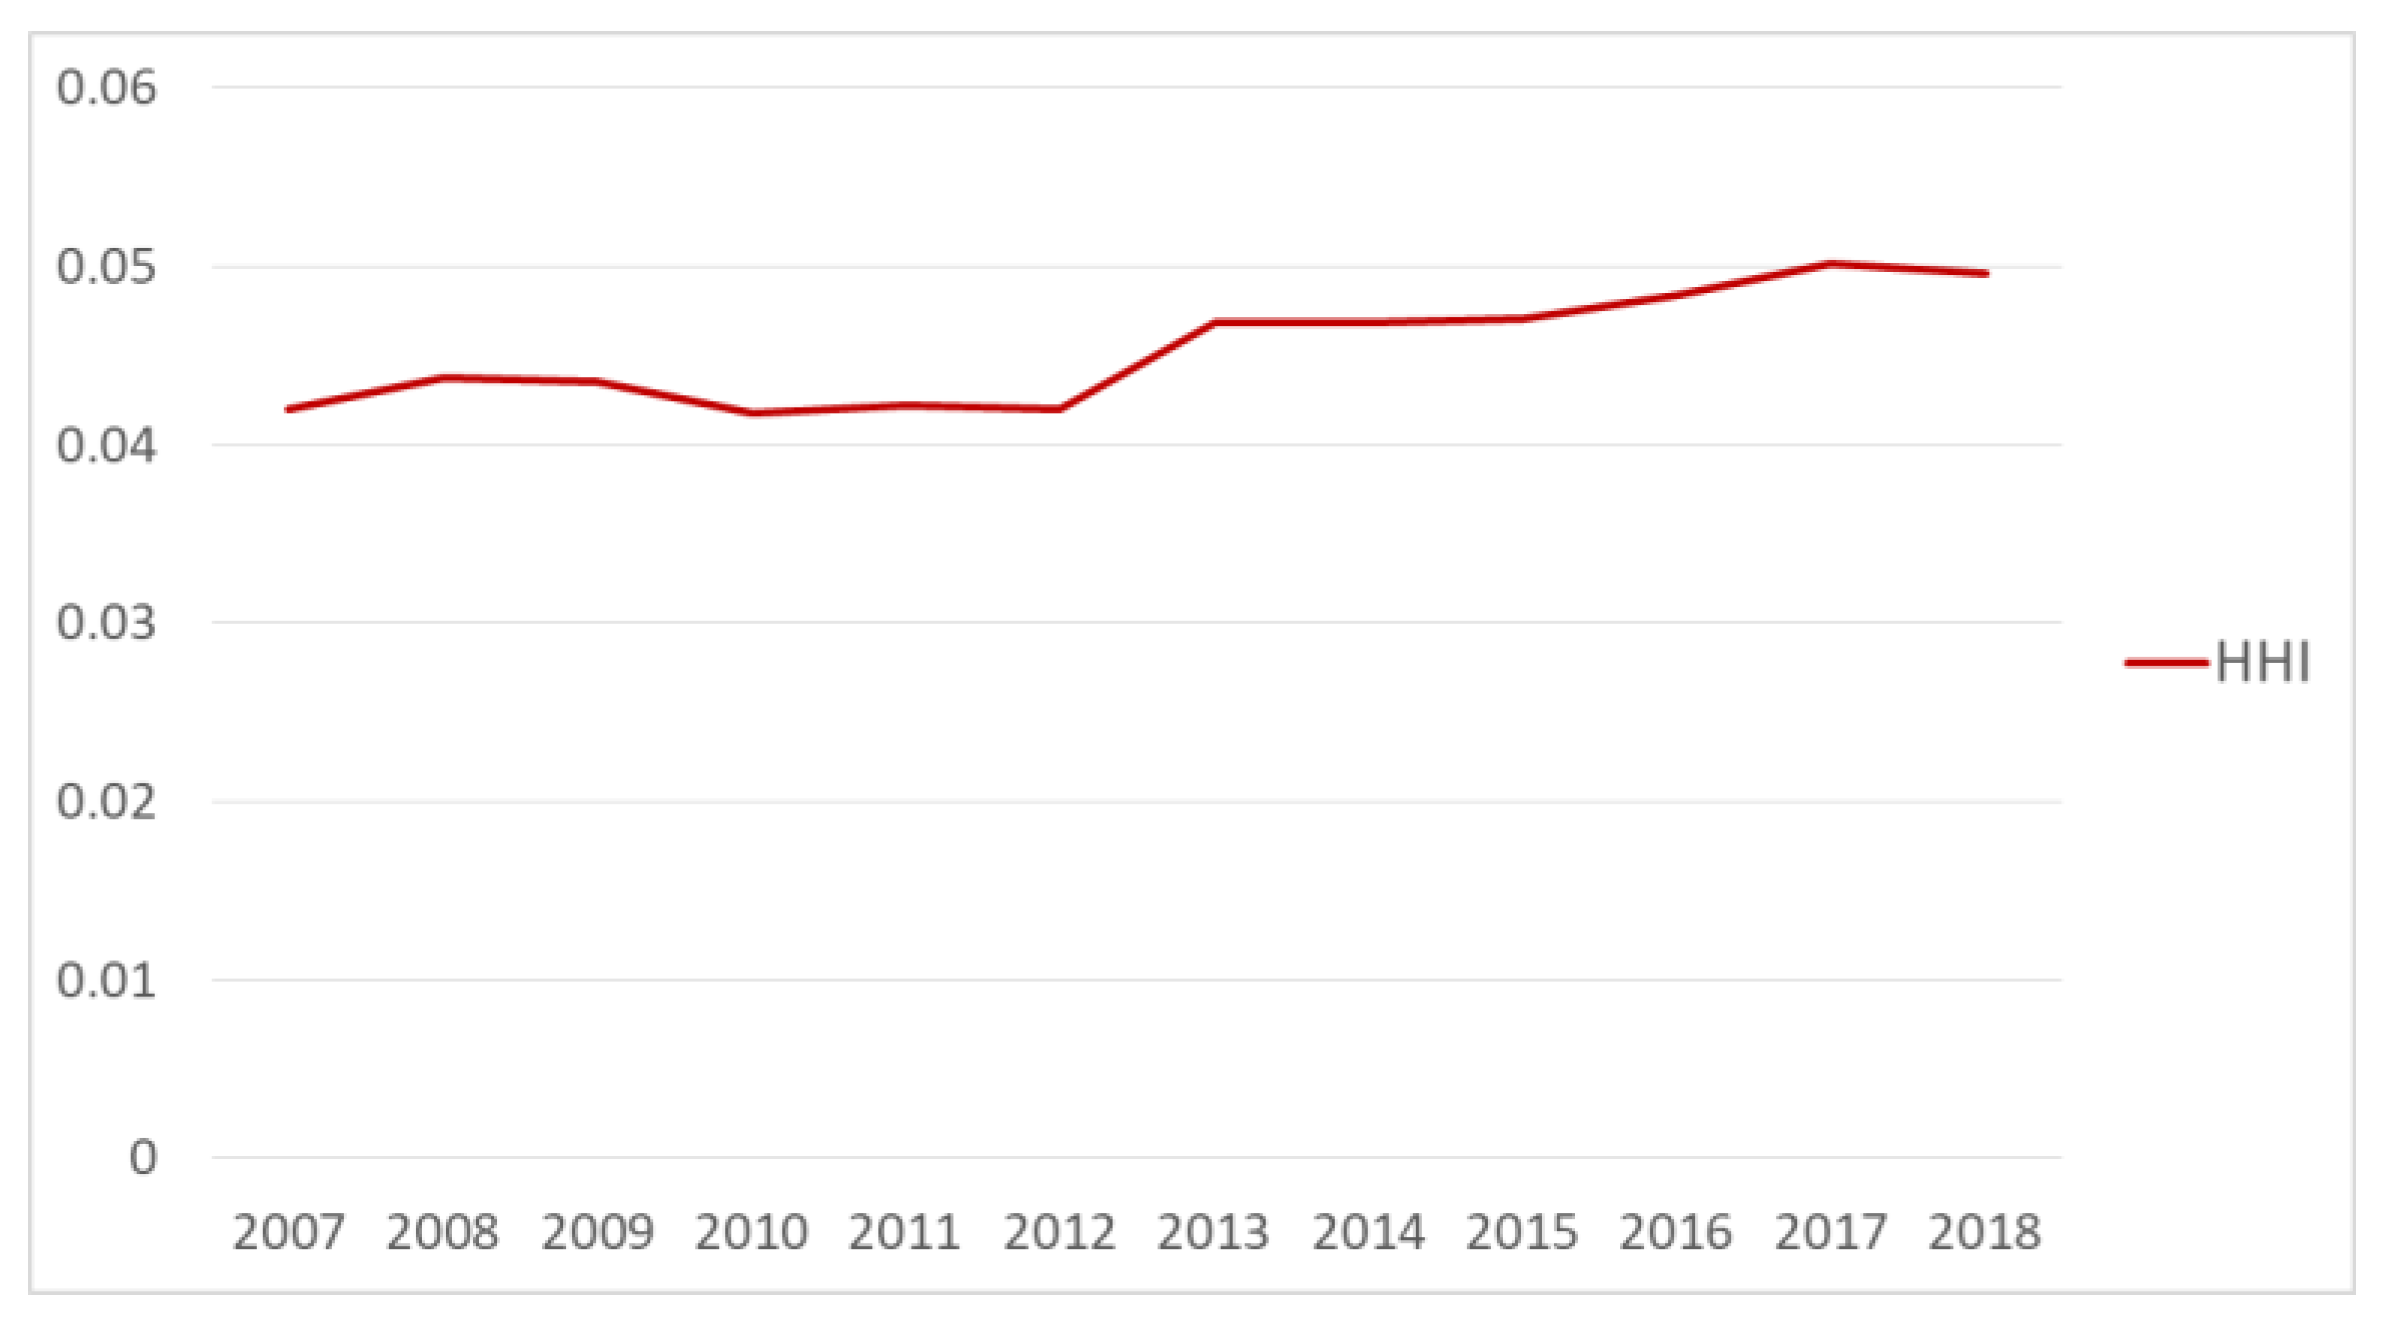
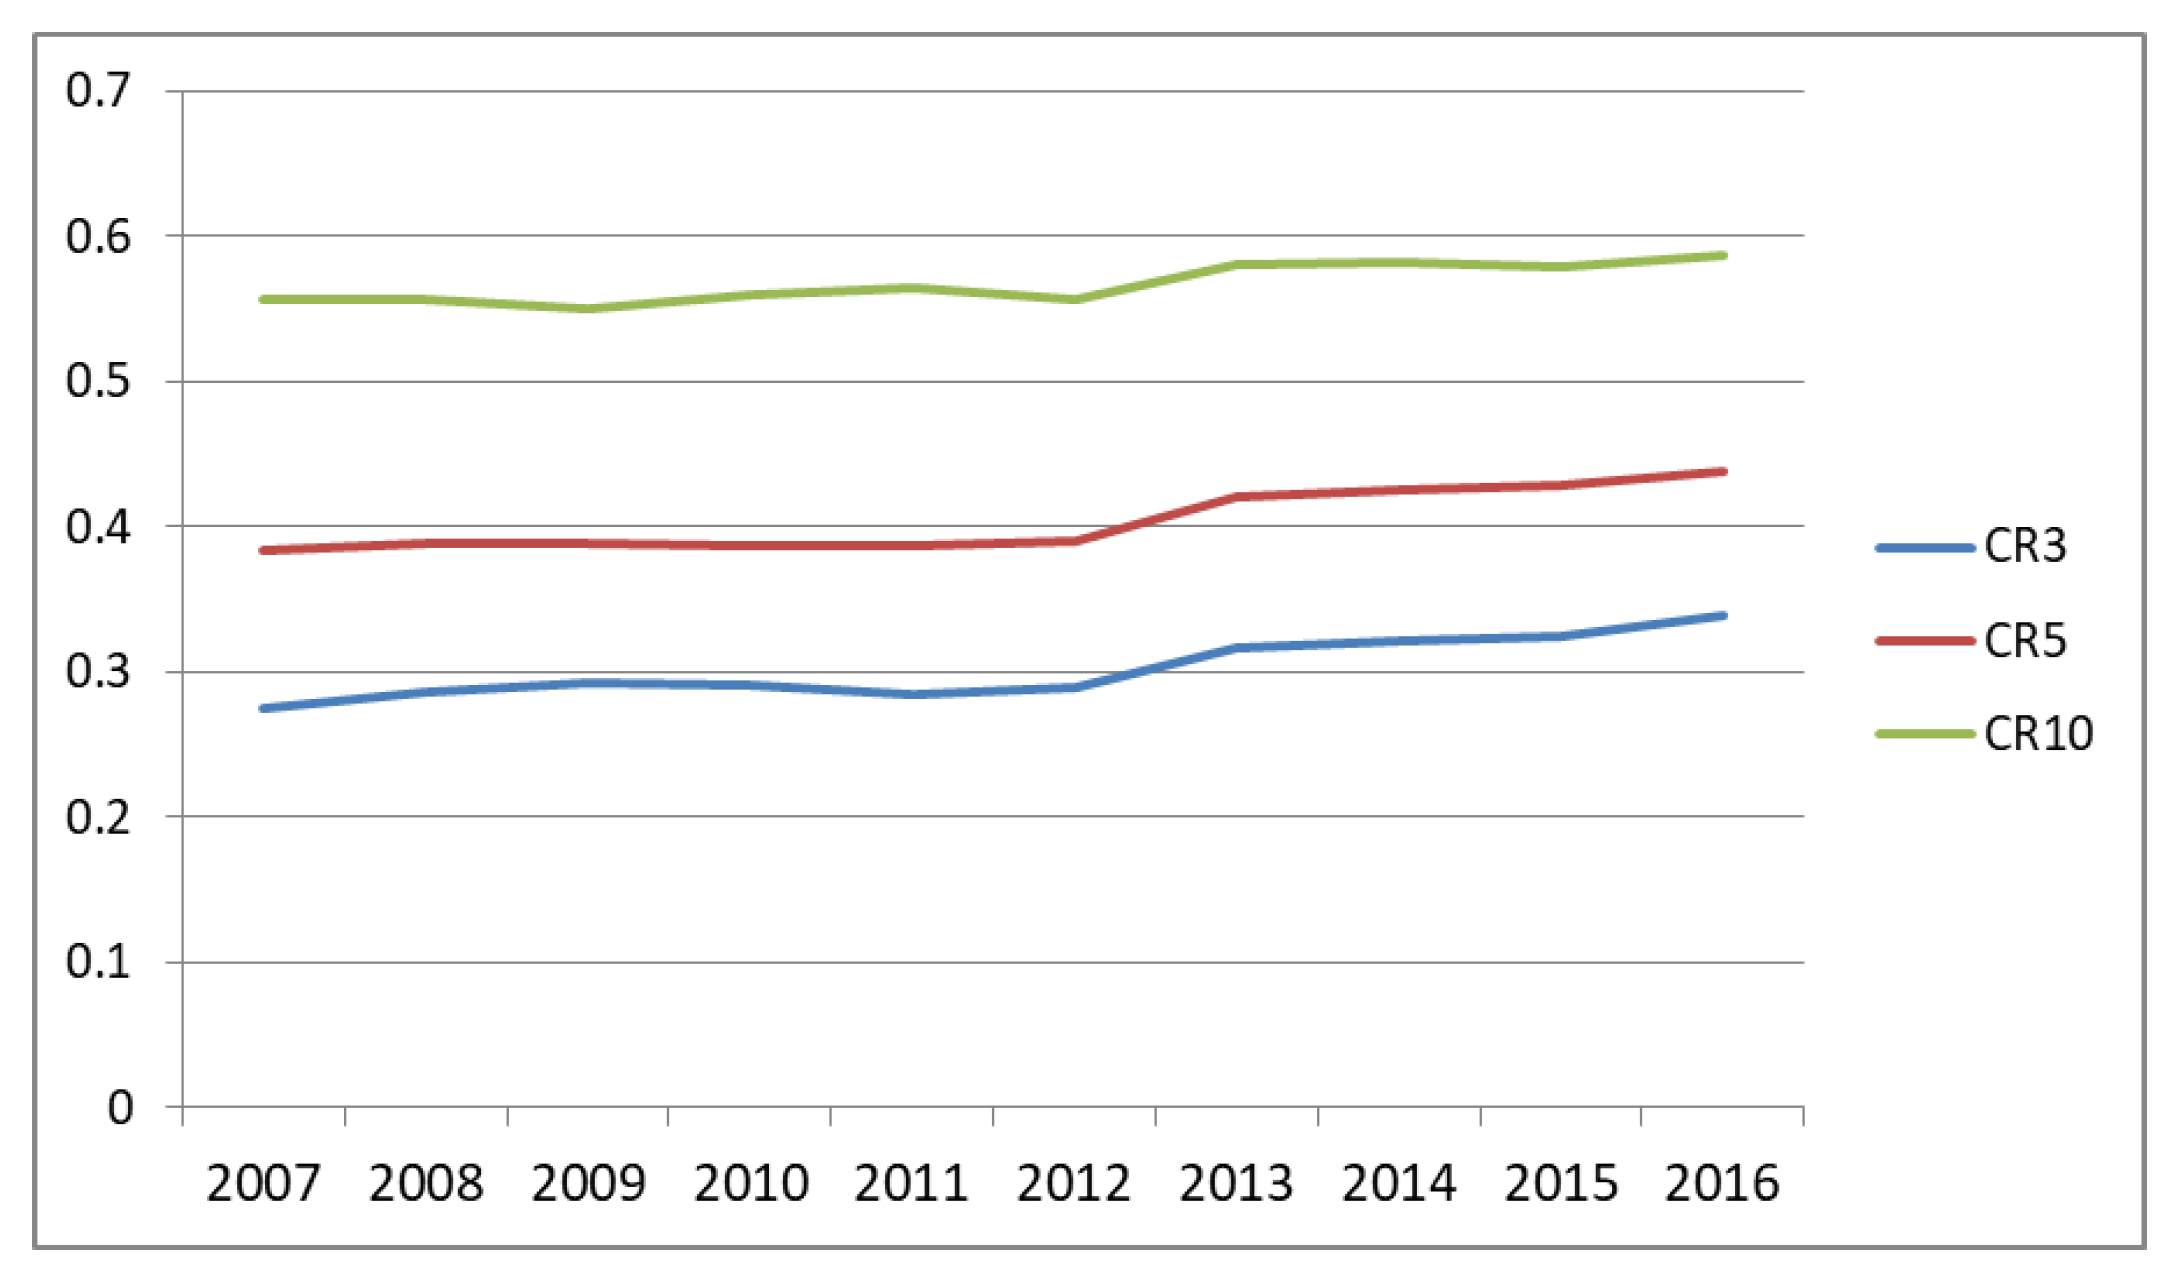
Next, we reviewed the industry structure to understand better how innovation activities impact on firm growth. We assessed the competitive environment for the industry structure using industry concentration, market share, and market instability indicator. Industry concentration of the Korean pharmaceutical companies is analyzed using the Herfindahl-Hirschman Index. Figure 5 shows how industry structure has changed and stayed unconcentrated. The Market shares of the top three, five, and ten companies (CR3, CR5, and CR10) during the period show a similar pattern in the same period in Figure 6. The market concentration and the market shares in the Korean pharmaceutical industry have moved within a relatively stable range showing that the Korean pharmaceutical industry is unconcentrated.
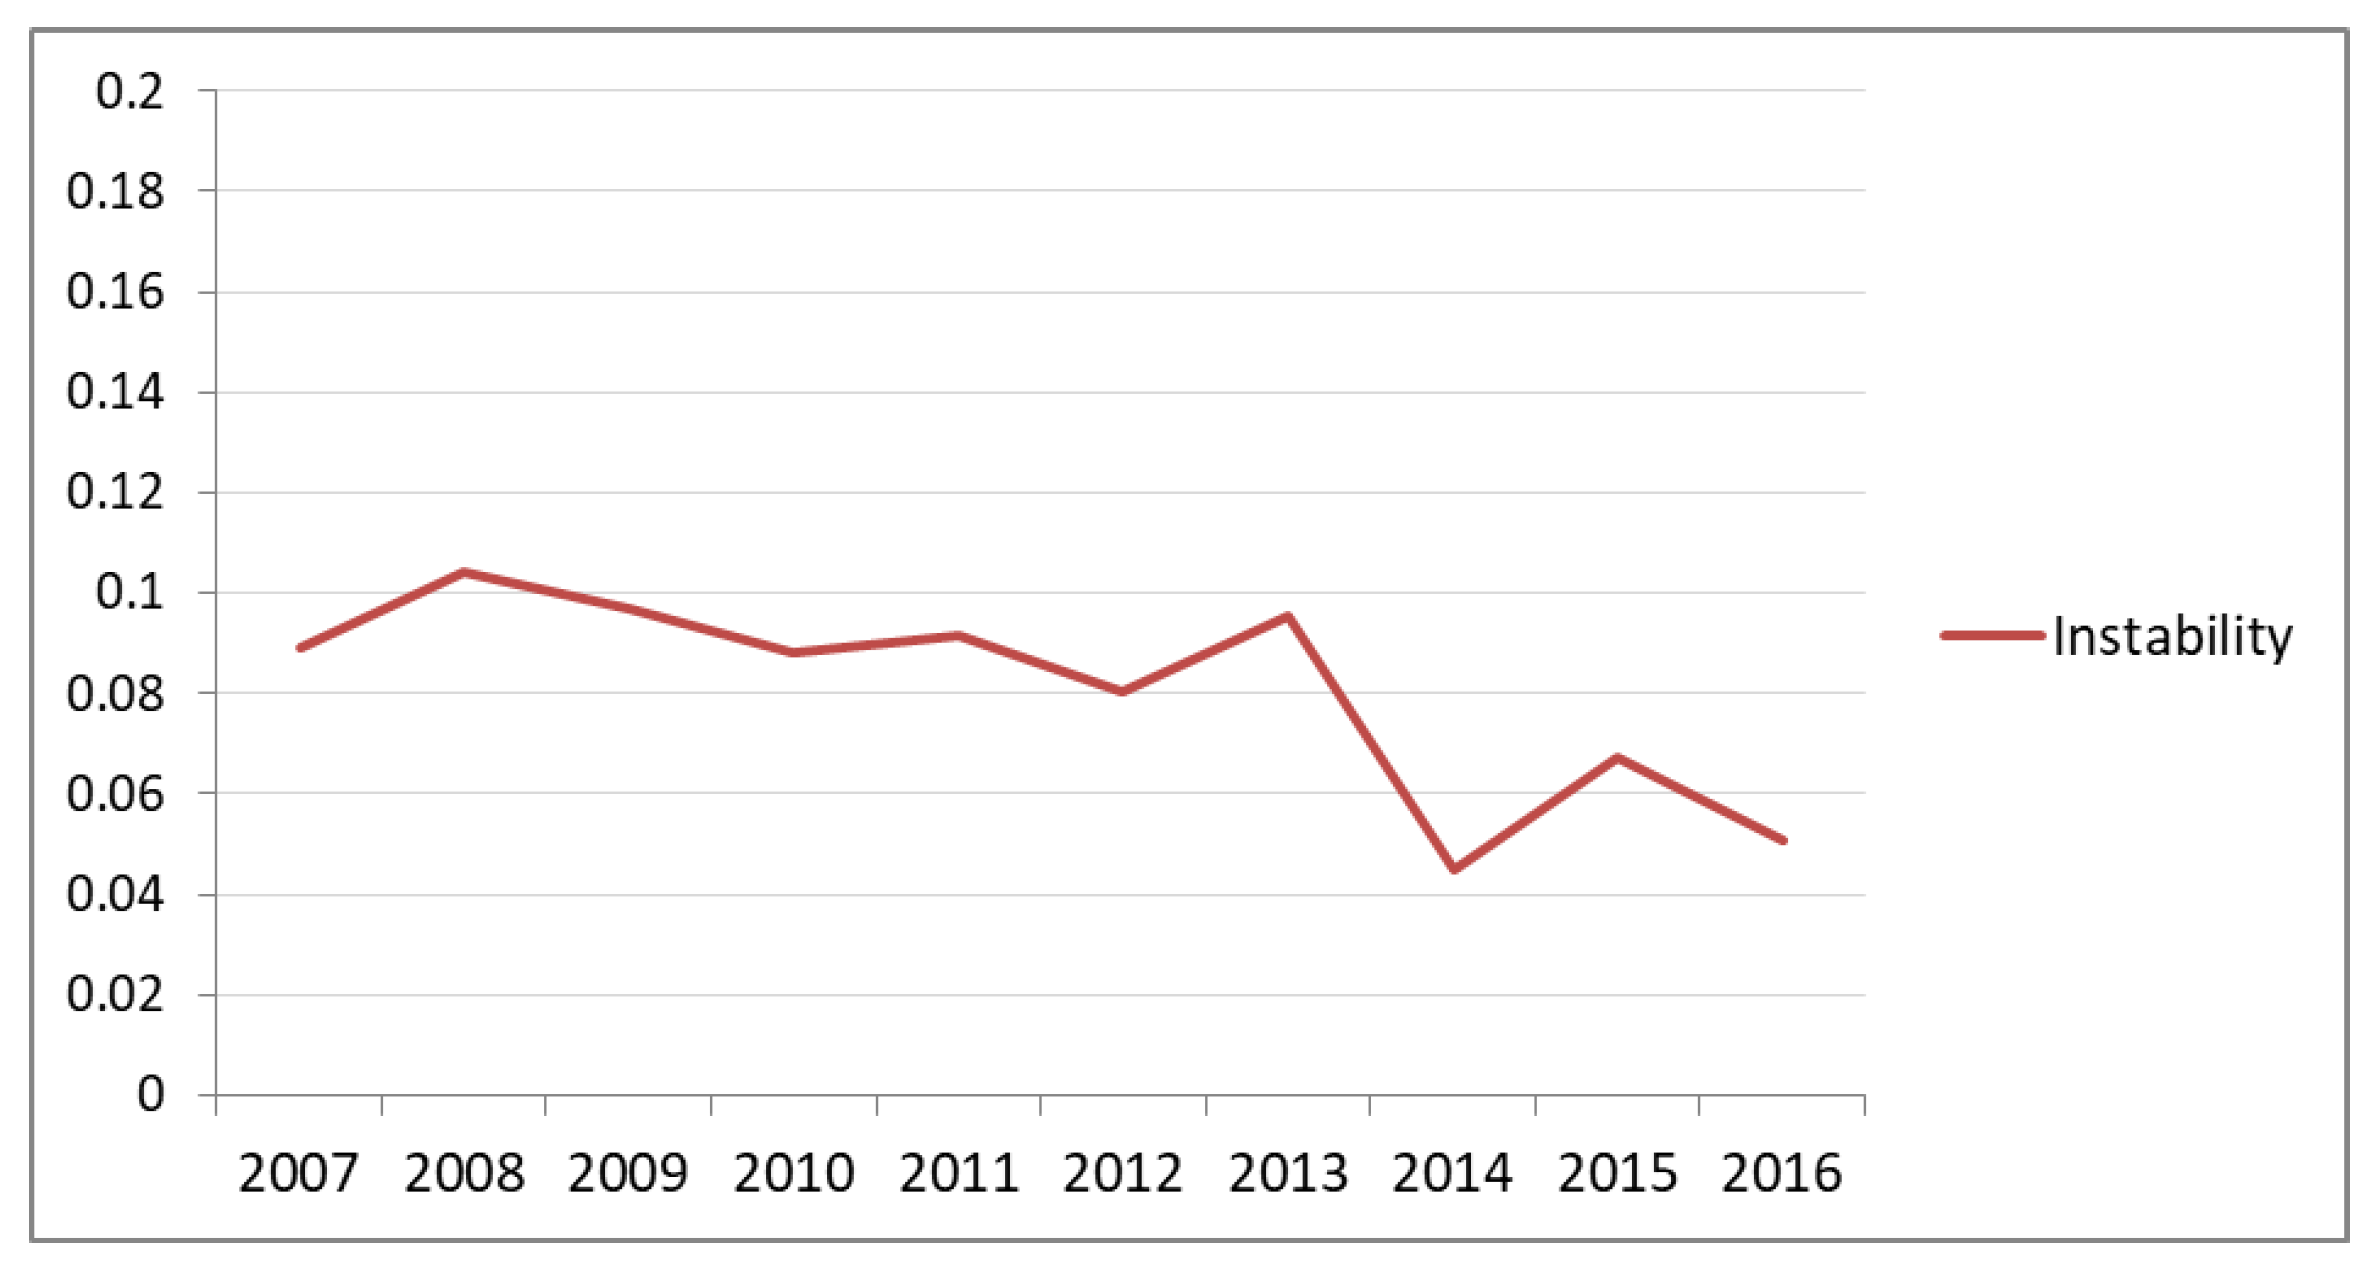
Another index explaining industry structure is the market share instability index. The index is defined in Hymer and Pashigan [74]:
where = the market share of a firm i at time t.
A larger value of the index means a riskier environment and current growth cannot guarantee future growth [75]. According to the index, which shows the intensity of inter-firm competition [9], the market share fluctuation of the companies in the Korean pharmaceutical industry is decreasing, except only a short period as shown in Figure 7.
In summary, the Korean pharmaceutical industry has been unconcentrated with high fluctuation only for short exceptional period in terms of market concentration and instability.
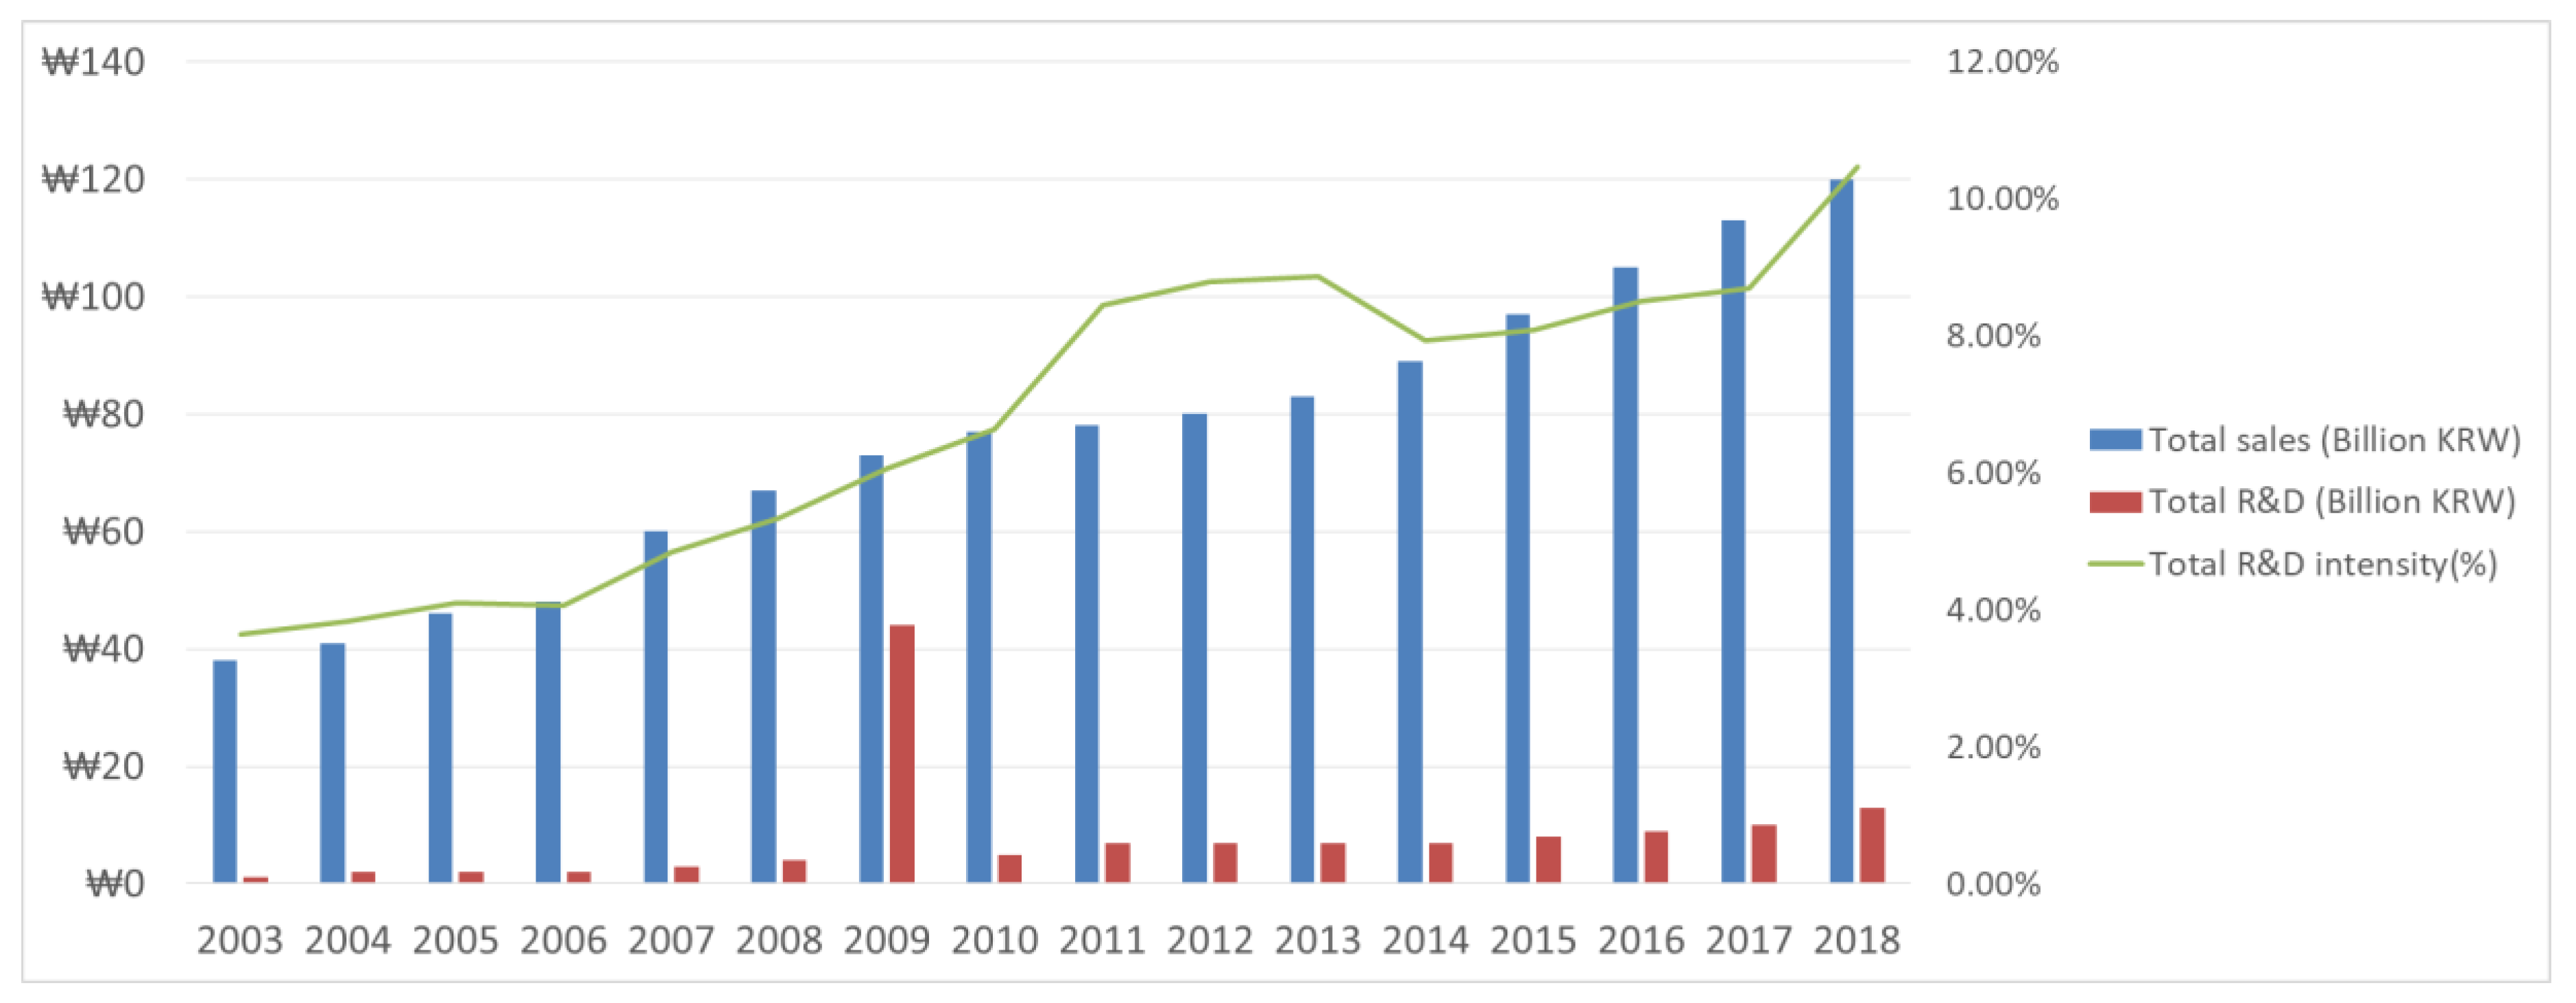
Figure 8 shows firm sales, R&D, and R&D intensity at the top 10 companies. The R&D expenditure is overall growing when sales revenue increases, but it is not proportionate to the sales growth. Thus, R&D intensity grows rapidly when sales decrease in 2011 and reduce while sales grow sharply in 2014 at the top 10 companies’ aggregate level.
4. Quantile Regression Analysis for High Growth Firms
Recent studies on the relationship between firm growth and innovation activities have been using the quantile regression method [10,13,55,56,76,77].
While the standard OLS shows the relationship between independent variables and the dependent variable on the average level, quantile regression helps to describe the conditional distribution of the dependent variable [71]. As we saw in the previous section, the firm growth rate distribution has not been centered around the mean, the quantile regression is preferable to OLS in our analysis.
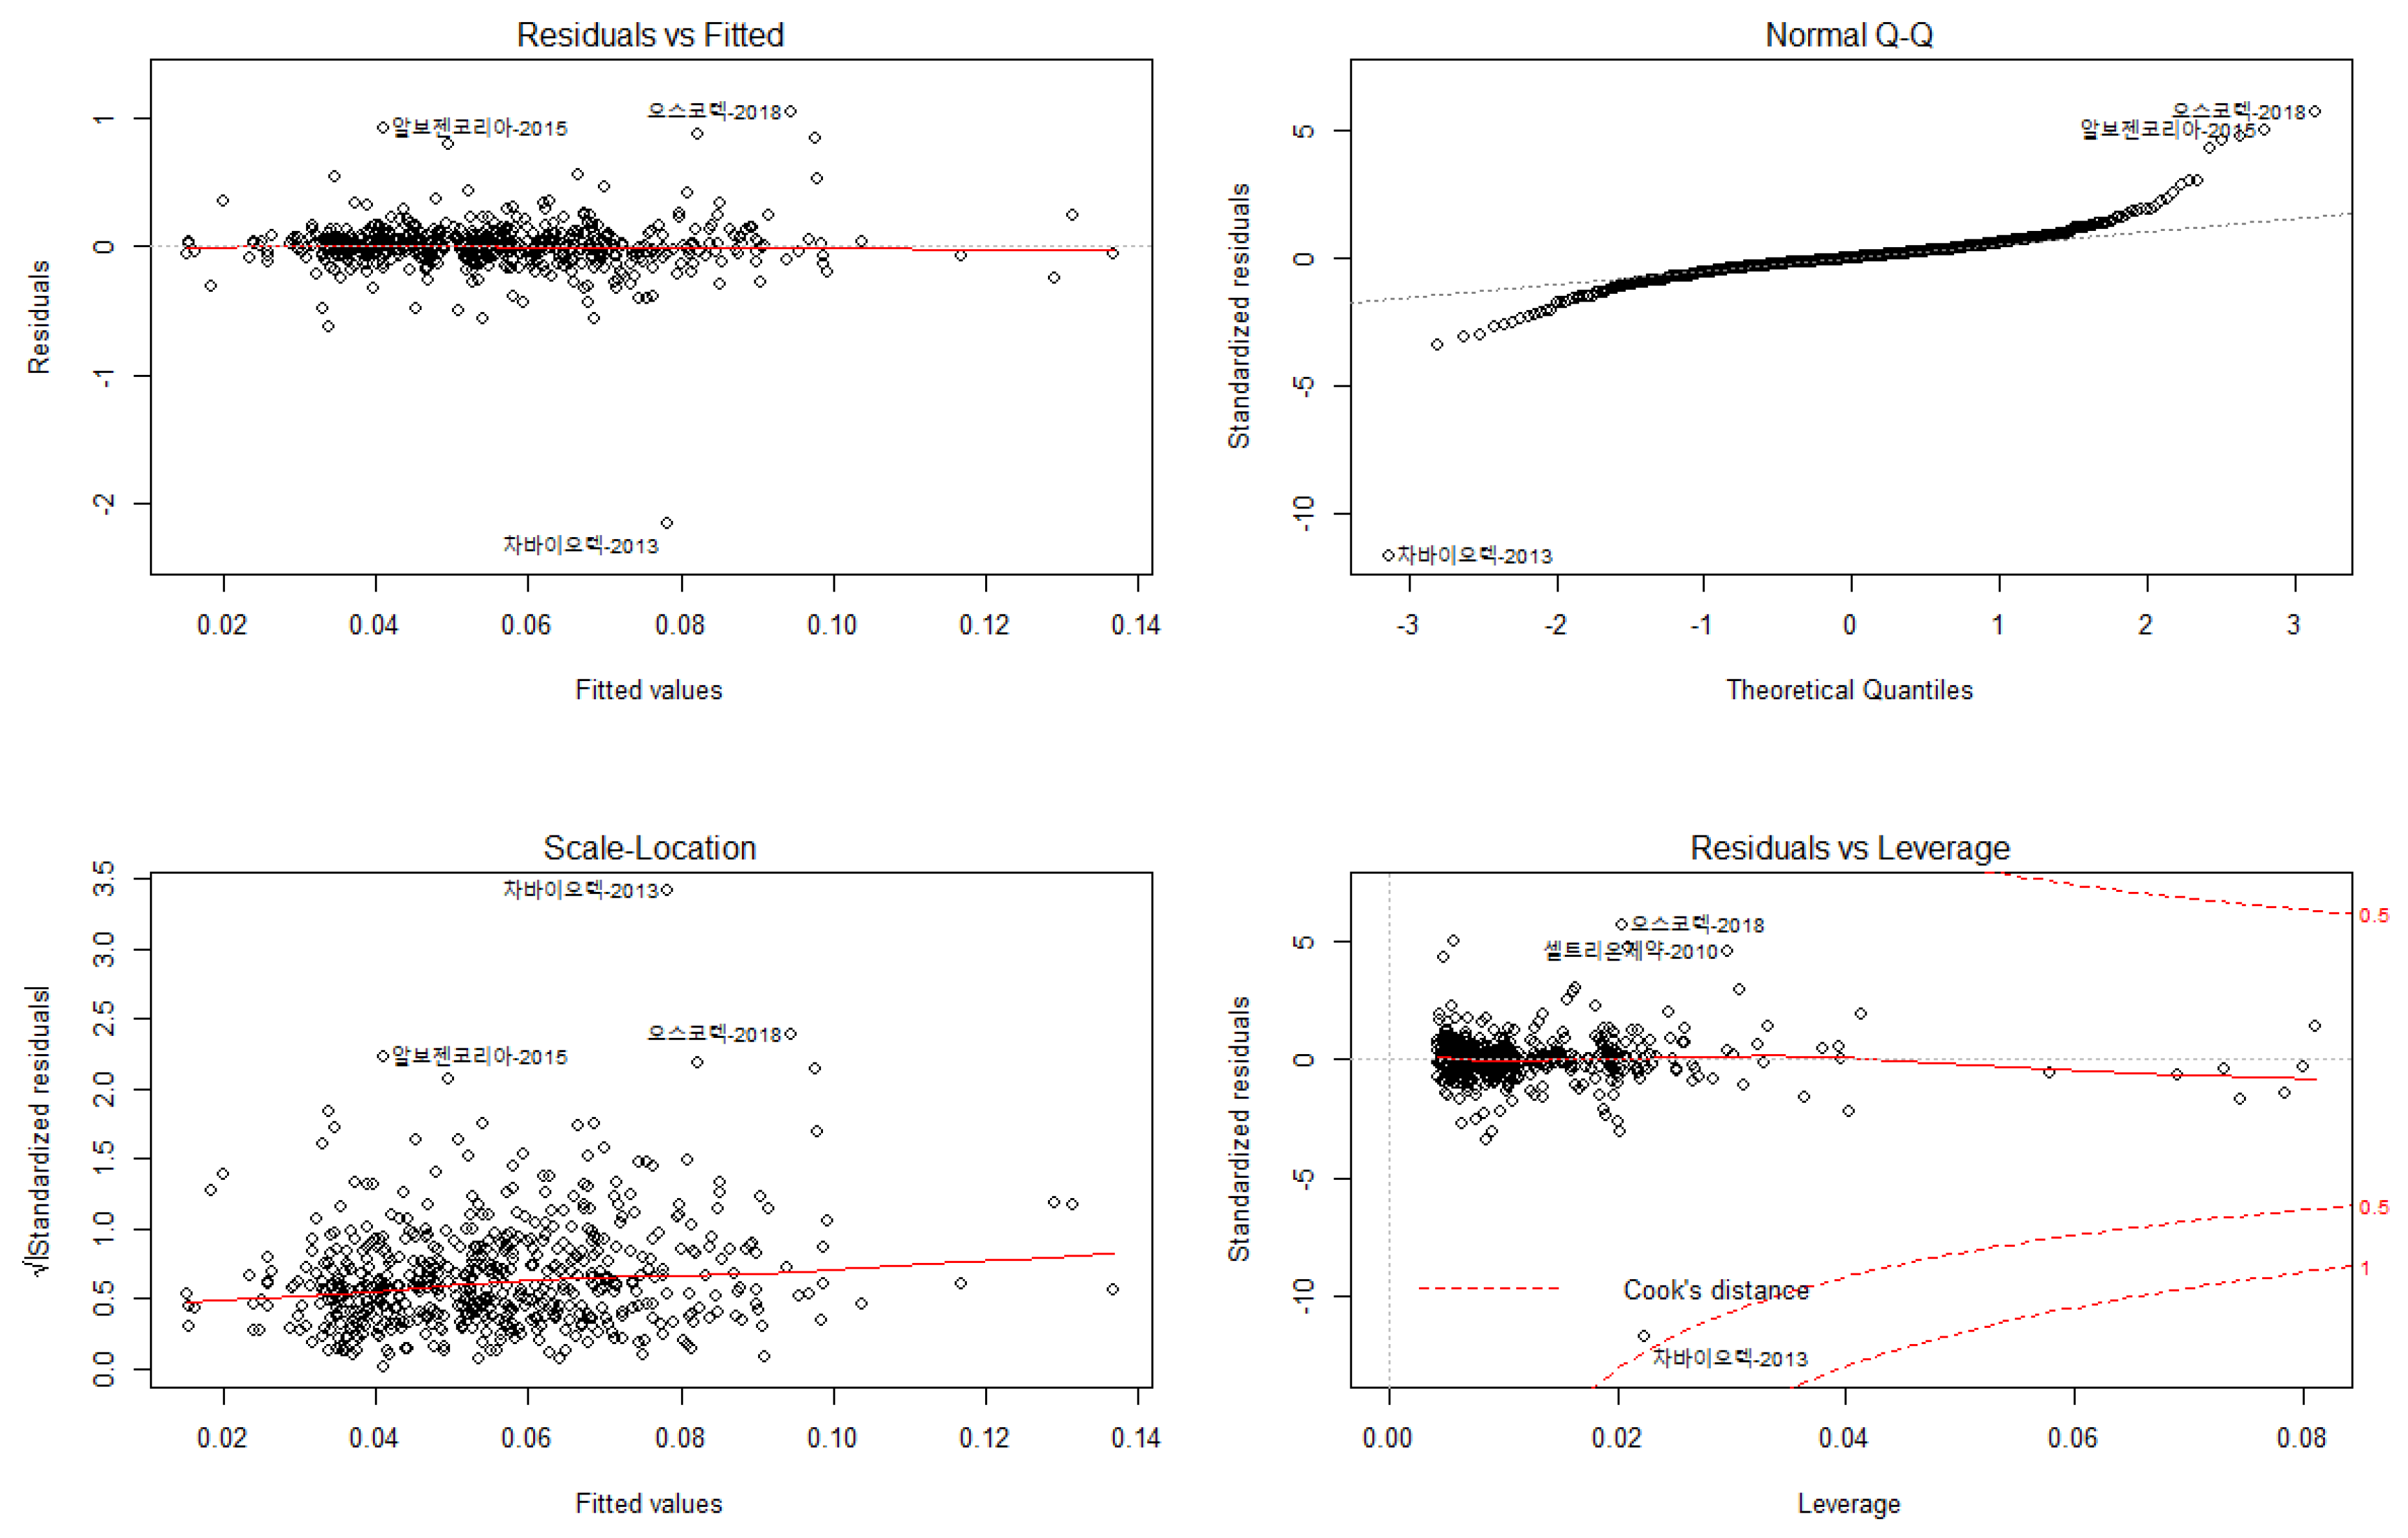
We performed a diagnostic check before estimating OLS. The residual plots in Appendix A (Figure A1) demonstrated the normality, independency, and homoscedasticity of the residuals, and satisfied the three assumptions, except for some higher and lower quantiles. Besides, we checked the stationary test to determine if the time point depended on the lagged time point, and the null hypothesis that the time point was non-stationary was rejected to confirm the stationary. For the stationary test, the Aggregated Dicky-Fuller Test was used. There are outliers in testing normality of residual distribution, independence of residual, and homoscedasticity in the data we have. If OLS estimator is used with outliers, high weight is given to outliers, and OLS is no more an unbiased estimator. Therefore, we used quantile regression, which is robust when there are outliers.
Our research is based on the model developed by Mazzucato and Parris. They analyzed factors affecting high-growth firms using long-term data from the US pharmaceutical industry (1963-2002) with penalized fixed effect quantile regression to consider the heterogeneity of the firm growth rate and to control firm-specific fixed effects [9]. They extended the traditional Gibrat type of sales growth equation model by adding R&D intensities, firm age, and dummy variables as well as the control variable for common macroeconomic impacts.
We applied penalized fixed effect quantile regression at 10%, 25%, 50%, 75%, 80%, 90% quantile to assess how firm-specific factors affect sales growth rate quantile and compared with OLS and fixed effect regression result.
Sales growth rate, which is the log difference of annual sales revenue between time t and t-1, is regressed on firm size, firm age, R&D intensity, R&D scale, growth level labelled FastGr, and patents persistence where R&D scale, growth level, and patents persistence are dummy variables with all the independent variables one-time lagged.
The model we used is as follows:
To check whether the differences across quantile regression are statistically different, we analyzed the interaction effects by adding the interaction term between the growth level dummy variable and R&D intensity where the value of growth dummy is 1 if the firm growth rate is above the industry median of the previous period and 0 otherwise.
We performed a robust test to verify our model. The pharmaceutical firms have been working on patent activities ahead of R&D. Patent persistence could not take into account the changing characteristics of patent activities every year. However, patent persistence could be considered as a fixed effect with time-invariant characteristics to remove the bias of R&D effects resulting from the omission of patent activities.
The Endogeneity test through the Wooldridge’s first-differential test for serial correlation in panel data does not reject the null hypothesis, thus there is no significant serial correlation in our model. The exogeneity test was done using the Durbin and Wu-Hausman test, and the null hypothesis is rejected. The purpose of this test is to select which model is appropriate between the fixed effect and random effect model, and the result means the fixed effect is a more appropriate model.
5. Results
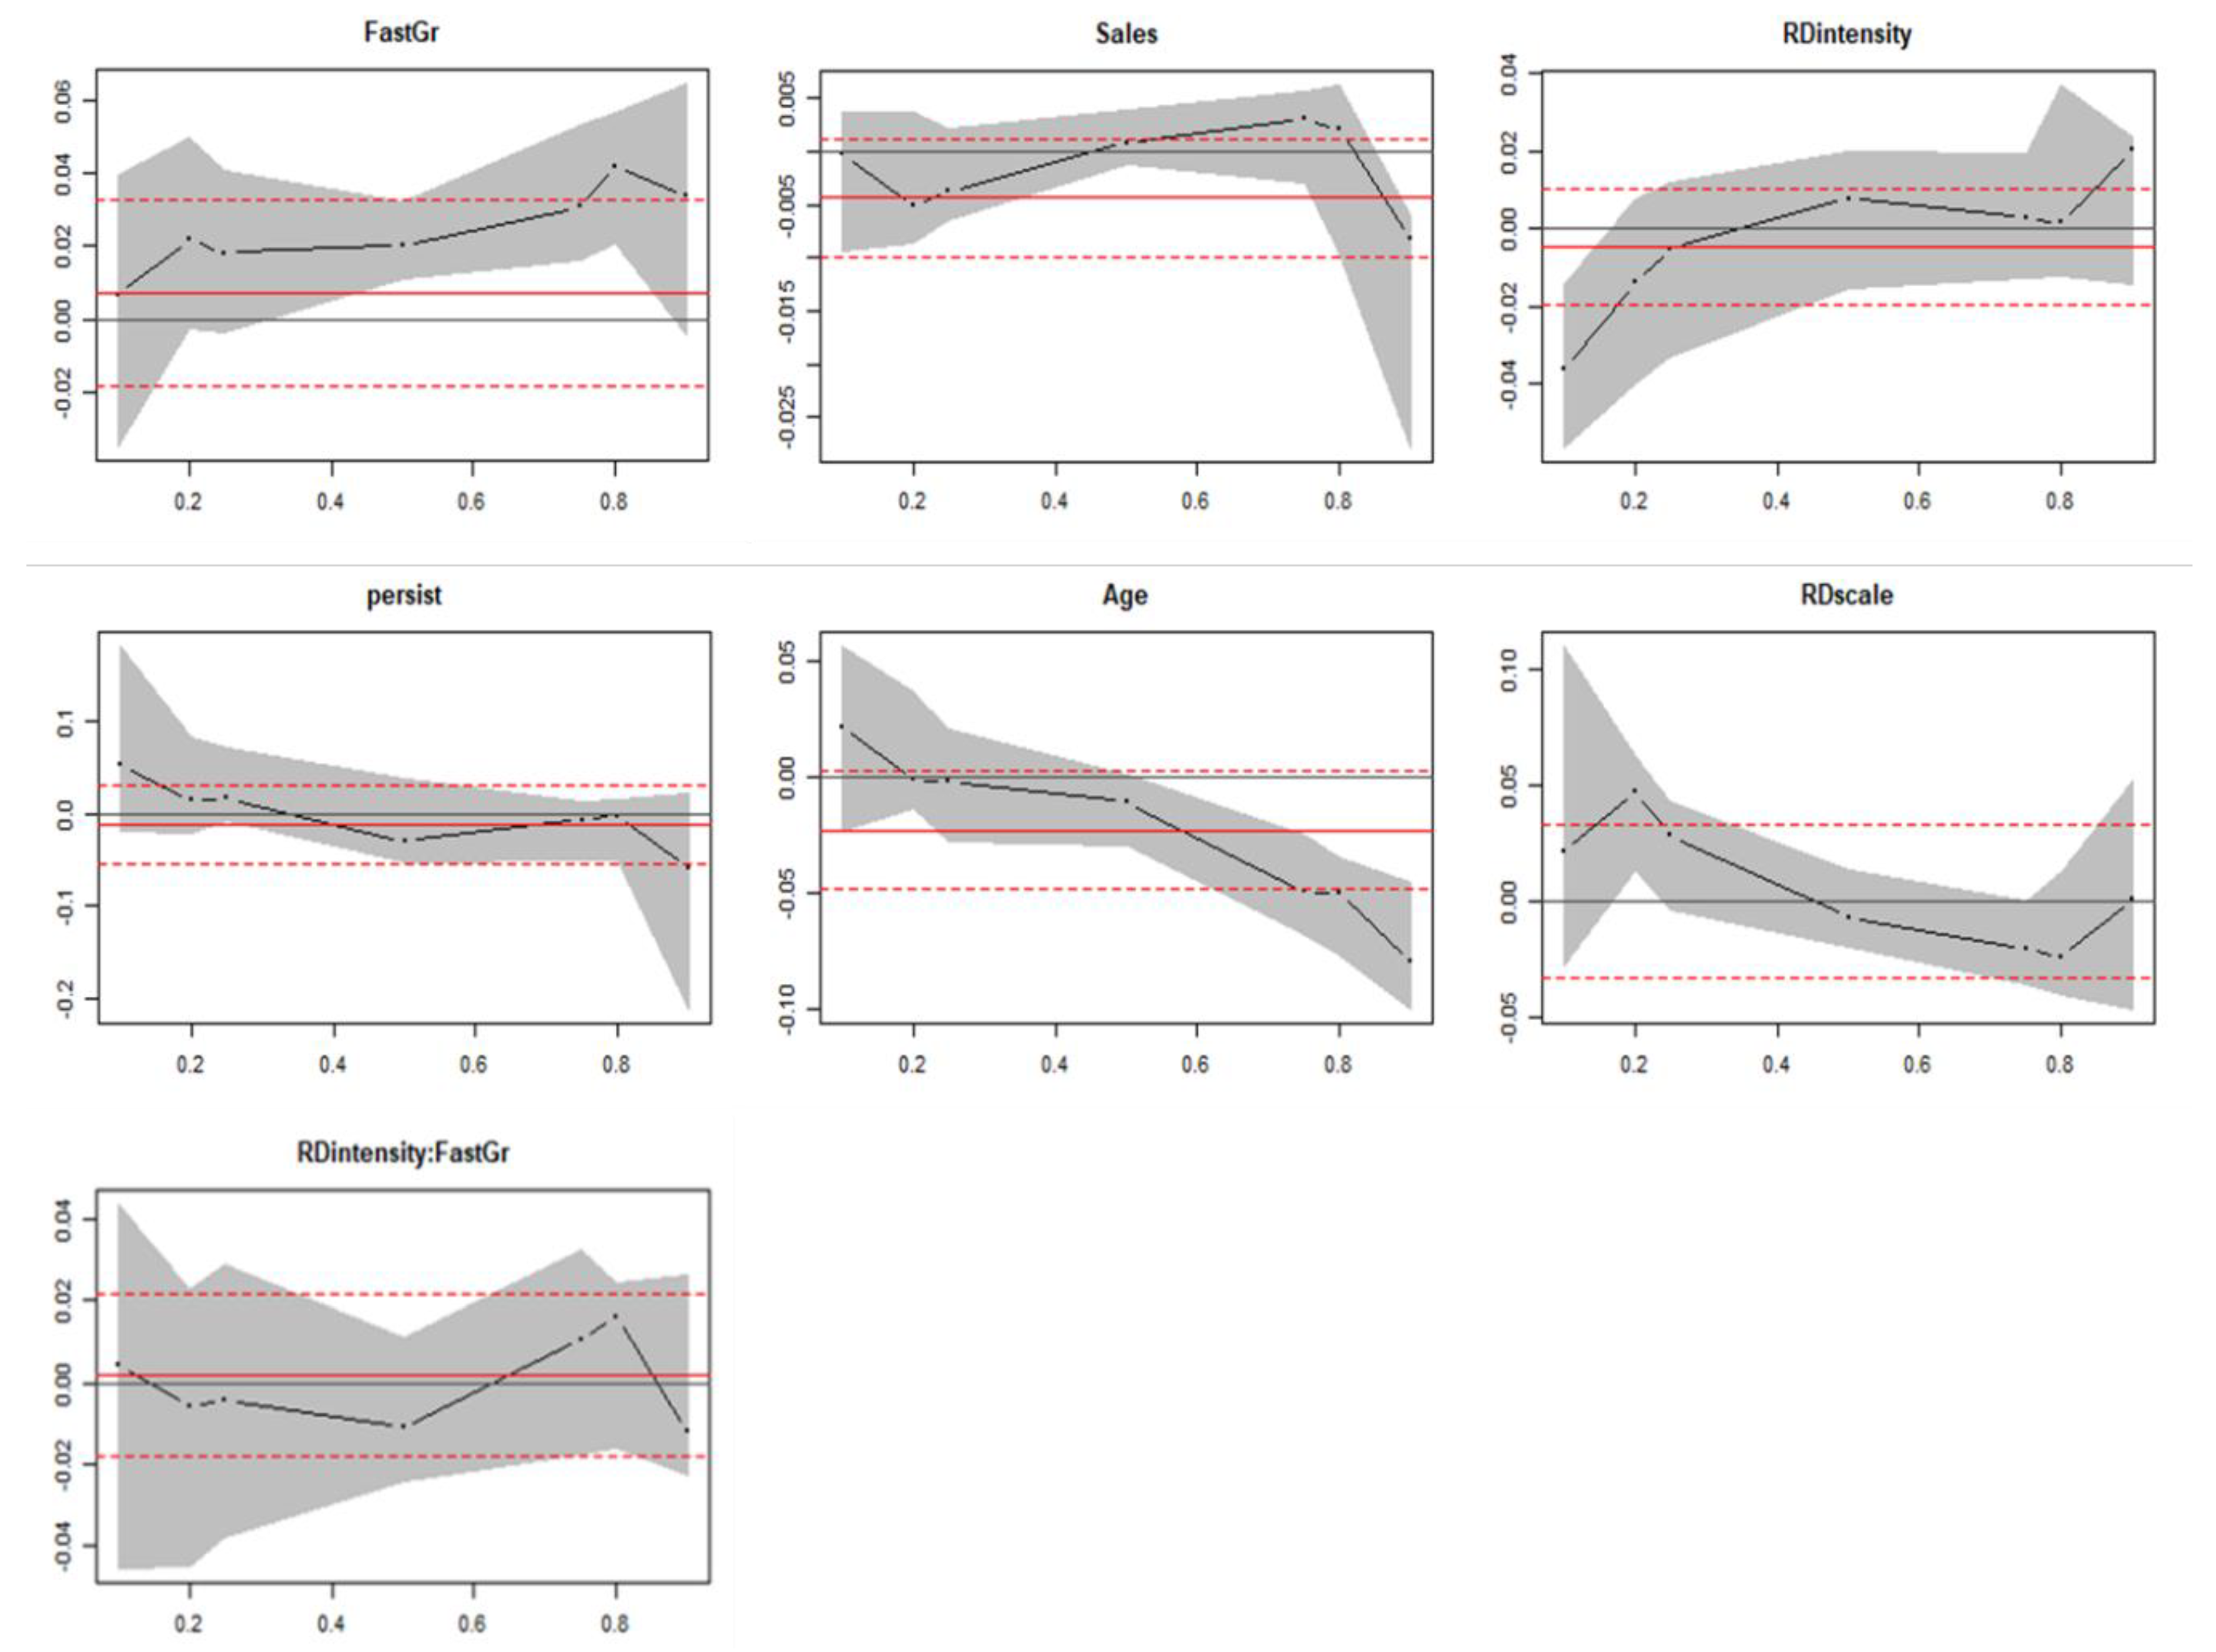
We empirically investigated how the firm growth rate is influenced by firm-specific factors under the Korean industry structure using quantile regression in comparing with the OLS regression results. The main results are provided in Figure 9 and Table 4 below.
The sloping black dotted line indicates the estimated coefficient of each variable over the conditional growth rate distribution. The shaded black color shows the confidence interval of the quantile regression. The solid red lines are the least square estimates with their confidence intervals in red dotted lines. The graphs enable us to compare OLS estimates with the quantile estimates and enrich the analysis.
5.1. Relationship between Firm Size, Age, and Firm Growth Rate
The impact of sales on the firm growth rate is not statistically significant in OLS while the impact is statistically significant with a negative effect at the lower quantile and the highest quantile but the positive effect at 75% and 80% quantile in quantile regression. This result is not in full agreement with those of many other previous research, where increasing size has a negative impact on growth. This size-growth relationship in the quantile regression provides us with a detailed explanation in each quantile, which OLS could not do. The fixed effect model shows a negative relationship between size and firm growth rate, which means when we fix time-invariant cross-sectional variation, only time variation could explain a negative relationship between size and firm growth rate.
The impact of firm size on firm growth rate is not statistically significant in OLS but the relationship between size and firm growth rate shows statistical significance at some quantiles either with a positive (70% and 80%) or negative effect (20%, 25%, 90%) in quantile regression. Thus, Gibrat’s law, Hypothesis 1, is rejected in the Korean pharmaceutical industry. The policy implication is if only focusing on small companies to boost the industry, it would mislead and not guarantee that the government would achieve fast growth of the industry.
The OLS estimate for firm age is not statistically significant with firm growth rate, which is the opposite result to those of previous literature, while quantile regression coefficients of firm age are negatively related to firm growth rate at upper quantiles. The relationship in OLS analysis is not consistent with previous literature, explaining that young firms grow faster while the relationship at the upper quantile shows consistency with the previous literature. As in the result of the relationship between firm size and firm growth rate, quantile regression gives us the benefit to understand the relationship more in detail across the level of growth, which the OLS does not provide. With this result, we could not reject Hypothesis 2. Thus, the government R&D policy to support young firms is beneficial in the Korean pharmaceutical industry.
5.2. Relationship between R&D and Firm Growth
The R&D intensity has no significant impact on the firm growth rate in the OLS while it has a positive effect on the firm growth rate at 80% and 90% quantile for the full sample of firms.
Mazzucato et al. (2015) show that R&D intensity has a positive effect on the firm growth rate in high growth firms under the competitive environment, and the result of our analysis is similar to it, considering the Korean pharmaceutical industry is an unconcentrated market as we could see it from the Herfindahl-Hirschman index and the Instability index in the previous section. With this result, Hypothesis 3a is accepted.
The OLS estimate of the R&D scale with R&D intensity being constant has no significant impact on the firm growth rate, and quantile regression estimates show a positive impact at lower (10%, 20%, and 25%) and negative at the upper quantile. It means that the firms with R&D expenditure above industry average benefit firm growth rate at the lower quantile, while firms at the upper quantile show a negative impact from R&D expenditure above industry level. Therefore, focusing on only R&D intensity for a high growth rate would mislead decision making both in the company or government and we should consider the two measures of R&D. One explanation would be the fact that there is a sizable R&D investment needed as well as time to benefit differentiated competitiveness from the innovation input. Considering high growth firms are young, the benefit from a large amount of R&D investment to catch up industry level would take time though R&D intensity based on sales revenue would benefit in the short-term. Other considerations would be related to falling productivity of R&D like other countries.
While OLS estimate of R&D scale has a positive effect on firm growth, the R&D scale in the fixed model is statistically insignificant. This result shows that the model’s fitness in this estimation equation reduces considering only time-variant characteristics. The R&D scale would be considered not to show considerable variation over time because the R&D investment is an important key activity in the pharmaceutical industry every year.
The implication from the analysis is that R&D intensity is a necessary condition for high firm growth in the Korean pharmaceutical industry even though the effect of the R&D scale has a different aspect for high growth firms.
To check whether there is a statistical difference of the impact of R&D intensity on firm growth rate among upper quantiles for firms with a growth rate above the industry average, we further conducted analysis with an interaction term between firm growth level and R&D intensity in equation (3). The interpretation of the coefficients of the two variables consisting of the interaction term is different from the liner additive term [42,78]. The effect of R&D intensity on the firm growth rate depends on the value of the moderating variable growth level. The meaning of coefficient is the impact of R&D intensity on the firm growth rate for the firms with a growth rate below the industry median, that is when is zero. The coefficient means the impact of R&D intensity on the firm growth rate for the firms with a growth rate above the industry median minus . The sum of and is the impact of the R&D intensity on the firm growth rate for the firms with a growth rate above the industry median.
In Table 5, the interaction effect of the term growth level * R&D intensity on firm growth is not significant for all the cases where the growth level dummy variable has a value of 1 if a firm growth rate is above the average, 75%, 80%, and 90% value of all companies, respectively. For comparison, we conducted further analysis changing the conditions such as removing the R&D scale variable considering the correlation with the R&D intensity, extending analysis period from 2002 to 2018, and taking both of them into account. Though we have not reported the results in detail in our research, none of the tests show statistical significance. It means that though R&D intensity has a positive effect on the firm growth rate for high growth firms for all the firms, we could not argue that the impact of R&D intensity on firm growth rate is different with statistical significance across the upper quantiles for firms with a growth rate above industry average. As a consequence, the hypothesis 3b is rejected.
5.3. Patent Persistence Variable
Patent persistence has a strong positive effect on the firm growth rate at lower quantile (10%, 20%, and 25%) and a negative effect on firm growth at or above median quantiles.
It is beyond our scope to analyze the causality between industry structure and firm growth with the data we gathered. However, we could consider how to achieve a high firm growth rate under the competitive market. The Korean pharmaceutical industry has been an unconcentrated for a long time. The market competition condition would be inferred that escape-competition effect to acquire a lead over rival as in Aghion et al.’s model dominates and encourages firms to innovate in the Korean pharmaceutical industry [79]. Pender et al.’s model (2014) of an inverted U-shaped relationship between innovation and firm concentration explains when competition is intense, incentives to invest in innovation activities are low due to low appropriability, whereas high appropriability with better protection of knowledge would cause an increase of the number of competitors resulting in increases in such innovation outcome as patent [62]. Though a patent is obviously considered a prerequisite for high growth rate, the patent does not show a positive effect on firm growth in the Korean pharmaceutical industry possibly due to an appropriability issue. Policy implication from our analysis is that strong protection and encouragement of patents rights as innovative outcomes is more beneficial for higher growth rate firms in the Korean pharmaceutical industry.
6. Conclusions
We analyze the relationship between R&D and firm growth with firm-specific factors under the Korean pharmaceutical industry structure. Although there have been many theoretical and empirical research to analyze the impact of innovation activities on firm growth, no satisfactory consensus has been made among these researchers with just several statistical and empirical regularities provided, and sometimes mixed results were drawn.
The pharmaceutical industry is expected to become a next-generation growth engine and is gaining much interest from the government in Korea, but analysis of the impact of innovation activities on firm growth in the industry has not had much progress.
We conduct the analysis using a quantile regression method considering the heterogeneity of the firm growth rates across firms. We also consider other firm-specific factors and industry structure in our analysis. To our best knowledge, this is a unique trial to use quantile regression as well as industry structure to analyze the relationship between R&D activities and firm growth rate for the listed pharmaceutical companies in Korea.
In this study using the quantile regression method, we found more detailed information on the impact of R&D on the firm growth rate than OLS analysis, which shows part of the whole story. R&D intensity has a positive effect on firm growth rate at high growth firms with R&D scale having a negative effect, which would reflect the characteristics of the pharmaceutical industry that it takes a lot of time and effort to benefit from the R&D investment. The government should consider industry-specific aspects and encourage R&D investment with proper policy tools, while the pharmaceutical firms need to find ways to enhance R&D productivity.
Patent persistence has a negative effect on firm growth rate at the upper quantile. It would be partly because there is an appropriability issue in the Korean pharmaceutical industry. Patent rights are critical for high growth in the pharmaceutical industry. The Korean pharmaceutical firms should pay more attention to patent rights and put more efforts into it, while the government will have to support innovative pharmaceutical companies through far-reaching policy measures to enhance appropriability to boost global competitiveness. The Korean pharmaceutical industry has been unconcentrated for a long time, where escape-competition effect of winning competitors would dominate to provide incentives to invest R&D, thus policy for high appropriability to better protect the knowledge would lead to increases in innovation outcomes.
The impact of sales size on firm growth rate shows a positive or negative effect on firm growth rate in quantile regression, thus Gibrat’s law is rejected in the Korean pharmaceutical industry. The rejection of Gibrat’s law is consistent with the result of other previous research. The effect of firm age on the growth rate at the upper quantile shows that young firms grow faster. The implication is that young firms are not necessarily small firms, thus government R&D policy to support young firms is beneficial in the Korean pharmaceutical industry.
In summary, the implication of our research is that the government should encourage and support R&D investment activities, patent rights, as well as young firms, while the Korean pharmaceutical companies should enhance R&D productivity as well as invest in R&D and consider patents rights as a strategic asset.
Limitations to our study are as follows. First, we only include listed pharmaceutical companies, thus it may cause sample selection bias and overestimate the size effect of small firms on the firm growth rate. Likewise, missing big but non-listed or recently listed companies would cause distorted results for the large companies such as Samsung Biologics. Second, the classification of R&D data is not enough to gather specific data such as product and process R&D, incremental and innovative R&D, basic and applied R&D, and so on. It is hypothesized that small and new firms to focus more on the product and innovative R&D and large firms put more significant efforts on the process and incremental R&D to allocate their cost to products and enjoy economies of scale. If we could break down the R&D data, it would enable us to enrich the analysis. Lastly, there is an accuracy problem with R&D data. For example, it is not required in Korea to specify R&D depreciation cost in manufacturing costs statement, one of the financial statements, thus we could not get full information of the R&D data.
Though quantile regression is a more appropriate method than OLS for analysis of heterogeneous firm growth rate, the R-squared was characteristically low in many empirical research. Still more empirical research based on more quality data and statistical methods are needed to better reveal the relationship between firm growth and innovation.
Author Contributions
H.C. and C.L. conceived and designed the experiments; S.E. analyzed the data; H.C. and S.E. wrote the paper, and C.L. proofread and revised the manuscript.
Funding
This work was supported under the framework of international cooperation program managed by National Research Foundation of Korea (NRF-2016K2A9A2A11938449).
Conflicts of Interest
The authors declare no conflict of interest.
Appendix A
Figure A1.
The residual plots.

References
- Zhang, W.B. Business Cycles, Growth and Imported Energy in a Small-Open Growth Model. Oradea J. Bus. Econ. 2018, 3, 7–21. [Google Scholar]
- Geroski, P.A. Understanding the implications of empirical work on corporate growth rates. Manag. Decis. Econ. 2005, 26, 129–138. [Google Scholar] [CrossRef]
- McKelvie, A.; Wiklund, J. Advancing firm growth research: A focus on growth mode instead of growth rate. Entrep. Theory Pract. 2010, 34, 261–288. [Google Scholar] [CrossRef]
- Sutton, J. Gibrat’s Legacy. J. Econ. Lit. 1997, 35, 40–59. [Google Scholar]
- Cohen, W.M. Fifty years of empirical studies of innovative activity and performance. Handb. Econ. Innov. 2010, 1, 129–213. [Google Scholar]
- Martin, K.D.; Josephson, B.W.; Vadakkepatt, G.G.; Johnson, J.L. Political Management, Research and Development, and Advertising Capital in the Pharmaceutical Industry: A Good Prognosis? J. Mark. 2018, 82, 87–107. [Google Scholar] [CrossRef]
- Firm Growth: A Survey. Available online: https://hal.archives-ouvertes.fr/halshs-00155762/ (accessed on 17 May 2019).
- Audretsch, D.B.; Coad, A.; Segarra, A. Firm growth and innovation. Small Bus. Econ. 2014, 43, 743–749. [Google Scholar] [CrossRef]
- Mazzucato, M.; Parris, S. High-growth firms in changing competitive environments: The US pharmaceutical industry (1963 to 2002). Small Bus. Econ. 2015, 44, 145–170. [Google Scholar] [CrossRef]
- Coad, A.; Rao, R. Innovation and firm growth in high-tech sectors: A quantile regression approach. Res. Policy 2008, 37, 633–648. [Google Scholar] [CrossRef] [Green Version]
- Delmar, F.; Davidsson, P.; Gartner, W.B. Arriving at the high-growth firm. J. Bus. Ventur. 2003, 18, 189–216. [Google Scholar] [CrossRef] [Green Version]
- Hölzl, W. Is the R&D behaviour of fast-growing SMEs different? Evidence from CIS III data for 16 countries. Small Bus. Econ. 2009, 33, 59–75. [Google Scholar] [Green Version]
- Falk, M. Quantile estimates of the impact of R&D intensity on firm performance. Small Bus. Econ. 2012, 39, 19–37. [Google Scholar]
- Geroski, P.A. The Growth of Firms in Theory and in Practice. Competence, Governance, and Entrepreneurship-Advances in Economic Strategy Research; Oxford University Press: Oxford, UK, 2002. [Google Scholar]
- Simon, H.A.; Bonini, C.P. American Economic Association the Size Distribution of Business Firms. Am. Econ. Rev. 1958, 48, 607–617. [Google Scholar]
- Evans, D.S. Tests of Alternative Theories of Firm Growth. J. Polit. Econ. 1987, 95, 657–674. [Google Scholar] [CrossRef]
- Evans, D.S. The Relationship between Firm Growth, Size, and Age: Estimates for 100 Manufacturing Industries. J. Ind. Econ. 1987, 35, 567–581. [Google Scholar] [CrossRef]
- Hall, B.H. The Relationship between Firm Size and Firm Growth in the US Manufacturing Sector. J. Ind. Econ. 1987, 35, 583–600. [Google Scholar] [CrossRef]
- Hart, P.E.; Oulton, N. Growth and Size of Firms. Econ. J. 1987, 106, 1242–1252. [Google Scholar] [CrossRef]
- Bentzen, J.; Madsen, E.S.; Smith, V. Do firms’ growth rates depend on firm size? Small Bus. Econ. 2012, 39, 937–947. [Google Scholar] [CrossRef]
- Mansfield, E. Entry, Gibrat’s Law, Innovation, and the Growth of Firms. Am. Econ. Rev. 1962, 52, 1023–1051. [Google Scholar]
- Stanley, H.E.; Salinger, M.A.; Leschhorn, H.; Amaral, L.A.N.; Maass, P.; Havlin, S.; Buldyrev, S.V. Scaling behaviour in the growth of companies. Nature 1996, 379, 804–806. [Google Scholar] [CrossRef]
- Bottazzi, G.; Secchi, A. Why are distributions of firm growth rates tent-shaped? Econ. Lett. 2003, 80, 415–420. [Google Scholar] [CrossRef]
- Bottazzi, G.; Secchi, A. Explaining the distribution of firm growth rates. RAND J. Econ. 2006, 37, 235–256. [Google Scholar] [CrossRef]
- McKelvey, B.; Andriani, P. Why Gaussian statistics are mostly wrong for strategic organization. Strateg. Organ. 2005, 3, 219–228. [Google Scholar] [CrossRef]
- Reichstein, T.; Jensen, M.B. Firm size and firm growth rate distributions—The case of Denmark. Ind. Corp. Chang. 2005, 14, 1145–1166. [Google Scholar] [CrossRef]
- Buldyrev, S.V.; Growiec, J.; Pammolli, F.; Riccaboni, M.; Stanley, H.E. The growth of business firms: Facts and theory. J. Eur. Econ. Assoc. 2007, 5, 574–584. [Google Scholar] [CrossRef]
- Koenker, R.; Bassett, G. Regression Quantiles. Econ. J. Econ. Soc. 1978, 46, 33–50. [Google Scholar] [CrossRef]
- Coad, A.; Holm, J.R.; Krafft, J.; Quatraro, F. Firm age and performance. J. Evol. Econ. 2018, 28, 1–11. [Google Scholar] [CrossRef]
- Haltiwanger, J.; Jarmin, R.M.J. Who creates jobs? Small versus large versus young. Rev. Econ. Stat. 2013, 95, 347–361. [Google Scholar] [CrossRef]
- Coad, A. Firm age: A survey. J. Evol. Econ. 2018, 28, 13–43. [Google Scholar] [CrossRef]
- Audretsch, D.B.; Klomp, L.; Santarelli, E.; Thurik, A.R. Gibrat’s Law: Are the services different? Rev. Ind. Organ. 2004, 24, 301–324. [Google Scholar] [CrossRef]
- Distante, R.; Petrella, I.; Santoro, E. Gibrat’s law and quantile regressions: An application to firm growth. Econ. Lett. 2018, 164, 5–9. [Google Scholar] [CrossRef]
- Dunne, P.; Hughes, A. Age, Size, Growth and Survival: UK Companies in the 1980s. J. Ind. Econ. 2006, 42, 115–140. [Google Scholar] [CrossRef]
- Geroski, P.A. What do we know about entry? Int. J. Ind. Organ. 1995, 13, 421–440. [Google Scholar] [CrossRef]
- Lotti, F.; Santarelli, E.; Vivarelli, M. Does Gibrat’s law hold among young, small firms? J. Evol. Econ. 2003, 13, 213–235. [Google Scholar] [CrossRef]
- Lotti, F.; Santarelli, E.; Vivarelli, M. Defending Gibrat’s law as a long-run regularity. Small Bus. Econ. 2009, 32, 31–44. [Google Scholar] [CrossRef]
- Serrasqueiro, Z.; Nunes, P.M.; Leitão, J.; Armada, M. Are there non-linearities between SME growth and its determinants? A quantile approach. Ind. Corp. Chang. 2010, 19, 1071–1108. [Google Scholar] [CrossRef]
- Davies, S.W.; Geroski, P.A. Changes in Concentration, Turbulence, and the Dynamics of Market Shares. Rev. Econ. Stat. 2002, 79, 383–391. [Google Scholar] [CrossRef]
- Reichstein, T.; Dahl, M.S. Are firm growth rates random? Analysing patterns and dependencies. Int. Rev. Appl. Econ. 2004, 18, 225–246. [Google Scholar] [CrossRef]
- Reichstein, T.; Dahl, M.S.; Ebersberger, B.; Jensen, M.B. The devil dwells in the tails. J. Evol. Econ. 2009, 20, 219–231. [Google Scholar] [CrossRef] [Green Version]
- Spescha, A. R&D expenditures and firm growth – is small beautiful? Econ. Innov. New Technol. 2018, 28, 1–24. [Google Scholar]
- Akcigit, U.; Kerr, W.R. Growth through Heterogeneous Innovations. J. Polit. Econ. 2018, 126, 1374–1443. [Google Scholar] [CrossRef] [Green Version]
- Coad, A.; Hölzl, W. Firm growth: Empirical analysis. In Handbook on the Economics and Theory of the Firm; Edward Elgar Publishing: Cheltenham, UK, 2012. [Google Scholar]
- Moreno, A.M.; Casillas, J.C. High-growth SMEs versus non-high-growth SMEs: a discriminant analysis. Entrep. Reg. Dev. 2007, 19, 69–88. [Google Scholar] [CrossRef]
- Capasso, M.; Treibich, T.; Verspagen, B. The medium-term effect of R&D on firm growth. Small Bus. Econ. 2015, 45, 39–62. [Google Scholar] [Green Version]
- Coad, A.; Rao, R. Firm growth and R&D expenditure. Econ. Innov. New Technol. 2009, 9, 127–145. [Google Scholar]
- Del Monte, A.; Papagni, E. R&D and the growth of firms: Empirical analysis of a panel of Italian firms. Res. Policy 2003, 32, 1003–1014. [Google Scholar]
- Nunes, P.M.; Serrasqueiro, Z.; Leitão, J. Is there a linear relationship between R&D intensity and growth? Empirical evidence of non-high-tech vs. high-tech SMEs. Res. Policy 2010, 41, 36–53. [Google Scholar]
- Demirel, P.; Mazzucato, M. Innovation and Firm Growth: Is R&D Worth It? Ind. Innov. 2012, 19, 45–62. [Google Scholar] [Green Version]
- Deschryvere, M. R&D, firm growth and the role of innovation persistence: An analysis of Finnish SMEs and large firms. Small Bus. Econ. 2014, 43, 767–785. [Google Scholar]
- Mason, C.; Brown, R. Creating good public policy to support high-growth firms. Small Bus. Econ. 2013, 40, 211–225. [Google Scholar] [CrossRef]
- Stam, E.; Wennberg, K. The roles of R&D in new firm growth. Small Bus. Econ. 2009, 33, 77–89. [Google Scholar] [Green Version]
- Almus, M. What characterizes of fast-growing firm? Appl. Econ. 2002, 34, 1497–1508. [Google Scholar] [CrossRef]
- Capasso, M.; Cefis, E.; Frenken, K. On the existence of persistently outperforming firms. Ind. Corp. Chang. 2014, 23, 997–1036. [Google Scholar] [CrossRef]
- Coad, A.; Segarra, A.; Teruel, M. Innovation and firm growth: Does firm age play a role? Res. Policy 2016, 45, 387–400. [Google Scholar] [CrossRef]
- Goedhuys, M.; Sleuwaegen, L. High-growth versus declining firms: The differential impact of human capital and R&D. Appl. Econ. Lett. 2016, 23, 369–372. [Google Scholar]
- Coad, A.; Daunfeldt, S.O.; Hölzl, W.; Johansson, D.; Nightingale, P. High-growth firms: Introduction to the special section. Ind. Corp. Chang. 2014, 23, 91–112. [Google Scholar] [CrossRef]
- Teruel, M.; De Wit, G. Determinants of high-growth firms: Why do some countries have more high-growth firms than others. In Exploring the Entrepreneurial Society: Institutions, Behaviors and Outcomes; Edward Elgar Publishing: Cheltenham, UK, 2017; pp. 46–58. [Google Scholar]
- Demir, R.; Wennberg, K.; McKelvie, A. The Strategic Management of High-Growth Firms: A Review and Theoretical Conceptualization. Long Range Plan. 2017, 50, 431–456. [Google Scholar] [CrossRef]
- Stam, E. Growth beyond Gibrat: Firm growth processes and strategies. Small Bus. Econ. 2010, 35, 129–135. [Google Scholar] [CrossRef]
- Peneder, M.; Woerter, M. Competition, R&D and innovation: Testing the inverted-U in a simultaneous system. J. Evol. Econ. 2014, 2, 653–687. [Google Scholar]
- Dolfsma, W.; van der Velde, G. Industry innovativeness, firm size, and entrepreneurship: Schumpeter Mark III? J. Evol. Econ. 2014, 24, 713–736. [Google Scholar] [CrossRef]
- Malerba, F.; Orsenigo, L. Schumpeterian patterns of innovation are technology-specific. Res. Policy 1996, 25, 451–478. [Google Scholar] [CrossRef]
- Aghion, P.; Bloom, N.; Blundell, R.; Griffith, R.; Howitt, P. Competition and Innovation: An Inverted-U Relationship. Q. J. Econ. 2005, 120, 701–728. [Google Scholar]
- Kamien, M.I.; Schwartz, N.L. On the Degree of Rivalry for Maximum Innovative Activity. Q. J. Econ. 1976, 90, 245–260. [Google Scholar] [CrossRef]
- Hashmi, A.R. Competition and innovation: The inverted-u relationship revisited. Rev. Econ. Stat. 2013, 95, 1653–1668. [Google Scholar] [CrossRef]
- Aghion, P.; Akcigit, U.; Howitt, P. Lessons from Schumpeterian Growth Theory. Am. Econ. Rev. 2015, 105, 94–99. [Google Scholar] [CrossRef]
- Aghion, P.; Howitt, P. Market Structure and the Growth Process. Rev. Econ. Dyn. 1998, 1, 276–305. [Google Scholar] [CrossRef]
- Gilbert, R. Looking for Mr. Schumpeter: Where Are We in the Competition-Innovation Debate? Innov. Policy Econ. 2006, 6, 159–215. [Google Scholar] [CrossRef]
- Bottazzi, G.; Coad, A.; Jacoby, N.; Secchi, A. Corporate growth and industrial dynamics: Evidence from French manufacturing. Appl. Econ. 2011, 43, 103–116. [Google Scholar] [CrossRef]
- Coad, A. A closer look at serial growth rate correlation. Rev. Ind. Organ. 2007, 31, 69–82. [Google Scholar] [CrossRef]
- Brown, J.R.; Fazzari, S.M.; Petersen, B.C. Financing innovation and growth: Cash flow, external equity, and the 1990s R&D boom. J. Financ. 2009, 64, 151–185. [Google Scholar]
- Stephen, H.; Peter, P. Firm Size and Rate of Growth. J. Polit. Econ. 1962, 70, 556–569. [Google Scholar]
- Mazzucato, M. The PC industry: New economy or early life-cycle? Rev. Econ. Dyn. 2002, 5, 318–345. [Google Scholar] [CrossRef]
- Ebersberger, B.; Marsili, O.; Reichstein, T.; Salter, A. Into thin air: Using a quantile regression approach to explore the relationship between R&D and innovation. Int. Rev. Appl. Econ. 2010, 24, 95–102. [Google Scholar]
- Segarra, A.; Teruel, M. High-growth firms and innovation: An empirical analysis for Spanish firms. Small Bus. Econ. 2014, 43, 805–821. [Google Scholar] [CrossRef]
- Brambor, T.; Clark, W.; Golder, M. Understanding Interaction Models: Improving Empirical Analyses. Polit. Anal. 2006, 14, 63–82. [Google Scholar] [CrossRef]
- Aghion, P.; Akcigit, U.; Howitt, P. The Schumpeterian Growth Paradigm. Annu. Rev. Econ. 2015, 7, 557–575. [Google Scholar] [CrossRef]
Figure 1.
Frequency of achieving at least one year over the 80th percentile sales growth.

Figure 2.
Frequency of achieving over the 80th percentile sales growth in consecutive years.

Figure 3.
Plot of sales growth rate (a) pattern of sales growth; (b) density plot of sales growth versus normal distribution.
Figure 3.
Plot of sales growth rate (a) pattern of sales growth; (b) density plot of sales growth versus normal distribution.

Figure 4.
Kurtosis plot for sales growth rate.

Figure 5.
Herfindahl-Hirschman Index.

Figure 6.
Pharma Concentration Ratio.

Figure 7.
Market share instability index.

Figure 8.
Sales, research and development (R&D), and R&D intensity for the top 10 companies.

Figure 9.
Variation in the coefficient on variables over the conditional quantiles.


Table 1.
Summary of key descriptive statistics.
| Mean | SD | Variance | Skewness | Kurtosis | Median | Min | Max | |
|---|---|---|---|---|---|---|---|---|
| gr | 0.06 | 0.19 | 0.04 | −1.09 | 31.84 | 0.08 | −2.07 | 1.15 |
| Sales | 23.98 | 2.37 | 5.62 | −2.16 | 9.01 | 24.58 | 8.45 | 27.54 |
| R&D intensity | 0.03 | 1.3 | 169 | 1.93 | 5.98 | −0.3 | −5.56 | 7.15 |
| Persist | 0.88 | 0.32 | 0.1 | −2.35 | 3.54 | 1 | 0 | 1 |
| Age | 3.64 | 0.55 | 0.3 | −0.61 | −0.24 | 3.81 | 2.08 | 4.8 |
| R&D scale | 0.25 | 0.43 | 0.18 | 1.16 | −0.66 | 0 | 0 | 1 |
| FastGr | 0.49 | 0.5 | 0.25 | 0.03 | -2 | 0 | 0 | 1 |
Table 2.
Correlation coefficients.
| (1) gr_t | (2) Sales | (3) R&D Intensity | (4) Persist | (5) Age | (6) R&D Scale | (7) FastGr | |
|---|---|---|---|---|---|---|---|
| (1) | 1 | ||||||
| (2) | −0.060 | 1 | |||||
| (3) | −0.000 | −0.058 | 1 | ||||
| (4) | −0.032 | 0.003 | 0.167 | 1 | |||
| (5) | −0.070 | 0.077 | −0.344 | 0.101 | 1 | ||
| (6) | −0.032 | 0.285 | 0.317 | 0.146 | 0.078 | 1 | |
| (7) | 0.030 | 0.003 | 0.02 | −0.061 | −0.146 | −0.026 | 1 |
Table 3.
Small and Medium-sized Enterprise (SME) a.
| Number of Firms | Ratio (%) | Revenue (Billion KRW) b | Ratio (%) | |
|---|---|---|---|---|
| 2009 | 34 | 58 | 1505 | 19 |
| 2018 | 24 | 41 | 1022 | 9 |
Notes: a The criteria of SME in the Korean pharma is below 80 billion KRW in sales revenue on a three-year average by Ministry of SMEs and Startups. b Each number is the three-eyear average.
Table 4.
OLS, fixed effect, penalized quantile regression with fixed effect, 2007–2018.
| OLS | FE | Quantile | |||||||
|---|---|---|---|---|---|---|---|---|---|
| 10% | 20% | 25% | 50% | 75% | 80% | 90% | |||
| Sales | −0.0043932 | −0.0088826 ** | −0.00141 | −0.00541 *** | −0.00372 ** | 0.00044 | 0.00414 *** | 0.00163 * | −0.00773 * |
| (0.0034194) | (0.0042353) | (0.00223) | (0.00173) | (0.00177) | (0.00092) | (0.00035) | (0.00083) | (0.00411) | |
| R&D intensity | −0.003543 | −0.0071336 | −0.03197 *** | −0.01913 *** | −0.00936 ** | 0.00519 ** | 0.00468 | 0.0095 * | 0.01569 *** |
| (0.0070278) | (0.0100283) | (0.00412) | (0.00628) | (0.00423) | (0.00225) | (0.00456) | (0.00495) | (0.00451) | |
| Persist | −0.0119276 | 0.0412702 | 0.05481 *** | 0.01394 *** | 0.01648 *** | −0.03263 *** | −0.00722 | −0.01556 *** | −0.06845 *** |
| (0.025831) | (0.0474662) | (0.01885) | (0.00335) | (0.00548) | (0.00313) | (0.00762) | (0.00436) | (0.00898) | |
| Age | −0.0230032 | −0.2339024 ** | 0.01864 | −0.00254 | −0.0016 | −0.01083 | −0.05016 *** | −0.05068 *** | −0.0804 *** |
| (0.015417) | (0.0925024) | (0.01827) | (0.00837) | (0.00895) | (0.00952) | (0.00845) | (0.0138) | (0.01036) | |
| R&D scale | 0.0003367 | −0.0582653 | 0.02592 ** | 0.0496 *** | 0.02832 *** | −0.00455 | −0.01931 *** | −0.01897 *** | −0.00014 |
| (0.0201998) | (0.0376301) | (0.01013) | (0.00487) | (0.00177) | (0.00296) | (0.00483) | (0.00719) | (0.01323) | |
| FastGr | 0.0070738 | −0.02436 | 0.00392 | 0.02461 ** | 0.01985 ** | 0.01865 ** | 0.03471 *** | 0.03532 *** | 0.03316 *** |
| (0.015532) | (0.015532) | (0.00574) | (0.01017) | (0.00837) | (0.00881) | (0.00589) | (0.00627) | (0.00629) | |
| α | 0.2515344 ** | - | −0.19824 *** | 0.0647 * | 0.05202 * | 0.1061 *** | 0.20119 *** | 0.28855 *** | 0.72554 *** |
| (0.0999822) | (0.04155) | (0.03601) | (0.02737) | (0.01452) | (0.03818) | (0.05042) | (0.07687) | ||
| Obs | 590 | 590 | 590 | 590 | 590 | 590 | 590 | 590 | 590 |
*** 1, ** 5, * 10% significance level, standard error in brackets.
Table 5.
The results of interaction effect, 2007–2018.
| Dependent Variable: Sales Growth Rate | ||||||||
|---|---|---|---|---|---|---|---|---|
| FastGr (≥50%) | FastGr (≥60%) | FastGr (≥65%) | FastGr (≥70%) | FastGr (≥75%) | FastGr (≥80%) | FastGr (≥85%) | FastGr (≥90%) | |
| Constant | 0.254 ** (0.100) | 0.246 ** (0.100) | 0.240 ** (0.100) | 0.241 ** (0.100) | 0.246 ** (0.100) | 0.246 ** (0.100) | 0.252 ** (0.100) | 0.265 *** (0.100) |
| Sales | −0.004 (0.003) | −0.004 (0.003) | −0.004 (0.003) | −0.004 (0.003) | −0.004 (0.003) | −0.004 (0.003) | −0.004 (0.003) | −0.005 (0.003) |
| gr | 0.020 (0.049) | 0.002 (0.049) | −0.003 (0.049) | −0.003 (0.048) | 0.009 (0.048) | 0.007 (0.048) | 0.021 (0.047) | 0.040 (0.047) |
| R&D intensity | −0.004 (0.009) | −0.005 (0.009) | −0.003 (0.009) | −0.005 (0.009) | −0.003 (0.008) | −0.004 (0.007) | −0.003 (0.007) | −0.004 (0.007) |
| Persist | −0.012 (0.026) | −0.012 (0.026) | −0.011 (0.026) | −0.012 (0.026) | −0.011 (0.026) | −0.012 (0.026) | −0.012 (0.026) | −0.012 (0.026) |
| Age | −0.023 (0.015) | −0.022 (0.015) | −0.022 (0.015) | −0.022 (0.015) | −0.022 (0.015) | −0.022 (0.015) | −0.023 (0.015) | −0.024 (0.015) |
| R&D scale | −0.0004 (0.02) | 0.001 (0.02) | 0.002 (0.02) | 0.001 (0.02) | 0.0001 (0.02) | −0.0005 (0.02) | −0.0005 (0.02) | −0.0004 (0.02) |
| FastGr | 0.003 (0.019) | 0.014 (0.019) | 0.02 (0.02) | 0.02 (0.021) | 0.012 (0.022) | 0.014 (0.023) | 0.004 (0.026) | −0.02 (0.03) |
| FastGrXR&D intensity | 0.001 (0.012) | 0.003 (0.012) | −0.002 (0.012) | 0.002 (0.012) | −0.002 0.013 | 0.003 (0.014) | −0.001 (0.015) | 0.003 (0.017) |
| Observation | 590 | 590 | 590 | 590 | 590 | 590 | 590 | 590 |
Note: *** 1%, ** 5%, * 10% significance level, standard error in brackets.
© 2019 by the authors. Licensee MDPI, Basel, Switzerland. This article is an open access article distributed under the terms and conditions of the Creative Commons Attribution (CC BY) license (http://creativecommons.org/licenses/by/4.0/).
Share and Cite
MDPI and ACS Style
Chung, H.; Eum, S.; Lee, C. Firm Growth and R&D in the Korean Pharmaceutical Industry. Sustainability 2019, 11, 2865. https://doi.org/10.3390/su11102865
AMA Style
Chung H, Eum S, Lee C. Firm Growth and R&D in the Korean Pharmaceutical Industry. Sustainability. 2019; 11(10):2865. https://doi.org/10.3390/su11102865
Chicago/Turabian StyleChung, Hyunseog, Soomin Eum, and Chulung Lee. 2019. "Firm Growth and R&D in the Korean Pharmaceutical Industry" Sustainability 11, no. 10: 2865. https://doi.org/10.3390/su11102865
Note that from the first issue of 2016, this journal uses article numbers instead of page numbers. See further details here.