Sunflower Value Chain Enhancements for the Rural Economy in Tanzania: A Village Computable General Equilibrium-CGE Approach


1
Department of Agricultural Economics, Humboldt University of Berlin, Rudower Chausee 16, 10099 Berlin, Germany
2
SusLAND: Sustainable Land Use in Developing Countries, Leibniz Centre for Agricultural Landscape Research (ZALF e. V), Eberswalder Str. 84, 15374 Müncheberg, Germany
*
Author to whom correspondence should be addressed.
Sustainability 2019, 11(1), 75; https://doi.org/10.3390/su11010075
Submission received: 16 October 2018
/
Revised: 17 December 2018
/
Accepted: 18 December 2018
/
Published: 23 December 2018
(This article belongs to the Section Economic and Business Aspects of Sustainability)
Abstract
:Poverty is prevalent and widespread in rural Tanzania, where agriculture is the main activity. The government is making significant public investments intended to speed the growth of agriculture as a means to accelerate inclusive economic growth. In line with public investments, the government is promoting public–private partnerships by encouraging the use of improved agricultural innovations and linking farmers to markets, seeking to increase their yields and income. However, there is a paucity of empirical evidence using multipliers analysis about the extent of how gains in agricultural productivity and market linkages for farmers in rural areas help improve the economy at the household level. This paper assesses the welfare effects of the sunflower value chain for a rural economy in Tanzania using a computable general equilibrium (CGE) model for the selected village, which has a high potential for sunflower. Findings highlight the use of the CGE model, first, for analyzing and understanding the economic sectors at a village level. Second, the effects of various upgrading strategies promoted for improving rural farming communities by the government and non-governmental development partners at the micro-scale are analyzed and potential agricultural commodity value chains identified. The multiplier analysis provided insights regarding the potential of sunflower crops for the village economy.
1. Introduction
In Sub-Saharan Africa, including Tanzania, agriculture-based economic growth in rural areas has great potential for reducing poverty compared to non-agriculture growth [1]. The agricultural sector employs about 80% of the rural population and contributes about 50% of the export earnings, while its share of Tanzania’s GDP is about 25% [2,3]. However, poverty is still prevalent and widespread in rural Tanzania, with about 43.8% of residents living below the poverty line [4,5]. The agriculture sector predominantly consists of small- to medium-scale farmers and a small number of emerging large-scale farmers [5]. Moreover, these farmers have low productivity due to, among other reasons, poor agronomic practices [6]. Other hindering factors include a lack of expanding trade, costly transport to the remote areas due to poor infrastructure, and a lack of logistics, such as cooperatives that could facilitate vertical and horizontal marketing integration [7,8,9]. However, there is potential for improving and expanding crop cultivation in these areas, including simple moisture conservation techniques, like tied ridges, that can increase yields and productivity [3,6,10].
Interventions curbing these hindrances and ensuring food access, such as the establishment of income or employment generating activities for the poor, is even more crucial, as their labor is often the main asset relied upon for income generation [10,11,12,13]. Hence, developing pathways that secure food and agricultural product value chains in Tanzania provides potential intervention points [3,10,14]. Income alternatives to stabilize livelihoods, such as upgrading the sunflower value chain, should be considered under the condition that food security is not to be negatively affected [13,15].
The edible oil subsector, particularly sunflower production, offers multiple livelihood opportunities, as it produces important and valuable vegetable oils and animal feeds that are sold to internal and external markets [16]. It is estimated that about 4 million smallholder farmers engage in sunflower production [3]. Sunflower is grown in most regions across Tanzania as the crop is drought resistant and less susceptible to diseases; consequently, the semi-arid areas of the central zone and the southern coast of Tanzania are favorable for sunflower production [17]. These areas have low and poorly distributed annual rainfall, which affects the production of grains, such as maize and rice, that require well distribution and more rainfall [10,17]. These areas are classified as chronically food deficient and the poorest in the country [17,18], and thus in 2000 the Tanzanian government established the Tanzania Social Action Fund (TASAF) in order to help reduce the threat of poverty in these areas [19]. Thus, interventions geared toward upgrading the value chain in order to provide a stable alternative income source for farmers in these areas are vital; especially when they focus on production, processing, and other value chain components for the edible oils sector [13,17,20,21,22,23,24]. In the long term, this should reduce government expenditures subsidizing their daily upkeep, thus enabling the channeling of these expenditures to other development programs, such as improving rural infrastructure.
In terms of pro-poor strategies, improving smallholder crop production in a decentralized farming system and increasing market access opportunities directly impact the economic growth and livelihood improvement of the rural population [8,9,25]. The Tanzanian government is promoting and investing in improving agriculture in rural areas, with the aim of accelerating inclusive economic growth [26]. In line with public investments, the government is promoting public-private partnerships with other development partners in order to achieve the intended objectives by encouraging agricultural investments and other necessary initiatives, such as market linkages, in rural areas. It is of paramount importance that governments in countries like Tanzania understand how households are influenced at the micro level by various crops value chain upgrading strategies, e.g., supporting specific crop value chains in terms of increasing productivity [27] and market linkages [25], which ultimately contribute to achieving national development objectives. However, there is a paucity of evidence on how improving agricultural productivity and market linkages for farmers help in reducing poverty at the rural household level. In addition, the authors are not aware of any studies analyzing the economy-wide effects of enhancing sunflower value chains within a multi-sectoral village model and comparing it to other crops at the micro level in Tanzania.
This paper contributes to this research gap by developing a Computable General Equilibrium (CGE) model at the village level, disaggregating the sectors within a village economy. The specific objective of this study is to assess the welfare effects of the sunflower value chain for the rural economy in Tanzania by using a selected village that has a high potential for sunflower-based opportunities. We hypothesize that linking sunflower farmers to markets has significant effects that will increase both production and the price received. The research question addressed is: How can the sunflower value chain substantially improve the livelihood of the rural poor and significantly contribute to a village economy? We answer this question by analyzing village specific economic effects, examining the sunflower value chain in comparison to other crops. We use the village of Idifu in Dodoma, Tanzania, as our case study. The findings highlight the importance of these upgrading strategies and the necessary measures needed to improve the rural economy of Tanzania.
2. Methodological Framework
2.1. Study Area and Economic Activities
Idifu village has an estimated land area of 6000 ha, out of which one-third is suitable for agricultural activities. In 2013, the village population was estimated to be about 5100 people across approximately 1205 households. Due to its high level of poverty, in 2013 Idifu was selected for Tanzania’s Social Action Fund (TASAF). TASAF engages vulnerable individuals in income-generating activities or, in extreme cases, direct cash transfers, which are provided along with assistance in order to sustain their livelihood and later engage in economic activities [25]. The main economic activities of the village are crop production, livestock keeping, and off-farm activities.
Farmers grow pearl millet, sorghum, groundnuts, Bambara nuts, sunflower, and sesame. Other crops grown include tomatoes, cowpeas, cucumbers, watermelon, and pumpkins; but these are minor crops as they depend highly on the availability of water. Furthermore, a range of wild fruits and vegetables are important for food security in the village, especially when there are extreme weather conditions that harm crop yields. Pearl millet and sorghum, occupying one-third of the farmed land, are the main staple foods of this village, with every household growing them. Intercrops in the millet and sorghum fields include cowpeas, cucumber, watermelon, and pumpkins. Each household in the village grows groundnuts, which is normally intercropped with sunflower, maize, pearl millet, and white sorghum. About 50% of the farmers in the village grow sunflower at an average farm size of 0.4 hectare, but more often it is intercropped with other crops.
On the other hand, about 20% of the households in the village keep cattle, with an average herd of 10 animals per household. Piggery is also a booming activity in the village, where about 50% of households keep an average of two pigs, which are mostly kept under a free-range system, with limited supplement feeds. Moreover, about 20% of households in the village keep goats, averaging 10–15 animals. In addition, nearly every household in the village raises chicken, which are sold at the village’s weekly markets. Locally raised chicken have the potential to reduce income poverty and nutritional insecurity as they are used as a source of income in years with lower crop yields. Moreover, farmers are also involved in small retail shops, milling, carpentry, masonry, and brewing beer. Village households are also involved in natural resource extraction activities, such as hunting, fishing, and logging, which generate additional income.
2.2. Study Area Selection and the Underlying Data
This study is based on primary data collected in 2014 by the Trans-SEC project baseline household survey. Thus, results can be directly linked to information from the household-level data set. The study was conducted in the Dodoma region, which is semi-arid (350–500 mm above sea level) and has a food system that is primarily based on the cultivation of millet, sorghum, and sunflower, as well as on raising livestock [28,29]. The region is particularly sensitive to food insecurity [3]. In order to identify an appropriate study site, a village scoping study was carried out. The selection of the case study site involved a range of criteria, including market access and the physical accessibility of the village, which has implications for the level of transaction costs incurred by farmers when selling their commodities [30,31]. Moreover, land availability for the production of food crops and sunflower as a potential cash crop was also taken into consideration when selecting the village [30]. Within this context, Idifu, a village located in Idifu ward, Chamwino district, was identified as an appropriate study site. The main outside markets are Mvumi (division center) and Dodoma (capital city of the region and of Tanzania), where most large-scale sunflower processors in the region are located.
Out of the 1205 households living in Idifu, 150 (12.5%) were interviewed in January and February 2014. The households were chosen randomly, based on household lists provided by the village executive officer. The respondent was the household head, who was asked the economic activities, and, at times, his wife, who was asked questions pertaining to the purchases of food items. In addition, a follow-up discussion was conducted with key informants in the village in order to cross-check and validate information. Among others, issues about nearby markets and the main commodities imported and exported from the village were discussed. The questionnaire focused on different aspects of farmers’ participation in sunflower value chains (production, processing, as well as the trading of seeds, oil, and sunflower seedcake) and other agricultural commodities, including potential cash and food crops, such as sorghum, pearl millet, and maize. Input-output relationships covering all village transactions within and between households were modeled, with an emphasis placed on both subsistence consumption of agricultural food and cash crops, including all by-products and their uses (fertilizer, food, seed, seedcakes). Regarding other potential crops in the study village, small-scale farmers cultivate food crops, primarily pearl millet and sorghum. Imports mainly consist of maize, beans, and rice, while sunflower and livestock represent the major export commodities of the case study village. The information gathered built the basis for developing a village social accounting matrix (SAM).
2.3. The Village SAM Framework
The SAM provides a snapshot of the economy under investigation: the structure of production, inter-sectoral linkages, and the distribution of factor value added among different socioeconomic groups, as well as its links to the outside world [30,32,33,34,35]. The village SAM provides a base for building and calibrating the Idifu village computable general equilibrium models (Figure 1).
The level of disaggregation in a village SAM depends on the analyst’s preferences, research objectives, and data availability. For this study, production activities are disaggregated to include all on-farm activities, off-farm activities, and natural resource extractions. In addition to the production activities, separate commodity accounts that represent each of the major household consumption categories and the domestic product market are constructed. The exogenous accounts include the local government, enterprises/firms, and outside the village. The values entered in the village SAM are converted from the local currency, Tanzanian Shillings (TZS), into purchasing power parity US Dollars so that the welfare effects can be compared in an international context [31]. Calculation of the conversion factor used in converting all monetary values from TZS to PPP USD, the CPI for 2013, referenced 2010 [36,37].
2.4. Village CGE Model Framework
We use the integrated standard CGE models developed by IFPRI [38] to construct the Idifu CGE. Our village model exhibits the following characteristics: a “small” open economy assuming households maximize a nested-linear expenditure system (LES) utility function on commodities either produced domestically (in the village) or imported from outside the village. Factors of production are capital (Ki) and labor (Li), which combine using a constant elasticity substitution (CES) aggregator function to form the value-added and are assumed to be non-tradable and exogenously fixed at the household level but mobile among sectors. On the other hand, the intermediate inputs (Xij) with a Leontief aggregator function combine with the value added by a Leontief technology function to form the domestic produced commodities (XDi) that are tradable. Saving, investment, and unemployment are assumed to be endogenously determined. The government sector maximizes its utility using a Cobb-Douglas aggregator function, with endogenous taxes and flexible exchange rates.
Since we assume a small open economy in this model, various commodities (indexed by a subscript i) (XDi) produced in the village are either sold to a domestic market (XDDi) or to an export market (Ei). This transformation of domestic production is modeled according to the Constant Elasticity of Transformation (CET) function. Conversely, the village supply of the commodity will come from commodities produced in the village (XDDi) using the Armington assumption, combined with commodities imported from outside the village (Mi), to form the composite commodities (Xi). These composite commodities are either used as intermediate inputs (Xij) into the production process of the domestically produced commodities or sold for final consumption as household consumption (Ci), government consumption (CGi), and investment (Ii) (Figure 2).
2.5. The Sectors of the Village Model
2.5.1. Household and Firm Behavior
In this model, we assume that households face the same utility function and prices. We then assume the households maximize the LES utility function instead of the CES function because the values of elasticities are not very realistic, so there are disadvantages to using the Cobb-Douglas utility function that assumes the income elasticities are equal to one, own price elasticities equal to minus one, while cross-price elasticities are equal to zero. A simple generalization of the Cobb-Douglas function, which is more flexible with respect to values of the elasticities, is the Stone-Geary utility function that leads to the Linear Expenditure System (LES).
This is maximized subject to the budget constraint given as:
where first order condition and rearrangement reads so as to obtain the tangency condition. In addition, we use the budget constraint equation to obtain the relation of commodities as Ci. Multiplying the commodity equation with respective prices, we obtain the expenditure for each commodity consumed by the households in the village. The expenditures on the commodity, the left-hand side of the expenditure equation, can be divided into two terms: the first part is the minimum expenditure on commodity i to which the consumer commits himself in order to obtain a minimum subsistence level, ; this is interpreted as the minimum required quantity that the consumer purchases first.
Then, is the minimum expenditure on other commodities, so that is the income that remains after the consumer has purchased the minimum required commodities quantities. This marginal income is called “supernumerary income” and is allocated over all commodities based on fixed fractions. Assuming the prices of the commodities are equal to one for the LES function, the Frisch parameter is defined as the negative inverse of the fraction of supernumerary expenditure, in the total expenditure in the benchmark equilibrium situation.
The household’s income from capital, labor, unemployment benefits, and other transfers is defined as Y, while savings are a fixed fraction of net income, so that in the presence of an endogenous income tax (ty), the household’s demand for consumption of commodities follows the LES utility function that is maximized in the optimization process, subject to budget constraints that also account for the taxes on the consumption commodities, Ci.
In addition, when there is disequilibrium (unemployment) in the labor market, the equilibrium wage rate cannot be determined by the intersection of the labor supply and demand curves. There are many ways of modeling wage determination; in our model, we introduce a new equation, assuming that the real wage changes in response to variations in the unemployment rate following a constant elasticity (elasPL). Here also we make a distinction between the benchmark equilibrium and the proposed change.
Moreover, households are assumed to engage in both the production and consumption of agricultural commodities. As a producer, the aim is to increase profit, which is achieved either by minimizing costs on factors of production or maximizing quantities produced. For this case, we assume the households choose to minimize the costs of production, and follow a linear-homogeneous CES production functions in capital and labor (K and L), that combine with intermediate input (Xij) using a Leontief function to obtain the domestic produced commodity (XDi).
The linear CES production functions for K and L are specified as in Equations (3) and (4):
and,
The quantity of intermediate inputs (Xij) is determined assuming an Armington aggregator function for the intermediate inputs imported (Mi) and domestically produced (XDDi) as specified in Equation (5):
Thus, these combine by the Leontief aggregator function to obtain domestically produced commodity (XDi).
The households (firms) have the choice between selling their commodity on the domestic (village) market or foreign market (outside the village), so as to maximize revenues, subject to the transformation function, for which we select the function form that exhibits constant elasticities of transformation (CET). However, in the literature on Applied General Equilibrium models, there is a formulation wherein the exponents use the plus sign instead of the minus sign (i.e., “+” instead of “”). The reason behind this sign change is that, for the CES function, we minimize total costs, so that the elasticity of substitution between the factors of production is positive; while for the CET function, we maximize total revenues, so that we obtain a negative elasticity of transformation. Further, we assume a degree of homogeneity h = 1; i.e., a constant return to scale and re-parametrization results in obtaining the commodities demanded for village consumption (XDDi) and export (Ei) from the domestically produced commodities (XDi).
2.5.2. The Government
The government levies taxes on the consumption of commodities and on capital and labor used by firms, as well as on household income. Consequently, total tax revenues (TAXR) for the government is given by:
The government pays unemployment benefits to the household at the replacement rate, denoted by “trep”, and it transfers money for other purposes, such as pensions and disaster relief (through the TASAF program). These other transfers are made nominal using the Laspeyres consumer price index, in the presence of endogenous taxes (PCINDEX), resulting in the total government transfers (TRF) being obtained. Government expenditures on capital (KG), labor (LG), and consumption commodities (CGi) are obtained by subtracting the total transfers and the endogenous taxes from the total tax revenues and the remains are the government’s (real) saving (SG). Assuming that the government maximizes the Cobb- Douglas utility function:
with:
Maximization of the utility function subject to government expenditure equation results in CGi, KG, and LG.
2.5.3. Investment Demand
We assume that village households and firms use financial services from formal and informal financial agents in the village or nearby major market centers; in this case the Mvumi ward center, which is 5 kilometers from the village. The financial agent maximizes a Cobb/Douglas utility function:
subject to: , where: S = total saving, PDi = commodity price, and Ii = commodity investment demand. Therefore, the total saving equals the household savings (SH): .
2.5.4. Modelling the Foreign Sector
It is assumed that our economy is that of a small country and that the village does not exert an influence on either the world price of exports (PWEZi) or on that of imports (PWMZi), and thus the village economy is not affected by the impact of policy changes on world prices. The import price in local currency (including tariffs) is given by:
while the export price in local currency is:
finally, the balance of payment in (USD), is given by:
2.6. Scenario and Simulations Description
The Innovating Strategies to Safeguard Food Security Using Technology and Knowledge Transfer: A People Centered Approach (Trans-SEC) Project introduced various Upgrading Strategies (UPSs) aimed at improving peoples’ livelihood in the region under study [39,40]. Among others, a market linkage and an in-situ rainwater harvesting technology UPSs were introduced in the Idifu village. Therefore, our study predicts the welfare effects of the introduced UPSs using scenarios and simulations. The scenarios are developed based on the existing evidence on the effects of these UPSs in Sub-Saharan Africa, Tanzania, and the study village in particular.
Improving the rural poor necessitates increasing productivity in traditional food value chains while also entering more integrated high-value markets where, instead of selling raw materials, farmers can participate in value addition and new product development value chains. These are hindered in rural settings due to a lack of, or low investment in, input supply, storage, handling, and processing [41]. It is often argued that developing horizontal and vertical linkages are an effective organizational innovation in food value chains that helps small-scale producers and traders overcome obstacles that would otherwise discourage participation in high-value markets [42,43]. In high-value sunflower markets, farmers would sell semi-processed sunflower oil instead of seeds. Consequently, it is important to consider the establishment of farmer-processor linkages that would allow farmers organized in groups in Idifu to participate in the value addition and high-value sunflower markets, where the prices offered to farmers are higher than when middlemen come to the village. Evidence from the Trans-SEC project report indicates that farmers in the villages receive about half of the prices of the crops offered at the Dodoma city market when selling to middlemen [39,44]. In 2012–2014, findings show that sunflower prices offered to farmers linked to village markets are between Tanzanian Shilling (TZS) 35,000–42,000 per 65 Kg, while in villages where farmers are not linked to markets, reported sunflower pricing of TZS 35,000 per 100 Kg instead of 65 Kg [45]. Such price differences, in most cases, are aggravated by information asymmetry for the farmers operating individually, so that these farmers are misinformed about the weight of the bag [39,44,45]. In addition, a study conducted in 2015–2016 by Balchin et al. [46] reports an average sunflower farm gate price of about TZS 300, while market price was 660 per Kg of sunflower seeds. Therefore, market linkages are assumed to reduce market information asymmetry with regard to the prices of agricultural commodities in other markets outside the village.
In term of yields, a study conducted by Njeru et al. [47] in Embu County, Kenya, reports an average maize grain yield of 0.7 t/ha for farmers using flat cultivation, while farmers using tied ridges have an average yield of 2.2 t/ha. Nyamagara and Nyagumbo [48], conducting a study of crops cultivation, such as maize, sorghum, and sunflower, in a semi-arid smallholder farming environment in central Zimbabwe, report an increase of yield of 100–450% for farmers who use tied ridges. In addition, Mudatenguha et al. [49], conducting a study of semi-arid regions in Rwanda, find that maize yields doubled when using tied ridges cultivation techniques compared to flat cultivation. Moreover, a field study of soil moisture management practices by Kabanza and Rwehumbiza [50] finds that tied ridges increase sorghum yields from 0.4 to 2 t/ha in Dodoma. A study conducted by Germer et al. [51] at Ilolo, a village near Idifu, finds that sunflower yields averaged 1.4 t/ha for farmers using tied ridges, but an average yield of 0.6 t/ha for farmers using flat cultivation. In addition, using a simulated economic risk analysis of tied ridges at Idifu village, Mwinuka et al. [52] report that about 95% of farmers would use tied ridges in their farming practices.
In lieu of the above, first, we consider the market linkage scenario (PrES1), where we simulate the agricultural sector by assuming commodities’ prices increase twofold when farmers are linked to processors or traders from outside the village. Second, optimistically, we take an average of each of the reported yields to create our second scenario (QuIS2), where we consider a twofold increase the crop yields when farmers use the tied ridges cultivation technique. Moreover, considering the diversity of the farmer’s factors of production endowment [39,53,54,55], we predict that the potential crop yields for farmers could increase by about 50–80% of the reported crop yields on research farms and under closely supervised on-farm experiments. Therefore, the study uses a comparative static CGE model for the Idifu village economy to simulate the effects of the two UPS scenarios; these provide contrasts to the existing practices. Finally, we compare the results for the increase in output and prices for the agricultural sector in general, later separating the sunflower sub-sector so as to address the objective of this paper and provide insights about the effects of the upgrading strategies on the village economy.
3. Results and Discussion
3.1. The Idifu Village Economic Structure, 2013
Results from the Idifu economic structure (Table 1) indicate that the value added (VA) share (labor, capital, and land) is about 25.6% for sorghum and millet crops, while the production (PRD) share for all commodities in the village is 24.2%. This implies that more household resources are allocated to the production of sorghum and millet than other crops, as they are more drought tolerant. Sorghum and millet are sold at the weekly markets in Idifu and other nearby villages, with their market share equaling about 19.6%. Moreover, out of the total sorghum and millet output, only 17.1% is sold outside the village; the remainder is consumed at home or recycled as inputs (seeds) for the next season. On the other hand, only 1.0% of sorghum and millet is imported from outside, which accounts for 15.5% of the demand for sorghum and millet of the village. These findings concur with those found by Eriksen et al. [56] and Mmbando et al. [57] that farmers will choose activities that make them less vulnerable to food security. Consequently, they will allocate much of their resource endowments, in this case, labor, land, and capital, to activities that are Pareto-optimal for their needs.
Sunflower is considered to be a cash crop, with a PRD share of about 4.1% and a VA share of about 4.4%. These low shares of the sunflower crop are aggravated by its production system, with most farmers intercropping sunflower with other crops, like sorghum, maize, groundnuts, or millet. About 45.6% of the produced sunflower is sold outside the village and its share of the exported commodities is about 5.8%. The village also imports about 14.2% of sunflower product from outside.
Farmers also grow maize in Idifu, but agro-ecological conditions mean it does not grow well. The production share is only 6.5%, which means that the demand for maize at the village is complemented through importation from outside the village, which accounts for about 68.5% of the village demand. Other crops grown in the village in small proportions include vegetables, groundnuts, tomatoes, and Bambara nuts. Combined, these account for about 19.3% of the PRD share, while their import share is only 0.6%, with 17% of the output sold to nearby villages.
Additionally, the livestock sub-sector, which comprises cattle, goat, sheep, and chicken, plays a great role in the village economy, as about 25.2% of the villagers are employed by the sub-sector. Its share in the exported commodities from the village is about 46%, which is 72.8% of the livestock output from the village. In term of VA and PRD, the sector shares are about 14.1% and 13.1%, respectively. Similar findings are observed in studies [58,59] showing that the livestock sub-sector supports a large proportion of the population of rural households in Tanzania by providing food, income, and animal draught power.
Conversely, about 89.7% of the non-agricultural commodities are imported from outside the village, which accounts for about 97.3% of the non-agricultural commodity demand. Its contribution in terms of employment is about 29.7%, which is the highest of all economic activities in the village. Natural resource extraction, which comprises fishing, logging, and hunting, contributes about 24.9% and 3.5% of the employment and export shares, respectively. Other studies, including Davis et al. [60], observe a high share of employment, about 44%, of the non-farm economy for households in rural Sub-Saharan Africa. This implies that a high share of non-agricultural employment depends on the availability of non-farm activities in the village, which are limited in the case of Idifu village.
Generally, agricultural activities have high shares of VA 69.8%, compared to 30.2% of the non-agricultural activities. This indicates that households depend on labor, land, and capital for income generation. Yet, in terms of employment, non-agricultural activities provide a majority of the employment: about 54.6%. Similarly, the non-farm employment share of about 57.2% for rural households in Tanzania is observed by Nagler et al. [60], while References [61,62,63] observe an increasing trend of non-farm employment in rural households that could have a positive contribution to the income of rural households. Moreover, it is worth noting that nearly every household has at least one member involved in non-agricultural activities, especially during the dry season. This is taken as an income source diversification or coping strategy whenever crop yields are not reliable. This is also noted by Wan et al. [64]: income source diversification is used by rural households to manage drought risks in semi-arid and arid regions. Conversely, although non-farm activities seem to be the best income source alternative, in most cases these are in the informal sector, requiring only low or unskilled labour. However, in the long run, these alternatives are not sustainable unless coupled with the knowledge and skills capacity to unlock barriers of entry to semi-skilled and skilled non-farm employment opportunities.
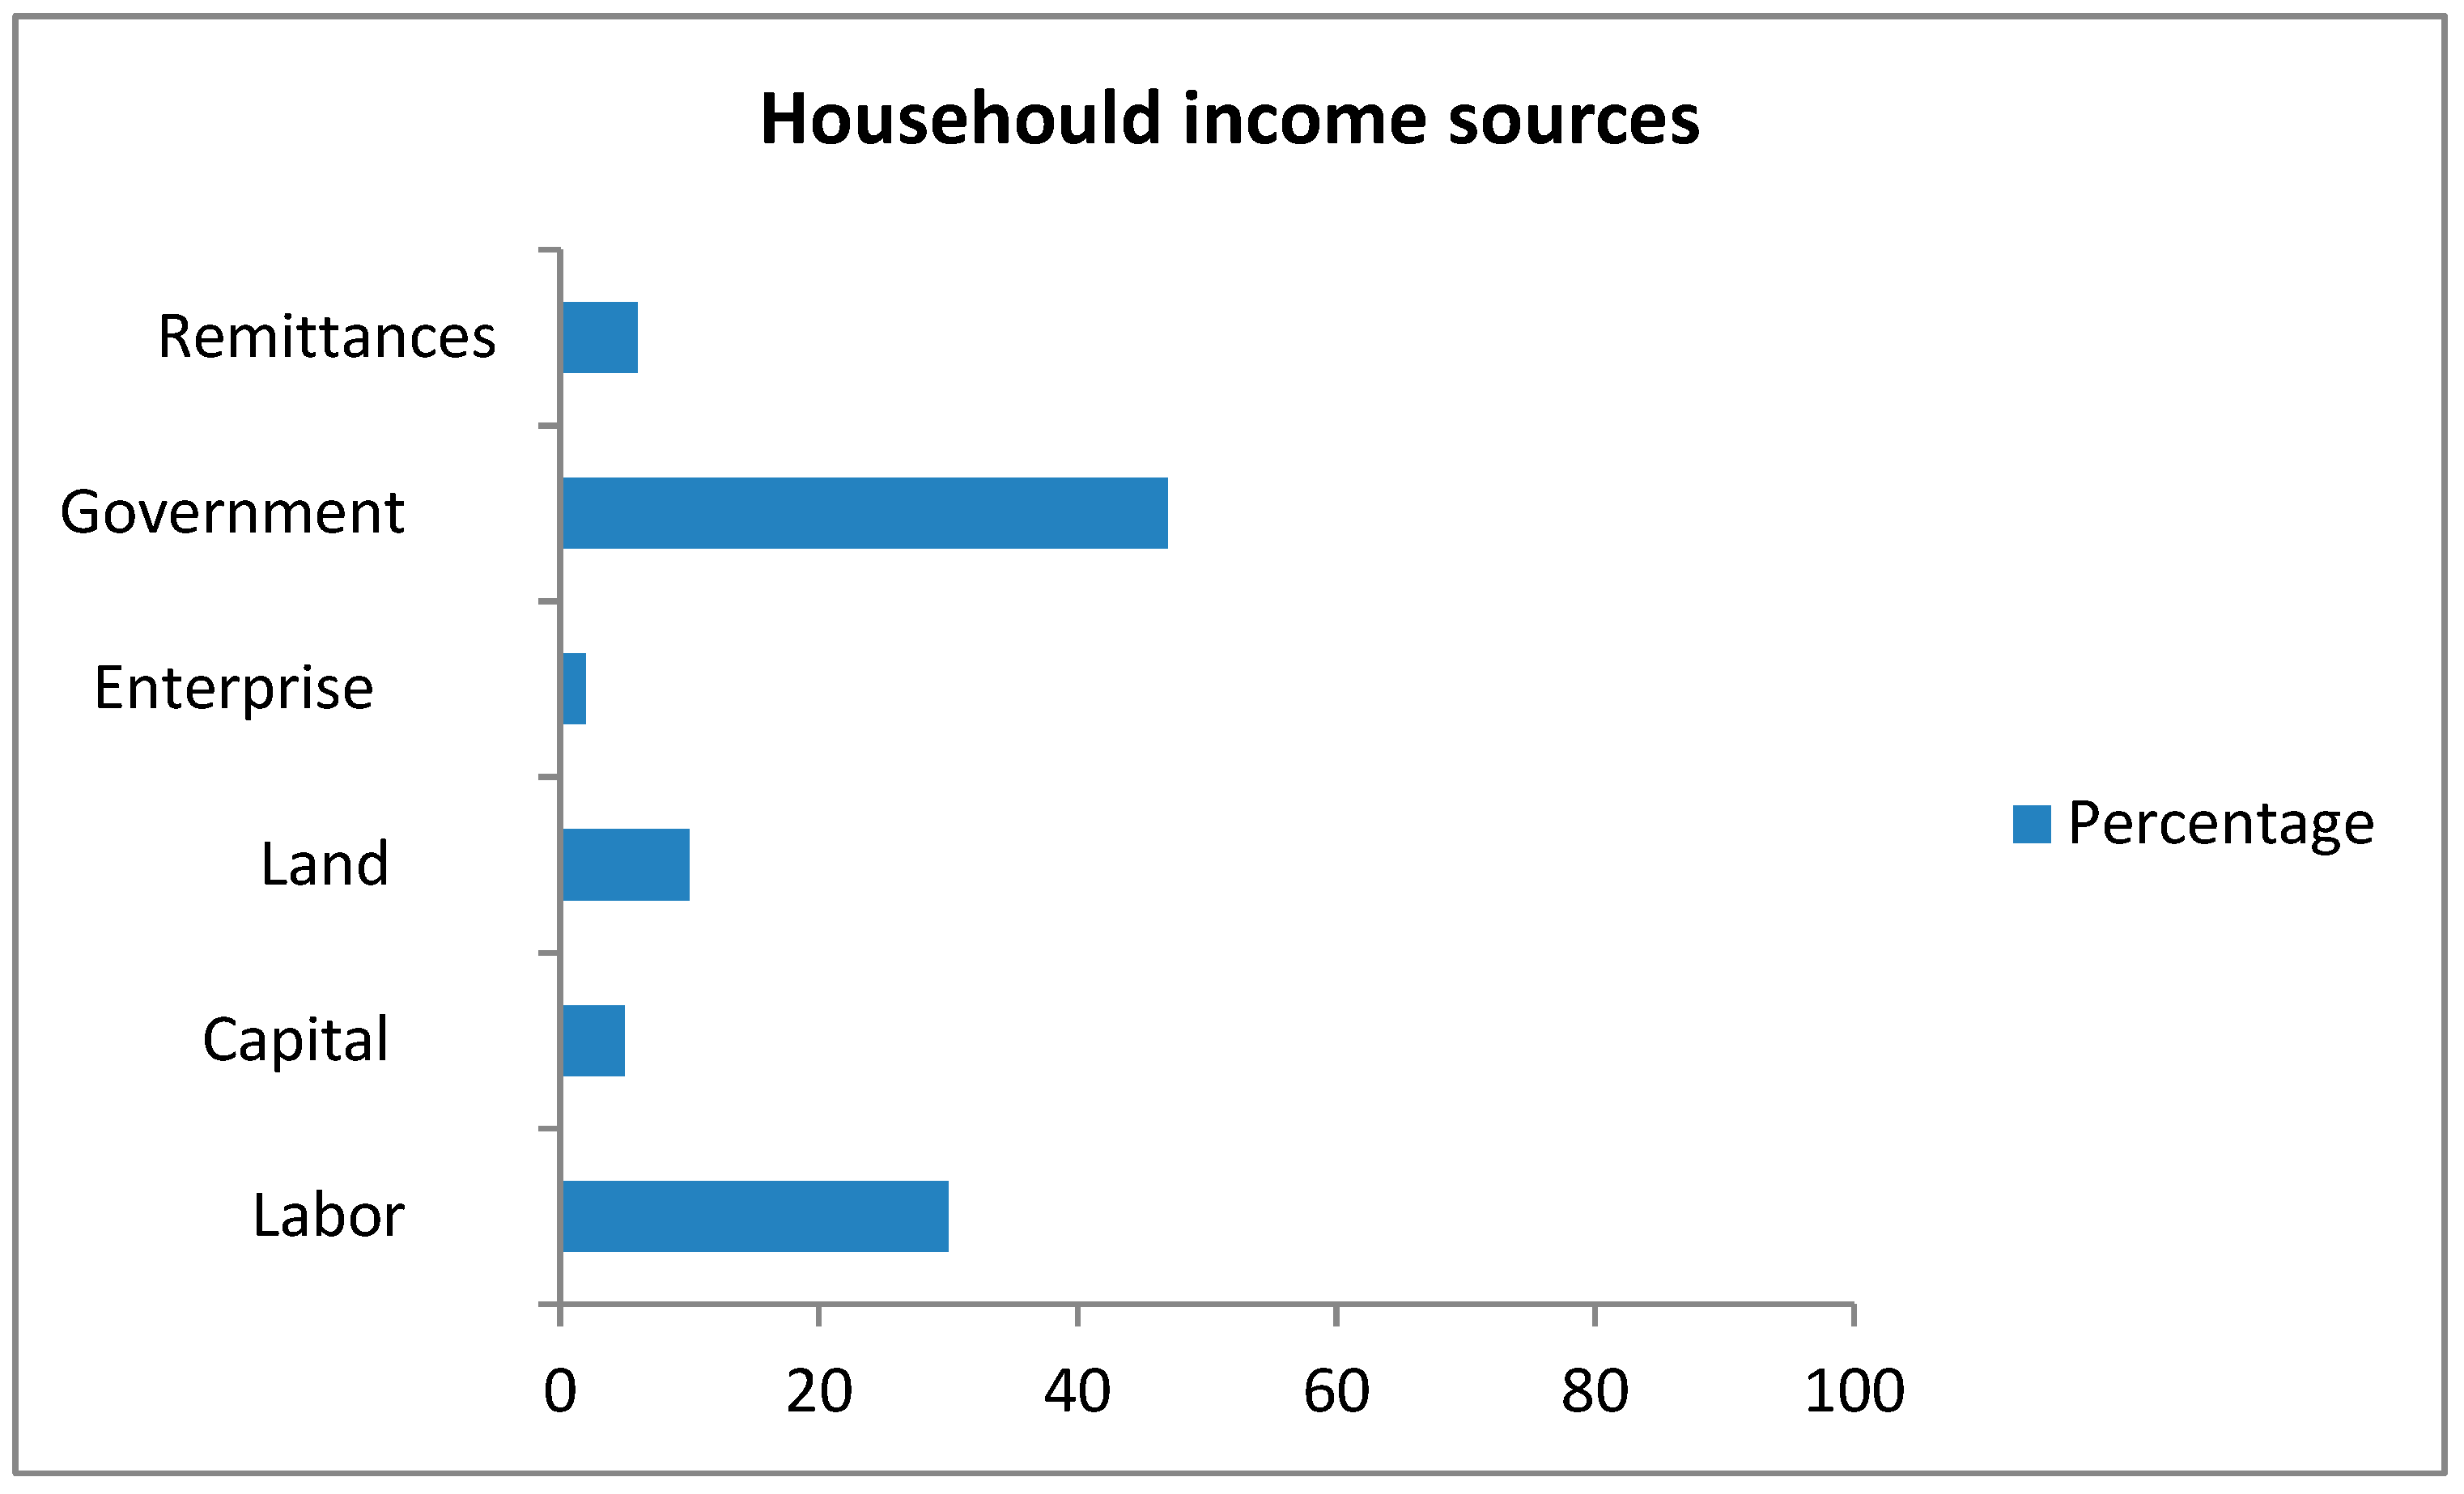
3.2. Main Household Income Sources
Findings from this study (Figure 3) indicate that the main household income source is public transfers (47%), which could be from the Tanzania Social Action Fund (TASAF) that started in the Chamwino district in 2013 due to its high level of poverty. The TASAF program is designed to help the vulnerable. While the program is good in the short run whenever there are food shortages and other livelihood needs, in the long run, government interventions should be geared toward improving productivity through improvement of availability of farm inputs and simple moisture conserving technologies. This is also suggested by Conceição et al. [65] and Elikaeli [66], who note that for Sub-Saharan countries to realize sustainable human development and food security, government intervention should be geared toward increasing yields and not toward the provision of relief funds to affected communities.
The second source of household income is labor (30%), where household members work for wages in agricultural or non-agricultural activities, either within or outside the village. As pointed out earlier, household members are mostly engaged in low or unskilled labor, as there are fewer opportunities for skilled jobs. In addition, Tiffen, [12] also notes that the rural economy in Sub-Saharan Africa has ceased growing because the rural labor force is poorly educated. This implies that approaches focusing on promoting rural labor force knowledge and skills development would be helpful at expanding opportunities for the rural labor in developing countries like Tanzania.
Other sources include land rent (10%), remittances (6%), capital (5%), and enterprises (2%). One would expect a high share of income from land rent, however, it is worth noting that persistent droughts at Idifu village have rendered land inexpensive, if not free. Advocacy of simple land management practices that lead to improvement of land utilization is crucial so that expansion of land activities and income contribution can be realized. Consequently, improving land utilization and building the capacity of the rural labor force may positively affect capital accumulation, allowing more enterprises to be established, thus accelerating economic growth in a rural setting.
3.3. The Factor of Production Shares across Sectors
Distribution of the factors of production among the farmers, such as land, capital, and labor, has a great role in both implementing policy interventions and understanding the resource allocation criteria of farmers. Results shown in Table 2 highlight the distribution of the factor shares across sectors in Idifu village. These indicate that labor has the highest share of 25.0% in VA for millet and sorghum, followed by livestock, which has a share of about 14.7%. In addition, natural resource extraction has a share of about 14.5%, while other crops are about 17.4% and non-agricultural activities make up 17.3% of the labor force. Results further indicate sorghum and millet have the largest proportion of capital share at about 38.7%, consuming about 26.2% of the agricultural land. On the other hand, sunflower and maize have almost the same land allocation shares of about 13.2% and 13.3%, respectively, while other crops occupy about 37.1%.
In contrast, Nerman [13] finds that own crop preferences are not crucial for the allocation of a factor of production for rural households in Tanzania. However, findings from this study indicate that farmers allocate their resources to crops that they are sure of harvesting: first are food crops followed by cash crops that grow well in the area, although specific crop preferences may vary.
3.4. Village Macroeconomic Indicators
The 2013 Idifu village Macro SAM indicates various linkages of the economic sectors within and outside the village. Results show that the village gross domestic product (GDP) is 2,221,020 USD, with a GDP per capita income (constant 2010 purchasing power parity) of 1356 USD. Income from government expenditures through transfers to households amounts to 434.76 in USD and is the highest share among the households’ income sources, indicating that public support plays a crucial role in supporting household consumption in the village. Government income sources are from the central government, which is outside the village, and amounts to 322,630 USD, with levies from sold commodities in the village 104,870 USD, while indirect taxes from the factors of production is 7260 USD. Moreover, households in the village receive income from factors of production, amounting to 129,940 USD, while transfers from household member 8050 USD, and 4540 USD remittances from outside the village. On the other hand, a small proportion of about 2020 USD of households’ income is saved and invested in agriculture commodities.
Commodities consumed by households in the village normally come from own production and market purchases, which amount to 28,710 USD and 538,500 USD, respectively. The village imports more commodities than it exports, amounting to 370,910 USD and 26,840 USD, respectively. Thus, the village is a net importer, especially for non-agricultural commodities and maize, which are not sufficiently produced in the village (Appendix A). Our findings, especially on the GDP per capita for the Idifu village, are relatively close to the 1654 USD observed in the 2014 Tanzania human development report [67]. This implies that, although Tanzania has shown continuous economic growth for the last decade, the growth is not shared among the large rural population.
3.5. Scenario and Simulation Outcomes
3.5.1. The Village Agricultural Sector
First, we simulate the effects of farmers participating in a more integrated high-value market outside the village, where they accrue lucrative prices for their production. Therefore, we double export prices (PrES1) for the agricultural sector commodities, then observe its effects on the domestic, export sales, and consumption of commodities for other economic sectors in the village. Results indicate that PrES1 reduces domestic marketed commodity sales for almost all economic sectors in the village, except for a 100% increase in sales of natural resource extraction commodities, such as fish and timber products. Results further indicate an increase in export commodity sales for sorghum and millet (58.3%), sunflower (22.7%), livestock (12.1%), other crops (53.5%), and non-agricultural commodities (84.5%). These findings resonate well with the findings of Biénabe and Sautier [43] and Kaganzi et al. [50], who find that high market values offer higher incomes to smallholder farmers, especially when access is maintained to these markets with significant upgrading in terms of product quality and quantity, as per market demand. Herrmann, et al. [8] also find that linking farmers to markets leads to higher rates of crop commercialization and an increase in crop prices. This implies that the village economy depends on agriculture; therefore, linking farmers to markets helps farmers participate in high-value markets and reduces the obstacles due to a lack of investment in value addition facilities and the exploitation of middlemen.
Secondly, output quantities are increased twofold for the agricultural sector in the productivity increase scenario (QuIS2) as a result of introducing tied ridges technology to farmers. The technology is assumed to increase yields; consequently, we observe what would be the effects on the village domestic sales, export sales, and commodities’ consumption for all economic sectors. Results indicate that doubling the output increases the quantities of production sold in and outside the village for almost all economic sectors, except the sunflower sub-sector, which had a decrease in export sales and consumption of 19.2%. Other studies in Tanzania [8,9,57,68] observe that an increase in farmers’ output, if coupled with provision of export or high-value markets linkages, not only increases consumption but also sales of the surplus. This means that an increase in crop yields and linking farmers to markets outside the village will increase crop sales as a result of lucrative prices; hence, increasing farmers’ profits (Table 3).
3.5.2. The Village Sunflower Sub-Sector
Additionally, we simulate the same scenarios PrES1 and QuIS2 for the sunflower sub-sector in the village so that we can identify the potential effects of the sub-sector on the village economy. Results indicate increasing sunflower exports: 22.18% and 151.89% for PrES1 and QuIS2, respectively. It is worth noting that the sub-sector affects the other economic sectors in the village, as there are also increases in the quantities of consumed commodities. The noted increases are for sorghum and millet (0.42%), maize, non-agricultural, and natural resource extraction (0.62%), as well as livestock (0.3%). These multiplier effects could be enhanced by mixed cropping, which is the farming system commonly practiced by farmers in the village. A study by Mkonda et al. [10] reports a decreasing trend in the production of maize, sorghum, and millet in the semi-arid regions of Tanzania. Therefore, promoting sunflower crops where the intercropping system is dominant could help revitalize the production of these other crops. In addition, since sunflower has low soil nutrient requirements, expanding the crop can be accomplished by making use of the abundant marginal land in the village, where other food crops cannot thrive. Promoting sunflower crops, both in terms of market linkages and increased productivity, leads to increased outputs and quantities sold from other sector commodities. Furthermore, there is also an increase in income for the village households, which is then channeled to purchase other commodities, ultimately reducing government dependency (Table 4).
Moreover, an increase in income is noted for all scenarios, for labor, capital, land, households, and the government. Comparing the two upgrading strategies scenarios, QuIS2 has slightly higher income effects than PrES1 does (Table 5). However, combining the two upgrading strategies results in greater income increases for all the observed indicators than for the upgrading strategies individually. Similarly, References [8,9,57,68] observe increases in economic returns to farmers’ households when these upgrading strategies are combined. Combining upgrading strategies underscores a win-win scenario due to crop yield and price increases, which results in higher economic returns to farmer households in the village.
4. Conclusion and Policy Implications
The paper highlights the economic situation of rural households in the semi-arid and arid regions of Tanzania, where there is persistent food insecurity as a result of prolonged drought. We achieve this by analyzing the economic activities of Idifu village, which is located in the arid region of Dodoma, an area prone to food shortages and food insecurity. Various interventions are implemented, including, among others, introducing tied ridges as a simple moisture conserving technology designed to improve crop yields and curb food shortage in the area. Another intervention links farmers to markets where farmers can sell their crops, especially sunflowers, at a higher price.
A computable general equilibrium (CGE) model is applied to understand the economic situation of the village prior to and after the implementation of the interventions, helping to determine the impacts on the village economy. Findings from the study underscore the use of the CGE model, first, for analyzing and understanding the economic sectors at a village level. Second, the effects of various upgrading strategies promoted toward improving rural farming communities by the government and non-governmental development partners at the micro-scale can be analyzed and potential agricultural commodity value chains identified
Results from the simulation of the two scenarios indicate the impacts on the village economy; for instance, if farmers in Idifu village would use simple moisture conserving techniques, like tied ridges, their yields would increase for all the crops grown in the village. In addition, when farmers are linked to markets, crop yields and prices increase, especially for sunflower, which is used as a cash crop. Furthermore, when sunflower is intercropped with other crops, promoting sunflower crops ultimately results in increasing the yields of the other crops.
The paper arrives at two major conclusions. First, government investment in agricultural infrastructure, such as irrigation in developing countries like Tanzania, is low. Already, small investments in technologies like tied ridges that increase moisture retention and, consequently, increase agricultural output would help increase food security and overall welfare of semi-arid areas in Tanzania. Second, for the case of market integration strategy, farmer–processor linkages can enhance the opportunities for small farmers to participate and benefit from emerging high-value commodities market chains, especially for those in isolated rural villages. As the results from the simulated market linkage scenario for Idifu village farmers indicate, linking sunflower farmers to processors would promote the production of sunflower and other crops, and would also promote welfare.
Therefore, governments should be encouraged to use policies that promote the use of such upgrading strategies among low-income groups in rural settings, not just in Tanzania, but also in other countries with similar endowments. This can be achieved through integrated policies that promote yield increase, such as the use of oxen and ridging tools, via microcredit to farmers’ groups aiming at promoting use of tied ridges as a management practice. Moreover, farm field schools and field days can be used as a platform for demonstration and promotion of simple farming techniques such as tied ridges. Moreover, the government of Tanzania, through its agriculture extension system, should teach rural farmers in rural areas multiple skills, thus building knowledge that enhances agriculture as a business in order to generate income and improve their livelihood. Ultimately this will reduce the amount of government financial support required while also making the farmers resilient to shocks.
Author Contributions
All authors were involved in the conceptual design of the study. C.P.M. did the data management, analysis, model equations development, and writing of the manuscript draft. K.M. interpreted the model results and revised the manuscript draft. S.S. worked on the methodological design and editing of the manuscript draft for the final submission. All authors read and approved the final manuscript version for submission.
Funding
This study was funded by the German Federal Ministry of Food and Agriculture (BMEL) under the Federal Office for Agriculture and Food (BLE).
Acknowledgments
The authors thank the German Federal Ministry of Food and Agriculture (BMEL) under the Federal Office for Agriculture and Food (BLE) for the grant that supported this work and support from the Leibniz Centre for Agricultural Landscape Research (ZALF) for the workspace. The authors thank the reviewers and editors for their helpful comments and valuable suggestions, which substantially improved this study.
Conflicts of Interest
The authors declare no conflict of interest.
Appendix A

Table A1.
2013 Macro SAM for Idifu village (‘000 USD).
| Activities | Commodities | Factors | Households | Government | Investment | Rest of the Village | Total | |
|---|---|---|---|---|---|---|---|---|
| Activities | 114.08 | 28.71 | 142.79 | |||||
| Commodities | 22.49 | 538.5 | 2.02 | 26.84 | 589.85 | |||
| Factors | 120.3 | 120.3 | ||||||
| Households | 129.94 | 8.05 | 434.76 | 4.54 | 577.29 | |||
| Government | 104.87 | 7.26 | 322.63 | 434.76 | ||||
| Saving | 2.02 | 2.02 | ||||||
| Rest of the village | 370.91 | (16.9) | 354.01 | |||||
| Total | 142.79 | 589.86 | 120.3 | 577.28 | 434.76 | 2.02 | 354.01 |
Table A2.
Description of the sets, parameters and variables Notation used in the village mode.
| Symbol | Scalars | Description |
|---|---|---|
| PK | return to capital | |
| PL | wage rate | |
| ER | exchange rate | |
| KS | capital endowment | |
| LS | supply of labor | |
| Y | income level | |
| U | utility level for the household | |
| PCINDEX | consumer price index (commodities) | |
| frisch | value of Frisch parameter in the nested-LES utility function | |
| phillips | value of Phillips parameter | |
| SZ | total initial savings | |
| SH | household savings | |
| SG | government savings | |
| SF | foreign savings | |
| CBUD | household expenditure (commodities) | |
| UNEMP | involuntary unemployment | |
| KG | government capital demand | |
| LG | government labor demand | |
| TRY | income tax revenues | |
| TAXR | total tax revenues | |
| ty | the tax rate on income | |
| trep | replacement rate | |
| TRF | total transfers | |
| TRO | other transfers | |
| PDZ(sec) | the price level of the domestic output of firm (sec) | |
| PZ(sec) | the price level of domestic sales of composite commodities | |
| PDDZ(sec) | price of domestic output delivered to the home market | |
| PWEZ(sec) | the world price of exports | |
| PWMZ(sec) | world price of imports | |
| sigmaA(sec) | substitution elasticities of ARMINGTON function | |
| sigmaT(sec) | elasticities of transformation in CET function | |
| sigmaF(sec) | CES capital-labor substitution-elasticities firm (sec) | |
| elasY(sec) | income elasticities of demand for commodity (sec) | |
| XZ(sec) | domestic sales of composite commodity (sec) | |
| XDZ(sec) | gross domestic production (output) level firm (sec) | |
| XDDZ(sec) | domestic production delivered to home markets | |
| KZ(sec) | capital demand | |
| LZ(sec) | labor demand | |
| CZ(sec) | consumer demand for commodities and leisure | |
| IZ(sec) | investment demand | |
| EZ(sec) | export demand | |
| MZ(sec) | import demand | |
| PMZ(sec) | import price EX tariffs in local currency | |
| PEZ(sec) | price of exports in local currency | |
| IOZ(sec,secc) | intermediate commodity demand | |
| CGZ(sec) | government commodity demand | |
| TRCZ(sec) | tax revenue on consumer commodities | |
| TRKZ(sec) | tax revenue on capital use | |
| TRLZ(sec) | tax revenue on labor use | |
| TRMZ(sec) | tax revenue on imports | |
| tcz(sec) | the tax rate on consumer commodities (to be used in PCINDEX) | |
| tc(sec) | tax rate on consumer commodities | |
| tk(sec) | the tax rate on capital use | |
| tl(sec) | tax rate on labor use | |
| tm(sec) | tariff rate on imports | |
| io(sec,secc) | technical coefficients | |
| gammaF(sec) | CES distribution parameter in the production function of firm (sec) | |
| aF(sec) | efficiency parameter of CES production function of firm (sec) | |
| gammaA(sec) | CES distribution parameter of ARMINGTON function of commodity (sec) | |
| aA(sec) | efficiency parameter of ARMINGTON function of commodity (sec) | |
| gammaT(sec) | CET distribution parameter regarding destination of domestic output | |
| aT(sec) | shift parameter in the CET function of firm (sec) | |
| alphaHLES(sec) | power in in nested-ELES household utility function | |
| muH(sec) | subsistence household consumption quantities (sec) | |
| mps | household’s marginal propensity to save | |
| alphaI(sec) | Cobb-Douglas power in the bank’s utility function | |
| alphaCG(sec) | Cobb-Douglas power in government utility function (commodities) | |
| alphaKG | Cobb-Douglas power in government utility function (capital) | |
| alphaLG | Cobb-Douglas power in government utility function (labor) |
Table A3.
Equation blocks in the village Model.
| Equation | Description |
|---|---|
| Household block | |
| Investment block | |
| Household saving | |
| = | Household investment |
| Firms block | |
| Household capital demand | |
| Household labor demand | |
| Foreign Sector block | |
| Total import | |
| domestic produced commodity demand | |
| Gross export domestic commodity | |
| Price import in local currency | |
| Price export in local currency | |
| Total import commodity value | |
| Government block | |
| Government commodity demand | |
| Government capital demand | |
| Government labor demand | |
| Total tax revenues | |
| Total transfers | |
| Market Clearing | |
| Capital supply equilibrium | |
| Labor supply equilibrium | |
| Commodity supply equilibrium | |
| Income block | |
| Total household income | |
| Household commodity expenditure | |
| Total value domestic output | |
| Gross village commodity demand | |
References
- Strategies and Priorities for African Agriculture: Economywide Perspectives from Country Studies. Available online: http://ebrary.ifpri.org/utils/getfile/collection/p15738coll2/id/127049/filename/127260.pdf (accessed on 30 June 2018).
- Kaliba, A.R.; Mbiha, E.; Nkuba, J.M.; Kingu, P.M. Economic multipliers for Tanzania: Implications on developing poverty reduction programs. In Proceedings of the 36th Annual Meeting of Academy of Economics and Finance, Nashville, TN, USA, 13–16 February 2008. [Google Scholar]
- Anonymous. Tanzania National Agricultural Policy-2013; URT: Dar es salaam, Tanzania, 2013; Available online: http://www.fao-ilo.org/.../user.../NATIONAL_AGRICULTURAL_POLICY-2013.pdf (accessed on 25 July 2018).
- World Bank. Tanzania: Rapid Poverty Assessment; A Report; Poverty Monitoring Group: Washington, DC, USA, 2015. [Google Scholar]
- Cleaver, J.; Schram, R.; Wanga, G. Bioenergy in Tanzania: The country context. In Chapter 3. Bioenergy and Food Security—The BEFS Analysis for Tanzania 2071-0992 FAO; Food and Agriculture Organization of the United Nations: Rome, Italy, 2010; Available online: http://www.fao.org/bioenergy/21031-02ea135adb6370b32c694cc820c6fdbd5.pdf (accessed on 21 December 2018).
- Kiratu, S.; Märker, L.; Mwakarobo, A. Food Security: The Tanzanian Case; International Institute for Sustainable Development: Winnipeg, MB, Canada, 2011. [Google Scholar]
- FAO; IFAD; WFP. The State of Food Insecurity in the World 2015. Meeting the 2015 International Hunger Targets: Taking Stock of Uneven Progress; Food and Agriculture Organization Publications: Rome, Italy, 2015. [Google Scholar]
- Herrmann, R.; Nkonya, E.; Faße, A. Food value chain linkages and household food security in Tanzania. Food Secur. 2018, 10, 827–839. [Google Scholar] [CrossRef]
- Kissoly, L.; Faße, A.; Grote, U. The integration of smallholders in agricultural value chain activities and food security: Evidence from rural Tanzania. Food Secur. 2017, 9, 1219–1235. [Google Scholar] [CrossRef]
- Mkonda, M.Y.; He, X. Yields of the major food crops: Implications to food security and policy in Tanzania’s semi-arid agro-ecological zone. Sustainability 2017, 9, 1490. [Google Scholar] [CrossRef]
- Ayenew, H.Y.; Estruch, E.; Sauer, J.; Abate-Kassa, G.; Schickramm, L.; Wobst, P. Decent Rural Employment, Productivity Effects, and Poverty Reduction in Sub-Saharan Africa; Rural Transformations; FAO: Rome, Italy, 2016; Available online: http://www.fao.org/3/a-i5432e.pdf (accessed on 10 May 2018).
- Tiffen, M. Transition in Sub-Saharan Africa: Agriculture, Urbanization and Income Growth. World Dev. 2003, 31, 1343–1366. [Google Scholar] [CrossRef]
- Nerman, M. Households’ income-generating activities and marginal returns to labour in rural Tanzania. J. Afr. Econ. 2015, 24, 365–389. [Google Scholar] [CrossRef]
- Gomez, M.I.; Barrett, C.B.; Buck, L.E.; De Groote, H.; Ferris, S.; Gao, H.O.; Yang, R.Y. Research principles for developing country food value chains. Science 2011, 332, 1154–1155. [Google Scholar] [CrossRef] [PubMed]
- Ugulumu, E.S.; Inanga, E.L. Tanzania’s Small-Scale Sunflower Farmers: Upgrading the Value Chain. Int. J. Sci. Basic Appl. Res. 2013, 10, 126–145. [Google Scholar]
- Ugulumu, E.S.; Inanga, E.L. Information Accessibility for Sunflower Growers in Tanzania. J. Inf. Knowl. Manag. 2014, 4, 35–44. [Google Scholar]
- Kajimbwa, M.; Kondowe, A.; Mhanga, S. Edible Oil Seeds Value Chain Development Programme 2007–2015. Results report 2010. Available online: http://www.snv.org/public/cms/sites/default/files/explore/download/edible_oils_tanzania_result_report_final.pdf (accessed on 3 June 2018).
- USAID. Tanzania: Nutrition Profile. 2011. Available online: https://www.usaid.gov/sites/default/files/documents/1864/USAID-Tanzania-Profile.pdf (accessed on 18 April 2018).
- Mtelevu, B.T.; Kayunze, K.A. The contribution of Vulnerable Groups’ sub-projects under Tanzania Social Action Fund to Income Poverty reduction in Bahi District, Tanzania. J. Econ. Sustain. Dev. 2014, 5, 12. [Google Scholar]
- The Agribusiness Innovation Center of Tanzania: Scaling Value Adding, Post-Harvest Processing Agribusinesses. 2012; Available online: https://www.infodev.org/infodev-files/the_agribusiness_innovation_center_of_tanzania_-_full_report.pdf (Accessed on 15 January 2018).
- RLDC. Sunflower Sector Market Development Strategy. 2008. Available online: http://www.rldp.org/downloads/sunflower_strategy.pdf (accessed on 10 January 2018).
- TEOSA. Assessment of the Potential of Edible Oilseeds Produced in Tanzania: The Case of Sunflower and Sesame. 2012. Available online: http://www.best-dialogue.org/wp-content/uploads/TEOSA_Edible_Oils_Study_10_-2012.pdf (accessed on 15 December 2017).
- URT. United Republic of Tanzania Sunflower Sector Development Strategy 2016–2020. 2015. Available online: http://unossc1.undp.org/sscexpo/content/ssc/library/solutions/partners/expo/2016/GSSD%20Expo%20Dubai%202016%20PPT/Day%202_November%201/SF%204_Room%20D_ITC/Value%20chain%20roadmaps/Tanzania/Tanzania%20Sunflower%20Sector%20Development%20Strategy.pdf (accessed on 8 January 2018).
- Tiwari, S.; Daidone, S.; Ruvalcaba, M.A.; Prifti, E.; Handa, S.; Davis, B.; Niang, O.; Pellerano, L.; Quarles van ufford, P.; Seidenfeld, D. Impact of cash transfer programs on food security and nutrition in sub-Saharan Africa: A cross-country analysis. Glob. Food Secur. 2016, 11, 72–83. [Google Scholar] [CrossRef]
- Arndt, C.; Pauw, K.; Thurlow, J. Biofuels and economic development: A computable general equilibrium analysis for Tanzania. Energy Econ. 2012, 34, 1922–1930. [Google Scholar] [CrossRef]
- URT. Agricultural Sector Development Programme Phase Two (ASPD II), Government Programme Document. 2016. Available online: http://www.tzdpg.or.tz/fileadmin/documents/external/national_development_frameworks/ASDP2_Final_Document_20_May._2016__after_edit__1_.pdf (accessed on on 25 December 2017).
- McArthur, J.W.; McCord, G.C. Fertilizing growth: Agricultural inputs and their effects on economic development. J. Dev. Econ. 2017, 127, 133–152. [Google Scholar] [CrossRef] [PubMed]
- Mnenwa, R.; Maliti, E. A Comparative Analysis of Poverty Incidence in Farming Systems of Tanzania; Research on Poverty Alleviation; REPOA: Dar es salaam, Tanzania, 2010. [Google Scholar]
- Graef, F.; Sieber, S.; Mutabazi, K.; Asch, F.; Biesalski, H.K.; Bitegekof, J.; Bokelmann, W.; Bruentrup, M.; Dietrich, O.; Elly, N.; et al. Framework for participatory food security research in rural food value chains. Glob. Food Secur. 2014, 3, 8–15. [Google Scholar] [CrossRef]
- Fasse, A.; Winter, E.; Grote, U. Bioenergy and rural development: The role of agroforestry in a Tanzanian village economy. Ecol. Econ. 2014, 106, 155–166. [Google Scholar] [CrossRef]
- Van Wijk, M.T. From global economic modeling to household level analyses of food security and sustainability: How big is the gap and can we bridge it? Food Policy 2014, 49, 378–388. [Google Scholar] [CrossRef]
- Taylor, J.E.; Adelman, I. Village Economies: The Design, Estimation, and Use of Village-Wide Economic Models; Cambridge University Press: Cambridge, UK, 1996. [Google Scholar]
- Thorbecke, E. District-Level Economic Linkages in Kenya: Evidence Based on a Small Regional Social Accounting Matrix. World Dev. 1992, 20, 881–897. [Google Scholar]
- Leatherman, J.C.; Marcouiller, D.W. Income distribution characteristics of rural economic sectors: Implications for local development policy. Growth Chang. 1996, 27, 434–459. [Google Scholar] [CrossRef]
- Subramanian, A.; Qaim, M. Village-wide Effects of Agricultural Biotechnology: The Case of Bt Cotton in India. World Dev. 2009, 37, 256–267. [Google Scholar] [CrossRef]
- World Bank. World Development Indicators—International Comparison Program Database; World Bank: Washington, DC, USA, 2014. [Google Scholar]
- Tanzania National Bureau of Statistics: Summary of National Consumer Price Index (NCPI). 2014. Available online: http://www.nbs.go.tz/nbs/takwimu/cpi/CPI_Januari_Engl_2014.pdf (accessed on 17 May 2018).
- Lofgren, H.; Harris, R.L.; Robinson, S.; Thomas, M.; El-said, M. A Standard Computable General Equilibrium (CGE) Model in GAMS; Microcomputers in Policy Research 5; International Food Policy Research Institute: Washington, DC, USA, 2003. [Google Scholar]
- Graef, F.; Schneider, I.; Fasse, A.; Germer, J.U.; Gevorgyan, E.; Haule, F. Natural resource management and crop production strategies to improve regional food systems in Tanzania. Outlook Agric. 2015, 44, 159–167. [Google Scholar] [CrossRef]
- Ndimbwa, C. Crop Production Upgrading Strategies and their Role for Household Food Security in Chamwino District, Tanzania. Master’s Thesis, Uppsala University, Uppsala, Sweden, 2018. [Google Scholar]
- Kabanza, A.K.; Rwehumbiza, F.B. Assessment of the contribution of tied ridges and farmyard manure application to sorghum production in semi-arid areas of Tanzania. In Advances in Integrated Soil Fertility Mangement in Sub-Saharan Africa: Challenges and Opportunities; Bationo, A., Waswza, B., Kihara, J., Kimetu, J., Eds.; Springer: Dordrecht, The Netherlands, 2007; pp. 723–730. [Google Scholar]
- Kydd, J.; Dorward, A.; Morrison, J.; Cadisch, G. Agriculture development and pro-poor economic growth in sub-Saharan Africa: Potetial and policy. Oxf. Dev. Stud. 2007, 32, 37–57. [Google Scholar] [CrossRef]
- Bienabe, E.; Sautier, D. The role of small-scale producers’ organizations to address market access. In International Semina Beyond Agricutlure: Making Markets Work for the Poor; Assets: London, UK, 2005; Available online: http://agritrop.cirad.fr/528871/ (accessed on 23 December 2018).
- Mgeni, C.P.; Sieber, S.; Amjath-Babu, T.S.; Mutabazi, K.D. Can protectionism improve food security? Evidence from an imposed tariff on imported edible oil in Tanzania. Food Secur. 2018, 10, 799–806. [Google Scholar] [CrossRef]
- RLDC. Contract Farming in Tanzania’s Central Corridor Lessons from the Rural Livelihood Development Programme Tanzania, Report, May 2016. Available online: https://www.shareweb.ch/site/EI/Documents/Projects/7F-03459/SDC%20Lessons%20Learned%20CAPEX%20RLDP%20Tanzania%202016%20(en).pdf (accessed on 19 November 2018).
- Balchin, B.; Kweka, J.; Mendez-Para, M. Tariff Setting Fort he Development of the Edible Oil Sector in Tanzania, ANSAF Report. February 2018. Available online: http://dev.ansaf.or.tz/wp-content/uploads/2018/04/I4ID-Tariff-setting-in-Tanzanias-edible-oil-sector_FINAL-Report_26-Feb 2018.pdf (accessed on 23 December 2018).
- Njeru, P.N.M.; Mugwe, J.; Maina, I.; Mucheru-Muna, M.; Mugendi, D.; Lekasi, J.K.; Kimani, S.K.; Miriti, J.; Oeba, V.O.; Esilaba, A.O.; et al. Integrating Farmers and Scientific Methods for Evaluating Climate Change Adaptation Options in Embu County. In Adapting African Agriculture to Climate Change: Transforming Rural Livelihoods; Filho, W.L., Esilaba, A.O., Rao, K.P.C., Sridhar, G., Eds.; Springer: Cham, Switzerland, 2015; pp. 185–197. [Google Scholar]
- Nyamangara, J.; Nyagumbo, I. Interactive effects of selected nutrient resources and tied-ridging on plant growth performance in a semi-arid smallholder farming environment in central Zimbabwe. Nutr. Cycl. Agroecosyst. 2009, 88, 103–109. [Google Scholar] [CrossRef]
- Mudatenguha, F.; Anena, J.; Kiptum, C.K.; Mashingaidze, A.B. In situ rainwater harvesting techniques increase maize growth and grain yield in a semi-arid agro-ecology of Nyagatare, Rwanda. Int. J. Agric. Biol. 2014, 16, 996–1000. [Google Scholar]
- Kaganzi, E.; Ferris, S.; Barham, J.; Abenakyo, A.; Sanginga, P.; Njuki, J. Sustaining linkages to high-value markets through collective action in Uganda. Food Policy 2009, 34, 23–30. [Google Scholar] [CrossRef]
- Germer, J.; Herrmann, L.; Mahoho, H.; Swai, E.; Graef, F.; Kahimba, F.; Asch, F.; Tumbo, S.; Makoko, B.; Kimaro, A.; et al. Rainwater Harvesting for Improving Smallholder Farmer’s Sole and Intercrop Yields under a Rain-Fed Farming System. Innovating Strategies to Safeguard Food Security Using Technology and Knowledge Transfer-Trans-SEC, UPS Fact Sheets. 2015. Available online: http://project2.zalf.de/trans-sec/public/factsheet (accessed on 5 December 2018).
- Mwinuka, L.; Schneider, I.; Maeda, C.; Mutabazi, K.D.; Makindara, J.; Graef, F. Comparing stakeholder views for mutual acceptable food value chain upgrading strategies in Tanzania. Afr. J. Agric. Res. 2015, 10, 1376–1385. [Google Scholar]
- Mwinuka, L.; Mutabazi, K.D.; Graef, F.; Sieber, S.; Makindara, J.; Kimaro, A.; Uckert, G. Simulated willingness of farmers to adopt fertilizer micro-dosing and rainwater harvesting technologies in semi-arid and sub-humid farming systems in Tanzania. Food Secur. 2017, 9, 1237–1253. [Google Scholar] [CrossRef]
- TerAvest, D.; Carpenter-Boggs, L.; Thierfelder, C.; Reganold, J.P. Crop production and soil water management in conservation agriculture, no-till, and conventional tillage systems in Malawi. Agric. Ecosyst. Environ. 2015, 212, 285–296. [Google Scholar] [CrossRef]
- Silungwe, F.; Graef, F.; Bellingrath-Kimura, S.; Tumbo, S.; Kahimba, F.; Lana, M. Crop Upgrading Strategies and Modelling for Rainfed Cereals in a Semi-Arid Climate—A Review. Water 2018, 10, 356. [Google Scholar] [CrossRef]
- Eriksen, S.H.; Brown, K.; Kelly, P.M. The dynamics of vulnerabilty: Locating coping strategies in Kenya and Tanzania. Geogr. J. 2005, 171, 289–305. [Google Scholar] [CrossRef]
- Mmbando, F.E.; Wale, E.Z.; Baiyegunhi, L.J.S. Welfare impacts of smallholder farmers’ participation in maize and pigeonpea markets in Tanzania. Food Secur. 2015, 7, 1211–1224. [Google Scholar] [CrossRef]
- Chongela, J. Contribution of agriculture sector to the Tanzanian Economy. Am. J. Res. Commun. 2015, 3, 57–70. [Google Scholar]
- Davis, B.; Winters, P.; Carletto, G.; Covarrubias, K.; Quinones, E.; Zezza, A.; Stamoulis, K.; Bonomi, G.; DiGuiseppe, S. A cross-country comparison of rural income generating activities. World Dev. 2010, 38, 48–63. [Google Scholar] [CrossRef]
- Nagler, P.; Naude, W. Non-farm entrepreneurship in rural sub-Saharan Africa: New empirical evidence. Food Policy 2017, 67, 175–191. [Google Scholar] [CrossRef] [PubMed]
- Lanjouw, J.; Lanjouw, P. The rural non-farm sector: Issues and evidence from developing countries. Agric. Econ. 2001, 26, 1–23. [Google Scholar] [CrossRef]
- Start, D. The rise and fall of the rural non-farm economy: Poverty impacts and policy options. Dev. Policy Rev. 2001, 19, 491–505. [Google Scholar] [CrossRef]
- Haggblade, S.; Hazell, P.; Reardon, T. The rural non-farm economy: Prospects for growth and poverty reduction. World Dev. 2010, 38, 1429–1441. [Google Scholar] [CrossRef]
- Wan, J.; Li, R.; Wang, W.; Liu, Z.; Chen, B. Income Diversification: A Strategy for Rural Region Risk Management. Sustainability 2016, 8, 10. [Google Scholar] [CrossRef]
- Conceição, P.; Levine, S.; Lipton, M.; Warren-Rodriguez, A. Toward a food secure future: Ensuring food security for sustainable human development in Sub-Saharan Africa. Food Policy 2016, 60, 1–9. [Google Scholar] [CrossRef]
- Elikaeli, J. Determinants of Rural Income in Tanzania: An Empirical Approach, Research Report, REPOA, Dar es Salaam. 2010. Available online: http://www.repoa.or.tz/documents_storage/publications/10_4.pdf (accessed on 7 November 2018).
- UNDP, Economic Transformation for Human Development: Tanzania Human Development Report. 2014. Available online: http://hdr.undp.org/sites/default/files/thdr2014-main.pdf (accessed on 7 November 2018).
- Nabarro, D.; Wannous, C. The potential contribution of livestock to food and nutrition security: The application of the One Health approach in livestock policy and practice. Rev. Sci. Tech. 2014, 33, 475–485. [Google Scholar] [CrossRef]
Figure 1.
Schematic illustration circular flow of the village economy. Source. Adapted and modified from Fasse [30].
Figure 1.
Schematic illustration circular flow of the village economy. Source. Adapted and modified from Fasse [30].

Figure 2.
Commodities production and consumption flow in the Idifu computable general equilibrium (CGE) village model.
Figure 2.
Commodities production and consumption flow in the Idifu computable general equilibrium (CGE) village model.

Figure 3.
Income source share in the total household income in 2013.

Table 1.
2013 Idifu village economic structure.
| Commodity | VA Share | PRD Share | EMP Share | EXP Share | EXP-OUT Share | IMP Share | IMP-DEM Share |
|---|---|---|---|---|---|---|---|
| Sorghum & Millet | 25.6 | 24.2 | 0.7 | 19.6 | 17.1 | 1.0 | 15.5 |
| Sunflower | 4.4 | 4.1 | 0.1 | 5.8 | 45.6 | 3.6 | 14.2 |
| Maize | 7.1 | 6.5 | 2.5 | 68.5 | |||
| Other crops | 18.6 | 19.3 | 19.4 | 17.0 | 20.6 | 0.6 | 18.3 |
| Livestock | 14.1 | 13.1 | 25.2 | 46.0 | 72.8 | 2.6 | 72.2 |
| Non agriculture | 16.5 | 17.5 | 29.7 | 11.7 | 21.1 | 89.7 | 97.3 |
| Natural resources | 13.8 | 15.3 | 24.9 | 3.5 | 43.6 | ||
| Total-1 | 100.0 | 100.0 | 100.0 | 100.0 | 23.6 | 100.0 | 84.5 |
| Total Agriculture | 69.8 | 67.2 | 45.4 | 88.3 | 30.2 | 6.8 | 37.1 |
| Total non-agriculture | 30.2 | 32.8 | 54.6 | 11.7 | 8.8 | 93.2 | 93.2 |
| Total-2 | 100.0 | 100.0 | 100.0 | 100.0 | 23.6 | 100.0 | 84.5 |
Note: VA-Value-added (%), PRD-Production (%), EMP-Employment (%), EXP-Exports (%), EXP- OUT-Exports-output (%), IMP-Imports (%), IMP-DEM-Imports-domestic demand (%).
Table 2.
Distribution of factor shares across sectors at Idifu village.
| Sectors | Labor | Capital | Land | Total |
|---|---|---|---|---|
| Sorghum & Millet | 25.0 | 38.7 | 26.2 | 25.6 |
| Sunflower | 4.2 | 5.8 | 13.2 | 4.4 |
| Maize | 7.0 | 8.1 | 13.3 | 7.1 |
| Other crops | 17.4 | 42.6 | 37.1 | 18.6 |
| Livestock | 14.7 | 4.7 | 1.8 | 14.1 |
| Non-agriculture | 17.3 | 6.5 | 16.5 | |
| Natural resource extraction | 14.5 | 1.8 | 13.8 | |
| Total | 100.0 | 100.0 | 100.0 | 100.0 |
Table 3.
Agricultural sector productivity and farmer-market linkages simulation.
| Simulation Scenario | PrES1 | QuIS2 | PrES1 | QuIS2 | PrES1 | QuIS2 |
|---|---|---|---|---|---|---|
| Domestic sales (% change) | Export sales (% change) | Consumption (% change) | ||||
| Sorghum & Millet | −15.76 | 73.56 | 58.31 | 201.30 | −6.05 | 39.63 |
| Sunflower | −22.81 | 166.20 | 22.73 | −19.17 | −13.35 | −19.27 |
| Maize | 100.02 | 0.73 | 20.03 | |||
| Other crops | −18.06 | 56.10 | 53.51 | 224.49 | −7.53 | 64.62 |
| Livestock | −39.69 | 76.10 | 12.19 | 108.60 | −1.10 | 9.42 |
| Non-agricultural commodities | −29.04 | 74.52 | 84.55 | 184.10 | 0.44 | 13.66 |
| Natural resource extraction | 100.00 | 0.57 | 39.08 | |||
Note: PrES1: Market linkage Scenario (double export Price), QuIS2: Productivity increase Scenario (double output).
Table 4.
Sunflower sub-sector productivity and farmer-market linkages simulation.
| Domestic Sales (% change) | Export Sales (% change) | Consumption (% change) | ||||
|---|---|---|---|---|---|---|
| Simulation Scenario | PrES1 | QuIS2 | PrES1 | QuIS2 | PrES1 | QuIS2 |
| Sorghum & Millet | 0.01 | 0.30 | 0.04 | 0.01 | 0.42 | |
| Sunflower | −22.19 | 46.23 | 22.18 | 151.89 | −13.67 | 28.81 |
| Maize | 0.01 | 0.28 | 0.02 | 0.62 | ||
| Other crops | 0.01 | 0.34 | 0.06 | 0.02 | 0.53 | |
| Livestock | −0.02 | −0.85 | −0.04 | −1.42 | 0.01 | 0.30 |
| Non-agricultural commodities | 0.01 | 0.40 | 0.10 | 0.02 | 0.62 | |
| Natural resource extraction | 0.02 | 0.52 | 0.02 | 0.62 | ||
Note: PrES1: Market linkage Scenario (double export Price), QuIS2: Productivity increase Scenario (double output).
Table 5.
Sunflower sub-sector Upgrading strategies income effects.
| Scenarios | |||
|---|---|---|---|
| PrES1 | QuIS2 | PrES1 + QuIS2 | |
| (% change) | (% change) | (% change) | |
| Labor | 17.45 | 20.75 | 22.79 |
| Capital | 21.32 | 22.80 | 26.26 |
| Land | 12.56 | 16.73 | 22.28 |
| Household | 30.95 | 32.62 | 38.55 |
| Government | 14.17 | 18.53 | 23.16 |
© 2018 by the authors. Licensee MDPI, Basel, Switzerland. This article is an open access article distributed under the terms and conditions of the Creative Commons Attribution (CC BY) license (http://creativecommons.org/licenses/by/4.0/).
Share and Cite
MDPI and ACS Style
Mgeni, C.P.; Müller, K.; Sieber, S. Sunflower Value Chain Enhancements for the Rural Economy in Tanzania: A Village Computable General Equilibrium-CGE Approach. Sustainability 2019, 11, 75. https://doi.org/10.3390/su11010075
AMA Style
Mgeni CP, Müller K, Sieber S. Sunflower Value Chain Enhancements for the Rural Economy in Tanzania: A Village Computable General Equilibrium-CGE Approach. Sustainability. 2019; 11(1):75. https://doi.org/10.3390/su11010075
Chicago/Turabian StyleMgeni, Charles Peter, Klaus Müller, and Stefan Sieber. 2019. "Sunflower Value Chain Enhancements for the Rural Economy in Tanzania: A Village Computable General Equilibrium-CGE Approach" Sustainability 11, no. 1: 75. https://doi.org/10.3390/su11010075
Note that from the first issue of 2016, this journal uses article numbers instead of page numbers. See further details here.