Article

Community-Level Physiological Profiles of Microorganisms from Different Types of Soil That Are Characteristic to Poland—A Long-Term Microplot Experiment

Department of Agricultural Microbiology, Institute of Soil Science and Plant Cultivation–State Research Institute (IUNG-PIB), Czartoryskich Street 8, 24-100 Puławy, Poland
*
Author to whom correspondence should be addressed.
Sustainability 2019, 11(1), 56; https://doi.org/10.3390/su11010056
Submission received: 26 October 2018 / Revised: 19 December 2018 / Accepted: 19 December 2018 / Published: 21 December 2018

Abstract

:
Comparative studies, such as the analysis of physicochemical properties and the microbiological composition of soil, are burdened with many problems resulting from the various locations of soils—often, different weather conditions among the experimental fields and varying time between the sample collection and analysis. The aim of this study was to assess the differences in the physiological profiles of bacterial communities from eight different types of soils from Poland, used in the microplot experiment that was established in 1881. The same plant species were continuously grown at all plots, at the same time, and the soil received the same type of fertilization. Moreover, the soils were always under the same weather conditions. The community-level physiological profiles of microorganisms were evaluated by using the Biolog EcoPlate™ method. The analysis demonstrated that good quality soils, especially the Gleyic Chernozem, Cambic Leptosol, and the Fluvic Cambisol exhibit a significantly higher enzyme activity, compared with the dystric soils. The dehydrogenases activity in the different time-points indicates a wide soil microbiome buffering capacity, which allows the persistence of a relatively permanent physiological profile, over many years.

1. Introduction

Soil is a critically important, fundamental, and irreplaceable component of the earth’s biosphere, functioning as a vital living system in the production of food and fiber, and in the maintenance of biogeochemical cycles. Moreover, the good health of plants, animals and humans is highly dependent on good soil health and quality [1,2]. For these reasons, it is extremely important to maintain soils in ‘good health’. Soil health is most simply defined as ‘the capacity of the soil to function’ [3]. It consists of the chemical, physical, and biological components of a soil and their interactions. The biological component of soil is extremely important in the maintenance of soil health, because this soil dynamic system is mediated by the diversity of living organisms, especially soil microorganisms [1]. This microbial component of soil is responsible for a myriad of functions (80%–90% of the processes in soil are reactions mediated by microbes), including soil humus formation, cycling of nutrients, degradation of xenobiotics, and improvement of soil structure and effects on plant health [2,4]. Soil provides a living space for the microbiota, which is defined by the architecture of the networks of various soil pores. This soil structure depends on the association between mineral soil particles (sand, silt, and clay) and organic matter, in which aggregates of different size and stability are formed. The structural organization of soil particles and soil pores provides a spatially heterogeneous habitat for microorganisms characterized by different substrates, nutrients, and oxygen concentrations, water contents, as well as variable pH values [5].
The proper functioning of soil depends on the biodiversity of microorganisms, which is considered as a total number of bacteria and fungi but most importantly the species composition [6]. Different soil types (which encompasses physicochemical soil properties) are assumed to harbour specific microbial communities. Several studies confirm the correctness of this assumption. The establishment of an introduced bacterial community of fluorescent pseudomonads was affected both quantitatively and qualitatively by the soil type [7]. Chau et al. [8], by using terminal restriction fragment length polymorphism (T-RLFP), found an effect of soil texture on the species richness of soil bacterial communities. Schreiter et al. [9] reported bacterial community denaturing gradient gel electrophoresis (DGGE) fingerprints of bulk soil samples taken from three soil types, and found that some of the bands were soil-type specific. Additionally, the results of the investigations of Girvan et al. [10] by using DGGE, T-RFLP and Biolog® analyses indicated that soil type was the key factor determining bacterial community composition in arable soils from three farms. The utilization of different organic compounds by soil microorganisms is mostly investigated by metagenome sequencing [11]. Understanding the diversity of a community of soil microorganisms may allow better understanding of the relationship with soil and predict the influence of human agricultural activity on the functioning of soil, and thus, its quality and productivity.
One of the methods currently used to analyze the functional diversity of microbial communities is the physiological community level physiological profiling (CLPP), with the use of 96-well EcoPlates™ (Biolog Inc., Hayward, CA, USA) offered by the Biolog® system [12]. In the literature, there is a lot of information about the possibilities of using the Biolog® EcoPlates™ in environmental studies. It was used to analyze the physiological activity of microorganisms in soil contaminated with heavy metals [13] and pesticides [14], and to study the functional microbial diversity, under different plant and cultivation types [15,16]. An attempt was also made to assess the impact of climate change on soil microbial activity, by using a Biolog® system [17]. The limitations of the Biolog method are known. CLPP does not represent the functional potential of the entire microbial community, but only of a fast-growing bacterial fraction, such as Gammaproteobacteria, especially Pseudomonas sp. [18,19]. However, this method is widely used in environmental microbiology research. EcoPlate™ is evaluated as a useful method for differentiating between microbial communities and determining which substrates are most utilized by these communities. Many researchers indicate that EcoPlate™ is useful for the physiological profiling of communities and the assessment of their functional diversity [20,21,22,23,24]. EcoPlate™ provides many results of the metabolism of microorganisms that correlate with other soil quality indicators [25]; therefore, it was decided to use it to compare the activity of microorganisms in the different soil types.
The aim of this research was to investigate differences in the physiological profiles of bacterial communities from the eight soil types most common for Poland. The study was conducted on the microplot experiment founded in 1881, the greatest advantage of which was the equal cultivation of each soil and exposure to the same weather conditions. The omission of variables, such as location, different effects of wind and other factors, allowed investigation of the effect of the type of soil, its structure, and its characteristics, on the catabolic potential of the microbial community. It is hypothesized that in soils that are classified as good quality soil, the catabolic microbial activity, and diversity would be higher than in dystric, acidic soils.

2. Materials and Methods

2.1. Microplot Experiment

A unique experimental 14 m2 plot system at the Institute of Soil Science and Plant Cultivation—State Research Institute in Puławy, Poland (51°24′53.042″ N; 21°57′34.226″ E) was an ideal site to study the effect of the soil type on the composition of the soil microbial communities. This plot experiment was established in 1881. It represents different types of soil collected from representative fields across Poland, in accordance with the soil horizons in the soil profile, specific to each type (Table 1). The structure of the soils was not destroyed by compaction because they have been always cultivated by hand tillage. The same plant species were always grown in all plots, at the same time, and the soil received the same fertilization. Moreover, the soils were always under the same weather conditions (Table 2). For all the years, the main crop was cereal (e.g., winter wheat, spring wheat, buckwheat). In 2015, triticale was growing on each microplot, and in 2016 spring barley.
A microplot experiment has many advantages in the study of microorganism communities in various ecosystems. First of all, disturbances caused by different locations and environmental conditions are eliminated. By ensuring the proper maintenance of the microplots, the effect of precise factors, such as the soil structure and its physicochemical properties, can be studied.

2.2. Soil Sampling

Sampling took place during four time-points: April 2016 and 2017, June 2017, and July 2018. All time points were chosen for the pH measurement and dehydrogenases activity, in order to evaluate the persistence of the soil physiology parameters. For the Biolog® EcoPlate™ analysis, the samples from April 2016 were chosen, since Biolog® approach is a very sensitive method and the aim was to compare substrates utilization in different soil types, without plant exudates, and other influencing factors. For each of the eight bulk soils (soil between plants, without roots), samples were collected from fifteen different representative spots, at a depth of 0–15 cm, using tubular soil sampler. These were pooled in individual plastic bags and transferred to a portable refrigerator. Fresh samples were sieved by using a 2 mm sieve, collected in sterile plastic tubes and stored for three days, at 4 °C, until the EcoPlate™ analysis, as well as pH and dehydrogenases activity measurements.

2.3. pH Measurements

From each soil sample, 10 g was suspended in 20 mL of sterile water and shaken for 30 min. Sedimentation was then carried out for 30 min. The pH was measured at room temperature (edge® Multiparameter pH meter, HANNA Instrument, Woonsocket, RI, USA).

2.4. Dehydrogenases Activity Measurements

Dehydrogenases (DHs) activity measurements were performed using 2,3,4-triphenyltetrazolium chloride (TTC), as a reducing agent, as described by Casida et al. [29], with slight modifications. Fresh soil samples were prepared in triplicates (6 g of each) and mixed with CaCO3 (60 mg). Then, 3% TTC (w/v, 1 cm3) and distilled water (2.5 cm3) were added. Samples were incubated at 37 °C, for 24 h, and were subjected to extraction with ethyl alcohol (25 cm3). The extracts were filtered through cellulose filter paper (ø = 3 mm) and absorption was measured, spectrophotometrically, at 485 nm (Spectrophotometer UV-Vis Evolution™ 60, Thermo Fisher Scientific, Waltham, MA, USA). The DHs activity was expressed as micrograms of the triphenyl formazan (TPF) per 1 g of dry weighted soil, after 24 h of incubation (µg TPF g−1 d.m. soil 24 h−1).

2.5. Community-Level Physiological Profiles of Microorganisms—EcoPlate™

The Biolog® EcoPlate™ method was used to evaluate the catabolic potential of soil microorganisms [30]. Every plate includes 96 wells containing 31 different carbon sources, plus a blank well, in three replications. The substrates in the wells can be subdivided into five groups: carbohydrates (n = 10), carboxylic acids (n = 9), amines and amides (n = 2), amino acids (n = 6), and polymers (n = 4) [31]. These compounds occur naturally in the soil environment and some of them are products of exudates of plant roots [32]. Freshly collected samples of soil were taken (1 g) and suspended in a bottle containing sterile water (99 mL), followed by shaking for 20 min at 20 °C. The suspension was then left to settle for 30 min at 4 °C [31]. The supernatant was filtered through a BagFilter® 400P (Interscience, Saint Nom La Breteche, France) to avoid transmission of the remaining plant and soil particles that could affect further reads. Inoculation was accomplished by pipetting 120 µL of each sample into each well of the EcoPlate™. Plates were incubated at 28 °C, for 144 h, and the absorbance at 590 nm was measured every 24 h. For further analysis, readings at 120 h were chosen as the most suitable, representing the optimum optical density.
The average well color development (AWCD), after 120 h of incubation, was calculated for each plate, by the method described by Garland [33], as a mean of the optical densities (OD590) from the 31 wells. The absorbance of each well was corrected by the subtraction of the optical density (OD590) of the well containing water. In addition, OD590 = 0.25 was assumed as a threshold value, below which a substrate was considered as unmetabolized. On the basis of data obtained at 120 h, Richness (S), Shannon diversity (H′), Shannon evenness (E), and average well color development (AWCD) indexes were calculated by following the formulae shown in Table 3.

2.6. Statistical Analyses

For the Biolog® EcoPlate™ approach and the DHs measurement, one-way analysis of variance (ANOVA) and the post-hoc Tukey’s HSD (honest significant difference) test at P ≤ 0.05 was performed, to determine the differences among soils and evaluate the significant differences.
Principal component analyses (PCA) was conducted to estimate the relationships between soil types, microbiome general metabolism, and selected indices. For the principal component analysis, the optical density (OD590) value of each well, at 120 h, was used. All analyses were evaluated by using the Statistica version 10.0 software (StatSoft, Inc., Tulsa, OK, USA, 2011). For the PCA, raw data was standardized prior to the analysis. The standardization was performed by subtraction of the mean value from the data and division by the standard deviation.

3. Results

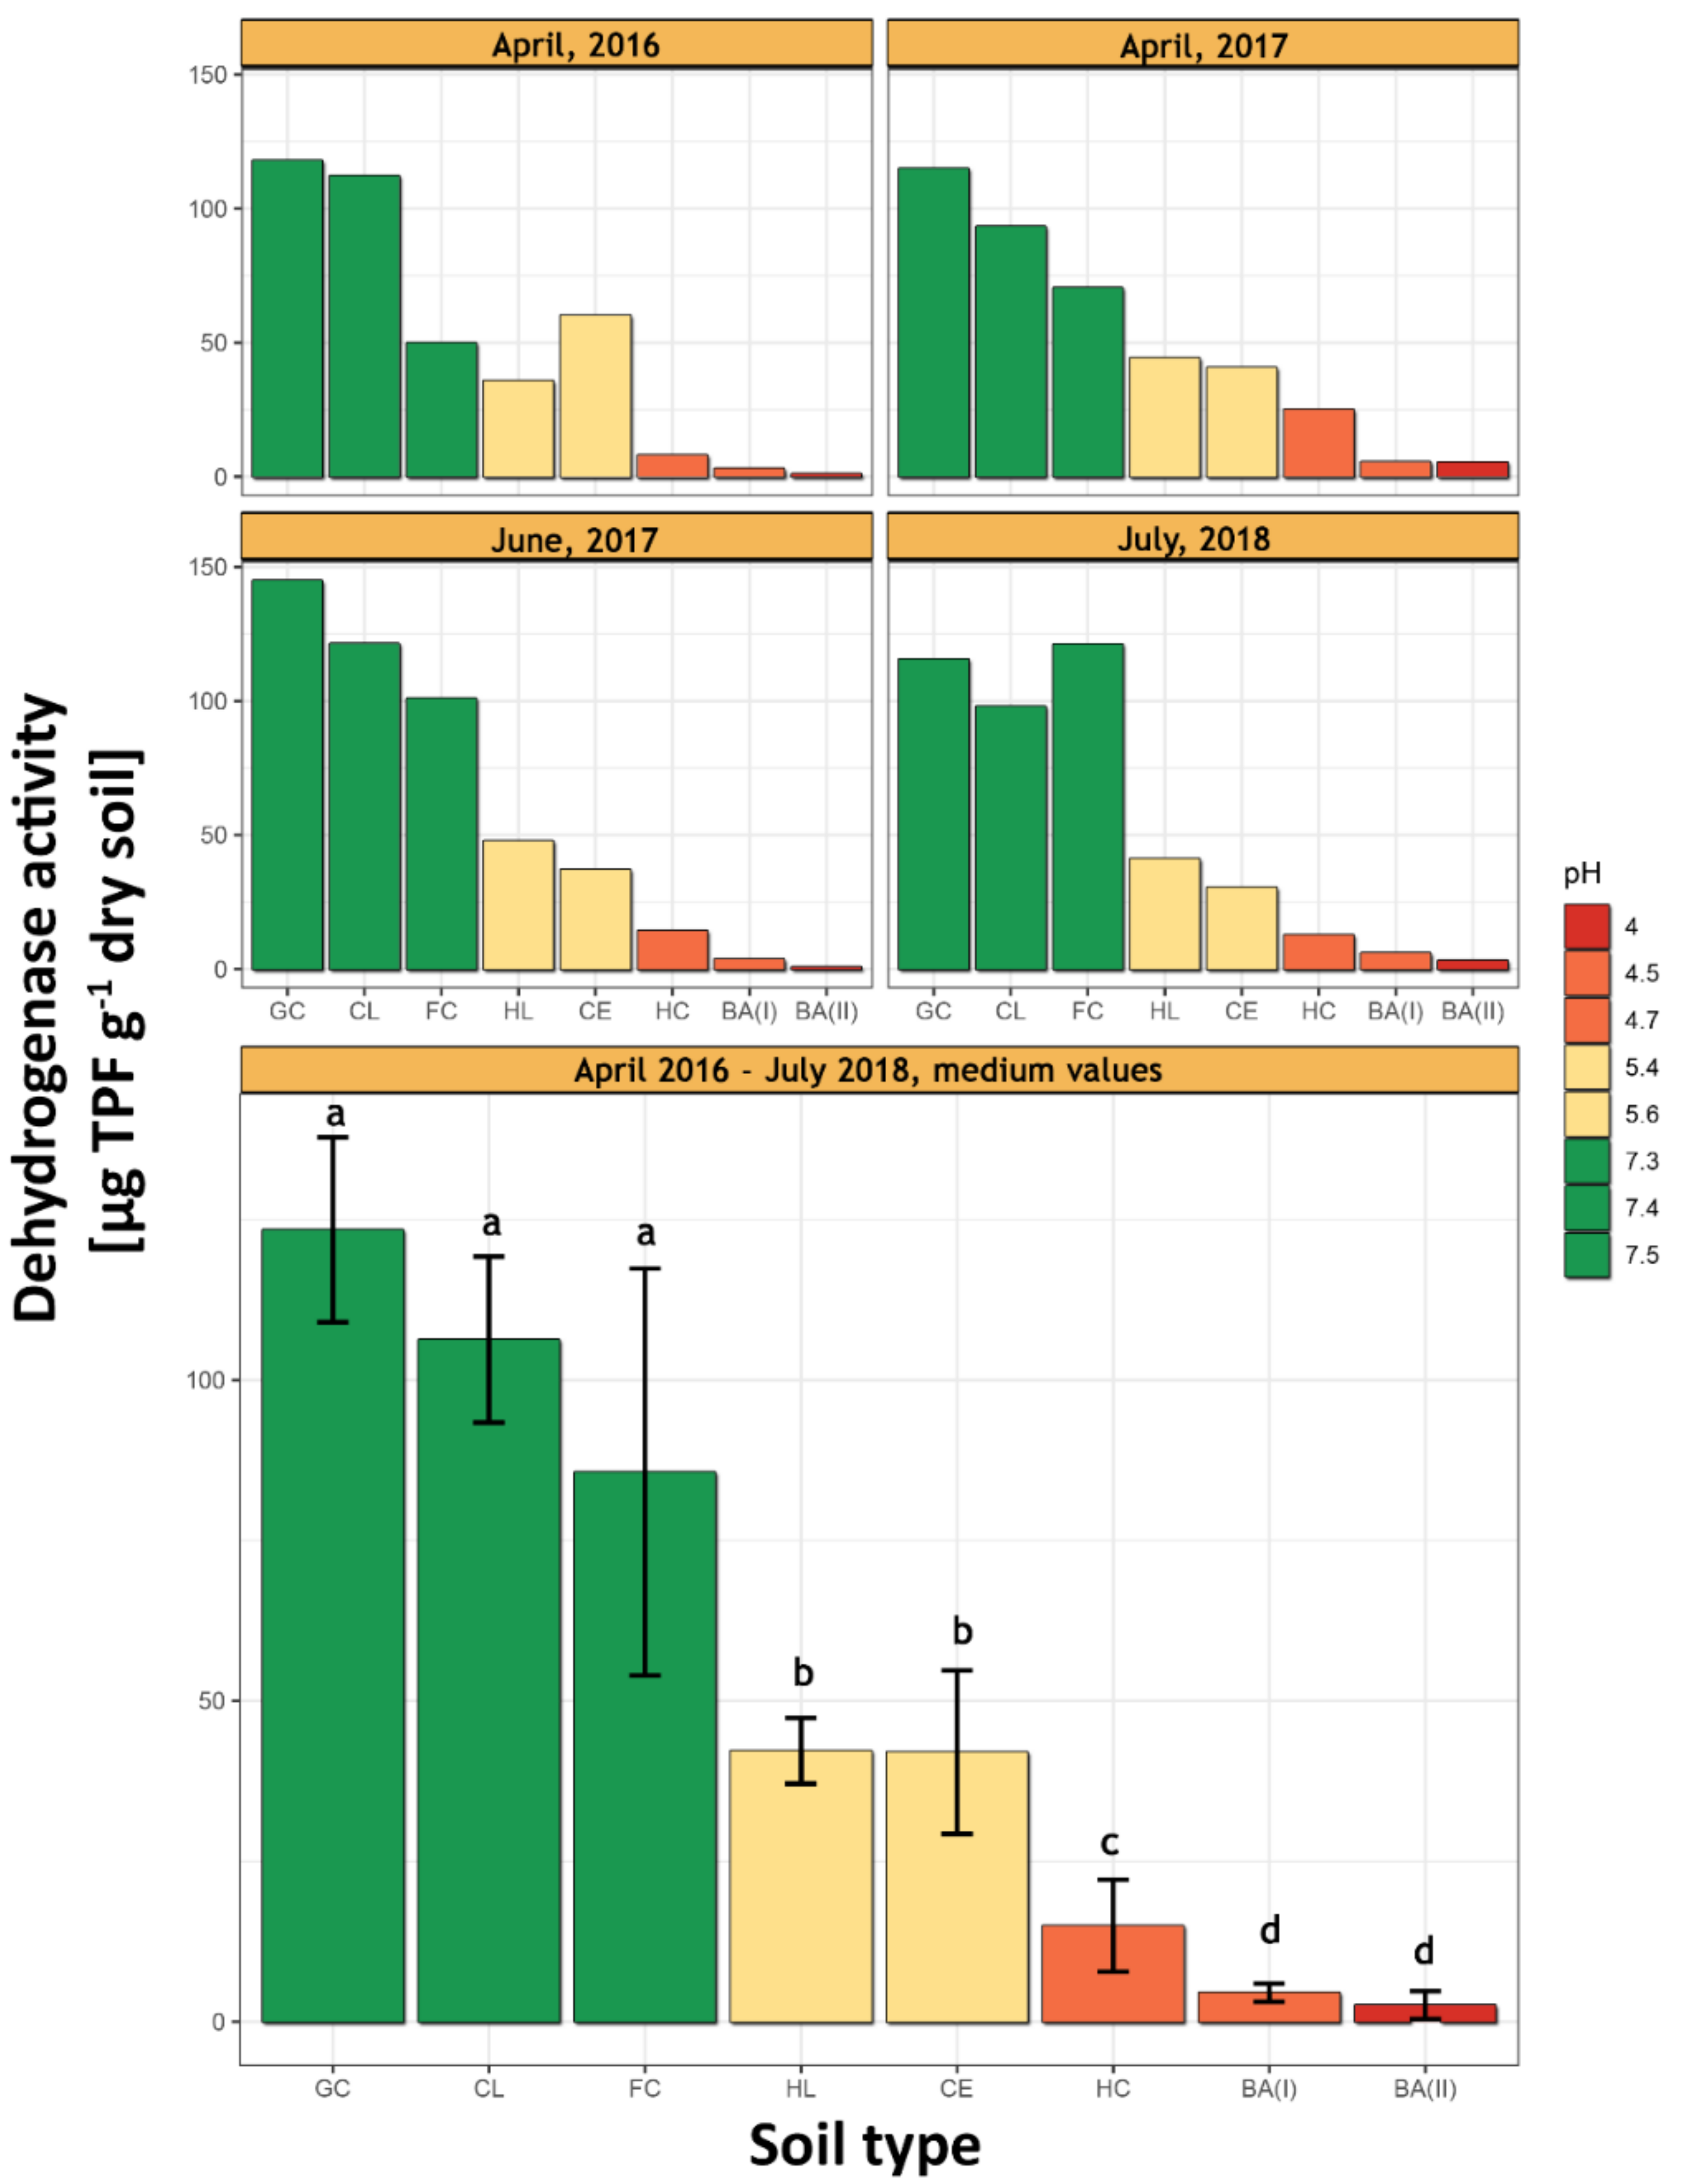
3.1. pH and the Dehydrogenases Activity

The soil’s pH is shown in Table 1. High DHs activity was observed in the GC, FC, and the CL. The highest was measured for GC (117.97 µg TPF g−1 d.m. soil 24 h−1; Figure 1). Measurement of the dehydrogenase activity proved to be a very stable parameter, which depended mainly on the type of soil and its pH, but was less sensitive to the season. This method allowed to monitor the overall physiological state of the soils, showing that over time, all soils maintained almost identical levels of microbiological activity. Although the composition of microorganisms, according to many literature reports, changes over time, the overall activity remains almost unchanged, due to the phenomenon of functional redundancy [37].
DHs activity for the GC, FC, and the CL, did not differ statistically. Acidic soils (HL, HC, BA(I), and BA(II)) were characterized by a significantly lower DHs activity, and the lowest was observed in the BA(II) (0.99 µg TPF g−1 d.m. soil 24 h−1).

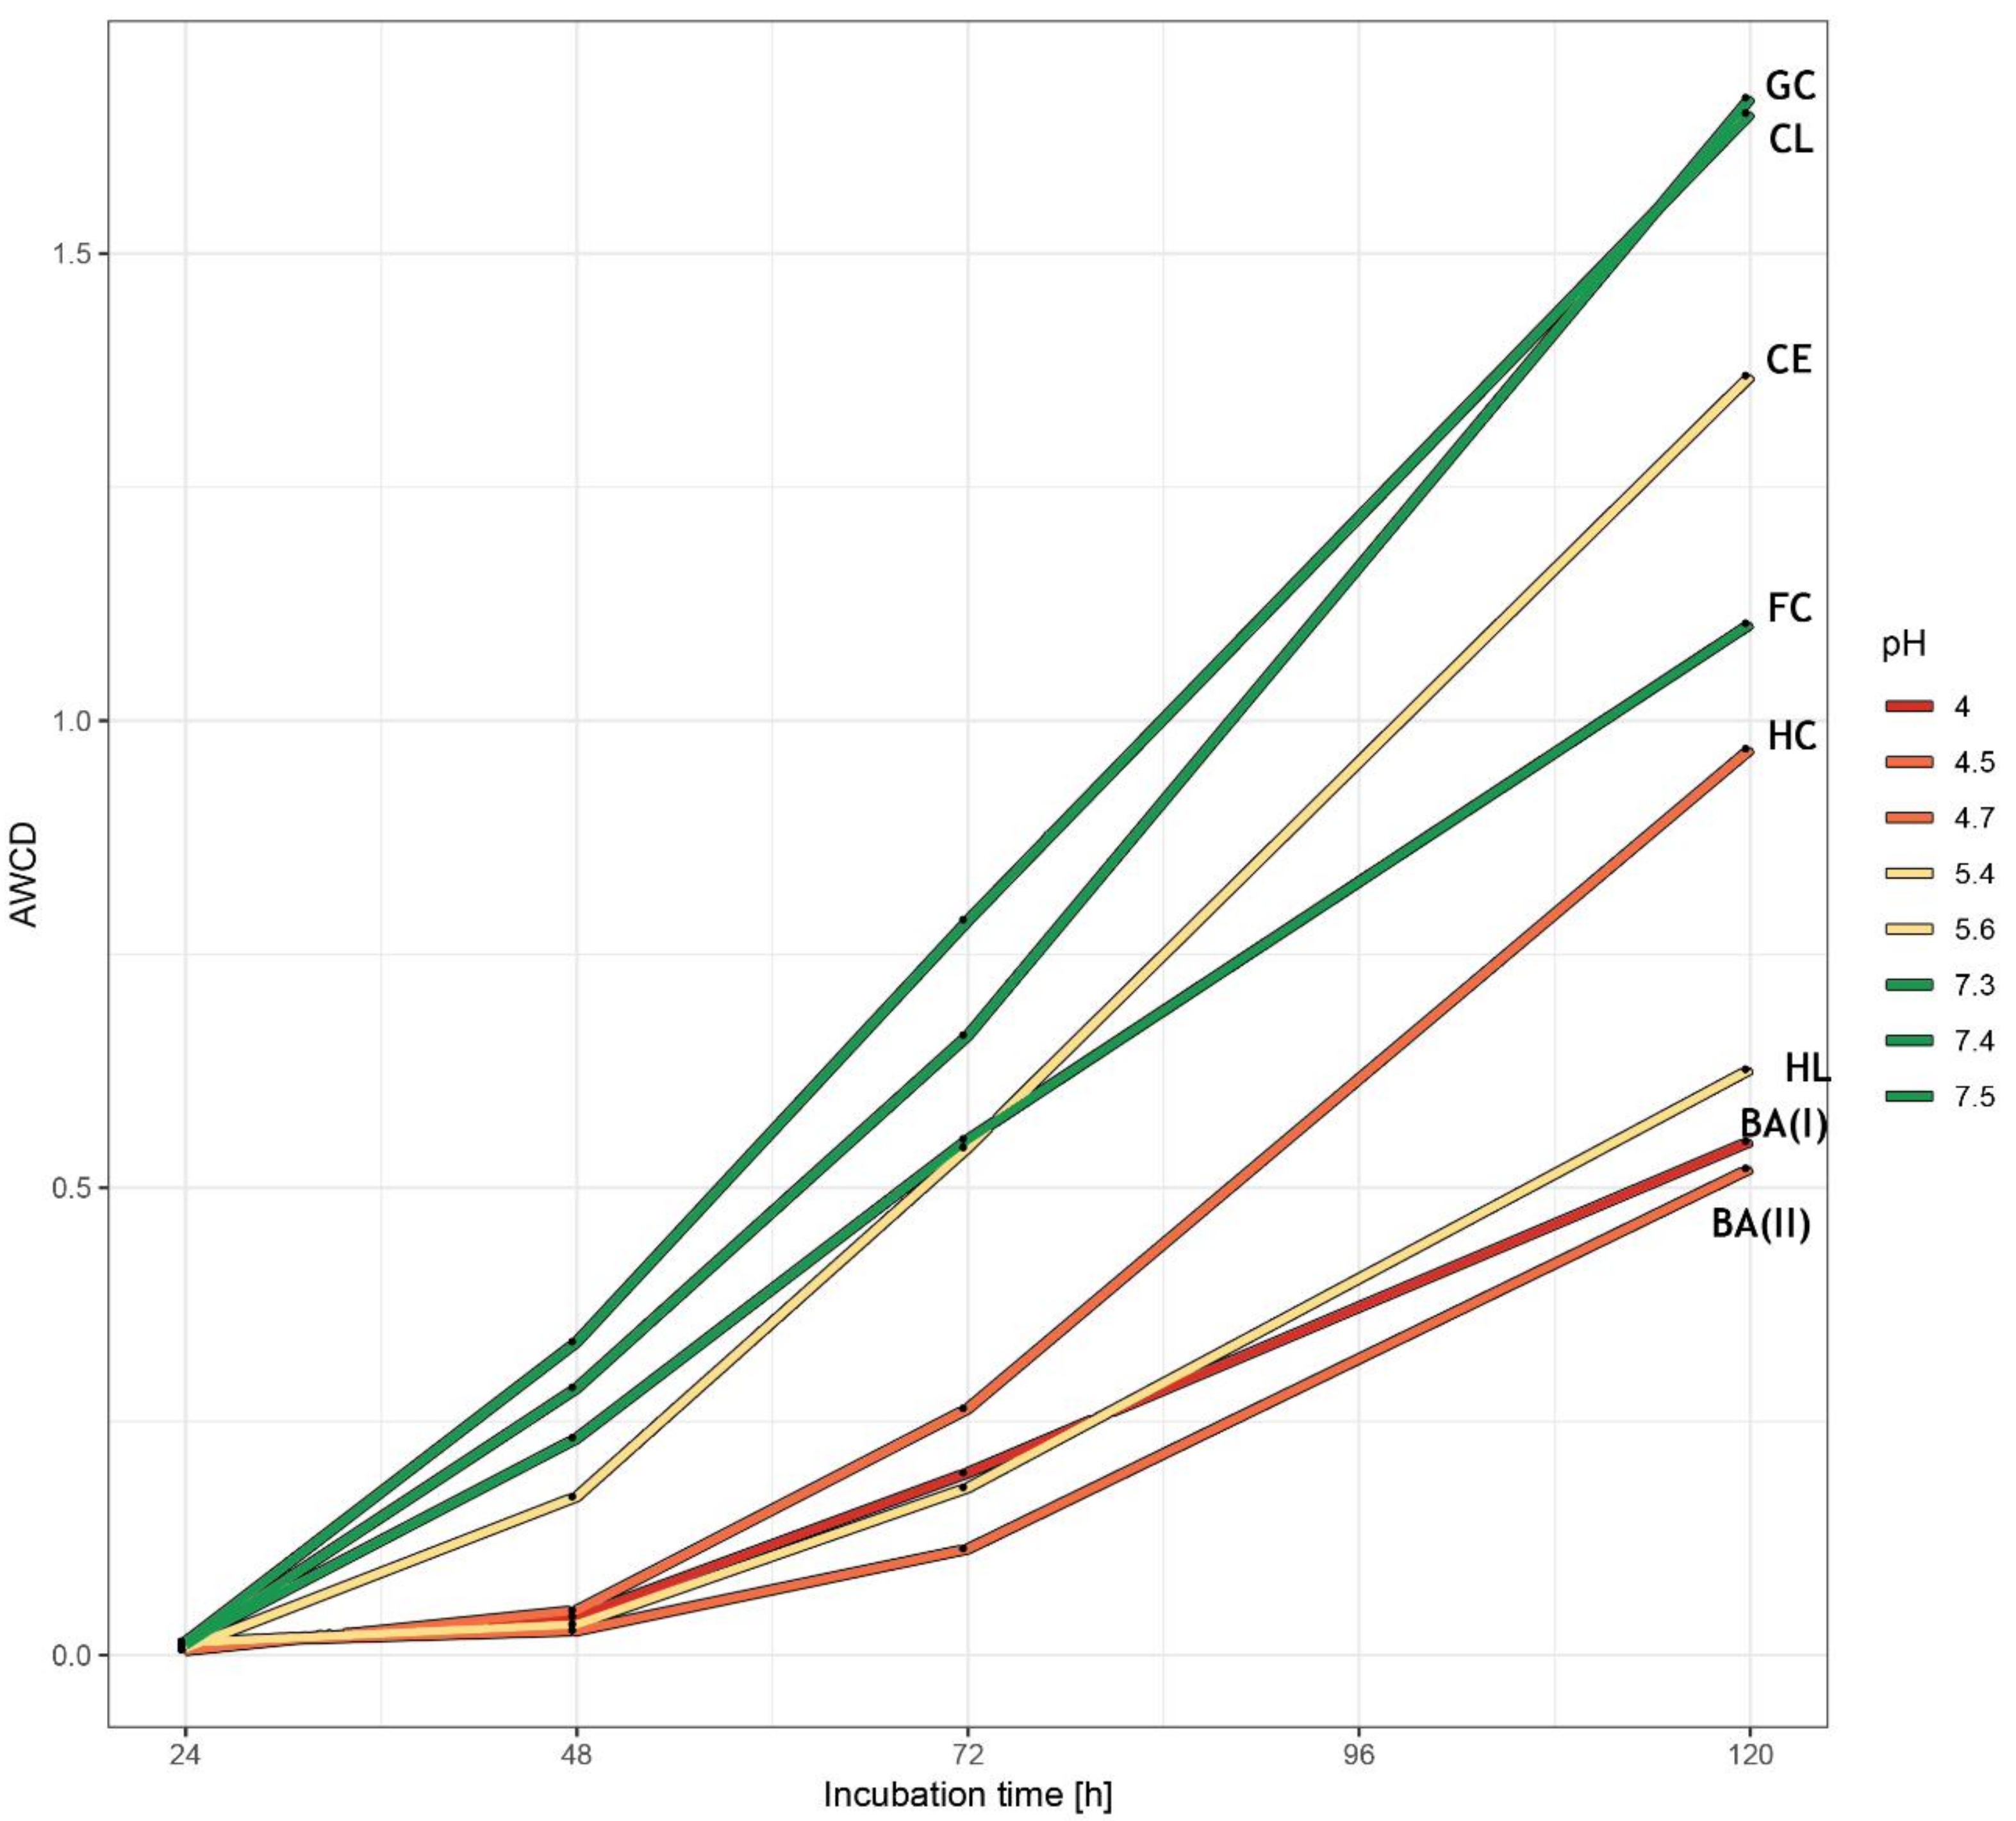
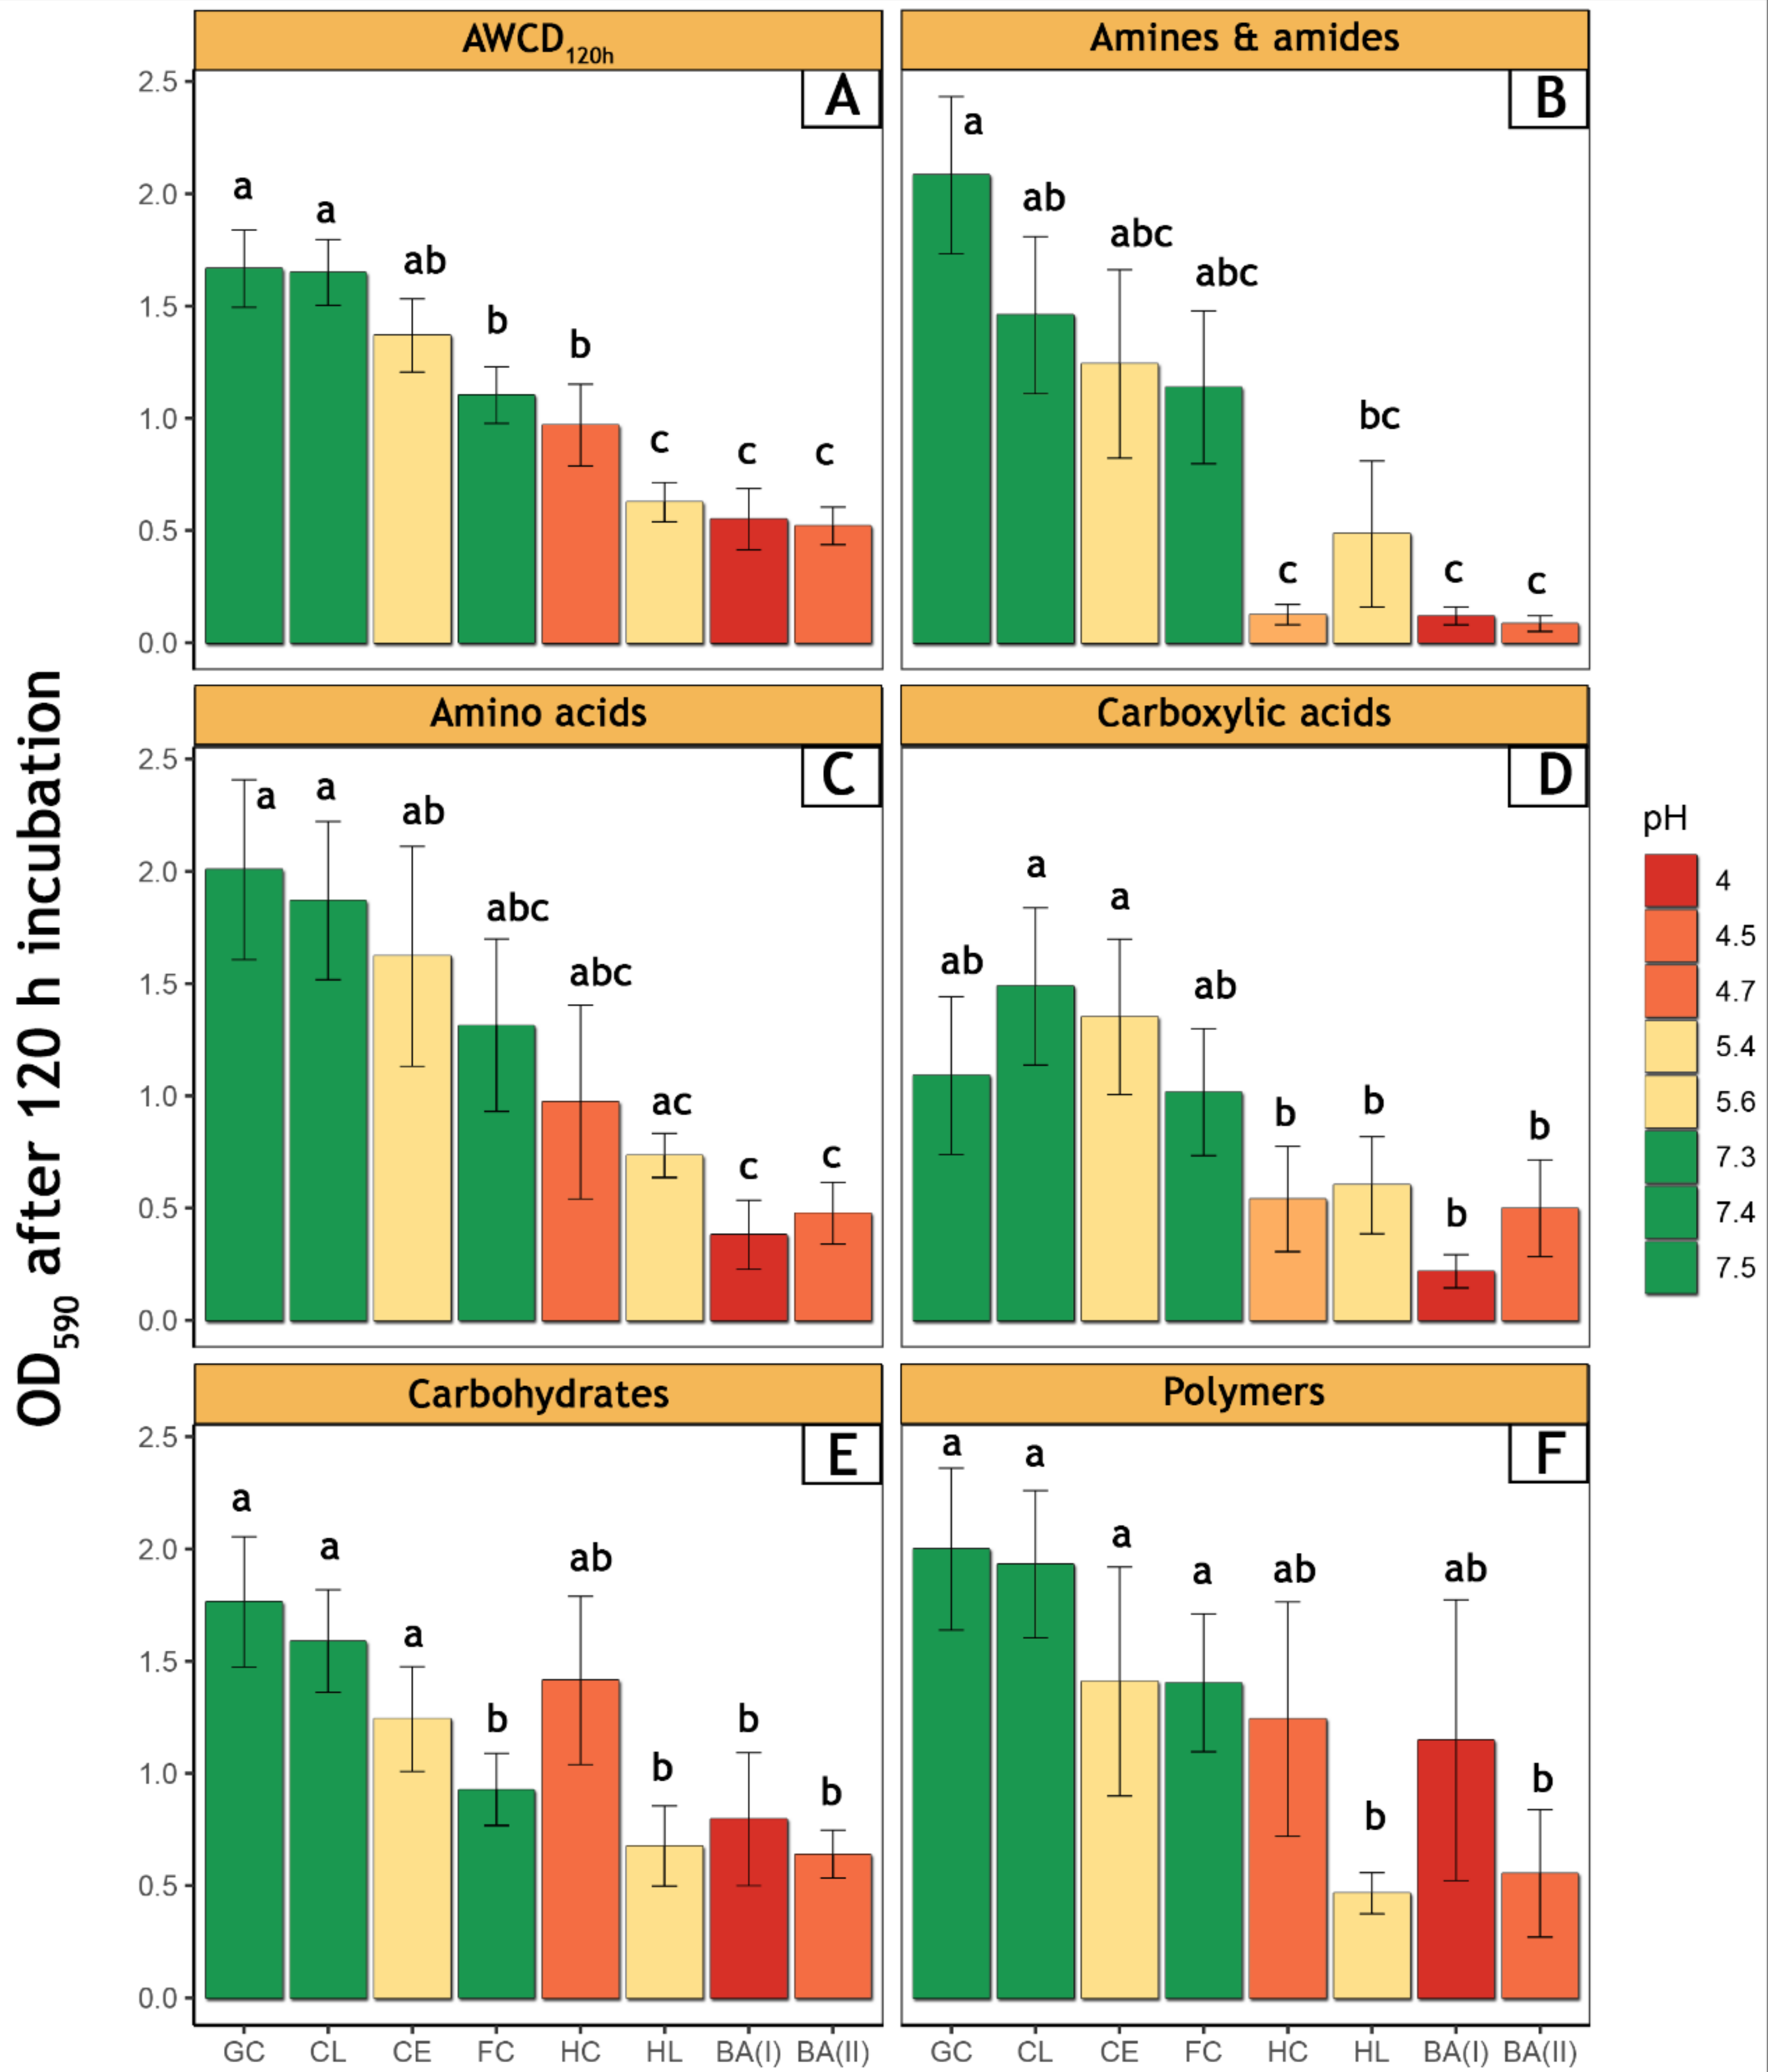
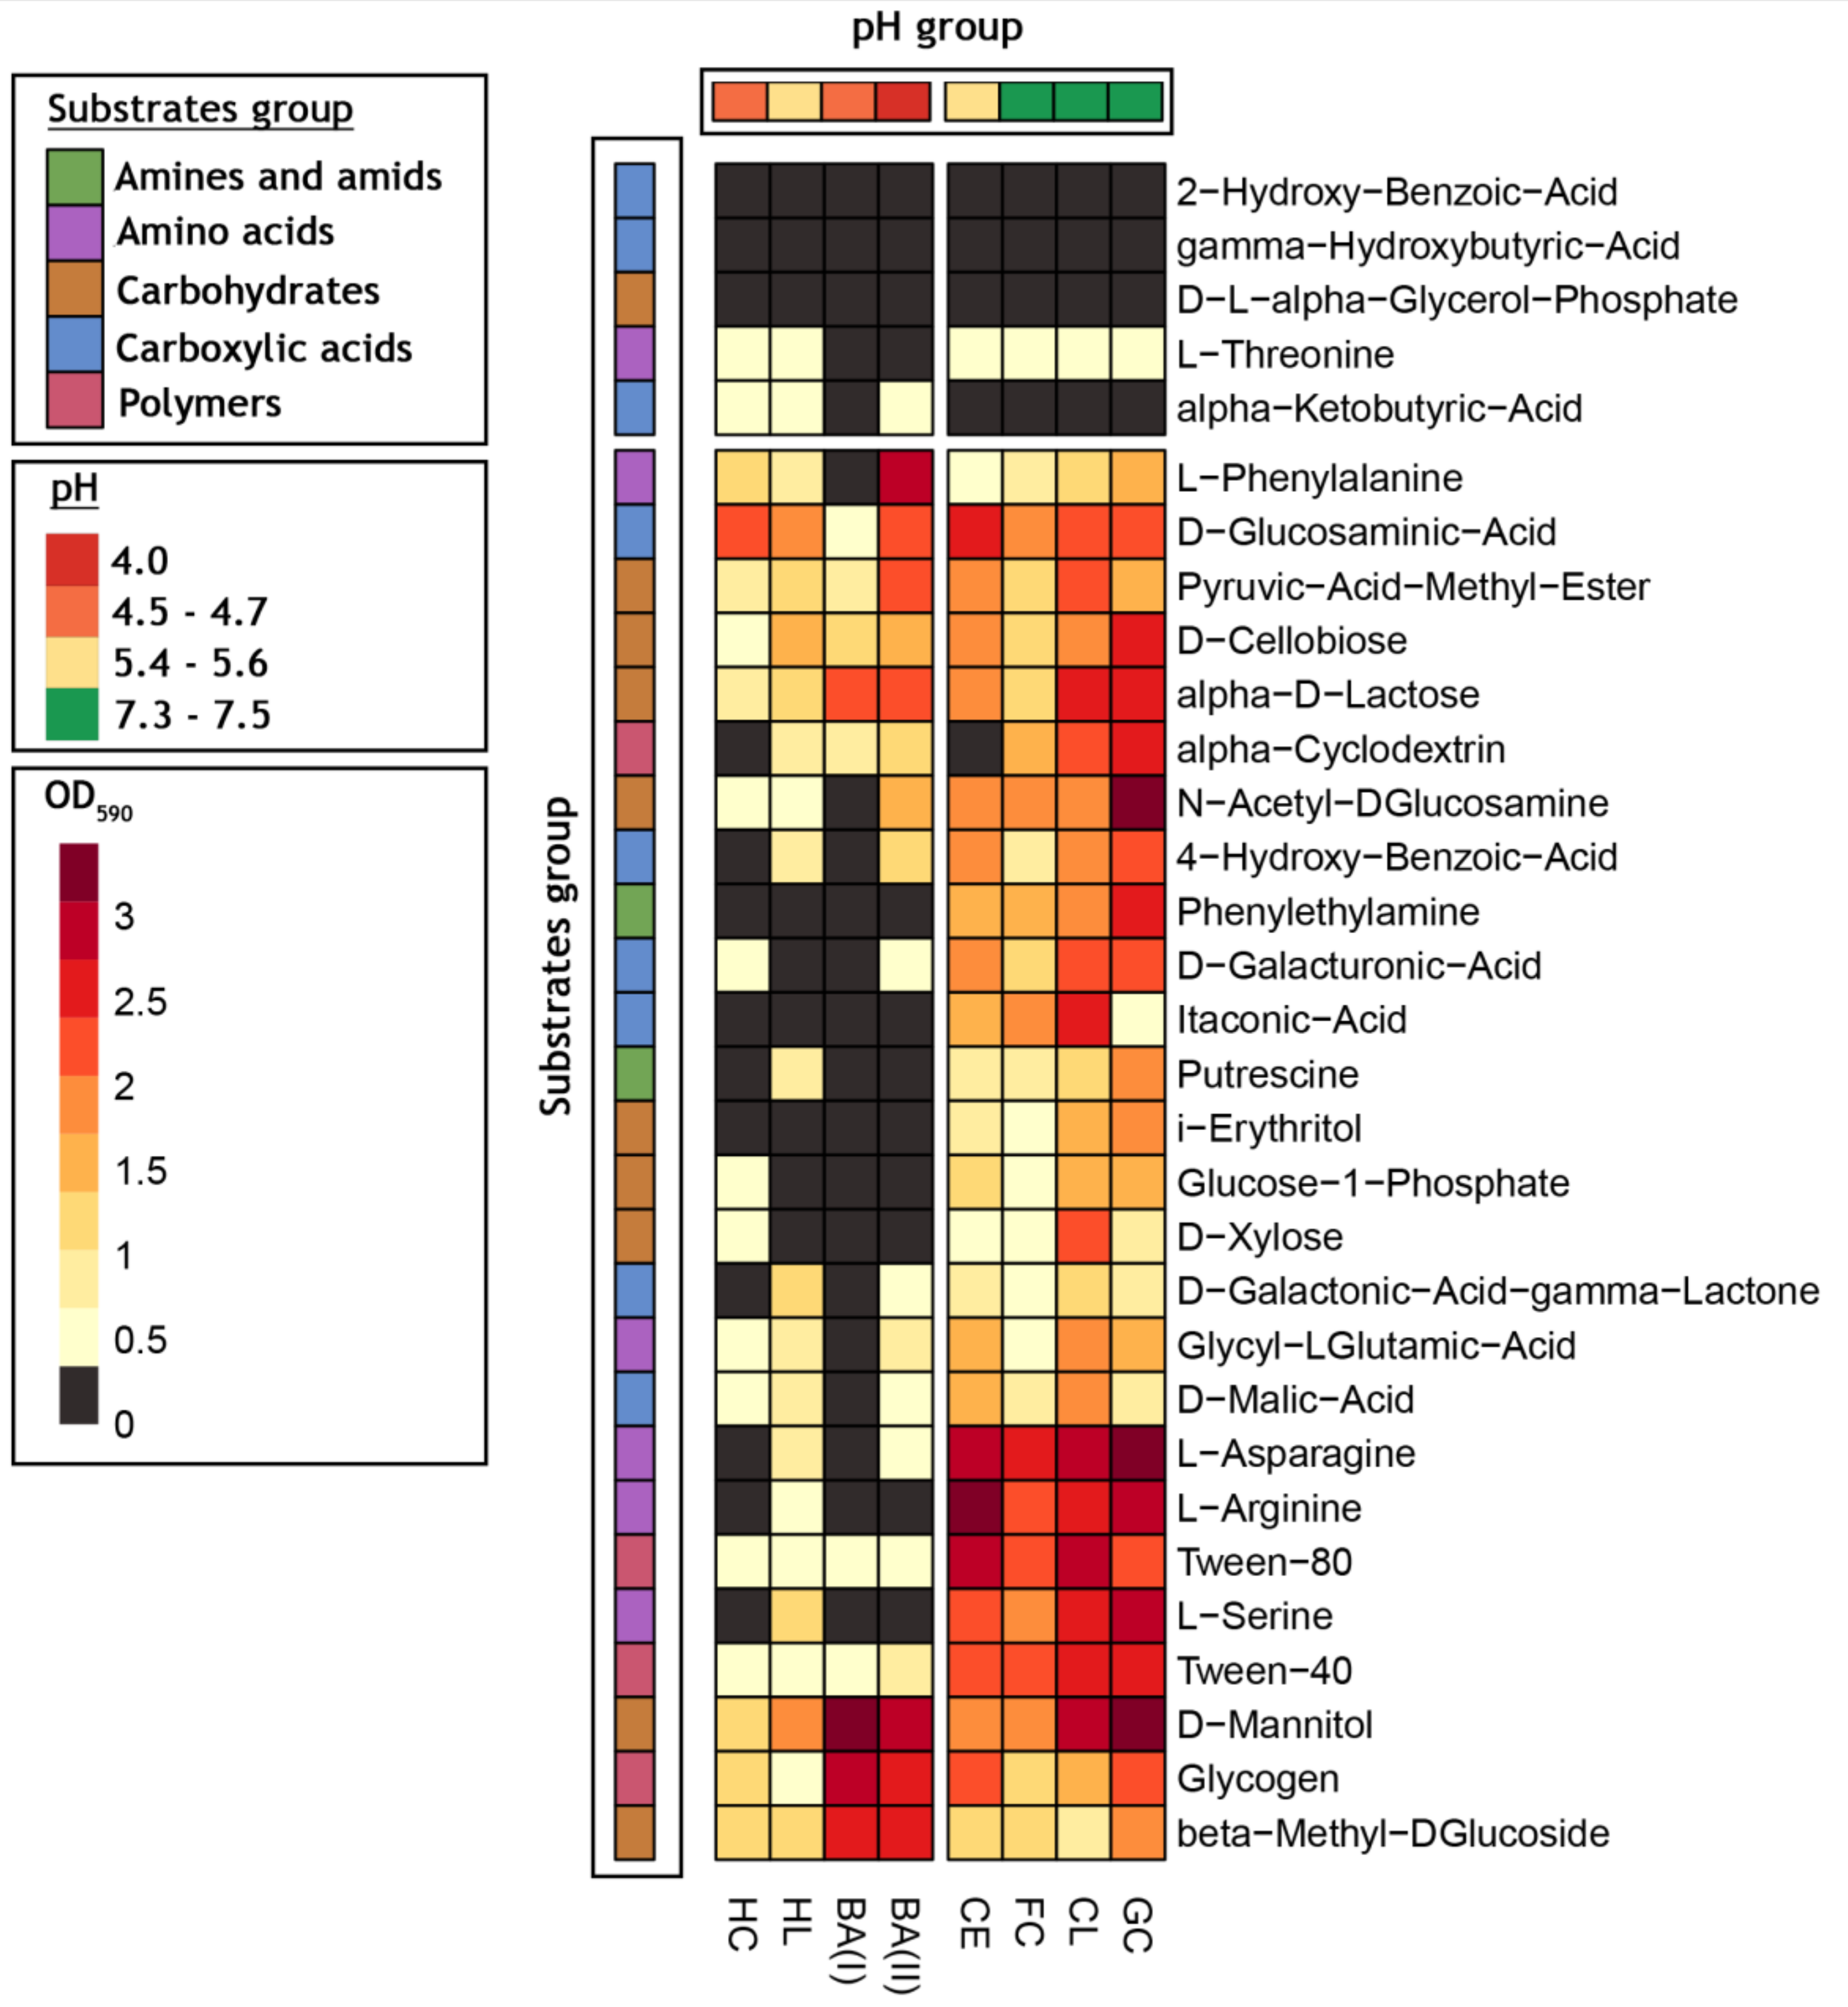
3.2. Bacterial Community-Level Physiological Profiles—EcoPlate™

The average of the AWCD index for all soil samples (Figure 2) was the highest after 120 h of incubation. The highest AWCD index, after 120 h of incubation, was calculated for the GC (1.66) and the CL (1.65), whereas the lowest was in the BA(II) (0.52), BA(I) (0.55), and the HL (0.63). In the group with the highest metabolic levels, there were GC, CL, CE, and FC, whereas, the group with a lower metabolism consisted of the HC, HL, BA(I), and the BA(II) samples.
After 120 h of incubation of the ECO Plates (Figure 3), it can be noted that there were no statistically significant differences between the CL and the GC, in the total AWCD, and that they represented the two highest AWCD index values of all samples (1.65 and 1.66, respectively). The slightly higher AWCD index was characteristic of the microorganisms from the sample GC, in comparison to the CL, and they showed a higher metabolism during incubation (Figure 2). For three soils (HL, BA(I), and BA(II)), the AWCD index was at a similar level (0.52–0.62). The split of the AWCD value for each substrate group showed that the total AWCD value did not always fully reflect all the differences between the samples. The small difference between the total AWCD calculated for HC and FC could indicate that despite their different classifications, they were physiologically similar (with P ≤ 0.05; Figure 2), however, in the case of amines and amides there was a dramatic decrease in the metabolism for HC, while the FC values were significantly higher, whereas, in the case of the carbohydrates, the tendencies were opposite.
The highest utilization of the carbon substrate groups for the four soils samples (CL, FC, GC, and CE) comes from the amino acids (1.13–2.08 OD590; Figure 3C), whereas, the lowest was the carboxylic acids groups (1.01–1.48 OD590; Figure 3D). In HC, HL, BA(I), and the BA(II), carbohydrates were most utilized (0.64–1.40 OD590; Figure 3E) and the amines and amides were the weakest (0.08–0.48 OD590; Figure 3B). The utilization of the substrates from the polymers group was the highest in the GC, CL, CE, and FC (Figure 3F).
The more detailed observations resulted from the analysis of the metabolism of the individual substrates presented in Figure 4 and the absorbance data was available in Appendix A, Table A1. Two groups of substrates could be clearly distinguished due to their different metabolism in the studied soils. The first group included substrates with metabolism at zero, or close to the zero level, in all soils (OD590 0–0.5). These included 2-Hydroxybenzoic acid, gamma-Hydroxybutyric acid, DL-α-Glycerol phosphate, L-Threonine, and alpha-Ketobutyric acid. The second group represented substrates with utilization that varied, depending on the soil. Most substrates were metabolized at medium to high levels, in soils with pH 5.6 to 7.5, while soils with pH 4.0 to 4.7, and soil with pH 5.4, showed much lower levels of metabolism and total number of utilized substrates.
The calculated Shannon diversity (H′) index ranged from 2.56 to 3.26, in all the samples (Table 4). The highest H′ index characterized the microorganisms’ consortia from the CL sample, with the lowest from BA(I). There was a significant difference between the H′ index calculated for soils with a higher pH value and those calculated for the acidic soils. The H′ index value for sample HL was statistically similar to those of both groups of soils.
The calculated evenness index (E) was maintained at a similar level (0.935–0.995) for all soil microbial communities (Table 4) and the differences between soils were not significant.
Richness index (S) was the highest for microorganisms in soil from CL (28.33), whereas it was lowest for BA(I) (13.67; Table 4). The difference in the value of the S index was significant between the soils with higher pH values (CL, FC, GC and CE) and lower pH values (HC, HL, BA(I), and BA(II)). The values of the indexes H′ and S, from all soil samples, differed significantly (p ≤ 0.05).
To explore the variations in the soil microbial community composition, the following parameters were subjected to PCA (principal component analysis): Bacteria and fungi colony forming units (CFU), calculated AWCD of the whole Biolog® EcoPlate™, as well as the AWCD from the five groups of the substrates, pH, dehydrogenases activity, and diversity indexes calculated from the substrates utilization pattern. The PCA (PCA1 and PCA2) explained 89.52% of variation among the factors and clearly grouped together the soils that had a similar type. The graph showed the correlation between the amount of fungi and soils with an acidic pH, and a low number of bacteria, in these soils. Soils with a higher pH (5.6–7.5) were associated with an increase of values in all studied parameters, including the general level of metabolism (DHs, AWCD120h), as well as the utilization of each substrate groups. Carbohydrates and polymer utilization was positively correlated to the Cambic Leptosol and the Gleyic Chernozem, representing the highest quality soils and having the highest organic carbon, respectively, 11.0 and 21.3 g × kg−1. Dehydrogenases activity which represented the total oxidative microbial metabolism positively correlated to the AWCD120 and the cultivable bacteria number. The higher pH values corresponded with the highest Shannon’s diversity index and the number of positively metabolized substrates (richness index, S).

4. Discussion

Dehydrogenases activity measurement is one of the indicators of the overall condition of soil, which is a very sensitive indicator for environmental changes [38,39]. In our experience we showed that it is a very sensitive parameter, depending on the type of soil, its pH, and physicochemical properties, while the results obtained in the four time-points, over a period of 3 years were comparable, indicating the stability of the soils, in terms of the total microbial metabolism. DHs activity is closely related to the carbon and nitrogen cycles, and the biological oxidation of the soil organic matter (SOM) [40]. As Wolińska and Stępniewska state [41], DHs may indicate the total microbial oxidative metabolism. The DHs activity was strongly correlated with the soil pH (R = 0.87, Figure 5), which was consistent with that found by Januszek et al. [42].
The differences in the level of metabolism and utilization of substrates, in soils, may result from the shifts in the fungi to bacteria ratio, in the case of acidic soils (Brunic Arenosols (BA), Haplic Luvisol (HL), and Haplic Cambisol (HC)). Czaban et al. [43], studying the same soils as in this experiment in June 2007, found that the number of bacterial CFUs was significantly correlated with the soil pH. The bacterial CFU number in the soils with the highest pH (Gleyic Chernozem and Fluvic Cambisol) was six times higher than in the soils with the lowest pH (Brunic Arenosol I and Haplic Cambisol). According to another report, at about pH 4.5, there was a significant decrease in the number of bacteria, in comparison to the fungi and a general activity decline. This effect might have been caused by, among others, the release of free aluminum in the soil, which occurs at about pH 5.0, and the inhibition of plant growth, which decreases the availability of organic root-derived carbon for the bacteria [44]. Other reports have demonstrated that increasing the pH of the soil caused a four- or even five-fold increase in the number of bacteria [45,46]). When the pH is above 4.5, artificially induced changes in the ratio of bacteria to fungi (by using selective inhibitors) had no significant effect on the mineralization of carbon [47], suggesting that these two groups of microorganisms, in the case of this process, have, at least, partially similar and complementary characteristics. Correlations between the dehydrogenases activity in soil and catabolic potential of microorganisms have been demonstrated, which was consistent with the literature [25,48]
The highest level of metabolism can be seen for the Gleyic Chernozem and the Cambic Leptosol, whereas, three samples (the Haplic Luvisol, and the Brunic Arenosol I and II) demonstrated the lowest general catabolism (Figure 3). One should, however, be cautious in interpreting the results from the average of all substrates because when we look at a group of the substrates separately, the image of individual metabolism, for each soil, begins to look slightly different. In the first group, that is, amines and amides (Figure 3B), we can see undisputed division in which the acidic, dystric soils demonstrated significantly lower utilization profiles of substrates. Focusing on Figure 3C, we can see that the result is almost the same, as in the case of the AWCD, for all substrates. Amino acids are significantly less (or slower) metabolized by microorganisms inhabiting a soil with an acidic pH. Probably the pH has a strong effect, since the optimal pH for most redox enzymes is 7.4–8.5 [42]. Another group is the carboxylic acids group (Figure 3D), which also suggests the greater microbial activity of soils, with a pH close to neutral. Nevertheless, the differences here are much smaller between the classes. It should also be noted that the Gleyic Chernozem is not, in this case, represented by the most intensive metabolism. The tendency in this example is not as closely correlated with the soil pH. The most active metabolism profile here was found for the Cambic Leptosol and the Fluvic Cambisol. As in previous studies, the lowest activity was found for the Brunic Arenosol I. Carbohydrates (Figure 3E) did not show such a significant trend. On the contrary, the soil that had a lower activity—Haplic Cambisol—here, presented a metabolism comparable with the Fluvic Cambisol, which showed a below-average level of carbohydrate utilization. This is a very clear example of why, in some cases, the average results for the whole plate may be incorrect. Similarly, the Brunic Arenosol I sample showed polymers metabolism (Figure 3F) comparable to the Fluvic Cambisol and the Cambisol samples. The total number of substrates for which the utilization rate was above the threshold OD590 ≥ 0.25 (S index; Table 3) also divided the samples into significantly differing groups. Each of the more biologically active soils (Cambic Leptosol, Gleyic Chernozem, Fluvic Cambisol and Cambisol) showed the ability to utilize 27 or 28 of the 31 possible substrates, whereas, for three of the acidic soils only 17, 20, and 20 substrates were utilized (Brunic Arenosol II, Haplic Cambisol, Haplic Luvisol, respectively). The weakest catabolism was shown for the Brunic Arenosol I; this soil was characterized as being able to utilize only 14 substrates. Most of the carbon substrates were more intensively utilized in the Cambic Leptosol, Gleyic Chernozem, Fluvic Cambisol, and the Cambisol samples, with a few exceptions (Table 4). For example, in the group of amino acids, L-arginine, and L-asparagine were the most utilized substrates, in these four types of soil, whereas, the metabolism of the other sources was more or less equal in each of the eight soils. The exception was L-phenylalanine, which showed a significantly higher level of utilization in the Haplic Cambisol. An interesting result may be indicated by the almost complete lack of utilization of the three amino acids (L-arginine, L-asparagine, and L-phenylalanine), as well as that of the amines and amides, and over half of the carboxylic acids in the Brunic Arenosol I, which might indicate unfavorable conditions for the growth of microorganisms carrying the enzymes taking part in the metabolic pathway of these compounds. This directly translated to the inability of this soil to maintain proper organic matter cycling and so caused and accumulation of waste and toxic chemicals. Among the group of carboxylic, any of the soil microbiota were able to utilize the γ-hydroxybutyric acid (GHB) and the 2-hydroxybenzoic acid (salicylic acid), at a sufficient level. However, another isomeric form of the salicylic acid, which was 4-hydroxybenzoic acid (PHBA), was utilized at high or medium (acidic soils) levels. The most acidic soils tended to demonstrate the highest catabolism of the monosaccharide β-methyl-D-glucoside, the same tendency could be observed in the glycogen metabolism. Furthermore, the cluster analysis (Figure 5) of the utilization of these 31 substrates divided the samples into two main groups.
By excluding the changing climatic conditions, locations, and agrotechnical treatments, the study focused on comparing the catabolic potential of microorganisms in different soil types. This is important because in research work it has been stated that the microbiological activity of soils is mainly influenced by applied agricultural management and fertilization [49,50,51]. Research by Jesus et al. [52] showed that the type of plant community was a more important driver of soil microbial activity than the soil type. However, our study has shown that the soil type also strongly differentiated between the catabolic activities of the microorganisms. The application of the EcoPlate™ method, in the research conducted by Girvan et al. [10] on agricultural land, divided the communities of soil microorganisms into two groups, correlated with soil type. Similar conclusions were reached by Marschner et al. [53], who concluded that the microbial community composition is affected by a complex interaction between the soil type and plant species.
Initial concerns about the possibility of soils being unified, after more than 130 years, in terms of composition and properties have been disputed. It has been proved that not only the pH, which is the most determining factor of microbial activity in soil, but also the type of soil, is significant.

5. Conclusions

Despite 130 years of cultivation of the same plants, the same agriculture management methods and the same climatic conditions, the biological activity (DHs activity and general catabolism) of different soil types was diversified. The results of the Biolog® Ecoplate™ approach, dehydrogenases activity measurements, as well as historical physiochemical parameter monitoring, suggest that the soils have retained their specificity, after many years. The eutric soils that over a century ago were classified as the best complexes of the agricultural suitability, showed a significantly higher level of utilization of most substrates, a general number of positively utilized substrates (Shannon’s H′ and S’ indexes), and the total number of cultivable bacteria—in contrast to the dystric soils belonging to the lower classes—characterized by low pH values, low organic carbon content, and a significantly lower number of bacteria. The total number of cultivable fungi was determined as a much higher for the dystric (acidic) soils. Gleyic Chernozem, Cambic Leptosol, and the Fluvic Cambisol showed the highest metabolism, both in terms of the total AWCD and the groups of substrates. A statistically significant reduction in metabolism, was observed, for the dystric soils of a poorer quality, such as the Brunic Arenosols, Haplic Cambisol, or the Haplic Luvisol. The activity of the dehydrogenases and the metabolism of microorganisms were mostly influenced by the pH, which was showed by a PCA analysis and the number of cultivable bacteria and fungi.
It can be concluded that the EcoPlate™ method can be used to study the variability of the community-level physiological profiling of microorganisms from different soil types, as statistically significant results have been obtained. Additionally, the results obtained from the EcoPlate™ analysis correlate with the dehydrogenases and pH activity values determined for the analyzed soil samples.

Author Contributions

Conceptualization, J.G. and A.G.; methodology, K.F. and J.G.; software, J.G.; validation, K.F. and A.G.; formal analysis, J.G. and K.F.; investigation, J.G. and K.F. and A.G.; resources, A.G.; data curation, J.G. and K.F.; writing—original draft preparation, K.F. and J.G.; writing—review and editing, K.F. and A.G.; visualization, J.G.; supervision, A.G.; project administration, A.G. and J.G.; funding acquisition, A.G.

Funding

This research was conducted within the statutory activity of the IUNG-PIB (1.20) and the framework of Task 1.4—Evaluation and formation of biodiversity of soil and microbial activity of soil with regard to habitat conditions and management system—Multi-Annual Programme IUNG – PIB 2016-2020.

Conflicts of Interest

The authors declare no conflict of interest.

Appendix A

Table A1. Utilization of the all 31 carbon sources on the EcoPlate™; based on the well color development—OD590—after 120 h incubation. The standard error of the means is given in parentheses (n = 3). σ2—variance values from the one-way ANOVA (P ≤ 0.05). Sample abbreviations: GC—Gleyic Chernozem, FC—Fluvic Cambisol, CL—Cambic Leptosol, CE—Cambisol (Eutric), HL—Haplic Luvisol, HC—Haplic Cambisol (Dystric), BA(I)—Brunic Arenosol (Dystric) I, and BA(II)—Brunic Arenosol (Dystric) II.
EcoPlate™ SubstratesWell Color Development (OD590)σ2
BA(II)CLFCHLGCBA(I)CEHC
β- methyl- D- glucoside2.71
(±0.28)
1.00
(±0.37)
1.26
(±0.67)
1.23
(±0.37)
1.93
(±0.66)
2.68
(±0.26)
1.30
(±1.23)
1.10
(±0.78)
0.49
D- galactonic acid γ- lactone0.56
(±0.50)
1.28
(±0.21)
0.61
(±0.18)
1.11
(±0.32)
0.83
(±0.20)
0.31
(±0.50)
0.98
(±0.33)
0.05
(±0.01)
0.17
L- arginine0.25
(±0.46)
2.59
(±0.88)
2.23
(±0.89)
0.36
(±0.41)
2.80
(±1.29)
0.15
(±0.08)
3.12
(±0.97)
0.23
(±0.20)
1.77
Pyruvic acid methyl ester2.36
(±0.50)
2.17
(±0.80)
1.11
(±0.34)
1.35
(±0.30)
1.51
(±0.58)
0.79
(±0.76)
1.95
(±0.61)
0.96
(±0.42)
0.34
D- xylose0.23
(±0.09)
2.28
(±0.54)
0.65
(±0.09)
0.22
(±0.08)
0.84
(±0.45)
0.29
(±0.03)
0.60
(±0.62)
0.64
(±0.53)
0.45
D- galacturonic acid0.40
(±0.09)
2.23
(±0.13)
1.03
(±0.27)
0.32
(±0.17)
2.37
(±0.75)
0.21
(±0.05)
1.90
(±0.95)
0.44
(±0.28)
0.84
L- asparagine0.43
(±0.13)
3.04
(±0.03)
2.74
(±0.64)
0.86
(±0.83)
3.43
(±0.25)
0.21
(±0.14)
3.06
(±0.18)
0.27
(±0.08)
2.04
Tween 400.93
(±0.79)
2.62
(±0.53)
2.09
(±0.67)
0.51
(±0.18)
2.43
(±0.39)
0.51
(±0.21)
2.33
(±0.94)
0.41
(±0.04)
0.95
i- erythritol0.29
(±0.10)
1.52
(±0.64)
0.59
(±0.10)
0.30
(±0.08)
1.72
(±0.25)
0.27
(±0.09)
0.83
(±0.19)
0.19
(±0.12)
0.36
2- hydroxy benzoic acid0.07
(±0.04)
0.25
(±0.19)
0.03
(±0.01)
0.15
(±0.04)
0.04
(±0.02)
0.07
(±0.02)
0.17
(±0.07)
0.11
(±0.03)
0.01
L- phenylalanine3.03
(±0.37)
1.36
(±0.61)
0.72
(±0.62)
0.70
(±0.14)
1.50
(±0.45)
0.19
(±0.19)
0.55
(±0.33)
1.14
(±1.70)
0.77
Tween 800.40
(±1.40)
3.00
(±0.19)
2.17
(±0.30)
0.44
(±0.31)
2.40
(±0.19)
0.51
(±1.47)
2.81
(±0.71)
0.49
(±0.45)
1.36
D- mannitol2.78
(±0.09)
2.92
(±0.19)
2.05
(±0.38)
1.81
(±0.89)
3.12
(±0.38)
3.19
(±0.41)
1.88
(±0.19)
1.10
(±0.71)
0.57
4- hydroxy benzoic acid1.10
(±1.60)
1.99
(±0.49)
0.99
(±0.65)
0.80
(±1.05)
2.19
(±0.89)
0.11
(±0.05)
1.73
(±0.95)
0.03
(±0.03)
0.66
L- serine0.34
(±0.08)
2.70
(±0.62)
1.77
(±0.45)
1.05
(±0.92)
2.77
(±1.45)
0.17
(±0.09)
2.34
(±0.25)
0.33
(±0.20)
1.21
α- cyclodextrin1.04
(±1.28)
2.28
(±0.29)
1.65
(±0.66)
0.69
(±1.18)
2.51
(±0.46)
0.95
(±1.59)
0.16
(±0.27)
0.03
(±0.02)
0.84
N- acetyl-D- glucosamine1.60
(±1.37)
1.84
(±0.12)
1.84
(±0.41)
0.39
(±0.35)
3.22
(±0.06)
0.27
(±0.10)
2.01
(±0.29)
0.37
(±0.22)
1.06
γ- hydroxybutyric acid0.03
(±0.04)
0.08
(±0.07)
0.10
(±0.12)
0.05
(±0.12)
0.12
(±0.16)
0.04
(±0.03)
0.04
(±0.07)
0.07
(±0.08)
0.00
L- threonine0.29
(±0.15)
0.62
(±0.08)
0.51
(±0.39)
0.63
(±0.35)
0.68
(±0.41)
0.30
(±0.33)
0.40
(±0.03)
0.48
(±0.29)
0.02
Glycogen2.72
(±0.27)
1.70
(±0.70)
1.22
(±0.38)
0.42
(±0.47)
2.11
(±0.66)
2.96
(±0.46)
2.12
(±0.71)
1.36
(±1.51)
0.69
D- glucosaminic acid2.32
(±0.95)
2.09
(±0.45)
1.92
(±0.41)
2.04
(±0.73)
2.23
(±0.74)
0.60
(±0.79)
2.57
(±0.49)
2.11
(±1.17)
0.35
Itaconic acid0.04
(±1.73)
2.41
(±0.58)
1.91
(±0.63)
0.03
(±0.55)
0.43
(±1.17)
0.01
(±1.41)
1.68
(±1.22)
0.05
(±0.16)
1.02
Glycyl-L- glutamic acid0.71
(±0.90)
1.76
(±0.27)
0.61
(±0.21)
0.78
(±0.62)
1.62
(±0.67)
0.30
(±0.10)
1.44
(±0.61)
0.42
(±0.08)
0.32
D- cellobiose1.56
(±0.86)
1.75
(±0.59)
1.17
(±0.27)
1.42
(±1.00)
2.65
(±0.10)
1.31
(±0.59)
1.98
(±0.10)
0.51
(±0.45)
0.39
Glucose-1- phosphate0.02
(±0.03)
1.38
(±0.05)
0.49
(±0.21)
0.00
(±0.00)
1.71
(±0.40)
0.02
(±0.01)
1.14
(±0.16)
0.57
(±0.99)
0.45
α- ketobutyric acid0.56
(±0.24)
0.34
(±0.08)
0.28
(±0.07)
0.36
(±0.08)
0.14
(±0.07)
0.02
(±0.00)
0.32
(±0.01)
0.46
(±0.12)
0.03
Phenylethylamine0.17
(±0.23)
1.81
(±0.34)
1.48
(±0.65)
0.16
(±0.10)
2.43
(±1.66)
0.08
(±0.05)
1.66
(±1.02)
0.05
(±0.05)
0.93
α-D- lactose2.32
(±0.61)
2.57
(±0.27)
1.35
(±0.05)
1.15
(±0.37)
2.54
(±0.94)
2.11
(±0.27)
2.05
(±0.72)
0.70
(±0.28)
0.48
D,L- α-glycerol phosphate0.02
(±0.01)
0.04
(±0.06)
0.10
(±0.14)
0.02
(±0.03)
0.02
(±0.00)
0.03
(±0.01)
0.02
(±0.03)
0.24
(±0.39)
0.01
D- malic acid0.35
(±0.06)
1.91
(±0.24)
0.99
(±0.80)
0.83
(±0.56)
1.02
(±0.65)
0.18
(±0.10)
1.70
(±0.83)
0.56
(±0.71)
0.37
Putrescine0.08
(±0.03)
1.11
(±0.14)
0.80
(±0.16)
0.81
(±0.85)
1.73
(±0.18)
0.16
(±0.01)
0.82
(±0.46)
0.12
(±0.04)
0.33

References

  1. Doran, J.W.; Zeiss, M.R. Soil health and sustainability: managing the biotic component of soil quality. Appl. Soil Ecol. 2000, 15, 3–11. [Google Scholar] [CrossRef] [Green Version]
  2. Nannipieri, P.; Ascher, J.; Ceccherini, M.T.; Landi, L.; Pietramellara, G.; Renella, G. Microbial diversity and soil functions. Eur. J. Soil Sci. 2003, 54, 655–670. [Google Scholar] [CrossRef] [Green Version]
  3. Lehman, R.; Cambardella, C.; Stott, D.; Acosta-Martinez, V.; Manter, D.; Buyer, J.; Maul, J.; Smith, J.; Collins, H.; Halvorson, J.; et al. Understanding and Enhancing Soil Biological Health: The Solution for Reversing Soil Degradation. Sustainability 2015, 7, 988–1027. [Google Scholar] [CrossRef] [Green Version]
  4. Kennedy, A.C.; Smith, K.L. Soil microbial diversity and the sustainability of agricultural soils. Plant Soil 1995, 170, 75–86. [Google Scholar] [CrossRef]
  5. Sessitsch, A.; Weilharter, A.; Gerzabek, M.H.; Kirchmann, H.; Kandeler, E. Microbial population structures in soil particle size fractions of a long-term fertilizer field experiment. Appl. Environ. Microbiol. 2001, 67, 4215–4224. [Google Scholar] [CrossRef] [PubMed]
  6. Hooper, D.U.; Chapin, F.S.; Ewel, J.J.; Hector, A.; Inchausti, P.; Lavorel, S.; Lawton, J.H.; Lodge, D.M.; Loreau, M.; Naeem, S.; et al. Effects of biodiversity on ecosystem functioning: A consensus of current knowledge. Ecol. Monogr. 2005, 75, 3–35. [Google Scholar] [CrossRef]
  7. Latour, X.; Philippot, L.; Corberand, T.; Lemanceau, P. The establishment of an introduced community of fluorescent pseudomonads in the soil and in the rhizosphere is affected by the soil type. FEMS Microbiol. Ecol. 1999, 30, 163–170. [Google Scholar] [CrossRef] [Green Version]
  8. Chau, J.F.; Bagtzoglou, A.C.; Willig, M.R. The Effect of Soil Texture on Richness and Diversity of Bacterial Communities. Environ. Forensics 2011, 12, 333–341. [Google Scholar] [CrossRef]
  9. Schreiter, S.; Ding, G.C.; Heuer, H.; Neumann, G.; Sandmann, M.; Grosch, R.; Kropf, S.; Smalla, K. Effect of the soil type on the microbiome in the rhizosphere of field-grown lettuce. Front. Microbiol. 2014, 5. [Google Scholar] [CrossRef] [Green Version]
  10. Girvan, M.S.; Bullimore, J.; Pretty, J.N.; Osborn, A.M.; Ball, A.S. Soil Type Is the Primary Determinant of the Composition of the Total and Active Bacterial Communities in Arable Soils. Appl. Environ. Microbiol. 2003, 69, 1800–1809. [Google Scholar] [CrossRef] [Green Version]
  11. Langille, M.; Zaneveld, J.; Caporaso, J.G.; McDonald, D.; Knights, D.; Reyes, J.; Clemente, J.; Burkepile, D.; Vega Thurber, R.; Knight, R.; et al. Predictive functional profiling of microbial communities using 16S rRNA marker gene sequences. Nat. Biotechnol. 2013, 31, 814–821. [Google Scholar] [CrossRef] [PubMed] [Green Version]
  12. Garland, J.L.; Mills, A.L. Classification and characterization of heterotrophic microbial communities on the basis of patterns of community-level sole-carbon-source utilization. Appl. Environ. Microbiol. 1991, 57, 2351–2359. [Google Scholar] [PubMed]
  13. Kuźniar, A.; Banach, A.; Stępniewska, Z.; Frąc, M.; Oszust, K.; Gryta, A.; Kłos, M.; Wolińska, A. Community-level physiological profiles of microorganisms inhabiting soil contaminated with heavy metals. Int. Agrophysics 2018, 32, 101–109. [Google Scholar] [CrossRef] [Green Version]
  14. Lv, T.; Zhang, Y.; Carvalho, P.N.; Zhang, L.; Button, M.; Arias, C.A.; Weber, K.P.; Brix, H. Microbial community metabolic function in constructed wetland mesocosms treating the pesticides imazalil and tebuconazole. Ecol. Eng. 2017, 98, 378–387. [Google Scholar] [CrossRef]
  15. Chou, Y.M.; Shen, F.T.; Chiang, S.C.; Chang, C.M. Functional diversity and dominant populations of bacteria in banana plantation soils as influenced by long-term organic and conventional farming. Appl. Soil Ecol. 2017, 110, 21–33. [Google Scholar] [CrossRef]
  16. Furtak, K.; Gawryjołek, G.; Gajda, A.M.; Gałązka, A. Effects of maize and winter wheat grown under different cultivation techniques on biological activity of soil. Plant Soil Environ. 2017, 63, 449–454. [Google Scholar] [Green Version]
  17. Li, G.; Kim, S.; Park, M.; Son, Y. Short-Term Effects of Experimental Warming and Precipitation Manipulation on Soil Microbial Biomass C and N, Community Substrate Utilization Patterns and Community Composition. Pedosphere 2017, 27, 714–724. [Google Scholar] [CrossRef]
  18. Ros, M.; Goberna, M.; Pascual, J.A.; Klammer, S.; Insam, H. 16S rDNA analysis reveals low microbial diversity in community level physiological profile assays. J. Microbiol. Methods 2008, 72, 221–226. [Google Scholar] [CrossRef]
  19. Lladó, S.; Baldrian, P. Community-level physiological profiling analyses show potential to identify the copiotrophic bacteria present in soil environments. PLoS ONE 2017, 12. [Google Scholar] [CrossRef]
  20. Huang, X.P.; Mo, C.H.; Yu, J.; Zhao, H.M.; Meng, C.; Li, Y.W.; Li, H.; Cai, Q.Y.; Wong, M.H. Variations in microbial community and ciprofloxacin removal in rhizospheric soils between two cultivars of Brassica parachinensis L. Sci. Total Environ. 2017, 603–604, 66–76. [Google Scholar] [CrossRef]
  21. Jin, X.; Ma, Y.; Kong, Z.; Kou, W.; Wu, L. The Variation of Sediment Bacterial Community in Response to Anthropogenic Disturbances of Poyang Lake, China. Wetlands 2017, 1–11. [Google Scholar] [CrossRef]
  22. Narayanamurthy, V.; Sweetnam, J.M.; Denner, D.R.; Chen, L.W.; Naureckas, E.T.; Laxman, B.; White, S.R. The metabolic footprint of the airway bacterial community in cystic fibrosis. Microbiome 2017, 5, 67. [Google Scholar] [CrossRef] [PubMed]
  23. Pino-Otín, M.R.; Muñiz, S.; Val, J.; Navarro, E. Effects of 18 pharmaceuticals on the physiological diversity of edaphic microorganisms. Sci. Total Environ. 2017, 595, 441–450. [Google Scholar] [CrossRef] [PubMed]
  24. Cardozo, F.M., Jr.; Carneiro, R.F.V.; Rocha, S.M.B.; Nunes, L.A.P.L.; dos Santos, V.M.; de Lima Feitoza, L.; de Araújo, A.S.F. The Impact of Pasture Systems on Soil Microbial Biomass and Community-level Physiological Profiles. L. Degrad. Dev. 2018, 29, 284–291. [Google Scholar] [CrossRef]
  25. Gałązka, A.; Gawryjołek, K.; Grządziel, J.; Frąc, M.; Księżak, J. Microbial community diversity and the interaction of soil under maize growth in different cultivation techniques. Plant Soil Environ. 2017, 63, 264–270. [Google Scholar] [Green Version]
  26. Siebielec, G.; Siebielec, S.; Podolska, G. Comparison of microbial and chemical characteristics of soil types after over 100 years of cereal production. Polish J. Agron. 2015, 23, 88–100. [Google Scholar]
  27. Wallace, R.H.; Lochhead, A.G. Qualitative Studies of Soil Microorganisms: IX. Amino acid requirements of rhisosphere bacteria. Can. J. Res. 1950, 28c, 1–6. [Google Scholar] [CrossRef]
  28. Martin, J.P. Use of acid, rose bengal, and streptomycin in the plate method for estimating soil fungi. Soil Sci. 1950. [Google Scholar] [CrossRef]
  29. Casida, L.E., Jr.; Klein, D.A.; Santoro, T. Soil dehydrogenase activity. Soil Sci. 1964, 98, 371–376. [Google Scholar] [CrossRef]
  30. Insam, H. A New Set of Substrates Proposed for Community Characterization in Environmental Samples. In Microbial Communities; Springer: Berlin/Heidelberg, Germany, 1997; pp. 259–260. [Google Scholar]
  31. Weber, K.P.; Legge, R.L. Community-Level Physiological Profiling. In Bioremediation: Methods and Protocols; Cummings, S.P., Ed.; Humana Press: Totowa, NJ, USA, 2010; ISBN 978-1-60761-439-5. [Google Scholar]
  32. Preston-Mafham, J.; Boddy, L.; Randerson, P.F. Analysis of microbial community functional diversity using sole-carbon-source utilisation profiles—A critique. FEMS Microbiol. Ecol. 2002, 42, 1–4. [Google Scholar]
  33. Garland, J.L. Analysis and interpretation of community-level physiological profiles in microbial ecology. FEMS Microbiol. Ecol. 1997, 24, 289–300. [Google Scholar] [CrossRef]
  34. Hill, T.C.J.; Walsh, K.A.; Harris, J.A.; Moffett, B.F. Using ecological diversity measures with bacterial communities. FEMS Microbiol. Ecol. 2003, 43, 1–11. [Google Scholar] [CrossRef] [PubMed] [Green Version]
  35. Zak, J.; Willig, M.; Moorhead, D.; Wildman, H. Functional diversity of microbial communities: A quantitative approach. Soil Biol. Biochem. 1994, 26, 1101–1108. [Google Scholar] [CrossRef]
  36. Jalowiecki, L.; Chojniak, J.M.; Dorgeloh, E.; Hegedusova, B.; Ejhed, H.; Magner, J.; Plaza, G.A. Microbial Community Profiles in Wastewaters from Onsite Wastewater Treatment Systems Technology. PLoS ONE 2016, 11, e0147725. [Google Scholar] [CrossRef] [PubMed]
  37. Grządziel, J. Functional redundancy of soil microbiota – Does more always mean better? Polish J. Soil Sci. 2017, 50. [Google Scholar] [CrossRef]
  38. Bastida, F.; Kandeler, E.; Moreno, J.L.; Ros, M.; Garcı, C. Application of fresh and composted organic wastes modifies structure, size and activity of soil microbial community under semiarid climate. Appl. Soil Ecol. 2008, 40, 318–329. [Google Scholar] [CrossRef]
  39. Gałązka, A.; Gawryjołek, K.; Grządziel, J.; Księżak, J. Effect of different agricultural management practices on soil biological parameters including glomalin fraction. Plant Soil Environ. 2017, 63, 300–306. [Google Scholar] [Green Version]
  40. Gruba, P.; Błońska, E.; Lasota, J.; Gruba, P. Effect of temperate forest tree species on soil dehydrogenase and urease activities in relation to other properties of soil derived from loess and glaciofluvial sand. Ecol. Res. 2016, 31, 655–664. [Google Scholar] [Green Version]
  41. Wolińska, A.; Stępniewska, Z. Dehydrogenase Activity in the Soil Environment. In Dehydrogenases; Canuto, R.A., Ed.; IntechOpen: Rijeka, Croatia, 2012. [Google Scholar] [Green Version]
  42. Januszek, K.; Błońska, E.; Długa, J.; Socha, J. Dehydrogenase activity of forest soils depends on the assay used. Int. Agrophysics 2015, 29, 47–59. [Google Scholar] [CrossRef] [Green Version]
  43. Czaban, J.; Wróblewska, B.; Niedźwiecki, J.; Sułek, A. Relationships between numbers of microbial communities in Polish agricultural soils and properties of these soils, paying special attention to xerophilic/xerotolerant fungi. Polish J. Environ. Stud. 2010, 19, 1171–1183. [Google Scholar]
  44. Aciego Pietri, J.C.; Brookes, P.C. Relationships between soil pH and microbial properties in a UK arable soil. Soil Biol. Biochem. 2008, 40, 1856–1861. [Google Scholar] [CrossRef]
  45. Bååth, E.; Arnebrant, K. Growth rate and response of bacterial communities to pH in limed and ash treated forest soils. Soil Biol. Biochem. 1994, 26, 995–1001. [Google Scholar] [CrossRef]
  46. Bååth, E. Growth rates of bacterial communities in soils at varying pH: A comparison of the thymidine and leucine incorporation techniques. Microb. Ecol. 1998, 36, 316–327. [Google Scholar] [CrossRef] [PubMed]
  47. Rousk, J.; Brookes, P.C.; Bååth, E. Contrasting Soil pH Effects on Fungal and Bacterial Growth Suggest Functional Redundancy in Carbon Mineralization. Appl. Environ. Microbiol. 2009, 75, 1589–1596. [Google Scholar] [CrossRef] [PubMed] [Green Version]
  48. Adams, T.; Brye, K.; Savin, M.; Lee, J.; Gbur, E. Microbial Carbon Substrate Utilization Differences among High- and Average-Yield Soybean Areas. Agriculture 2017, 7, 48. [Google Scholar] [CrossRef]
  49. Tautges, N.E.; Sullivan, T.S.; Reardon, C.L.; Burke, I.C. Soil microbial diversity and activity linked to crop yield and quality in a dryland organic wheat production system. Appl. Soil Ecol. 2016, 108, 258–268. [Google Scholar] [CrossRef]
  50. Soman, C.; Li, D.; Wander, M.M.; Kent, A.D. Long-term fertilizer and crop-rotation treatments differentially affect soil bacterial community structure. Plant Soil 2017, 413, 145–159. [Google Scholar] [CrossRef]
  51. Wolinska, A.; Frąc, M.; Oszust, K.; Szafranek-Nakonieczna, A.; Zielenkiewicz, U.; Stępniewska, Z. Microbial biodiversity of meadows under different modes of land use: catabolic and genetic fingerprinting. World J. Microbiol. Biotechnol. 2017, 33. [Google Scholar] [CrossRef] [Green Version]
  52. Jesus, E.d.S.; Liang, C.; Quensen, J.F.; Susilawati, E.; Jackson, R.D.; Balser, T.C.; Tiedje, J.M. Influence of corn, switchgrass, and prairie cropping systems on soil microbial communities in the upper Midwest of the United States. GCB Bioenergy 2016, 8, 481–494. [Google Scholar] [CrossRef]
  53. Marschner, P.; Yang, C.-H.; Lieberei, R.; Crowley, D. Soil and plant specific effects on bacterial community composition in the rhizosphere. Soil Biol. Biochem. 2001, 33, 1437–1445. [Google Scholar] [CrossRef]
Figure 1. Dehydrogenases (DHs) activity. Different letters (ae) indicate significant differences (p ≤ 0.05, n = 4) by Tukey’s HSD test. Sample abbreviations: GC—Gleyic Chernozem, FC—Fluvic Cambisol, CL—Cambic Leptosol, CE—Cambisol (Eutric), HL—Haplic Luvisol, HC—Haplic Cambisol (Dystric), BA(I)—Brunic Arenosol (Dystric) I, BA(II)—Brunic Arenosol (Dystric) II.
Sustainability 11 00056 g001
Figure 2. Dynamics of the average well color development (AWCD) index of soil samples during the incubation time. Sample abbreviations: GC—Gleyic Chernozem, FC—Fluvic Cambisol, CL—Cambic Leptosol, CE—Cambisol (Eutric), HL—Haplic Luvisol, HC—Haplic Cambisol (Dystric), BA(I)—Brunic Arenosol (Dystric) I, and BA(II)—Brunic Arenosol (Dystric) II.
Sustainability 11 00056 g002
Figure 3. The AWCD of substrates after 120 h in the EcoPlate™ assay: (A) AWCD for 31 substrates; (BF) AWCD for the five groups of substrates, separately. Different letters (AE) indicate significant differences (p ≤ 0.05, n = 3) by Tukey’s HSD test. Sample abbreviations: GC—Gleyic Chernozem, FC—Fluvic Cambisol, CL—Cambic Leptosol, CE—Cambisol (Eutric), HL—Haplic Luvisol, HC—Haplic Cambisol (Dystric), BA(I)—Brunic Arenosol (Dystric) I, and BA(II)—Brunic Arenosol (Dystric) II.
Sustainability 11 00056 g003
Figure 4. Biolog® EcoPlate™ substrates utilization (absorbance at 590 nm) after 120 h of incubation. The lack of utilization is represented by a dark gray color, the absorbance from 0.5 to the maximum value, considered as positive, is represented by the gradient from light yellow to red. Soil types are represented by abbreviations: GC—Gleyic Chernozem, FC—Fluvic Cambisol, CL—Cambic Leptosol, CE—Cambisol (Eutric), HL—Haplic Luvisol, HC—Haplic Cambisol (Dystric), BA(I)—Brunic Arenosol (Dystric) I, and BA(II)—Brunic Arenosol (Dystric) II. Substrates are divided into five groups, indicated by the different colors (the most top legend). The pH of each soil is indicated as the gradient color from red (most acidic) to green.
Sustainability 11 00056 g004
Figure 5. Principal component analysis (PCA). Richness (S′) index, Shannon diversity (H′) index, and average well color development (AWCD_120) index, after 120 h incubation of the EcoPlate™, AWCD index calculated for the five groups of substrates, after 120 h of incubation, dehydrogenases activity (DHs), bacteria, and fungi colony forming units (CFU). Different colors indicate pH groups (figure’s first part) or groups of parameters (second part), accordingly: Green—CFU counts of bacteria and fungi, red—pH, organic carbon and dehydrogenases activity, yellow—Biolog® AWCD index, blue—diversity indexes calculated on the basis of the substrates utilization.
Sustainability 11 00056 g005
Table 1. Characteristic and systematic data of soil samples used in the experiment (according to Siebielec et al. 2015) [26].
Soil TypeSoil Texture Group 1pH (in H2O)Corg.
(g kg−1 soil)
Bacteria 109 CFU g−1 soil [27]Fungi
105 CFU g−1 soil [28]
GCSL7.421.30.38 ± 0.06 b1.16 ± 0.05 bcd
FCSL7.58.200.28 ± 0.20 a 0.45 ± 0.29 d
CLSL7.311.000.36 ± 0.02 bc0.70 ± 0.00 cd
CESL5.67.670.22 ± 0.01 bcd0.46 ± 0.29 d
HLLS5.46.870.04 ± 0.00 d0.88 ± 0.26 bcd
BA(I)LS4.75.270.23 ± 0.01 bcd1.54 ± 0.12 bc
HCS4.57.530.06 ± 0.01 cd1.67 ± 0.42 b
BA(II)LS4.04.570.06 ± 0.01 cd3.04 ± 0.21 a
1 According to the USDA classification (SL = sandy loam, LS = loamy sand, S = sand), Sample abbreviations: GC—Gleyic Chernozem, FC—Fluvic Cambisol, CL—Cambic Leptosol, CE—Cambisol (Eutric), HL—Haplic Luvisol, HC—Haplic Cambisol (Dystric), BA(I)—Brunic Arenosol (Dystric) I, BA(II)—Brunic Arenosol (Dystric) II. Enumeration of bacterial and fungal CFU was prepared according to the protocols stated in References.
Table 2. Monthly mean air temperature and total precipitation at Puławy in 2015–2016.
Temperature (°C)Precipitation (mm)
Month2015201620152016
I1.3–3.355.333.0
II1.03.79.964.5
III5.14.345.853.0
IV8.69.628.538.4
V13.515.6111.672.2
VI17.919.832.027.9
VII20.420.155.486.6
VIII22.618.73.641.9
IX15.315.6126.020.6
X7.07.730.0100.2
XI5.23.247.444.9
XII4.00.825.264.6
Year10.29.7570.7647.8
Table 3. Formulae for the indices calculation.
IndexFormulaDefinitionReference
AWCD AWCD = ( C R ) / n C—reading of the well OD;
R—reading of the control well OD;
n—the number of substrates on an EcoPlate™ (31)
[12]
Shannon diversity (H′) H = i = 1 N p i ( ln p i ) pi—proportional color development of the well over the total color development of all wells of a plate;
N—the number of substrates on an EcoPlate™ (31)
[34]
Shannon evenness (E)E = H′/lnSS—the number of wells with color development
(substrate utilization richness)
[35]
Richness (S)Numbers of utilized substrates with
OD590 ≥ 0.25
[36]
Table 4. Microbial catabolic diversity indexes calculated for the data obtained from the EcoPlate™. H′—Shannon diversity index, E—Shannon evenness index, S—substrate richness index. The standard error of the means is given in parentheses (n = 3). Different letters (ad) in the same columns indicate significant results (Tukey’s HSD test, p ≤ 0.05, n = 3). The sample abbreviations are explained in Table 1.
SampleH′ES
CL3.266 (±0.010) b0.977 (±0.006) a28.333 (±0.577) c
GC3.198 (±0.019) ab0.967 (±0.012) a27.333 (±0.577) ac
FC3.188 (±0.027) ab0.964 (±0.015) a27.333 (±1.155) ac
CE3.155 (±0.014) ab0.957 (±0.004) a27.000 (±0.000) ac
HL2.971 (±0.072) ad0.983 (±0.020) a20.667 (±2.887) ab
HC2.814 (±0.014) cd0.935 (±0.027) a20.333 (±1.528) ab
BA(II)2.786 (±0.209) cd0.995 (±0.032) a17.000 (±5.196) b
BA(I)2.565 (±0.152) c0.992 (±0.056) a13.667 (±3.215) b

