Performance Assessment of Algorithms for Building Energy Optimization Problems with Different Properties

1
School of Architecture, Southeast University, Nanjing 210096, China
2
Department of Architecture and Civil Engineering, City University of Hong Kong, Hong Kong, China
*
Author to whom correspondence should be addressed.
Sustainability 2019, 11(1), 18; https://doi.org/10.3390/su11010018
Submission received: 21 November 2018
/
Revised: 18 December 2018
/
Accepted: 18 December 2018
/
Published: 20 December 2018
(This article belongs to the Section Energy Sustainability)
Abstract
:Assessing the performance of algorithms in solving building energy optimization (BEO) problems with different properties is essential for selecting appropriate algorithms to achieve the best design solution. This study begins with a classification of the properties of BEO problems from three perspectives, namely, design variables, objective functions, and constraints. An analytical approach and a numerical approach are proposed to determine the properties of BEO problems. Six BEO test problems with different properties, namely, continuous vs. discrete, convex vs. non-convex, linear vs. non-linear, uni-modal vs. multimodal, and single-dimensional vs. multi-dimensional, are composed to evaluate the performance of algorithms. The selected optimization algorithms for performance assessment include the discrete Armijo gradient, Particle Swarm Optimization (PSO), Hooke-Jeeves, and hybrid PSO and Hooke-Jeeves. The assessment results indicate that multimodality can cause Hooke-Jeeves and discrete Armijo gradient algorithms to fall into local optima traps. The convex, non-convex, linear and non-linear properties of uni-modal BEO problems have little impact on the performance behavior of the algorithms. The discrete Armijo gradient and Hooke-Jeeves are not recommended for solving discrete and multi-dimensional BEO problems.
1. Introduction
1.1. Background
The global energy consumption has increased significantly due to population growth and industrial development in recent years. In particular, residential and commercial buildings account for approximately 30%–40% of global energy consumption and about 39% of the total CO2 emissions [1]. As a result, energy-efficient design of buildings has become mainstream among governments, developers, architects, engineers, and other stakeholders [2].
The conventional building energy design methodology is essentially a “trial-and-error” approach. The designer (an architect or engineer) generates a design, evaluates its energy performance, and revises the design based on the evaluation results. The process is iterated until the design meets certain requirements. The effectiveness and efficiency of this approach are largely dependent on the complexity of the design problem and the technical competence of the designer. In view of the limitations of manually adjusting designs, building energy optimization (BEO), a new technique that can automatically adjust designs, has emerged [3]. It combines optimization techniques with building energy simulation tools and relies on optimization algorithms to create new designs according to pre-defined optimization objectives and simulation results [4]. Thus, optimization algorithms are the key to the BEO workflow, and the effectiveness and efficiency of this technique significantly depend on the performance of the algorithms.
There are various algorithms for solving optimization problems in many science and engineering fields. The optimization algorithms commonly used in BEO can be generally divided into three groups, namely, hybrid algorithms, direct search algorithms and heuristic algorithms [5]. As shown in some reviews [6,7,8], evolutionary algorithms are the most popular algorithms, accounting for about 60%. The genetic algorithm (GA) [9] and its variations such as the non-dominated sorting genetic algorithm II (NSGA-II) [10] are typical examples of evolutionary algorithms. The Hooke-Jeeves algorithm [11] is a representative of direct search algorithms. A hybrid algorithm [12] is an algorithm that combines two or more other algorithms into a hybrid operation so that the overall algorithm performs better than the individual ones.
Although a number of algorithms are currently used in BEO, their performance, i.e., in terms of effectiveness and efficiency, can vary and at times significantly. The reasons for the difference in performance of algorithms are two-fold. First, BEO problems have different properties, e.g., linear or non-linear, single-dimensional or multi-dimensional, uni-modal or multimodal, etc. Second, the performance of a particular algorithm is closely linked with the properties of the BEO problem to be solved. Hence, analyzing and understanding the properties of a specific BEO problem is a prerequisite for selecting the proper solution algorithm. Furthermore, assessment of the performance of a certain algorithm must consider the properties of the BEO problem to be solved.
This study aims to assess the performance of algorithms for BEO problems with different properties. The reasons why this study is both timely and valuable are multi-folds. Firstly, the properties of BEO problems are essential to the performance of algorithms. Secondly, current research on the properties of BEO problems and assessment of algorithms performance is insufficient [2]. Although certain existing works have been published in non-architectural fields [13,14,15,16], however, whether these findings apply to BEO problems is still unclear, and few studies have shed light on this topic. In general, this study will deepen understanding of the performance of algorithms used in BEO and benefit the selection of proper algorithms for a given BEO problem.
1.2. Literature Review
In relation to the optimization algorithms used in BEO, three types of studies can be found:
- Exclusively focus on the algorithms’ performance in solving BEO problems. Based on our recently published review [2], only a few researchers have paid close attention to such topics [4,17,18]. However, in this sector, research studies that focus on the properties of BEO problems are seriously scarce.
- Use of existing or improved algorithms to solve specific BEO problems without exploring their effectiveness and efficiency. Such studies are the major portion of this body of literature, and many algorithms have been used in optimization of the energy generation, building envelope and systems [6]. Such studies can be found in [19,20,21,22].
- Experimental design for the control parameter settings in algorithms. The performance of algorithms is dependent on the settings of their control parameters. Development of a helpful method for setting the appropriate algorithm parameters is one of the most demanding and important areas of research in BEO especially for expensive computational optimization problems. Few works have examined this topic [23,24,25]. In this study, we do not focus on this topic.
1.3. Research Outline
The outline of this paper is as follows:
- Classification of the properties of BEO problems.
- Proposal of two approaches to analyze the properties of BEO problems.
- Development of six BEO test problems with different properties for the performance evaluation of algorithms.
- Assessment of the performance of the four chosen algorithms in solving the test problems using the indices proposed in our previous work [4].
Section 2 describes the methodology of assessing the performance of optimization algorithms for BEO problems with specific properties, including classification of the properties of BEO problems, two approaches used to determine the properties of BEO problems, six BEO test problems with different properties and description of the four selected optimization algorithms. Section 3 presents the evaluation results. Section 4 summarizes the paper. Section 5 suggests a few related studies for future research.
2. Methodology
2.1. Classification of the Properties of BEO Problems
To select the correct optimization algorithm for a specific BEO problem, the first task of the designer is to investigate the properties involved in the problem. The properties of BEO problems are various and can be generally classified into three basic schemes, namely, objective functions, design variables, and constraints. Figure 1 summarizes the properties of BEO problems that are adopted and modified from Nguyen et al. [7] and Rao [16]. This categorization offers an important foundation for development of new optimization approaches and selection of proper algorithms for different BEO problems as well. Each classification scheme and their categories are briefly discussed below.
2.1.1. Design Variables
To design energy-efficient buildings, lots of variables must be considered. According to the number of variables to be optimized, BEO problems can be single-dimensional or multi-dimensional. A BEO problem can be viewed as dynamic or static if the design variables are continuous functions of or are independent of time, respectively. If the design variables have no uncertainty, the BEO problem can be stated as deterministic. In contrast, problems in which all design variables are described by random or probabilistic variables within a given range are defined as probabilistic [26]. According to the type of permitted values, design variables can be categorized as discrete (taking on only discrete or integer values), continuous (taking on any real value within a range), and hybrid. For example, the number of floors must be an integer that is greater than zero. The decision variable of the ventilation scheme should be either 0 or 1, modeling a yes or no decision, respectively. Variables such as size and ratio are generally continuous in that any two adjacent values can take on infinite segmentation. In particular, in real-world BEO problems, analysts often must address problems with hybrid types of variables, which is known as the “mixed-integer programming” problem [27]. Variable dependence occurs when a variable is a function of other variables, which is often observed in real-world BEO problems and has the impact on constraining the solution space.
2.1.2. Objective Functions
Objective functions are criteria for comparison of different alternative designs to select the best option. A problem that involves only one criterion expressed as an objective function is referred as single-objective problem, whereas a multi-objective problem involves multiple objective functions. According to the properties of the expressions, the objective function of a BEO problem can be classified as quantitative and qualitative, computationally expensive and inexpensive, linear and non-linear, continuous and discontinuous, uni-modal and multimodal, differentiable and non-differentiable, convex and non-convex. Quantitative objective functions can be calculated via statistical, mathematical or computational techniques. All BEO problems lie within this branch. In contrast, qualitative objective functions involve issues that are descriptive, subjective or difficult to measure, such as architectural aesthetics. Addressing computationally expensive objective functions is one of the key challenges faced by the BEO technique. Typically, simulation-based models that require plenty of time to assess can cause the overall optimization workflow to become infeasible [28]. According to the number of local optima for a problem, a BEO problem can be classified as uni-modal or multi-modal. Multi-modality poses one significant difficulty for certain algorithms in converging to the global optimum because they might fail to jump from local optima traps. Furthermore, in BEO, discrete or integer values must be assigned to design variables at times, which can cause the objective function to become disordered and discontinuous [29]. It is worth mentioning that convex functions are significant in the study of BEO problems because they have several distinctive properties. For instance, there exist no more than one minimum for a strictly convex function on an open set. More specifically, for a strictly non-convex problem, the minimum does not exist/on the bound if it is on an open set/an explicit domain. Generally, BEO problems are usually non-differentiable with discontinuous simulation outputs, often resulting in failure of technologies that require differentiability. Separability is an important property for multi-dimensional problem. If the design variables are independent of each other, the problem can be simply addressed by decomposing it into several sub-problems that are easy to be solved. However, most BEO problems are likely to be inseparable.
2.1.3. Existence of Constraints
BEO problems can be grouped into constrained or unconstrained, depending on whether constraints exist. Addressing a constrained problem is generally harder than an unconstrained one, but most BEO problems are constrained, and this feature affects the optimization technology to be used. Equality or inequality are two major types of constraints, and the latter is recognized as more difficult to solve [9]. A constraint function might have properties similar to those of objective functions, including convex or non-convex, linear or non-linear, separable or inseparable, differentiable or non-differentiable. In BEO, a variable’s bounds constitute a general case of constraints and are relatively easy to solve. In addition, dependent variable constraints are often unavoidable, and the most common method in BEO is the use of penalty or barrier functions [30].
2.2. Approaches Used to Determine the Properties of BEO Problems
As demonstrated in Section 2.1, diverse properties are probably involved in one BEO problem. Certain properties can be easily and intuitively determined, e.g., discrete or continuous variables, whereas several significant properties are rather difficult to determine directly, such as linear or non-linear. In view of this situation, two approaches, namely, analytical approach and numerical approach, are proposed in this section to determine the properties of BEO problems. To demonstrate the applicability of these two approaches, we take the optimization of the opaque wall conductivity to minimize the annual energy consumed by a standard building as an example.
2.2.1. Standard Building Model
A single-zone rectangular-shaped office building located in Nanjing, Jiangsu province, China is chosen as the standard building. As shown in Figure 2, the floor height of the single-story building is 4 m, and the length and width are both 20 m. Only the southern wall has a single-layer window [31] which is spread over the entire length of the wall and the initial window-to-wall ratio is 50%. The exterior walls and roof are simplified as one-layer construction [32] with an initial thermal conductivity of 0.16 W/mK and 0.1 W/mK, respectively, complying with the minimum requirements of the China Design Standard for Energy Efficiency in public buildings (GB50189-2015) [33].
The building is assumed to be equipped with an ideal heating, ventilation, and air conditioning (HVAC) system which supplies sufficient quantity of cooling or heating air to the building to meet the internal load. According to the GB50189-2015 [33], the internal heat gains of the building include lights (9.0 W/m2), equipment (15 W/m2), and heat released by 40 people. The fresh air volume is 30 m3/hp. Schedules for the HVAC system, zone thermostat control, lights, equipment, fresh air unit and occupant rate are set based on Table B.0.4-1 through Table B.0.4-10 in the GB50189-2015 [33].
2.2.2. Analytical Approach
The analytical approach derives the logical mechanism behind BEO problems from the basic laws of physics and is a description of a system using mathematical concepts and language. A whole building is a real system placed in the real environment and represents a highly complex situation. To perform analysis on the system, a specific physical calculation model of energy consumption that can reflect the real working state of the building must be determined first. Compared with selected mature, widely recognized and commonly used energy simulation engines (including EnergyPlus, eQUEST, TRANSYS, ESP-r, DOE-2, BLAST, etc.), EnergyPlus (version 8.3.0, Lawrence Berkeley National Laboratory, Berkeley, California, USA) is definitely the most frequently used detailed and dynamic energy simulation program [34]. Thus, the EnergyPlus calculation model can be selected as the theoretical foundation of the analytical approach, as shown in Figure 3. The computing core is a calculation model based on fundamental heat balance principles of the building’s inside and outside. By using the analytical approach, the expression for the annual energy consumption and the opaque wall conductivity of the standard building is derived as follows.
Defining the energy consumption of the building as Qtotal, it can be formulated as:
where Qsys is the energy consumed by HVAC systems, Qlights is the energy consumed by lights, Qequip is the energy consumed by equipment, and Qothers is the energy consumed by other facilities.
As in this study, the building is equipped with an ideal HVAC system with a coefficient of performance (COP) of 1, so Qsys is equal to the heat flux released by the ideal system to the indoor air which is defined as , and then Qtotal is directly proportional to . To develop the explicit equations between and the wall conductivity k, the formulation begins with the heat balance in the zone air:
where is the system energy provided to the zone, Qin is the energy kept in the zone air, Qconv is convective heat transfer from the surfaces, Qint is the total of convective internal loads, Qinf is heat transfer due to infiltration of outside air, and Qzones is heat transfer owing to air mixing between zones.
Thus, is proportional to Qconv which is influenced by the variable of wall conductivity k. To identify the relationship between Qconv and k, the EnergyPlus calculation modules of the conduction through the walls and heat balance on the inside surface are subsequently explored, and the detailed derivation processes are given in Appendix A to make the main text concise.
Finally, assuming that the time step δ is 1 h, substituting Equations (A24) and (2) into Equation (1) in the text yields:
where:
Moreover, s is the inner surface area of the wall. ut is a vector of indoor and outdoor temperatures at time t. l is the length of the wall. ρ is the density of the wall. k is the thermal conductivity of the wall. c is the specific heat of the wall, and h is the convection coefficient. Thus, the energy consumption of the standard building Qtotal is a quartic polynomial of the wall conductivity k.
2.2.3. Numerical Approach
The numerical approach is another technique used to identify relationships among variables, such as correlation or causation. Instead of deriving accurate mathematical formulas, the relationship between an optimization objective (e.g., annual energy consumption, thermal comfort or cost) and one or more independent variables (e.g., architectural design parameters) is determined by data analysis. The program collects data by varying the values of the independent variable to obtain the corresponding values of the objective. Such a statistical method enables analysis of experimental data and construction of empirical models so as to capture the most accurate description of the physical situation.
When using the numerical approach to understand the impacts of the opaque wall conductivity of the standard building on its annual energy consumption, the feasible region (0.02 to 0.3 W/mK) of the opaque wall conductivity was first discretized into 56 intervals and 57 points with a step size of 0.005 W/mK. All 57 values of the independent variable were input to the EnergyPlus to compute the corresponding design objective (i.e., building annual energy consumption). Finally, inferential statistics, i.e., regression analysis, were applied to the series of data to identify the regression function among the variables, which can be approximately considered as the mathematical objective formulas of the given optimization problem. Figure 4 shows the final statistical data and the fitting curve. The regression function is written as:
where Qtotal is the annual energy consumption, and k is the wall conductivity of the standard building.
2.2.4. Results Comparison
Comparing the final formulas obtained by the two aforementioned approaches (i.e., Equations (3) and (4)), the mathematical model developed on the theoretical side agrees quite well with the result of the numerical approach, which are all quartic equations. Thus, the reliability of the two approaches is mutually proved and reveals that the relationship between the exterior opaque wall conductivity k and the annual energy consumption Qtotal is a quartic polynomial.
Compared with the analytical approach, which requires designers (e.g., architect, engineer, etc.) have a solid mathematical background, the numerical approach is much easier to apply at a slight cost to accuracy. Moreover, for some real-world building optimization problems, the models may be too complicated to make it difficult for analytical approach to develop exact mathematical expressions. Therefore, in real-life practice, designers are encouraged to select a proper approach according to the specific optimization problems to be solved and their academic backgrounds.
2.3. Six Test BEO Problems with Different Properties
Since the primary goal of this research is to assess the performance of algorithms in solving different BEO problems with specific properties, so the properties (e.g., linear or non-linear, convex or non-convex, etc.) must be isolated so that it can be identified which property may cause difficulty for a particular algorithm. Therefore, a set of test problems was designed, with only one significant property for each problem and the performance of the selected algorithms in solving them was systematically evaluated. By using the two approaches proposed above, the properties of each test problem were determined. In particular, for Test 1, both the analytical and the numerical approaches were used as demonstrated in Section 2.2. For Tests 2–6, only the numerical approach was used. Each test problem and its properties are discussed below.
2.3.1. Test 1: Wall Conductivity
Test 1 was designed to optimize the exterior wall conductivity of the standard building for minimization of the annual energy consumption, as introduced in Section 2.2. Although it is generally considered that the energy consumption increases with the increase of wall conductivity, the specific linear or non-linear monotonically increasing relationship is complex and cannot be determined intuitively. Additionally, Test 1 is a significantly representative problem that is worthy of investigation in BEO.
Section 2.2 implied that Test 1 is single-dimensional because only one variable is considered in the problem. In addition, as demonstrated in Figure 4, the regression line is a continuous non-linear monotone curve, and the problem has only one optimal solution. Therefore, the property of the search space is classified as uni-modal. Moreover, according to the definitions of convex and non-convex, the underlying equation in the objective function of Test 1 is strictly non-convex with the unique optimal solution located at the lower bound of the variable domain.
2.3.2. Test 2: Orientation
Test 2 was designed to optimize the building orientation of the standard building for minimization of the annual energy consumption. Figure 5 demonstrates their relationship, which is in essence the graph of the objective function of Test 2. The figure shows that only one variable is involved. In addition, the objective function is non-linear and is convex in three intervals and non-convex in two intervals. As a result, two peaks and three valleys appear in the graph. Thus, this problem has single-variable, non-linear, convex, non-convex and multimodal properties.
2.3.3. Test 3: Floor Height
Test 3 was designed to optimize the floor height of the standard building for minimization of the annual energy consumption. Their relationship is illustrated in Figure 6, which was derived using the numerical approach by discretizing the variable feasible region into 41 points. The final regression function is a linear polynomial with one variable and is written as f(X) = 2.41369X + 105.12669. Therefore, this is a single-variable and linear problem.
2.3.4. Test 4: Aspect Ratio
Test 4 was designed to optimize the building aspect ratio for minimization of the annual energy consumption by changing the length of the south wall. In this test, the standard building was modified by reducing the window length to 5 m, as shown in Figure 7, to ensure that the window area was constant whenever the aspect ratio of the building changed. The volume, floor height and floor area of the modified building model remain unchanged. Thus, if the length of the south wall is symbolized by L, the length of the east wall is 400/L, and the aspect ratio of the building is L2/400. Specifically, the lengths of the relative elevations are the same. By discretizing the feasible region of L, the corresponding building aspect ratio and annual energy consumption can be calculated. The final numerical experiment results are demonstrated in Figure 8, which implies the objective function is strictly convex, non-linear and has only one optimum.
2.3.5. Test 5: Wall Conductivity and Orientation
Test 5 is a multi-dimensional problem with two variables. To identify the properties of the objective function, the numerical approach was applied to find how the value of the annual energy consumption changed when the wall conductivity and building orientation of the standard building were varied. The graph of the objective function is illustrated in Figure 9, which is non-linear, multimodal, convex and non-convex.
2.3.6. Test 6: Wall Conductivity and Cooling Setpoint for the Zone Air Temperature
Test 6 is also a multi-dimensional problem with two variables, one of which is the wall conductivity and the other is the cooling thermostat setpoint. It is noted that Test 6 is a mixed-integer problem, in which the variable of cooling setpoint is discrete with a step size of 1 and the wall conductivity is continuous. To identify the properties of the objective function, the numerical approach was applied and the design space is illustrated in Figure 10.
2.4. Description of the Optimization Algorithms Being Evaluated
In this study, the representatives of four algorithm types, i.e., Particle Swarm Optimization (PSO) [9], discrete Armijo gradient, Hooke-Jeeves and hybrid PSO and Hooke-Jeeves, were compared to evaluate their performance in solving the six test problems with distinct properties. All of the algorithms were implemented in GenOpt (version 3.1.1, Lawrence Berkeley National Laboratory, Berkeley, California, USA), a popular platform that can integrate with EnergyPlus. Only the key operation concepts of the algorithms are discussed in this section. We refer the readers to [35] for more information about the original development of each algorithm, a detailed description of their workflows and the control parameters. In this study, we set the parameters of the algorithms to values that are revealed to perform nicely for building optimization problems by other researchers [18,36]. They also passed some pre-testing conducted by the authors.
2.4.1. Discrete Armijo Gradient Algorithm
This algorithm is affiliated with the family of gradient-based algorithms and can be applied to minimize continuously differentiable functions. This algorithm approximates the gradients using finite differences, and the optimization progress is driven by the difference increment reduced. The Armijo step-size rule is used to perform line searches.
The main control parameters and their settings for the discrete Armijo gradient algorithm used in this work include: Alpha = 0.5, Beta = 0.8, Gamma = 0.1, K0 = 0, KStar = −10, LMax = 50, Kappa = 25, EpsilonM = 0.01, and EpsilonX = 0.05. The reader is referred to [34] for additional details on the operational strategy of the algorithm and parameters.
2.4.2. Hooke-Jeeves Algorithm
This algorithm [37] is a Generalized Pattern Search algorithm. It is initiated from a given starting solution and subsequently performs exploration and pattern search alternatively in the solution space. The exploration searches along the direction of each coordinate from a base solution using a predefined step size for a better performing solution. The pattern search strategy accelerates the searches along the improved objective value direction. The algorithm terminates when the maximum number of step reduction or the predefined convergence precision is achieved.
In GenOpt, the incremental reductions in step size are controlled by the parameters of initial mesh size exponent, mesh size exponent increment, mesh size divider and number of step reduction. In this study, their values of 0, 1, 2, 4, respectively [34], are used.
2.4.3. PSO Algorithm
The PSO algorithm is a member of the population-based stochastic algorithms [38]. It is inspired by the social behavior of a shoal of fish or a flock of birds. Each individual, such as a “fish” in the shoal, is called a “particle”. For each particle, the PSO algorithm tracks the best position of the particle (which models cognitive behavior) as well as the best position of the population (which models social behavior) in terms of the objective function.
The PSO algorithm adopted in this study uses the constriction coefficient method and applies the von Neumann topology [39], the values of the parameters of random seed, social acceleration constant, cognitive acceleration constant, constriction gain and velocity clamping with a maximum velocity gain are 1, 1.3, 2.8, 0.5, 0.5, respectively [34].
2.4.4. Hybrid PSO and Hooke-Jeeves Algorithm
The hybrid algorithm first runs the PSO to achieve a near-optimal solution. This step is performed based on a pre-defined number of generations. When the PSO finishes, its optimal solution is utilized as the initial solution for the Hooke-Jeeves. This hybrid algorithm aims to locate the optimal area of the solution space by running the PSO first and subsequently to carry out a refined search in that area by running the Hooke-Jeeves [40]. The control parameters and the settings of the hybrid algorithm are the same as in the two aforementioned algorithms.
2.5. Performance Evaluation Criteria
The performance behavior of the selected algorithms in addressing the six test problems is assessed using four important performance indices proposed in our previous work, namely, stability, validity, speed and coverage [4]. For an algorithm, the stability is used to describe its capability of consistently finding similar optimal solutions when the optimization run is repeated multiple times. The validity describes the accuracy of the optimum found by the algorithm. The speed describes how fast the algorithm convergences to the optimal solution, and the coverage describes the ability of an algorithm to look for the optimal solution in the global solution space. Readers are referred to [4] for details of the applicable definitions and quantitative calculation formulas.
3. Results and Analysis
The programs GenOpt 3.1.1 and EnergyPlus 8.3.0 were applied for all optimizations. Each optimization run had the same initial population and the number of simulations was limited to no more than 300. We used a computer with Windows 10 operating system (Microsoft, Redmond, Washington, USA), 8 GB of main memory, and an Intel (R) Core (TM) i7-6700HQ 475 CPU @ 2.60 GHz to conduct all simulations. It took about 8 seconds to finish one simulation and approximately 1–1.5 h for 300 simulations in total.
3.1. Stability
For each test problem, six repeated runs were conducted with each algorithm, and Table 3 listed the final results. As shown, the six optimization runs of each algorithm generated the same results for each test problem. Particularly, the discrete Armijo gradient failed to solve Test 5 because the optimization process suddenly terminated halfway without converging. While using the discrete Armijo gradient and the Hooke-Jeeves to solve Test 6, GenOpt terminated with error as both algorithms can only have continuous variables. Therefore, the stability of the four selected algorithms is perfect for all test problems. However, the discrete Armijo gradient and the Hooke-Jeeves are not recommended for solving BEO problems with discrete variables.
3.2. Validity
It has been verified that the stability of all four optimization algorithms is good, which is necessary for the validity evaluation. To examine the closeness of the best solution obtained in an optimization run to the true optimum, the normalized Euclidean distance d(X*, X’) between them and the relative distance in their objectives g(f(X*), f(X’)) were calculated according to our previous work [4]. If both d(X*, X’) and g(f(X*), f(X’)) have small values, the optimal solution locates near the true optimum in the design space, demonstrating that the validity of the corresponding algorithm is high. Table 4 summarizes the calculated d(X*, X’) and g(f(X*), f(X’)) values of each algorithm for each test problem.
For Test 1, which is strictly non-convex, the unique global optimum is at the boundary of the feasible region. The Hooke-Jeeves and the hybrid algorithms finally found the true optimum, and the other two algorithms found near-optimal solutions with good quality. Thus, the validity of the four algorithms is highly satisfactory in this case.
For Test 2, which is multi-model, the hybrid algorithm found the true optimum. The PSO algorithm found an acceptable near-optimal solution that has notably small d(X*, X’) and g(f(X*), f(X’)) values. Conversely, the other two algorithms were trapped by the local optimum with large d(X*, X’) and g(f(X*), f(X’)) values.
For Test 3, all four algorithms converged to the true optimum or a satisfactory near-optimum, indicating that the validity of all four algorithms is high in solving linear BEO problems.
For Test 4, which is strictly convex, the validity performance of the four algorithms is quite similar to that of Test 1, which is strictly non-convex. The test reveals that strictly convex or non-convex properties in BEO problems may not cause different validity behavior for the four selected algorithms.
For Test 5, none of the algorithms found the true optimum, but the PSO algorithm and the hybrid algorithm found satisfactory solutions with quite small g(f(X*), f(X’)) values. However, the optimal solution found by the Hooke-Jeeves algorithm has poor quality with a large g(f(X*), f(X’)) value. In addition, the discrete Armijo gradient algorithm failed for this test. Therefore, the discrete Armijo gradient and the Hooke-Jeeves display worse performance in terms of validity for BEO problems with a multi-dimensional property while the validity performance of the other two algorithms is acceptable.
For test 6, which contains a discrete variable, the hybrid algorithm found the true optimum. In contrast, the discrete Armijo gradient and the Hooke-Jeeves failed to optimize discrete variables and terminate from the very beginning. The PSO algorithm did not find an acceptable solution with large d(X*, X’) and g(f(X*), f(X’)) values.
In general, the validity of the hybrid algorithm is good for all test problems. This result implies that linear or non-linear monotone, uni-modal or multimodal, convex or non-convex, single-dimensional or multi-dimensional properties in BEO problems may not cause difficulty for this algorithm in terms of validity. Multi-modality tends to cause the discrete Armijo gradient and the Hooke-Jeeves to fall into local optima traps considering their poor validity behavior in Test 2 and 5.
3.3. Speed
Generally, computing time can be greatly reduced by using of a high-speed algorithm, particularly for complex problems whose objective function evaluations commonly require lots of time and resources [4]. To evaluate the speed of the four algorithms in solving the six test optimization problems, the numbers of simulations required before finding the optimal solution by each algorithm were compared for each test problem.
Figure 11 shows that the PSO algorithm requires the fewest number of simulations to reach convergence for Tests 1–3, but it consumes additional time in solving Tests 5 and 6. The speed of the Hooke-Jeeves algorithm is notably good for Tests 1–4. This result indicates that strictly convex, non-convex, linear, non-linear, uni-modal and multi-modal properties in BEO problems have no effect on the speed of the PSO algorithm and the Hooke-Jeeves algorithm if multi-dimensionality is not involved.
The hybrid algorithm displayed mediocre performance in speed despite its perfect performance in validity. One explanation is the global search conducted by the PSO algorithm was fixed at a constant number of iterations, which means the local search began to converge to the optimal solution only after the predetermined number of iterations was finished. However, at times, the PSO algorithm did not need as many iterations to find the optimal area. Thus, this operation strategy artificially increased the unnecessary speed burden for the hybrid algorithm.
The speed of the discrete Armijo gradient cannot be evaluated for Tests 5 and 6, because of its failure in validity. In addition, for the other four test problems, this algorithm performed quite poorly due to the large number of simulations required to find optimal solutions.
Generally, as illustrated in Figure 11, multi-dimensionality caused all four algorithms difficulty in terms of speed, according to comparison of their performance in Tests 5 and 6 with those of the other four test problems.
3.4. Coverage
The standard deviation of all searched solutions in each variable domain and their products can be used if comparing the coverage of algorithms in solving only one specific problem. Detailed calculation equations are included in [4], and their values are dependent of the units. In this study, to eliminate the influence of different units for coverage comparison between different test problems, the standard deviation of all searched solutions in each variable domain was divided by its feasible region size, as developed in Equation (5). Thus, the final value is independent of the units and is a dimensionless number.
where SDk is the standard deviation of the kth variable values of all searched solutions; uk and lk are the upper and lower bounds of the kth variable, respectively. A large value of indicates wide distribution of all searched solutions in the kth variable domain, powerful global search ability of the algorithm and good performance behavior in terms of coverage.
Table 5 lists the standard deviations of all solutions searched by each algorithm for each test problem, as calculated in Equation (5). The table reveals that for each test problem, the standard deviations of the Hooke-Jeeves are the smallest of the four compared algorithms, especially for Tests 2 and 5, which are multi-modal. Thus, the Hooke-Jeeves has poor performance in coverage and is easy to be trapped by local optima.
The standard deviations of the discrete Armijo gradient algorithm are generally larger than those of the other three algorithms for Tests 1, 3 and 4. This result implies the coverage of the algorithm is outstanding in solving BEO problems with single-dimensional, convex, non-convex, uni-modal, linear or non-linear properties. However, based on the small distribution of all searched solutions in Tests 2, 5 and 6, the global search ability of this algorithm is poor in solving multi-model and multi-dimensional BEO problems.
Considering its acceptable standard deviation values for Tests 1–5, the PSO algorithm showed good performance in coverage. However, for Test 6, the PSO algorithm failed to search wide areas of the solution space because the product of the standard deviations in the two variable domains was small. Thus, the existence of discrete variables in BEO problems increases the difficulty of global search for the PSO algorithm.
In general, the global search ability of the hybrid algorithm is noted to be perfect for all test problems with large values of standard deviations.
4. Conclusions
- Strictly convex and non-convex. As shown in Table 6 and Table 7, the performance behavior of each algorithm in solving Test 1 is quite similar to that of Test 4. This result means strictly convex or non-convex properties in BEO problems do not drive different performance behaviors for the four selected algorithms. Additionally, the strictly convex property appears to require the discrete Armijo gradient and the PSO to use additional time to converge to the global optimum.
- Linear and non-linear. For each selected algorithm, linear or non-linear properties in uni-modal BEO problems appear to have no influence on their performance behaviors, according to the evaluation results for Test 3 with Test 1 and 4. Specifically, the speed of the Hooke-Jeeves is excellent in solving linear problems.
- Multimodal. In tackling Test 2, the Hooke-Jeeves and the discrete Armijo gradient performed poorly in terms of validity and coverage. Both algorithms were confirmed to be trapped by local optima. Thus, multi-modality tends to cause difficulty for these two algorithms. In contrast, the specific property does not pose problems for the PSO algorithm and the hybrid algorithm, considering their good performance in Test 2.
- Multi-dimensional. Based on the poor performance behavior in Test 5, the Hooke-Jeeves and the discrete Armijo gradient appear to have suffered from the “curse of dimensionality”, which indicates that as the dimensions of the search space increases, their performance deteriorates rapidly. The reason for this is that the solution space of a problem typically grows exponentially with the problem dimension. As a result, algorithms may fail to explore all possible space within limited time.
- Discrete. According to the optimization results of Test 6, the Hooke-Jeeves and the discrete Armijo gradient are not applicable for BEO problems with discrete variables. In contrast, the hybrid PSO and Hooke-Jeeves algorithm is the best choice among the four algorithms for mixed-integer problems.
- All of properties in the six test problems do not affect the stability of all selected algorithms, considering their notably good performance in the stability evaluation for each test problem.
In conclusion, the four algorithms’ performance for each test problem is summarized in Table 6 and Table 7. The four selected algorithms exhibit the following performance behaviors in solving BEO problems with specific properties.
In general, the hybrid PSO and Hooke-Jeeves algorithm performs better than the other three algorithms. The PSO algorithm also performs well except in solving mixed-integer problems, but it is slightly weaker in terms of validity. In particular, the Hooke-Jeeves algorithm and the discrete Armijo gradient algorithm are not suggested for solving multimodal, multi-dimensional and discrete BEO problems.
5. Future Works
This paper has attempted to reveal some important aspects of algorithm performance for BEO problems with specific properties. In this study, only one optimization objective was considered, although extensions of the methodology to problems with multiple objectives can also be performed in future works. Besides, complex constraints have not been considered in this paper. Performance assessment of different algorithms for complex constrained BEO test problems should be emphasized in the future.
Author Contributions
Conceptualization, B.S. and X.S.; methodology, B.S. and X.S.; validation, B.S., Z.T., W.C., X.J., X.Z. and X.S.; writing—original draft, B.S.; writing—review and editing, B.S. and X.S.; supervision, X.S.
Funding
This research was funded by the National Natural Science Foundation of China, grant number 51678124 and the Scientific Research Foundation of Graduate School of Southeast University, grant number YBJJ1702.
Conflicts of Interest
The authors declare no conflict of interest.
Appendix A
This appendix demonstrates the EnergyPlus calculation methods of the conduction through the walls and the inside surface heat balance. The heat balance on the inside surface of wall is written as follows:
where qconv is convective heat flux to zone air, qLWX is net longwave radiant exchange flux between zone surfaces, qSW is net short wave radiation flux to surface from lights, qLWS is longwave radiation flux from equipment, qki is conduction flux through the wall, and qsol is transmitted solar radiation flux absorbed at surface. In Equation (A1), qki is proportional to qconv and is directly connected to the variable of wall conductivity k. Thus, the calculation method for conduction flux through the wall in EnergyPlus must be explored.
EnergyPlus uses conduction transfer functions (CTFs) to calculate the heat flux conducted through the walls [30,41,42]. In this study, the exterior wall of the standard building is simplified into a one-layer construction with two interior nodes and convection at both sides, as shown in Figure A1. The calculation of CTFs and resulting finite difference equations are given below.
Figure A1.
Two-node state space example.
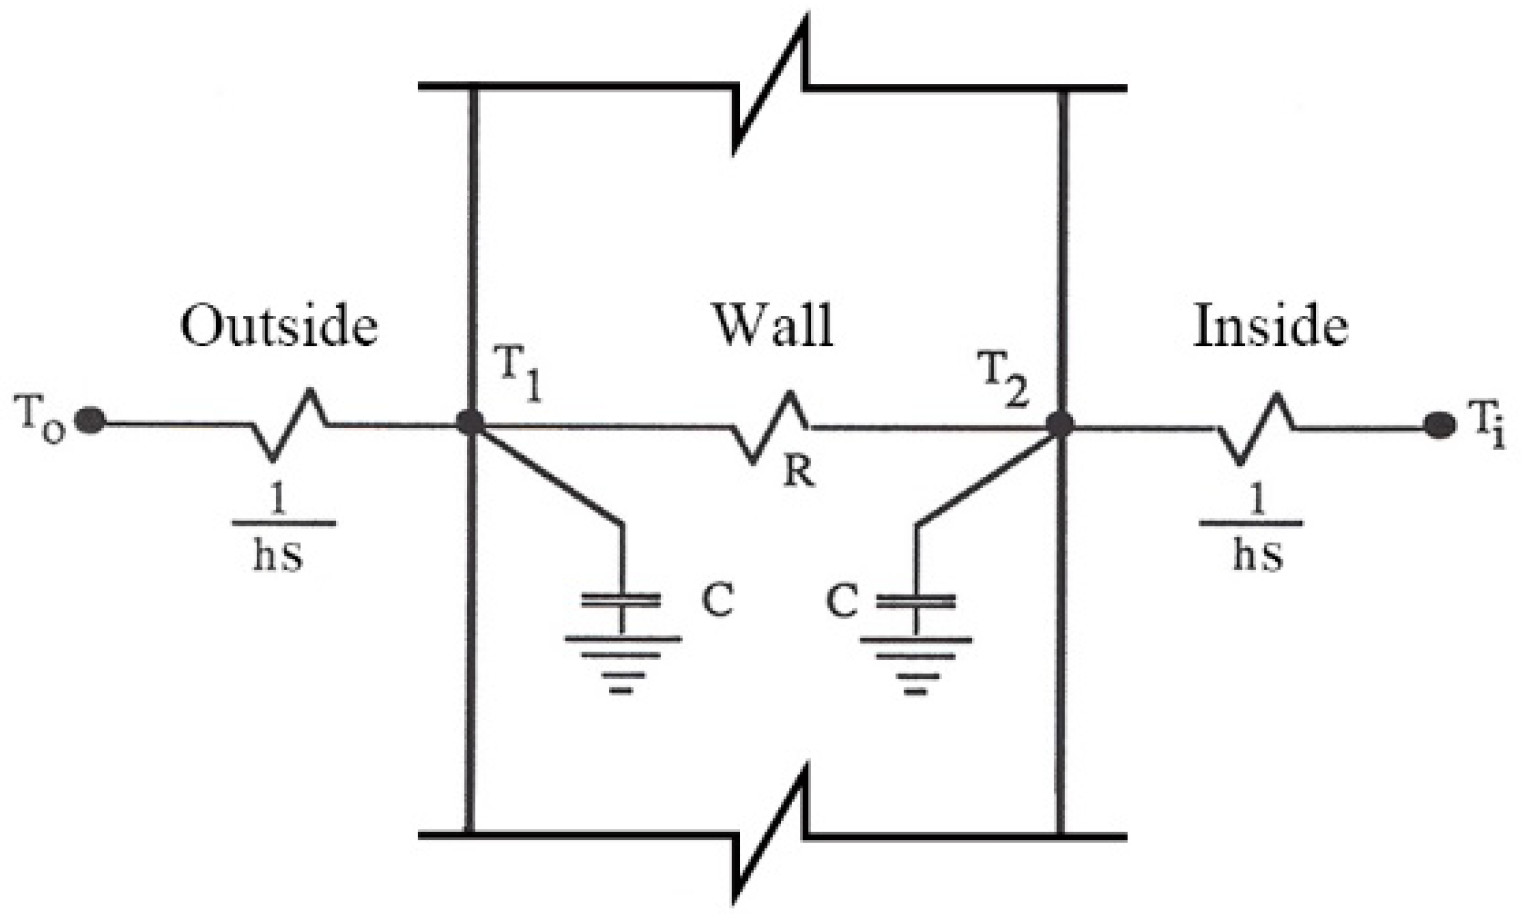
Energy balances at the two nodes bring about the set of first order differential equations:
where C = ρcls/2, R = l/ks. C is the thermal capacitance. ρ is the density of the wall. c is the specific heat of the wall. R is the thermal resistance. l is the length of the wall. k is the thermal conductivity of the wall. s is the inner surface area of the wall. h is the convection coefficient. To is the outdoor temperature. Ti is the indoor temperature. T1 is the temperature of node 1. T2 is the temperature of node 2, and qki and qko are the heat fluxes (desired output).
Equation (A2) through Equation (A5) can be expressed as the following state space equations by considering the temperatures of the nodes as the two states:
Equation (A6) is the state equation. Equation (A7) is the output equation. According to [41], the transfer function equation for this two node example can be written as follows:
where u is a vector of the outside and inside temperatures. qt is the output vector. t is the time. δ is the time step. Moreover,
Finally, substituting Equation (A8) into Equation (A1) yields:
where, to facilitate calculation and explicitly the variable k, elements in Equations (A20)–(A23) are substituted by three independent variables:
Furthermore,
References
- Abergel, T.; Dean, B.; Dulac, J. Towards a Zero-Emission, Efficient, and Resilient Buildings and Construction Sector: Global Status Report 2017; UN Environment and International Energy Agency: Paris, France, 2017. [Google Scholar]
- Shi, X.; Tian, Z.; Chen, W.; Si, B.; Jin, X. A review on building energy efficient design optimization from the perspective of architects. Renew. Sustain. Energy Rev. 2016, 65, 872–884. [Google Scholar] [CrossRef]
- Hensen, J.L.M.; Lamberts, R. Building Performance Simulation for Design and Operation; Spon Press: Abingdon, UK, 2011. [Google Scholar]
- Si, B.; Tian, Z.; Jin, X.; Zhou, X.; Tang, P.; Shi, X. Performance indices and evaluation of algorithms in building energy efficient design optimization. Energy 2016, 114, 100–112. [Google Scholar] [CrossRef]
- Terzidis, K. Algorithmic Architecture; Elsevier and Architectural Press: Oxford, UK, 2006. [Google Scholar]
- Evins, R. A review of computational optimisation methods applied to sustainable building design. Renew. Sustain. Energy Rev. 2013, 22, 230–245. [Google Scholar] [CrossRef]
- Nguyen, A.T.; Reiter, S.; Rigo, P. A review on simulation-based optimization methods applied to building performance analysis. Appl. Energy 2014, 113, 1043–1058. [Google Scholar] [CrossRef] [Green Version]
- Machairas, V.; Tsangrassoulis, A.; Axarli, K. Algorithms for optimization of building design: A review. Renew. Sustain. Energy Rev. 2014, 31, 101–112. [Google Scholar] [CrossRef]
- Goldberg, D.E. Genetic Algorithms in Search, Optimization, and Machine Learning; Addison-Wesley Pub. Co.: London, UK, 1989. [Google Scholar]
- Deb, K.; Pratap, A.; Agarwal, S.; Meyarivan, T. A fast and elitist multiobjective genetic algorithm: NSGA-II. IEEE Trans. Evolut. Comput. 2002, 6, 182–197. [Google Scholar] [CrossRef] [Green Version]
- Rios, L.M.; Sahinidis, N.V. Derivative-free optimization: A review of algorithms and comparison of software implementations. J. Glob. Optim. 2013, 56, 1247–1293. [Google Scholar] [CrossRef]
- Mahi, M.; Ömer, K.B.; Kodaz, H. A new hybrid method based on Particle Swarm Optimization, Ant Colony Optimization and 3-Opt algorithms for Traveling Salesman Problem. Appl. Soft Comput. 2015, 30, 484–490. [Google Scholar] [CrossRef]
- Liang, J.J.; Runarsson, T.P.; Mezura-Montes, E.; Clerc, M.; Suganthan, P.N.; Carlos, C.C.; Deb, K. Problem definitions and evaluation criteria for the CEC 2006 special session on constrained real-parameter optimization. J. App. Mech. 2006, 41, 8–31. [Google Scholar]
- Liang, J.J.; Qu, B.Y.; Suganthan, P.N.; Hernández-Díaz, A.G. Problem Definitions and Evaluation Criteria for the CEC 2013 Special Session on Real-Parameter Optimization; Nanyang Technological University: Singapore, 2013. [Google Scholar]
- Das, S.; Suganthan, P.N. Problem Definitions and Evaluation World Optimization Problems. Technical Report. December 2010. Available online: http://web.mysites.ntu.edu.sg/epnsugan/PublicSite/Shared%20Documents/CEC%202011-%20RWP/Tech-Rep.pdf (accessed on 8 August 2018).
- Rao, S.S. Engineering Optimization: Theory and Practice, 4th ed.; John Wiley & Sons, Inc.: Hoboken, NJ, USA, 1996. [Google Scholar]
- Hamdy, M.; Nguyen, A.T.; Hensen, J.L. A performance comparison of multi-objective optimization algorithms for solving nearly-zero-energy-building design problems. Energy Build. 2016, 121, 57–71. [Google Scholar] [CrossRef] [Green Version]
- Wetter, M.; Wright, J. A comparison of deterministic and probabilistic optimization algorithms for nonsmooth simulation-based optimization. Build. Environ. 2004, 39, 989–999. [Google Scholar] [CrossRef] [Green Version]
- Feng, K.; Lu, W.; Chen, S.; Wang, Y. An Integrated Environment-Cost-Time Optimisation Method for Construction Contractors Considering Global Warming. Sustainability 2018, 10, 4207. [Google Scholar] [CrossRef]
- Zheng, B.; Bedra, K.B.; Zheng, J.; Wang, G. Combination of Tree Configuration with Street Configuration for Thermal Comfort Optimization under Extreme Summer Conditions in the Urban Center of Shantou City, China. Sustainability 2018, 10, 4192. [Google Scholar] [CrossRef]
- Lin, Y.; Zhou, S.; Yang, W.; Li, C. Design Optimization Considering Variable Thermal Mass, Insulation, Absorptance of Solar Radiation, and Glazing Ratio Using a Prediction Model and Genetic Algorithm. Sustainability 2018, 10, 336. [Google Scholar] [CrossRef]
- Han, Y.; Yu, H.; Sun, C. Simulation-Based Multiobjective Optimization of Timber-Glass Residential Buildings in Severe Cold Regions. Sustainability 2017, 9, 2353. [Google Scholar] [CrossRef]
- Mihail–Bogdan, C.Ă.; Constantin, I.O.; Horia, N.E. The influence of Genetic Algorithm parameters over the efficiency of the energy consumption estimation in a low–energy building. Energy Procedia 2016, 85, 99–108. [Google Scholar] [CrossRef]
- Alajmi, A.; Wright, J. Selecting the most efficient genetic algorithm sets in solving unconstrained building optimization problem. Int. J. Sustain. Built Environ. 2014, 3, 18–26. [Google Scholar] [CrossRef]
- Wright, J.; Alajmi, A. Efficient Genetic Algorithm sets for optimizing constrained building design problem. Int. J. Sustain. Built Environ. 2016, 5, 123–131. [Google Scholar] [CrossRef]
- Hopfe, C.J.; Emmerich, M.T.; Marijt, R.; Hensen, J. Robust multi-criteria design optimisation in building design. In Proceedings of the 2012 Building Simulation and Optimization Conference, Leicestershire, Loughborough, 10–11 September 2012; pp. 19–26. [Google Scholar]
- Sager, S.; Bock, H.G.; Reinelt, G. Direct methods with maximal lower bound for mixed-integer optimal control problems. Math. Programm. 2009, 118, 109–149. [Google Scholar] [CrossRef]
- Khan, M.A.I.; Noakes, C.J.; Toropov, V.V. Multi-objective optimization of the ventilation system design in a two-bed ward with an emphasis on infection control. In Proceedings of the 2012 Building Simulation and Optimization Conference, Leicestershire, Loughborough, 10–11 September 2012; pp. 9–18. [Google Scholar]
- Wetter, M.; Polak, E. A convergent optimization method using pattern search algorithms with adaptive precision simulation. Build. Service Eng. 2004, 25, 327–338. [Google Scholar] [CrossRef]
- Nguyen, A.T. Sustainable Housing in Vietnam: Climate Responsive Design Strategies to Optimize Thermal Comfort. Ph.D. Thesis, Université de Liège, Wallonia, Belgium, 2013. [Google Scholar]
- Seem, J.E. Modeling of Heat Transfer in Buildings; University of Wisconsin: Madison, WI, USA, 1987. [Google Scholar]
- U.S. Department of Energy. EnergyPlus™ Version 9.0.1 Documentation Input Output Reference; U.S. Department of Energy: Washington, DC, USA, 2018.
- Ministry of Housing and Urban-Rural Development of the People’s Republic of China, General Administration of Quality Supervision Inspection and Quarantine of the People’s Republic of China. Design Standard for Energy Efficiency of Public Buildings; GB50189-2015; Ministry of Housing and Urban-Rural Development of the People’s Republic of China: Beijing, China, 2015.
- Crawley, D.B.; Lawrie, L.K.; Pedersen, C.O.; Winkelmann, F.C. Energy plus: Energy simulation program. ASHRAE J. 2000, 42, 49–56. [Google Scholar]
- Wetter, M. GenOpt® Generic Optimization Program User Manual Version3.1.0. Lawrence Berkeley National Laboratory 2011. Available online: http://simulationresearch.lbl.gov/GO/download/manual-3-1-0.pdf (accessed on 8 August 2018).
- Shen, H.; Tzempelikos, A. Daylighting and energy analysis of private offices with automated interior roller shades. Sol. Energy 2012, 86, 681–704. [Google Scholar] [CrossRef]
- Hooke, R.; Jeeves, T.A. “Direct Search” Solution of Numerical and Statistical Problems. J. ACM 1961, 8, 212–229. [Google Scholar] [CrossRef]
- Kennedy, J.; Eberhart, R. Particle swarm optimization. In Proceedings of the IEEE International Conference on Neural Networks, Perth, Australia, 27 November–1 December 1995; pp. 1942–1948. [Google Scholar]
- Kennedy, J.; Mendes, R. Population structure and particle swarm performance. In Proceedings of the 2002 Congress, Honolulu, HI, USA, 12–17 May 2002; pp. 1671–1676. [Google Scholar]
- Futrell, B.J.; Ozelkan, E.C.; Brentrup, D. Optimizing complex building design for annual daylighting performance and evaluation of optimization algorithms. Energy Build. 2015, 92, 234–245. [Google Scholar] [CrossRef]
- Ceylan, H.T.; Meyers, G.E.; Ceylan, H.T.; Meyers, G.E. Long-time solutions to heat-conduction transients with time-dependent inputs. J. Heat Transf. 1980, 102, 115–120. [Google Scholar] [CrossRef]
- Ouyang, K.; Haghighat, F. A procedure for calculating thermal response factors of multi-layer walls—State space method. Build. Environ. 1991, 26, 173–177. [Google Scholar] [CrossRef]
Figure 1.
Properties of BEO problems.
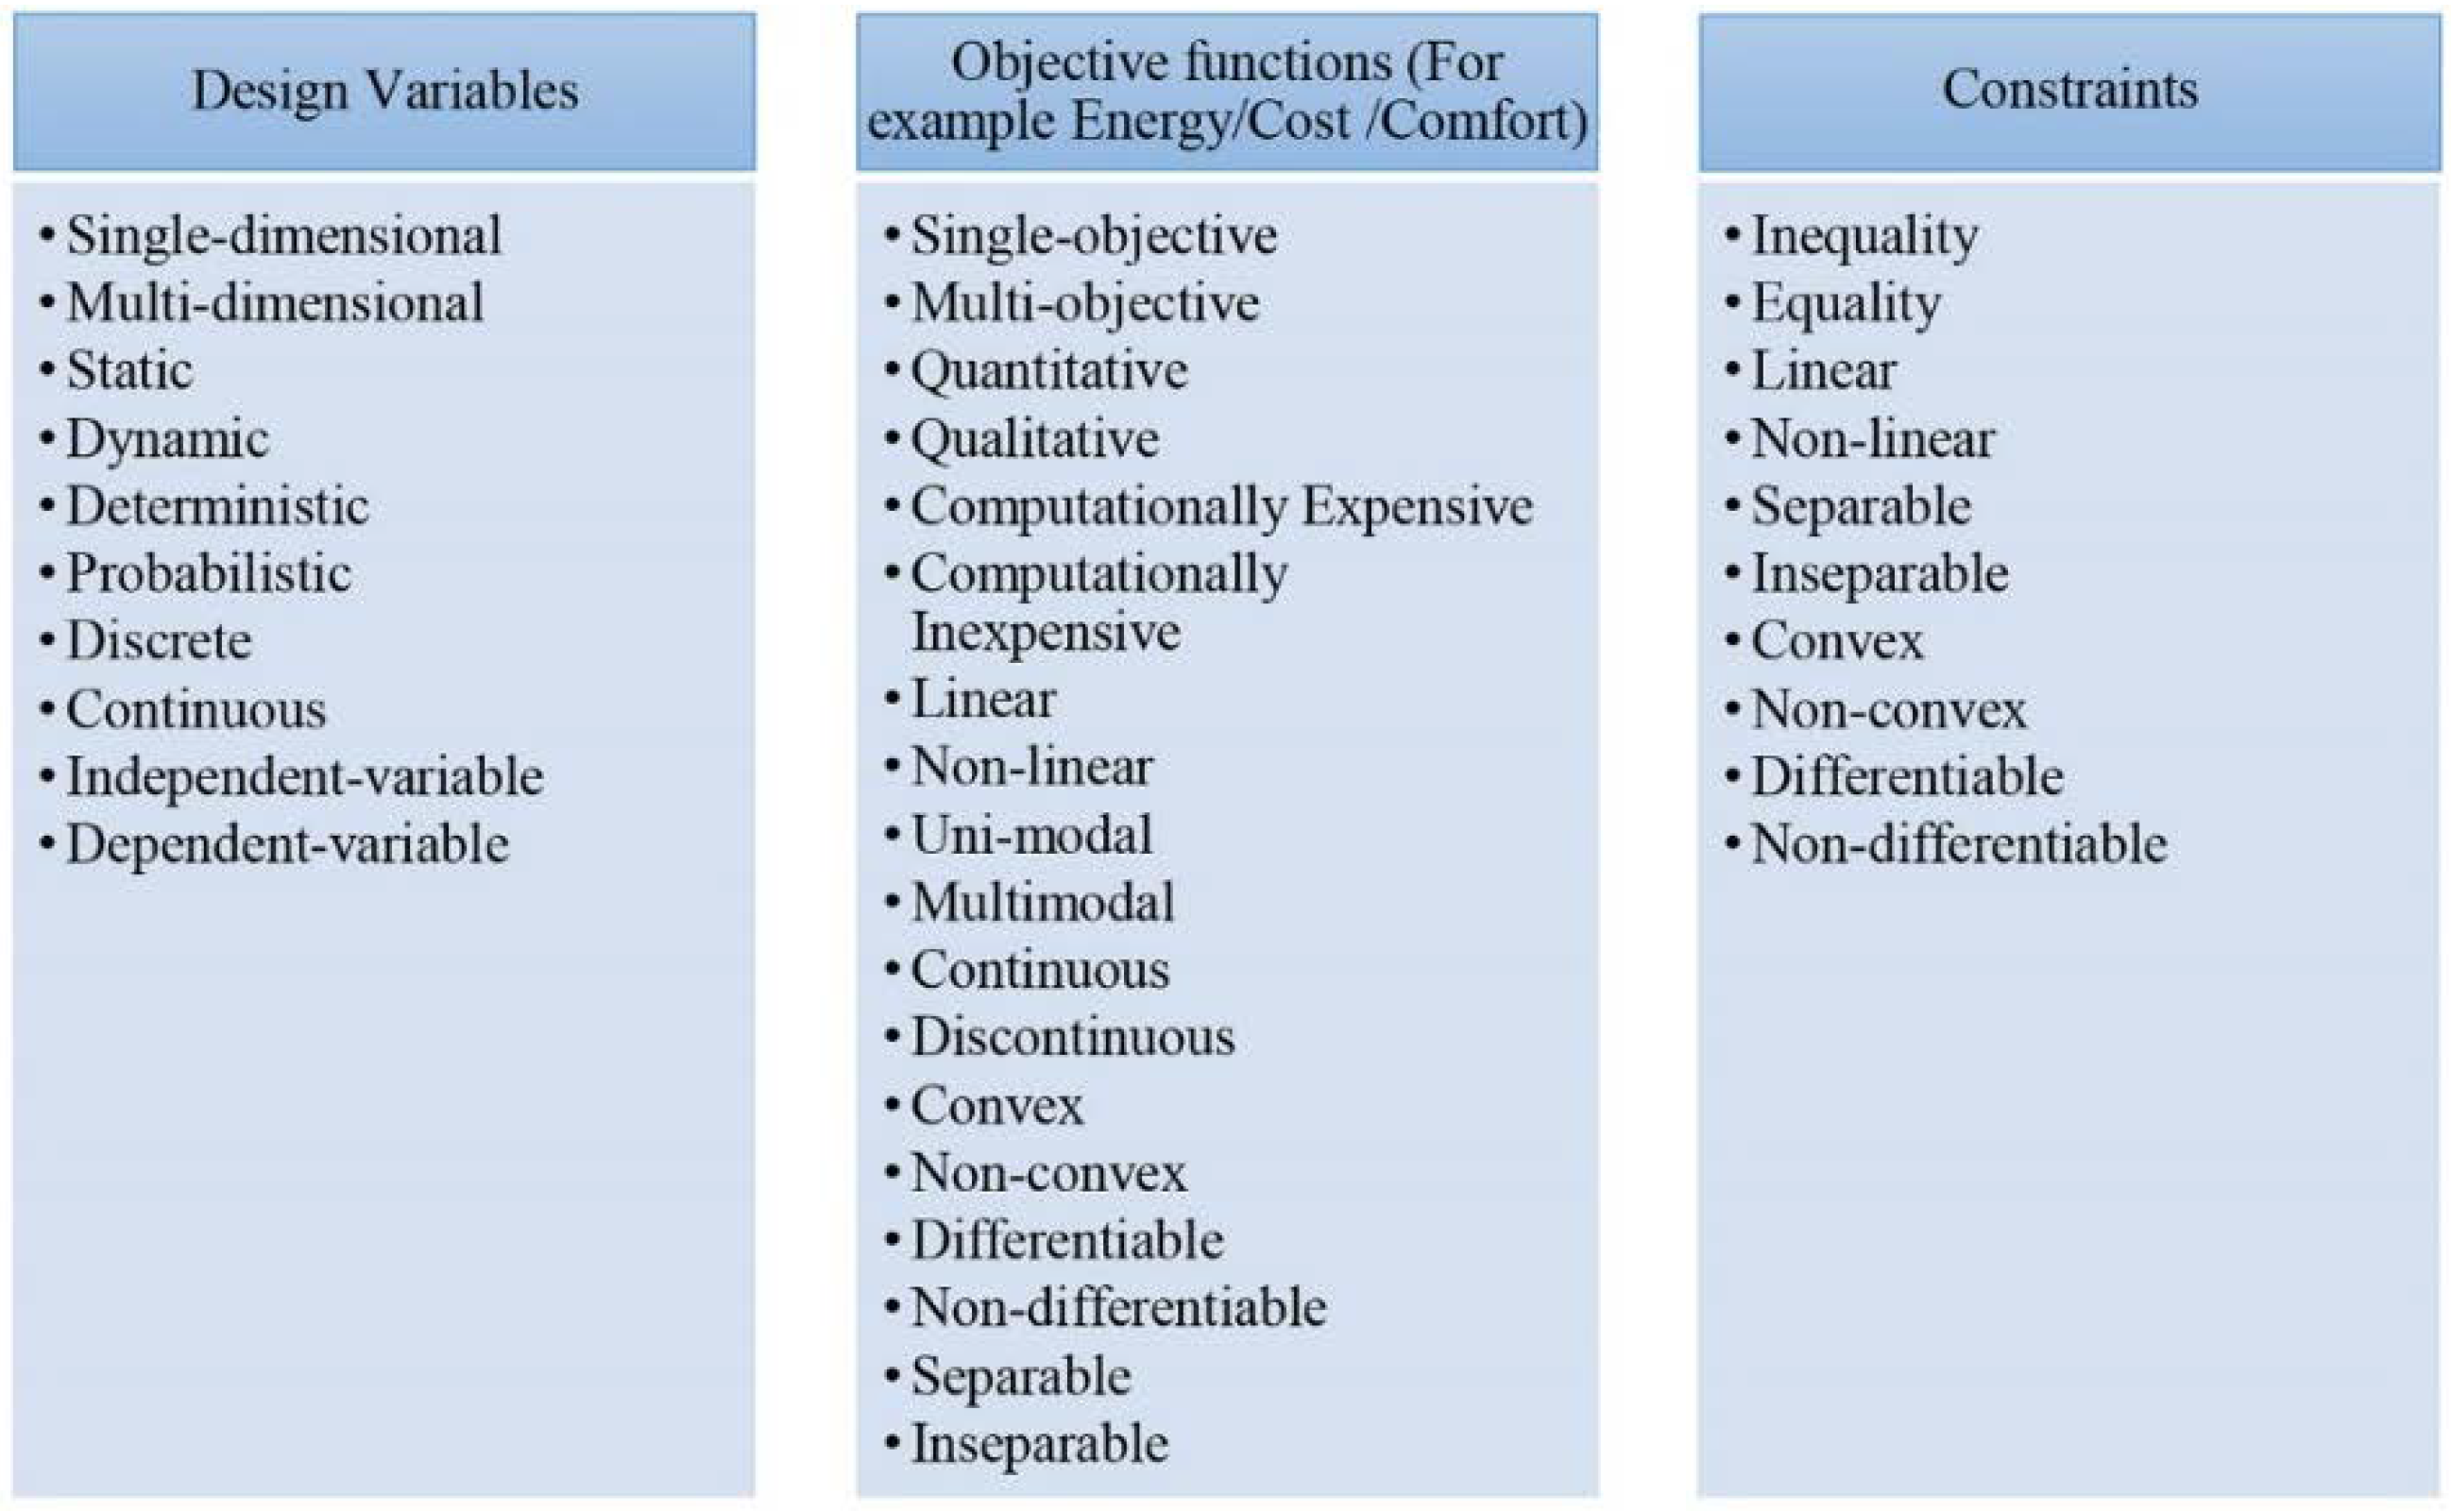
Figure 2.
Architectural schematic view of the standard building.
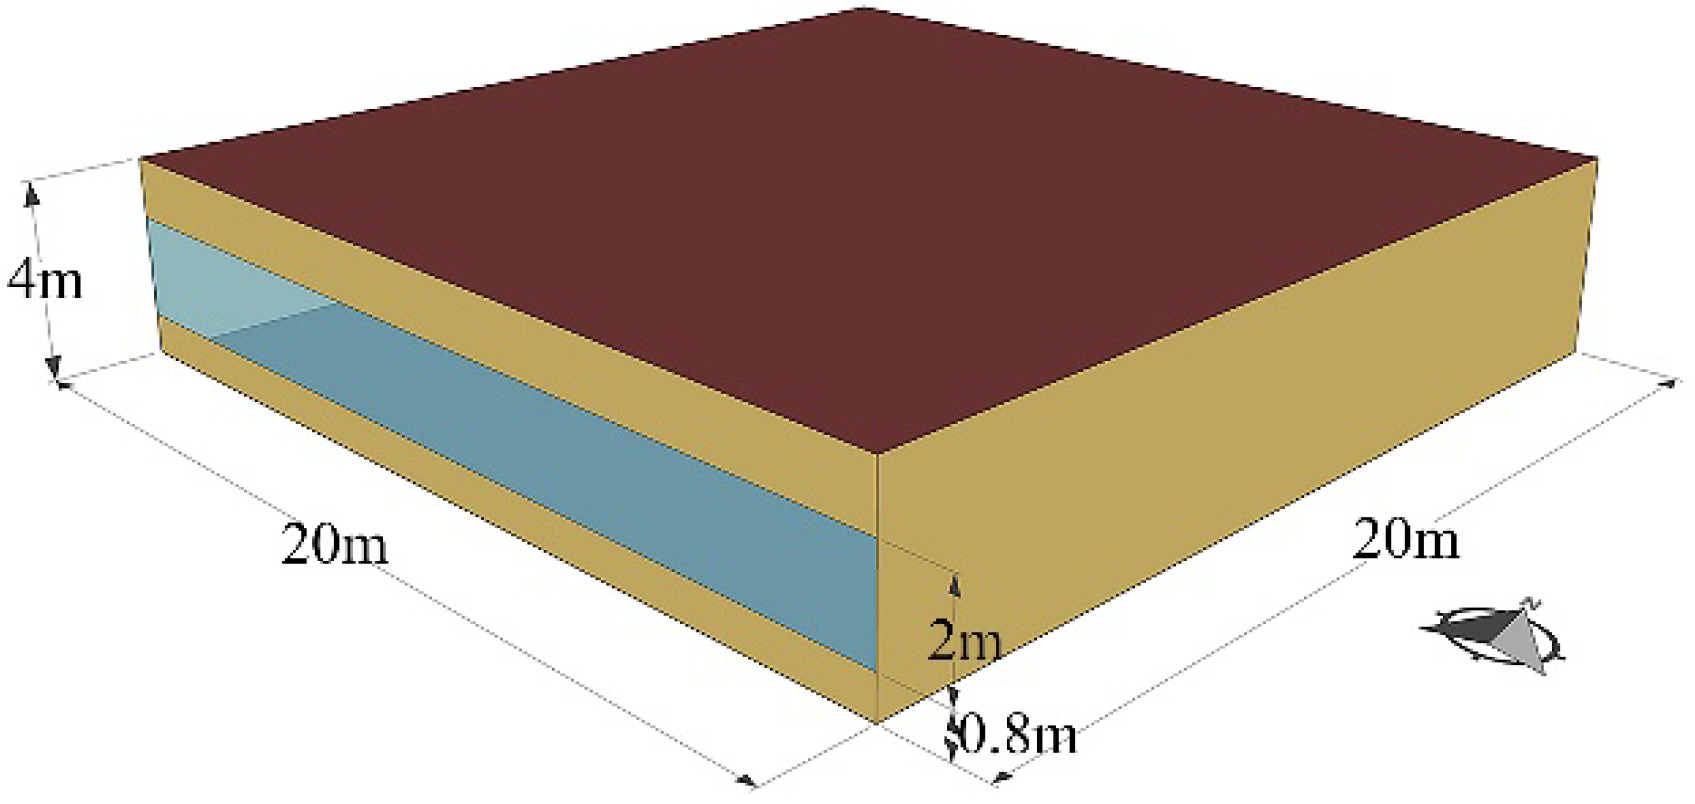
Figure 3.
Schematic diagram of the energy calculation model in EnergyPlus.
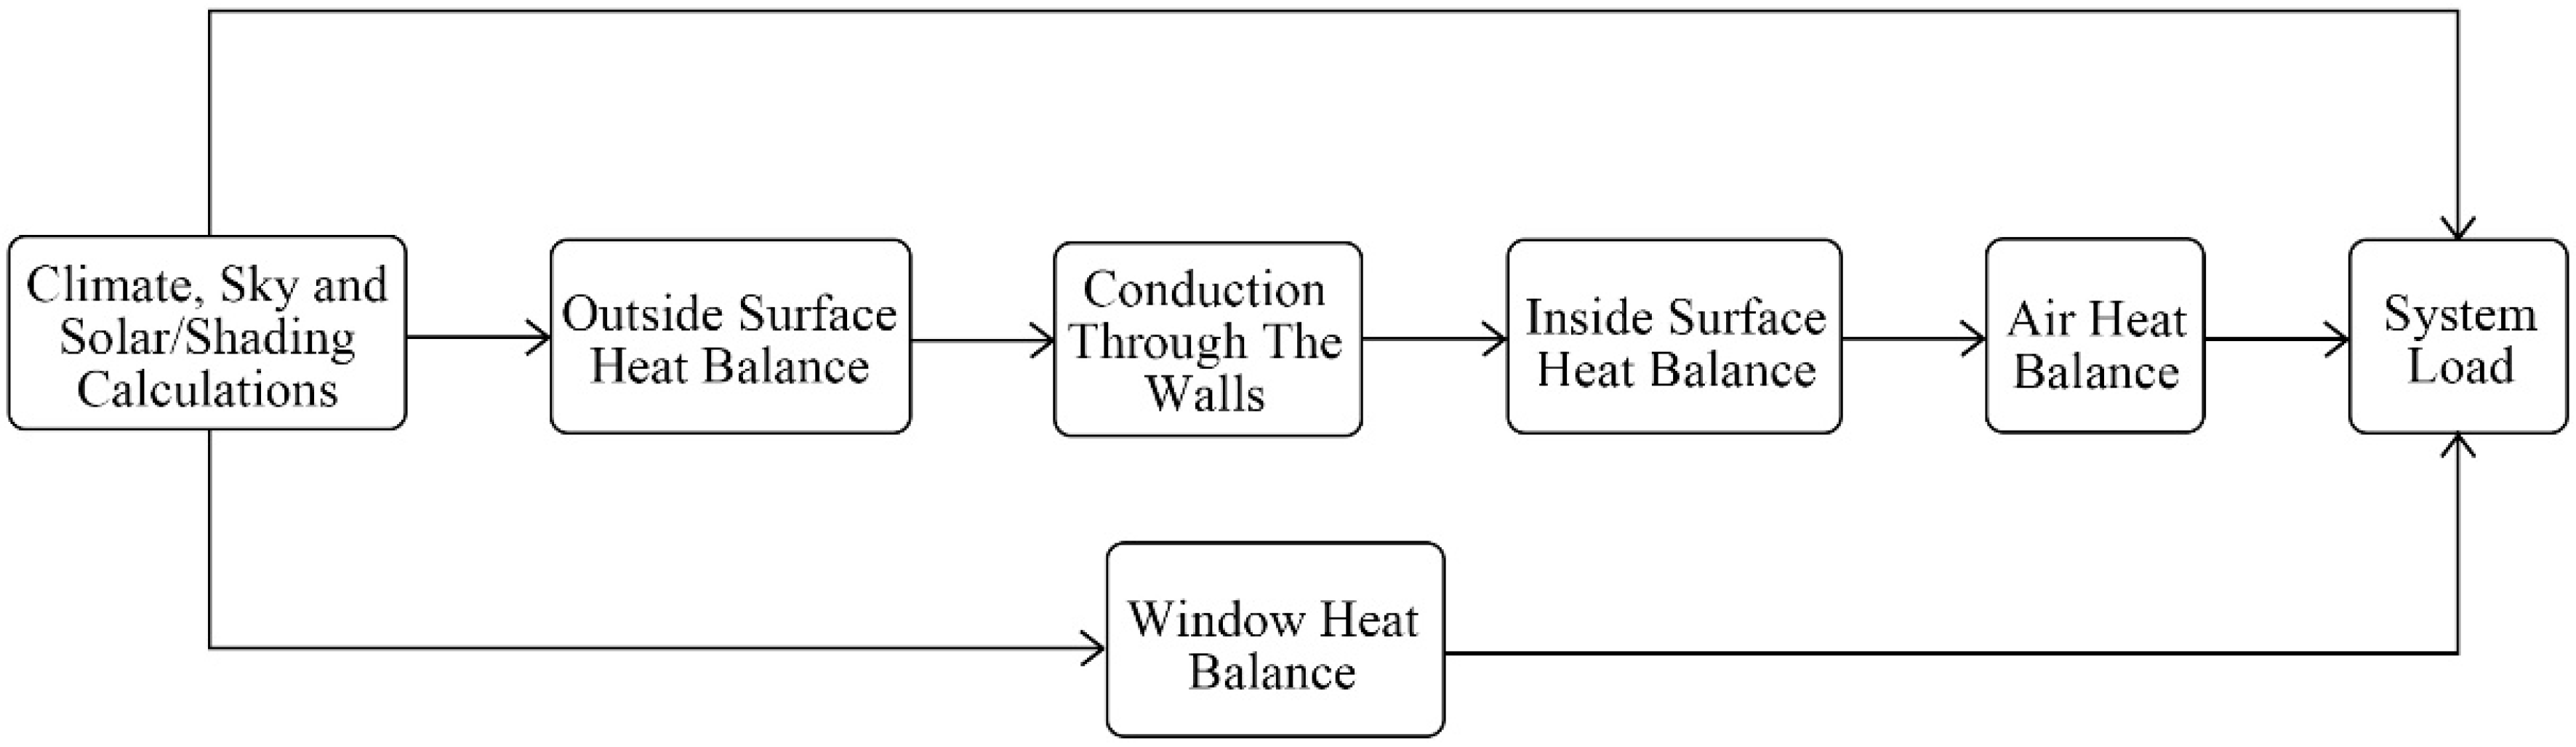
Figure 4.
Regression analysis of the annual energy consumption and wall conductivity.

Figure 5.
Relationship between orientation of the standard building and the annual energy consumption.
Figure 5.
Relationship between orientation of the standard building and the annual energy consumption.

Figure 6.
Relationship between floor height of the standard building and the annual energy consumption.
Figure 6.
Relationship between floor height of the standard building and the annual energy consumption.
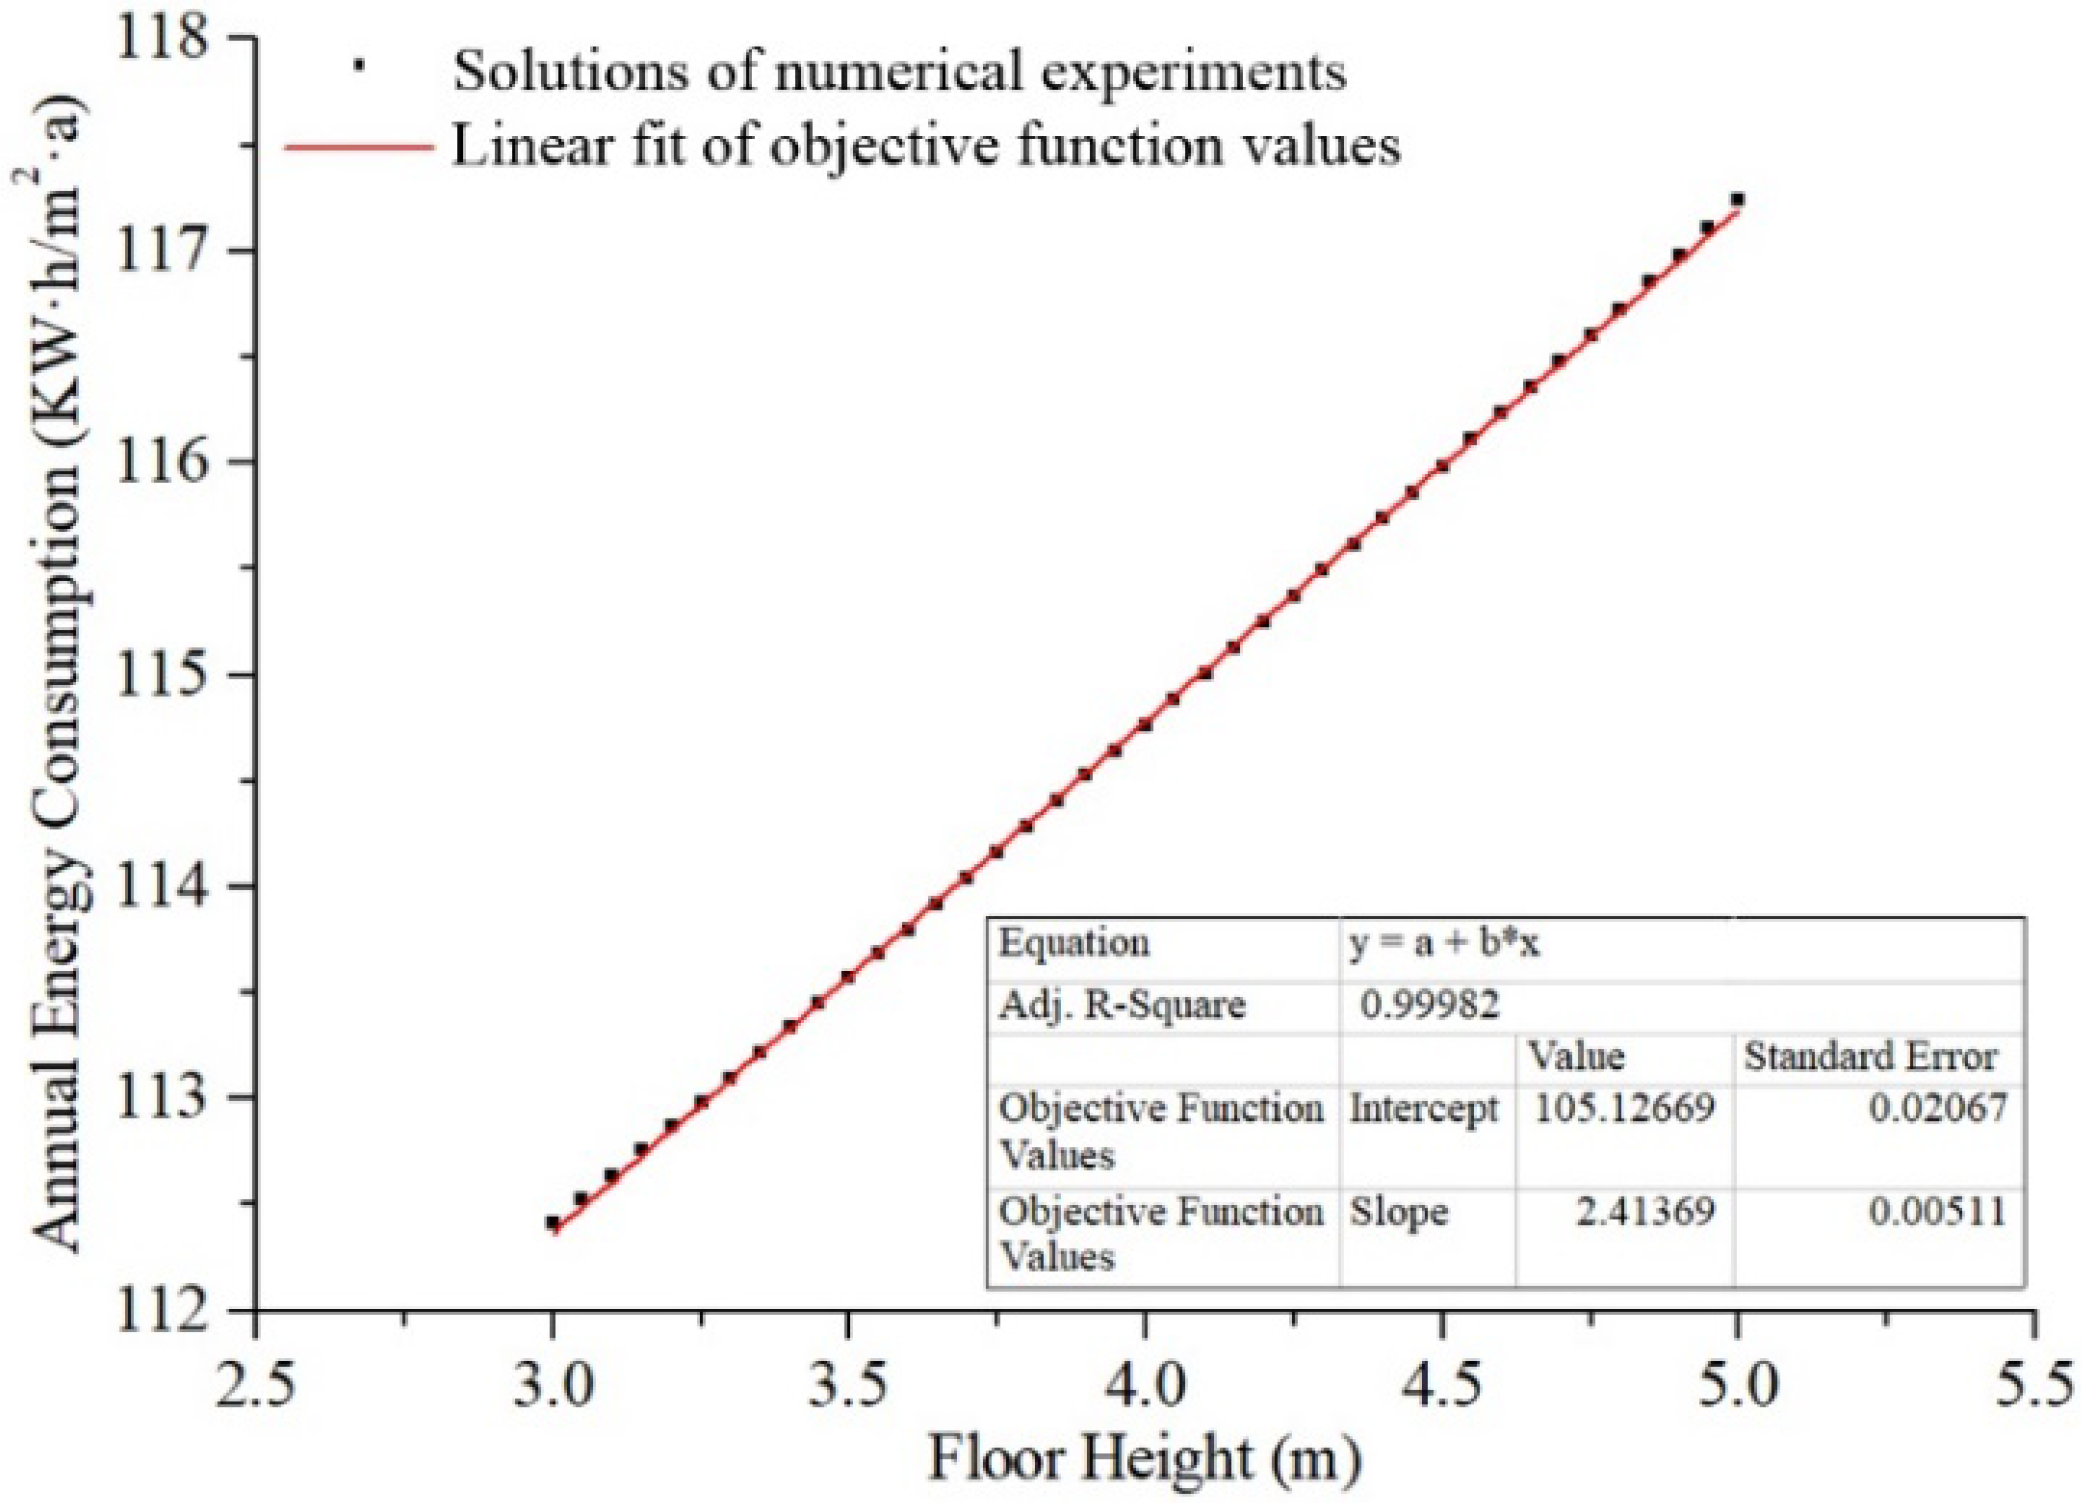
Figure 7.
Architectural schematic view of the modified standard building used in Test 4.

Figure 8.
Relationship between aspect ratio of the standard building and the annual energy consumption.
Figure 8.
Relationship between aspect ratio of the standard building and the annual energy consumption.
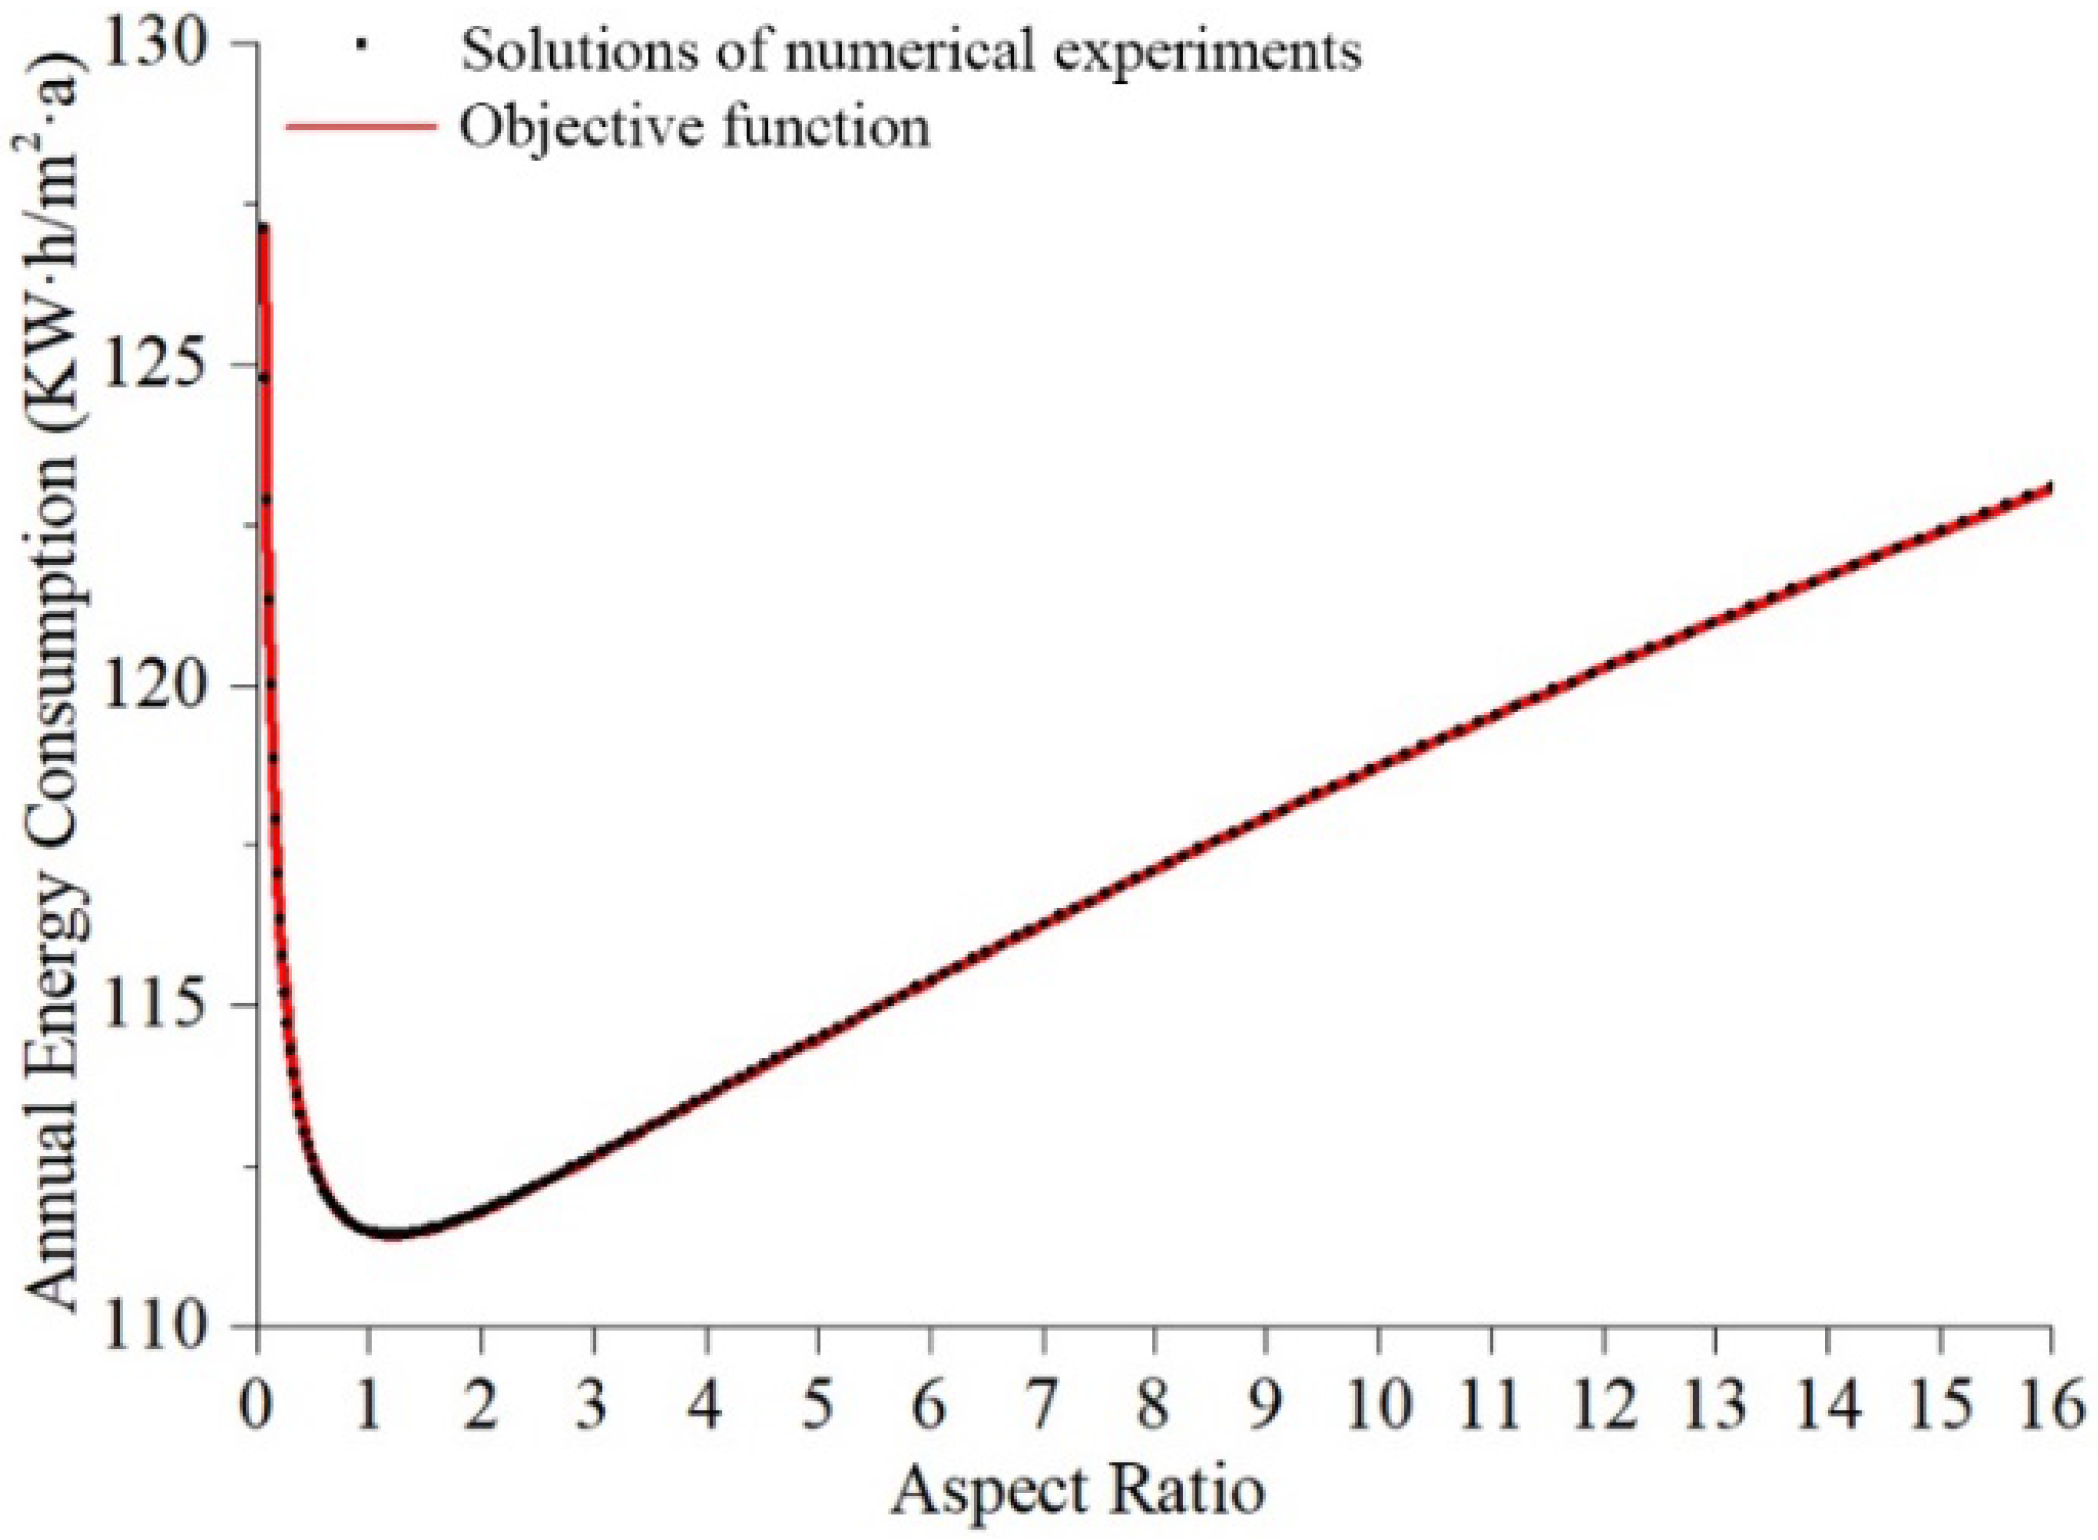
Figure 9.
Relationship between building orientation, wall conductivity and annual energy consumption of the standard building.
Figure 9.
Relationship between building orientation, wall conductivity and annual energy consumption of the standard building.
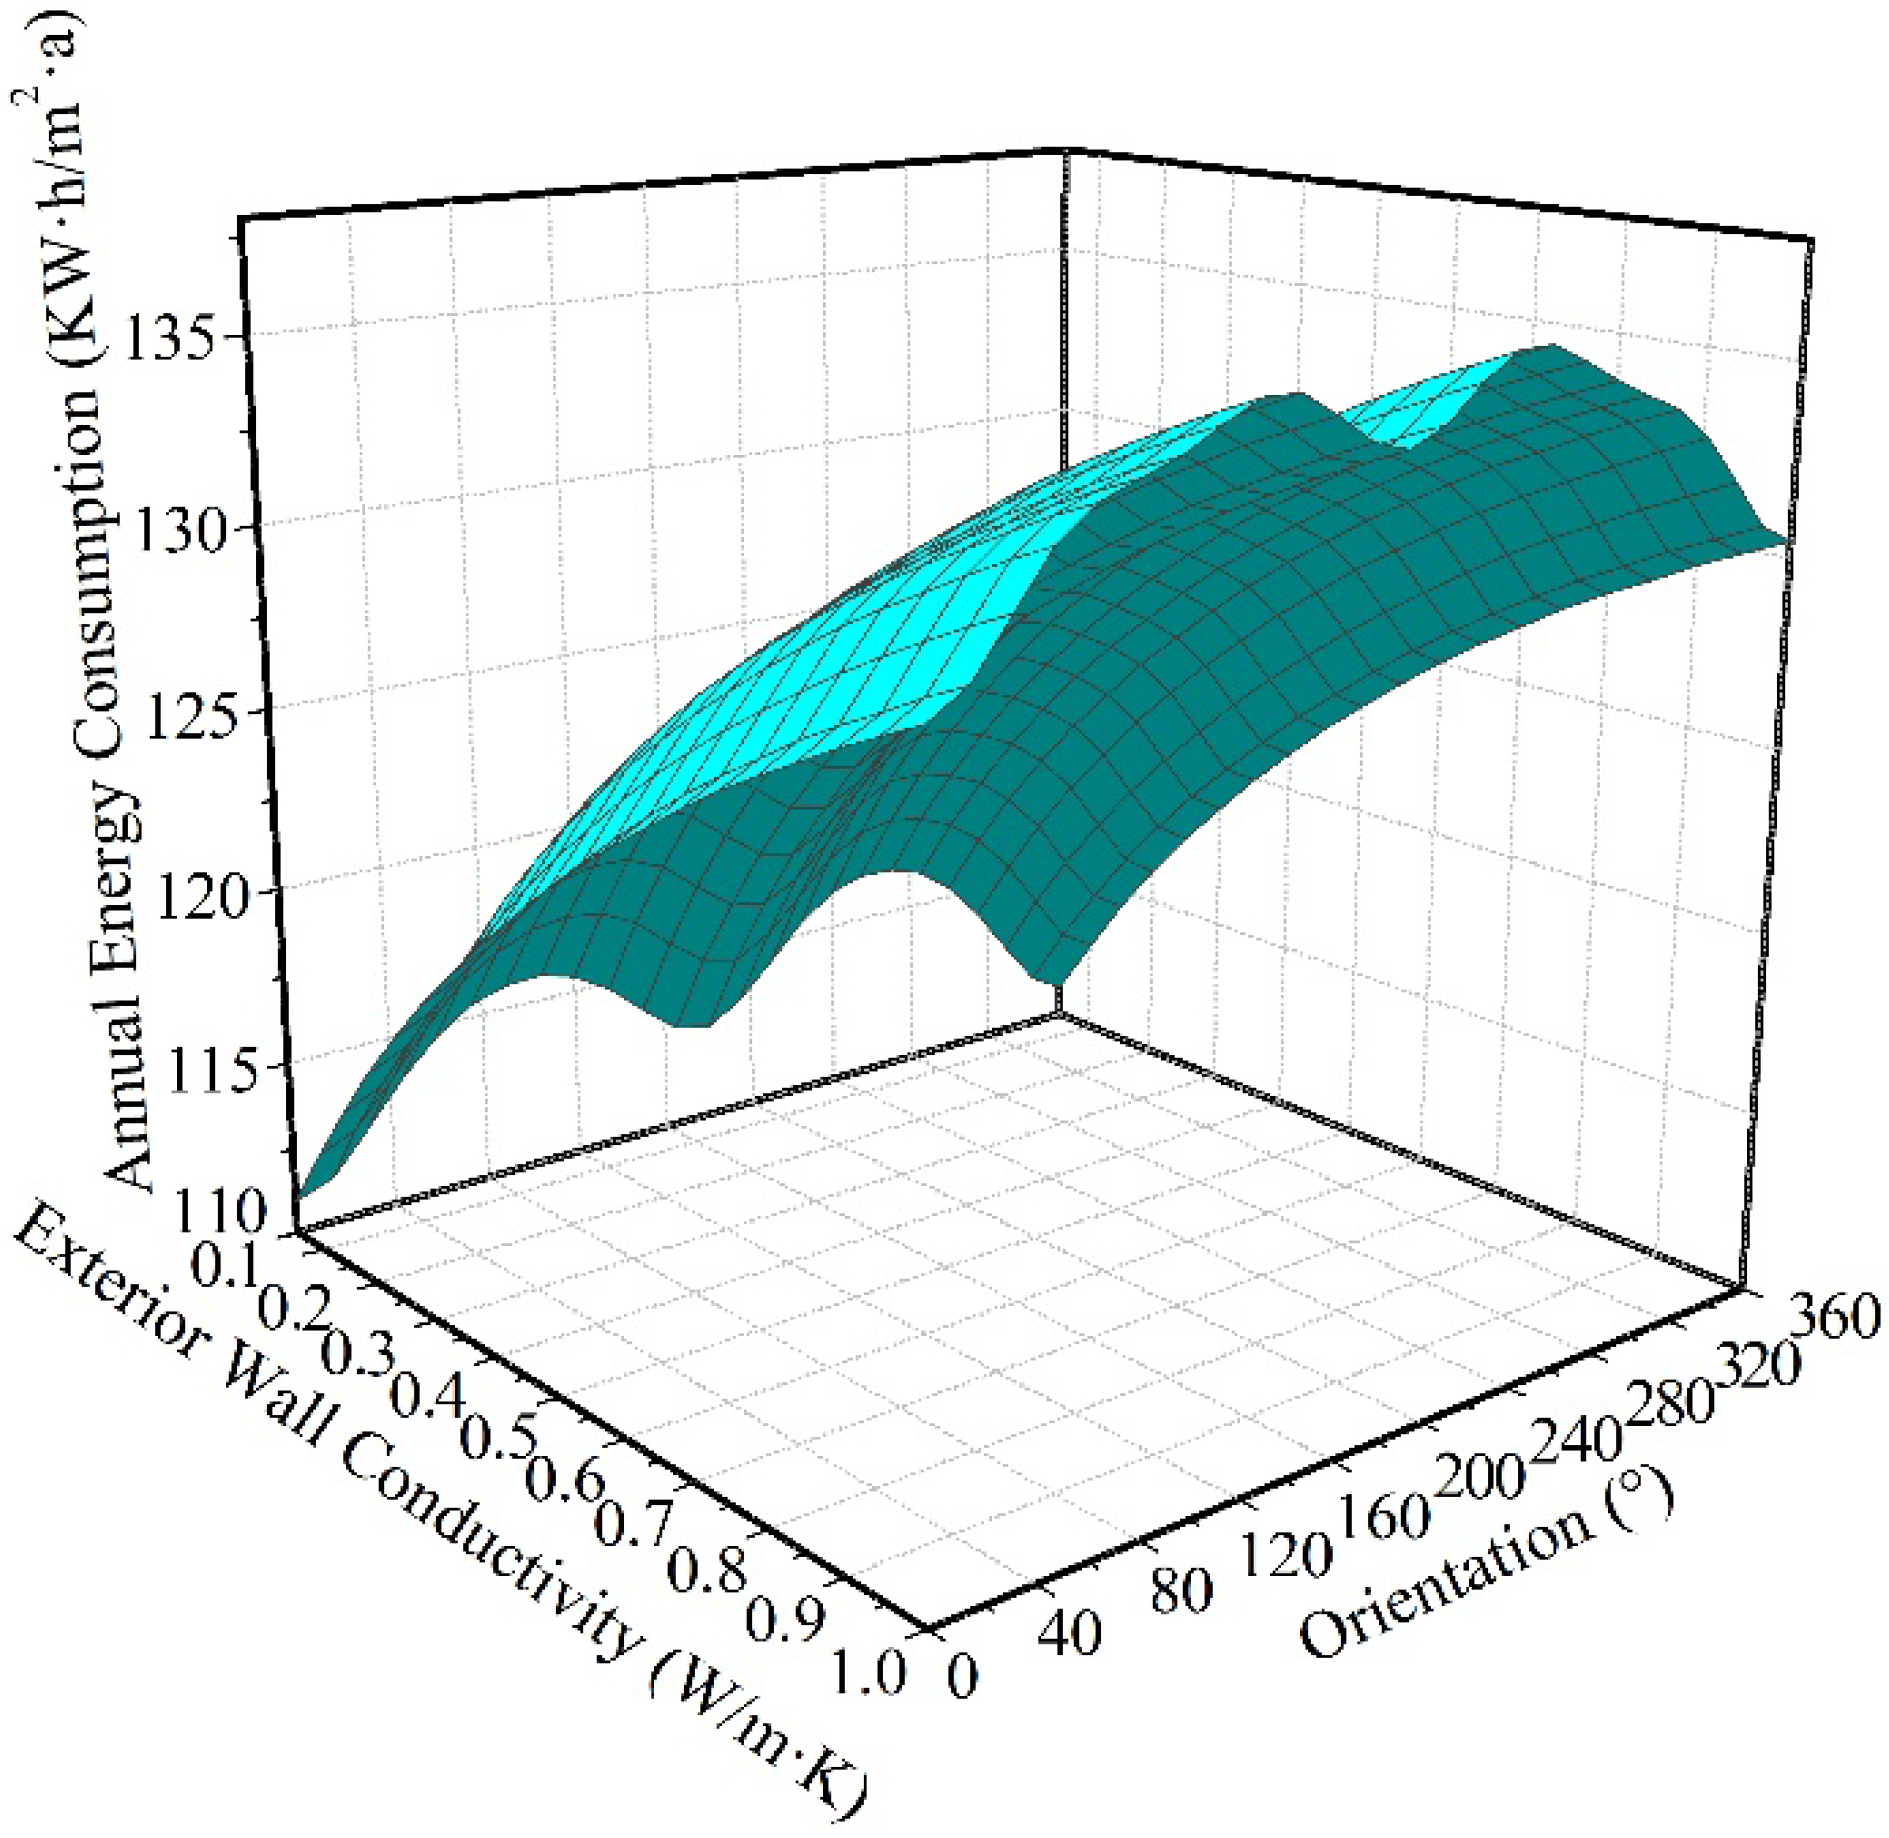
Figure 10.
Relationship between wall conductivity, cooling setpoint and annual energy consumption.

Figure 11.
Number of simulations required by each algorithm before finding the optimal solution for each test problem.
Figure 11.
Number of simulations required by each algorithm before finding the optimal solution for each test problem.


Table 1.
Specifications of optimization variables in each test problem.
| Test Problems | Design Variables | Symbol | Unit | Step Size | Range | Initial Solution | True Optimum | ||
|---|---|---|---|---|---|---|---|---|---|
| x1 | f(X1) | x* | f(X*) | ||||||
| Test 1 | Wall Conductivity | x1 | W/m·K | 0.008 | 0.02–0.3 | 0.225 | 116.700 | 0.02 | 109.741 |
| Test 2 | Orientation | x2 | ° | 8 | 0–360 | 120 | 120.082 | 1 | 114.760 |
| Test 3 | Floor height | x3 | m | 0.2 | 3–5 | 4.5 | 120.082 | 3 | 112.409 |
| Test 4 | Length of south wall (Aspect ratio) | x4 | m | 4 | 5–80 | 60 | 117.931 | 22 | 111.423 |
| Test 5 | Wall Conductivity | x5 | W/mK | 0.008 | 0.02–0.3 | 0.225 | 121.277 | 0.02 | 109.834 |
| Orientation | x6 | ° | 8 | 0–360 | 148 | 1 | |||
| Test 6 | Wall Conductivity | x7 | W/m·K | 0.008 | 0.02–0.3 | 0.225 | 194.847 | 0.02 | 68.922 |
| Cooling Setpoint | x8 | °C | 1 | {20, 21, …, 39, 40} | 20 | 40 | |||
Table 2.
Summary of six test problems and their properties.
| Test Problems | Properties of Test Problems |
|---|---|
| Test 1 | Single-dimensional, Non-linear, Uni-modal, Non-convex, Continuous |
| Test 2 | Single-dimensional, Non-linear, Multimodal, Convex, Non-convex, Continuous |
| Test 3 | Single-dimensional, Linear, Continuous |
| Test 4 | Single-dimensional, Non-linear, Uni-modal, Convex, Continuous |
| Test 5 | Multi-dimensional, Non-linear, Multimodal, Convex, Non-convex, Continuous |
| Test 6 | Multi-dimensional, Non-linear, Uni-modal, Non-convex, Discrete |
Table 3.
Optimal solution x’, its objective function value f(x’), and number of simulations m before finding the optimum for each optimization run.
Table 3.
Optimal solution x’, its objective function value f(x’), and number of simulations m before finding the optimum for each optimization run.
| Variable | Unit | Algorithm | ||||
|---|---|---|---|---|---|---|
| Discrete Armijo Gradient | Hooke-Jeeves | PSO | Hybrid PSO and Hooke-Jeeves | |||
| Run Index | 1–6 | 1–6 | 1–6 | 1–6 | ||
| Test1 | m | - | 206 | 23 | 7 | 100 |
| x1’ | W/mK | 0.02002 | 0.02 | 0.025 | 0.02 | |
| f(x1’) | kWh/m2a | 109.838 | 109.741 | 110.008 | 109.741 | |
| Test 2 | m | - | 66 | 12 | 7 | 84 |
| x2’ | ° | 175.953 | 176 | 0 | 1 | |
| f(x2’) | kWh/m2a | 117.805 | 117.804 | 114.762 | 114.760 | |
| Test 3 | m | - | 226 | 11 | 7 | 89 |
| x3’ | m | 3 | 3 | 3.1 | 3 | |
| f(x3’) | kWh/m2a | 112.409 | 112.409 | 112.639 | 112.409 | |
| Test 4 | m | - | 123 | 18 | 51 | 86 |
| x4 | m | 22.044 | 22 | 24 | 22 | |
| f(x4’) | kWh/m2a | 111.424 | 111.423 | 111.468 | 111.423 | |
| Test 5 | m | - | - | 50 | 225 | 98 |
| x5’ | W/mK | - | 0.02 | 0.025 | 0.02 | |
| x6’ | ° | - | 176 | 356 | 360 | |
| f(x5’, x6’) | kWh/m2a | - | 111.152 | 110.07 | 109.838 | |
| Test 6 | m | - | - | - | 295 | 105 |
| x7’ | W/mK | - | - | 0.071 | 0.02 | |
| x8’ | ℃ | - | - | 40 | 40 | |
| f(x7’, x8’) | kWh/m2a | - | - | 72.941 | 68.922 | |
Table 4.
The calculated values of d(X*, X’) and g(f(X*), f(X’)) obtained by each algorithm for each test problem.
Table 4.
The calculated values of d(X*, X’) and g(f(X*), f(X’)) obtained by each algorithm for each test problem.
| Test 1 | Test 2 | Test 3 | Test 4 | Test 5 | Test 6 | |||||||
|---|---|---|---|---|---|---|---|---|---|---|---|---|
| d(X*, X’) | g(f(X*), f(X’)) | d(X*, X’) | g(f(X*), f(X’)) | d(X*, X’) | g(f(X*), f(X’)) | d(X*, X’) | g(f(X*), f(X’)) | d(X*, X’) | g(f(X*), f(X’)) | d(X*, X’) | g(f(X*), f(X’)) | |
| Discrete Armijo gradient | 0.00007 | 0.00088 | 0.48598 | 0.02653 | 0 | 0 | 0.00059 | 0.000009 | - | - | - | - |
| Hooke-Jeeves | 0 | 0 | 0.48611 | 0.02653 | 0 | 0 | 0 | 0 | 0.48611 | 0.012 | - | - |
| PSO | 0.01786 | 0.00243 | 0.00278 | 0.00002 | 0.05 | 0.00205 | 0.02667 | 0.0004 | 0.98627 | 0.00215 | 0.1821 | 5.831 |
| Hybrid PSO and Hooke-Jeeves | 0 | 0 | 0 | 0 | 0 | 0 | 0 | 0 | 0.99722 | 0.00004 | 0 | 0 |
Table 5.
Standard deviations of all solutions searched by each algorithm for each test problem.
| Algorithms | Test 1 | Test 2 | Test 3 | Test 4 | Test 5 | Test 6 | ||||
|---|---|---|---|---|---|---|---|---|---|---|
| SD1’ | SD2’ | SD3’ | SD4’ | SD5’ | SD6’ | SD5’* SD6’ | SD7’ | SD8’ | SD7’* SD8’ | |
| Discrete Armijo gradient | 0.328 | 0.079 | 0.331 | 0.209 | - | - | - | - | - | |
| Hooke-Jeeves | 0.107 | 0.016 | 0.085 | 0.062 | 0.133 | 0.01 | 0.001 | - | - | - |
| PSO | 0.184 | 0.311 | 0.175 | 0.127 | 0.234 | 0.25 | 0.058 | 0.205 | 0.256 | 0.052 |
| Hybrid PSO and Hooke-Jeeves | 0.193 | 0.283 | 0.193 | 0.133 | 0.219 | 0.238 | 0.052 | 0.322 | 0.341 | 0.11 |
Table 6.
Summary of algorithm performance for the six test problems under four indices.
| Discrete Armijo Gradient | Hooke-Jeeves | |||||||
|---|---|---|---|---|---|---|---|---|
| Stability | Validity | Speed | Coverage | Stability | Validity | Speed | Coverage | |
| Test 1 | G | G | P | G | G | G | G | P |
| Test 2 | G | P | F | P | G | P | G | P |
| Test 3 | G | G | P | G | G | G | G | P |
| Test 4 | G | G | P | G | G | G | G | P |
| Test 5 | - | - | - | - | G | P | G | P |
| Test 6 | - | - | - | - | - | - | - | - |
Notes: G indicates good performance; F indicates fair performance; P indicates poor performance.
Table 7.
Summary of algorithm performance for the six test problems under four indices.
| PSO | Hybrid PSO and Hooke-Jeeves | |||||||
|---|---|---|---|---|---|---|---|---|
| Stability | Validity | Speed | Coverage | Stability | Validity | Speed | Coverage | |
| Test 1 | G | F | G | G | G | G | F | G |
| Test 2 | G | F | G | G | G | G | F | G |
| Test 3 | G | F | G | G | G | G | F | G |
| Test 4 | G | F | G | G | G | G | F | G |
| Test 5 | G | F | P | F | G | F | F | F |
| Test 6 | G | F | P | P | G | G | F | G |
Notes: G indicates good performance; F indicates fair performance; P indicates poor performance.
© 2018 by the authors. Licensee MDPI, Basel, Switzerland. This article is an open access article distributed under the terms and conditions of the Creative Commons Attribution (CC BY) license (http://creativecommons.org/licenses/by/4.0/).
Share and Cite
MDPI and ACS Style
Si, B.; Tian, Z.; Chen, W.; Jin, X.; Zhou, X.; Shi, X. Performance Assessment of Algorithms for Building Energy Optimization Problems with Different Properties. Sustainability 2019, 11, 18. https://doi.org/10.3390/su11010018
AMA Style
Si B, Tian Z, Chen W, Jin X, Zhou X, Shi X. Performance Assessment of Algorithms for Building Energy Optimization Problems with Different Properties. Sustainability. 2019; 11(1):18. https://doi.org/10.3390/su11010018
Chicago/Turabian StyleSi, Binghui, Zhichao Tian, Wenqiang Chen, Xing Jin, Xin Zhou, and Xing Shi. 2019. "Performance Assessment of Algorithms for Building Energy Optimization Problems with Different Properties" Sustainability 11, no. 1: 18. https://doi.org/10.3390/su11010018
Note that from the first issue of 2016, this journal uses article numbers instead of page numbers. See further details here.