Decarbonisation of Urban Freight Transport Using Electric Vehicles and Opportunity Charging


1
Civil Engineering and Geosciences, Delft University of Technology, 2628 CN Delft, The Netherlands
2
Resource and Risk Management, Neu-Ulm University of Applied Sciences, 89231 Neu-Ulm, Germany
3
School of Civil & Environmental Engineering, Nanyang Technological University, Singapore 639798, Singapore
*
Author to whom correspondence should be addressed.
Sustainability 2018, 10(9), 3258; https://doi.org/10.3390/su10093258
Submission received: 16 June 2018
/
Revised: 6 September 2018
/
Accepted: 7 September 2018
/
Published: 12 September 2018
(This article belongs to the Special Issue Sustainable Freight Transport)
Abstract
:The high costs of using electric vehicles (EVs) is hindering wide-spread adoption of an EV-centric decarbonisation strategy for urban freight transport. Four opportunity charging (OC) strategies—during breaks and shift changes, during loading activity, during unloading activity, or while driving on highways—are evaluated towards reducing EV costs. The study investigates the effect of OC on the lifecycle costs and carbon dioxide emissions of four cases of different urban freight transport operations. Using a parametric vehicle model, the weight and battery capacity of operationally suitable fleets were calculated for ten scenarios (i.e., one diesel vehicle scenario, two EV scenarios without OC, and seven EV scenarios with four OC strategies and two charging technology types). A linearized energy consumption model sensitive to vehicle load was used to calculate the fuel and energy used by fleets for the transport operations. OC was found to significantly reduce lifecycle costs, and without any strong negative influence on carbon dioxide emissions. Other strong influences on lifecycle costs are the use of inductive technology, extension of service lifetime, and reduction of battery price. Other strong influences on carbon dioxide emissions are the use of inductive technology and the emissions factors of electricity production.
1. Introduction
International commitments to reduce carbon dioxide (CO2) emissions—the most common and pervasive greenhouse gas—has fuelled efforts to decarbonize the freight transport sector. For long-distance transport, such as intercity, regional, national or international transport, efforts to reduce CO2 emissions focus more on the shift to rail or waterways. Nevertheless, alternatives for urban freight transport (UFT) remain limited. One option, the use of battery electric vehicles (BEVs) in UFT is still lagging behind [1], despite its advantages in eliminating local air pollution [2], its relatively quiet [3] and more energy efficient [4] operations, and its capability to use renewable energy sources [5]. Furthermore, recent studies have demonstrated the effectiveness of the BEV-based freight transport to reduce CO2 emissions, even while accounting for different energy production methods [6].
A wide-spread adoption of BEVs for freight transport faces technical and market-related challenges. Currently, the battery is seen as the limiting factor, linked to tightly constrained operational performance—due to a mix of limited driving distance and slow recharging time—and the high cost of the vehicle [7,8,9]. Besides the reduced driving distance compared to internal combustion engine vehicles, the addition of the battery also reduces its payload capacity, constrained by a fixed upper weight limit [10]. Further, the ecosystem that supports electric vehicles, such as maintenance and refuelling stations, is absent in many cities (and countries) that would otherwise be conducive for BEV operations [11]. While some governments have succeeded in incentivizing BEV adoption through subsidies for purchases, fiscal measures on fuel, sponsoring BEV trials, and penalizing conventional vehicles [12,13,14], these measures mainly affect the economic calculation for vehicle choice. They do not affect its operational capabilities. Coping with operational limitations is left to the logistics companies to manage. They have devised a range of strategies to compensate for the shortcomings of BEVs, as shall be explained next.
Fleet managers can deal with the operational limitations of the BEV in four ways: (1) reduce their scope of services, (2) modify transport operations, (3) modify vehicle, and (4) use opportunity charging (OC). Table 1 summarizes the specific measures and selected references to recent studies analysing or discussing them.
The first and second strategy works within the limitations of the BEV. Reducing the scope of services aims at eliminating unprofitable routes or operations. The business, as a whole, may suffer, as revenues are expected to reduce along with the services provided. The same set of customers is served in the second strategy, but with significant changes with respect to how the vehicles are used. The third strategy adapts the vehicle’s capability to the operational demands, in some cases compromising its pure electric operation. Retrofitted vehicles make use of modularity of their battery systems to provide their operators with the battery capacity they need. However, increasing the battery capacity significantly increases the overall purchase price of the BEV and reduces the payload capacity. The fourth strategy, using OC, integrates quick recharging events during working hours. This contrasts with the conventional time for charging, i.e., at night-time, outside of working hours. OC reduces the need for a large on-board battery, by increasing the dependence on external charging infrastructure. It effectively reduces the driving range requirement from the daily driving distance to the distances between the locations of two planned charging activities. The next opportunity for the recharging activity depends on the extent and availability of charging infrastructure, the type of equipment needed on the vehicle, and the pattern of vehicle usage (in time and within the transport network).
In comparison to other strategies, OC maintains the transport service capability, preserves the benefits of the pure electric drive, reduces the purchase cost of the BEV, maintains the operational capability (i.e., driving range and payload capacity), does not disrupt the existing operation schedule, and does not require additional logistics facilities. In general, the downsides of OC are dependence on availability of charging infrastructure and upgrades of electrical infrastructure to support fast charging, faster degradation of the battery, lower overall energy efficiency, and higher CO2 emissions.
Evaluation studies currently do not consider the wide-range of possibilities to integrate fast-charging into BEV operations. This is regrettable, as different types of OC—depending also on the specifics of where and how they are incorporated—will have different compatibility with different UFT types. Companies willing to experiment with OC are therefore currently still left without comprehensive academic studies in support or in opposition to these options.
Hence, this paper aims to fill this gap by systematically deriving a set of OC strategies and technologies for supporting the use of BEVs in UFT and by evaluating the application of OC in consideration of financial and environmental criteria. The research questions are thus formulated as follows:
- (1)
- To what extent does OC improve the BEV business case for UFT operators?
- (2)
- To what extent does OC affect the decarbonisation benefits of the BEV for UFT operations?
The approach is applied to four different cases of UFT operations modelled according to real-world company data [22]. In the evaluation, the scenarios using OC are compared to scenarios using diesel vehicles, and to scenarios using BEVs but without the use of OC, thus providing evidence on the utility of OC in comparison to just enhancements to the vehicle or battery technology.
The next section is devoted to describing the methodology of the study: the case study descriptions, vehicle usage model, electric mobility system model, and indicator calculation. In Section 3, the results of the case study are presented: the modelled vehicle usage, the electric mobility system specifications, and calculated indicators representing the business case and the decarbonisation benefits. In Section 4, methodology and results are discussed critically in the broader context of BEV studies. Section 5 provides the general conclusions of the investigation, and recommendations for further research.
2. Methodology
Existing studies evaluating BEVs for UFT usually follow three main approaches, each at different levels of detail and emphasis: evaluation of vehicle class [6,23,24,25], operation-type [2,18], and detailed vehicle usage [15,17,26]. In the evaluation of vehicle class, the BEV is evaluated on the basis of a reference distance of the target vehicle class, such as daily distances of “48–6 km” for a medium-duty vehicle [6]. In the operation-type evaluation, the BEV is evaluated on the basis of simple transport operation scenarios, such as a simplified intermodal truck transport [2]. The detailed vehicle usage approach is evaluated according to micro-level usage of the vehicle, typically using an operations research model [15,17].
This study follows the detailed vehicle usage approach, which consists of the following sequence of steps:
- (1)
- Define urban logistics scenario;
- (2)
- Model vehicle movement for a representative time-period;
- (3)
- Calculate energy consumption for vehicle operation;
- (4)
- Calculate key performance indicators; and
- (5)
- Evaluate indicators according to objectives.
2.1. Case Studies of Urban Freight Transport
A case study approach, in which the UFT activities of singular cases are modelled, was chosen because it would allow for a more specific look at how the characteristics of UFT operations influence their compatibility with BEVs [27]. The four case studies that were selected for the evaluation are summarized in Table 2. Each case is operated on the main island of Singapore.
For each case, a logistics planner (or equivalent role) was interviewed to collect data used to model their UFT operations for a single day. The most detailed data obtained was for Case A, which provided itineraries of deliveries and collections performed by their fleet for one day. When addresses could not be obtained from the interviewee or websites, a randomized selection was performed using QGIS’ built-in random selection tool in order to emulate a realistic transport demand.
2.2. Vehicle Usage Model
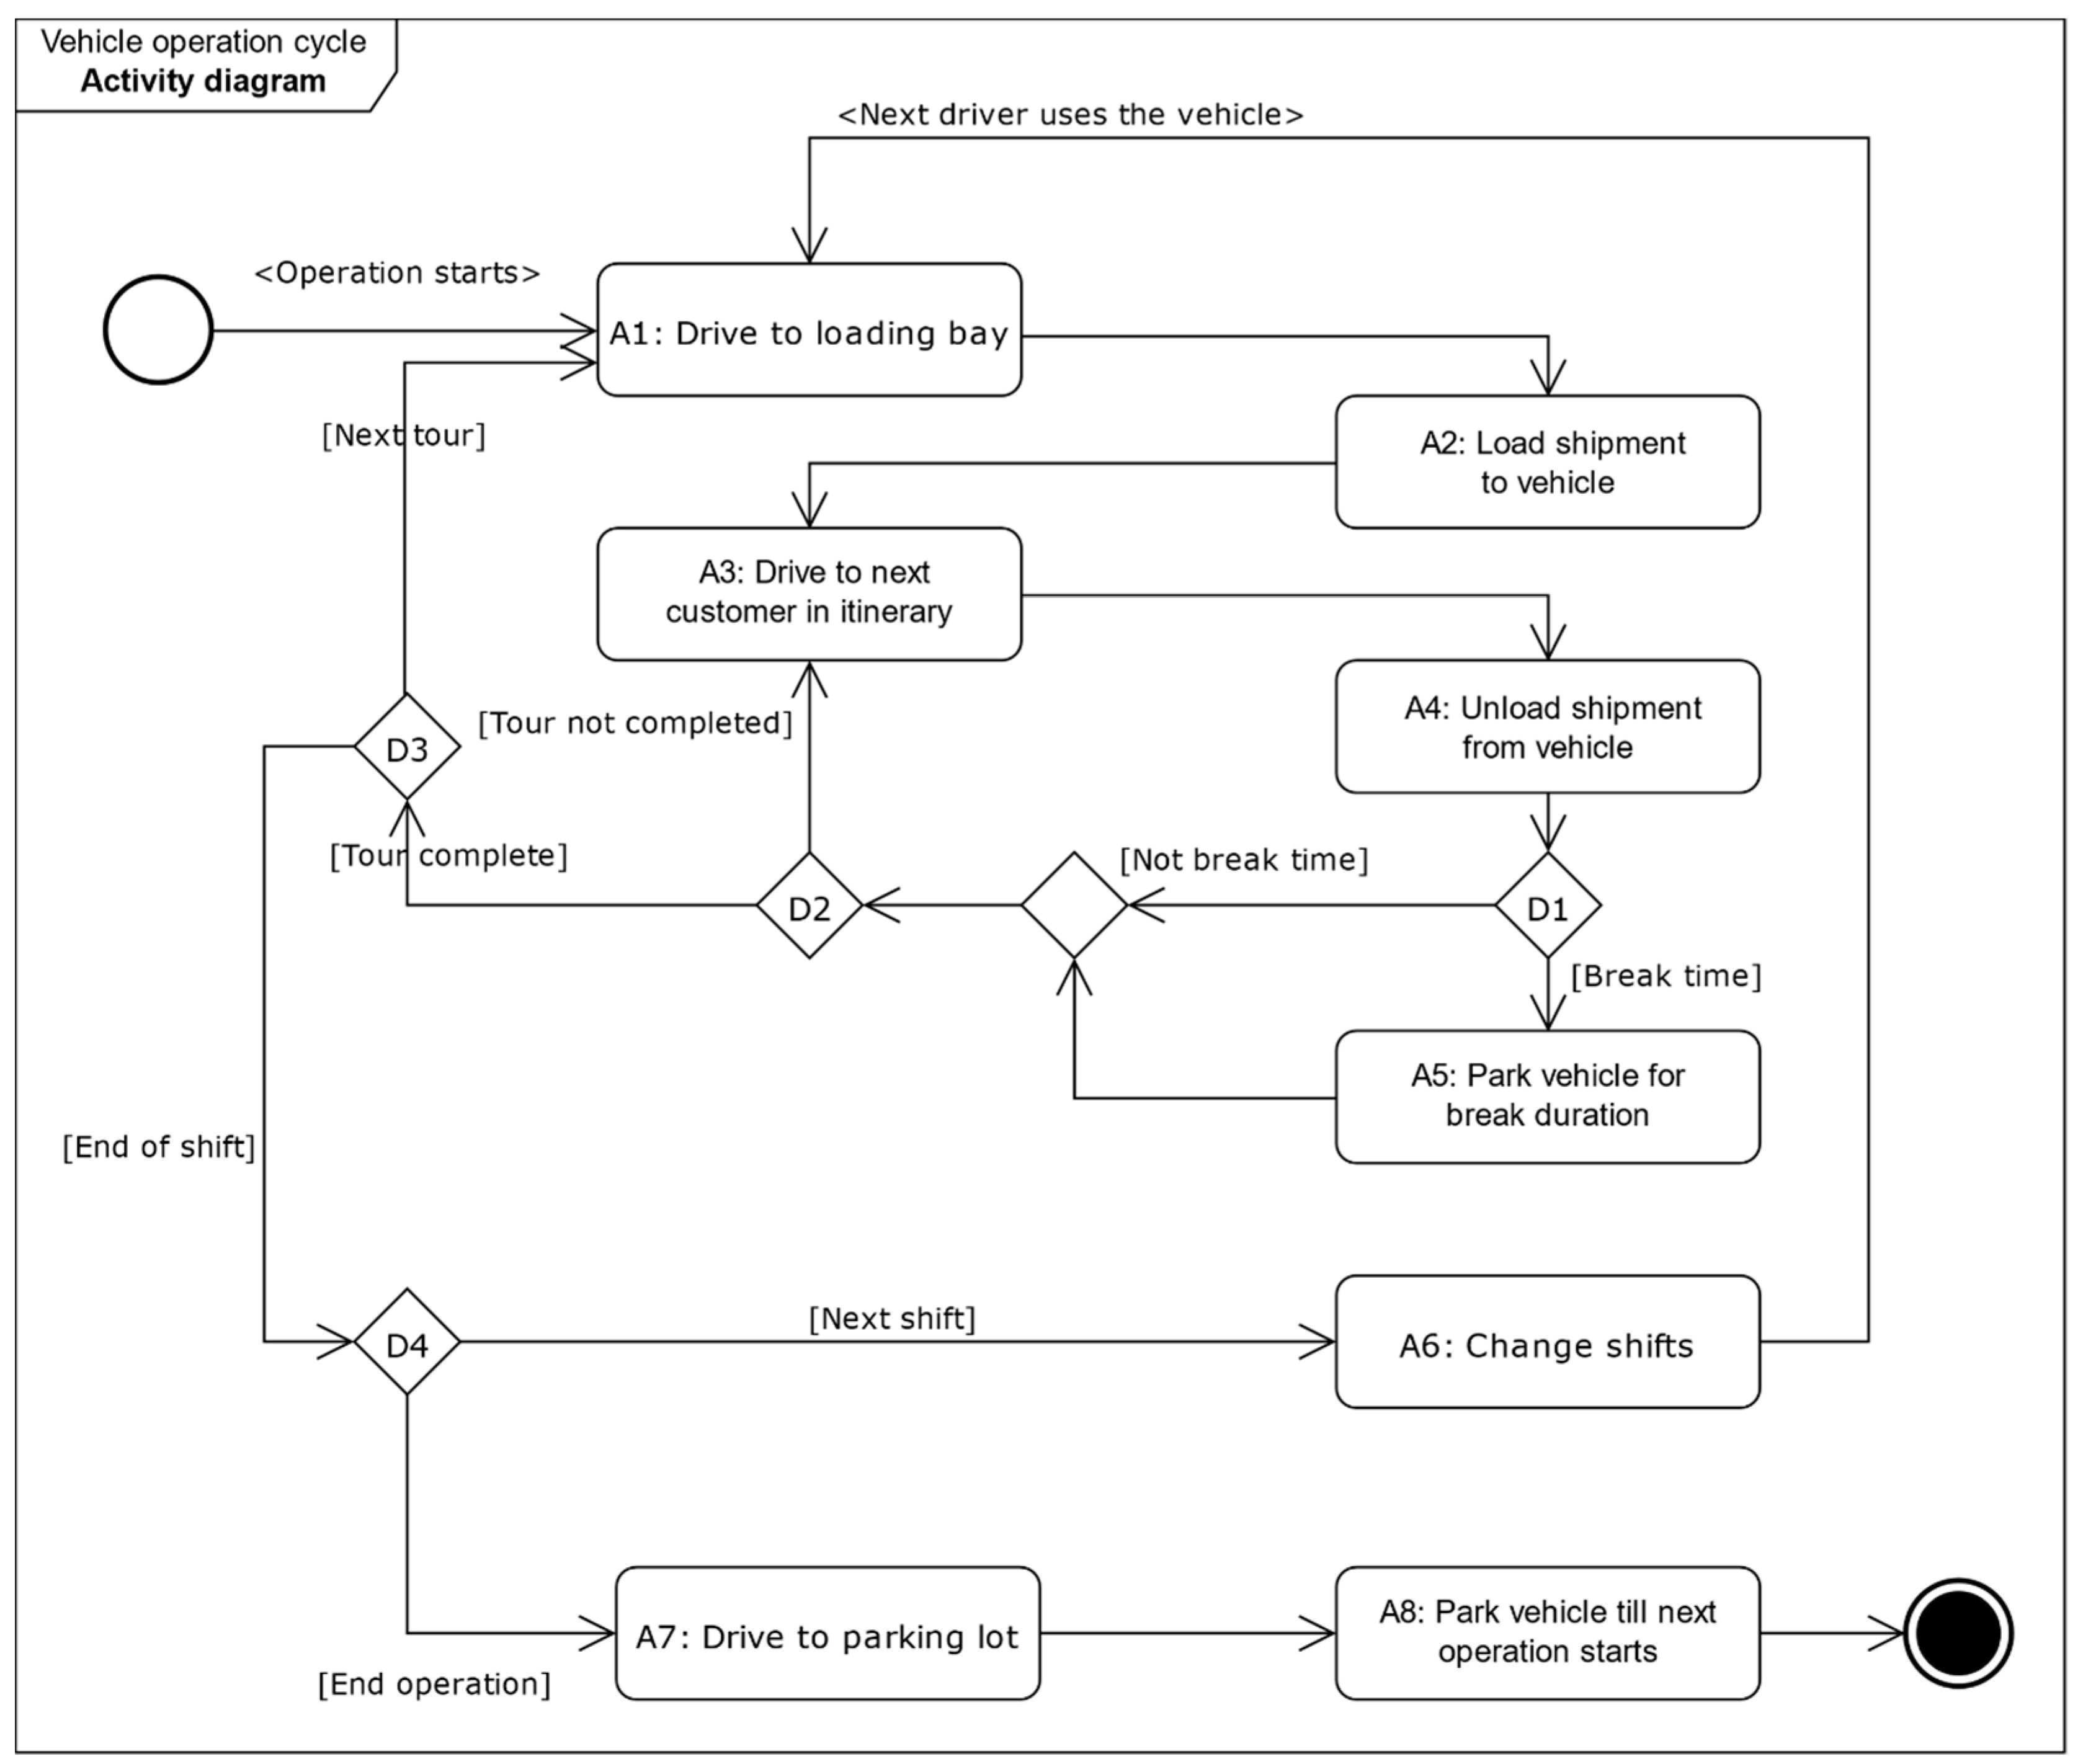
Based on the information obtained, a full work-day vehicle usage schedule was modelled for each case study. A vehicle’s usage mirrors the activity of the drivers assigned to it. The vehicle usage model shows the sequence of activities that the driver carries out while driving the vehicle (see Figure 1), with corresponding duration and distance travelled. The vehicle usage model has two main parts: route creation and assignment of routes to each vehicle in the fleet.
Route creation was performed based on a Vehicle Routing Problem model, implemented in the software XCargo by the company LOCOM GmbH, Karlsruhe, Germany. The software used map data of Singapore to calculate distances and synthetic shipment orders (created for each case using the data obtained from interviews, websites, and background literature) to calculate a set of routes that reduces the overall distance travelled. The number of routes created are determined by service area size and spread, vehicle fleet and number of routes of each vehicle in a day.
The routes are then assigned to individual vehicles in the fleet in a way to balance the total assigned route duration of each vehicle. The distance of each route leg is converted into duration based on constant vehicle speeds. The duration of each route is summed from the driving duration of each route leg and the estimated duration for loading and unloading activities.
The route assignment procedure is:
- (1)
- Assign to each vehicle a route starting from the route with the longest duration;
- (2)
- Assign to the vehicle with the lowest total route duration, the next longest duration route; and
- (3)
- Repeat Step 2, until all routes are assigned or if each vehicle has been assigned the maximum number of routes.
The outcomes of the procedure are the average speed- and payload-time profiles of each vehicle in the fleet, throughout its operation. Note that this procedure can be replaced by any other modelling procedure (e.g., agent-based or operations research models) or simply by reproducing the speed- and payload-time profiles, such as by using GPS tracks in combination with vehicle-diaries.
2.3. Model of the Electric Mobility System
There are two technical subsystems of the electric mobility system: the BEV and the charging system. Cost-efficient BEV parameters shall be identified that can fulfil the travel capability requirements vis-à-vis the energy requirements of the battery and the weight dimensions of the vehicle. The BEV parameters are determined under influence of charging scenarios: a combination of the charging system and strategy.
The following sections describe the development of charging scenarios, the calculation method of the BEV parameters under different scenarios, and the calculation of energy usage at the vehicle and charging system level.
2.3.1. Charging Strategy
A key element of the study is to evaluate the effect of OC as affecting the suitability of BEV. Five OC strategies are evaluated:
- “no OC”;
- “OC during break and shift change”;
- “OC during loading activity”;
- “OC during unloading activity”; and
- “OC while driving on highway”.
The first serves as merely a BEV baseline. The BEV is only charged night-time in activity A8. The next three strategies are executed, while the vehicle is stationary, in activities (see Figure 1) A5 & A6, A2, and A4, respectively. The final strategy is performed, while the vehicle is driving on a highway. Note that these OC strategies complement overnight charging, which is assumed in each scenario.
2.3.2. Charging Technology
By considering the energy transfer method (whether conductive or inductive) and in-charging state of motion of the vehicle (whether stationary or dynamic), four general types of charging systems emerge [5]:
- Stationary conductive charging system;
- Dynamic conductive charging system;
- Stationary inductive charging system; and
- Dynamic inductive charging system.
Except for “dynamic conductive charging system”, the other charging systems are evaluated in this study. Conductive charging while the vehicle is moving can work via an overhead catenary system or via a third-rail system. While both are commonly applied in rail, the former is also applied in trolley bus or truck systems. The eHighway program by Siemens is, to date, the only known trial of the trolley-truck concept for general cargo [28]. However, the systems have only been designed for large trucks. One can hypothesize that the fixed height of the catenary system would not be suitable for low vehicles, such as vans and smaller trucks. A third-rail system on the other hand is fairly unexplored as an option, except for a recently initiated project eRoadArlanda by the Swedish Transport Administration [29]. Still, little is known about the technical feasibility of that concept. These dynamic conductive charging systems are thus not considered because of interoperability concerns and current lacklustre support for the concepts.
2.3.3. Vehicle and Charging Scenarios
Given the five charging strategies and available charging systems, nine BEV scenarios are evaluated (see Table 3). In S0, the characteristics of the diesel vehicle (DV) is used. S0 serves as a comparison with the other scenarios. S1 and S2 are scenarios without OC. The BEVs are charged overnight using either the conductive or inductive charging systems.
2.3.4. Parametric BEV Model
In contrast with previous studies that evaluate existing vehicles in the market, the BEVs in this study are adapted to the specified operational requirements of each UFT scenario, i.e., sufficient payload capacity and driving range. The full specifications of the BEV are defined by the gross vehicle weight (GVW), payload capacity, empty weight, battery capacity, and electric motor power. For a given vehicle usage, the amount charged using OC reduces the required battery capacity to fulfil the required driving range. The weight of the battery capacity is calculated by dividing the required battery capacity with the specific energy of 0.14 kWh/kg [30]. The battery weight influences the weight of the rest of BEV, which in turn influences its energy consumption rate while being driven. This circularity requires that the weight, energy consumption and battery capacity be determined simultaneously. The key components on the BEV model, the energy consumption model and the battery capacity estimation model, are discussed next.
2.3.5. Energy Consumption Model
In the vehicle, energy is consumed in three ways. First, energy is consumed when moving. Second, energy is consumed by idling engines. Third, energy is consumed to power up logistics-related equipment, such as refrigeration. For the cases being presented here, the vehicles are neither idle nor do they require additional logistics equipment. The assumption of zero idling energy can be justified in the Singapore’s context, where switching off the engines is required by law, and a failure to do so is punished with a fine [31].
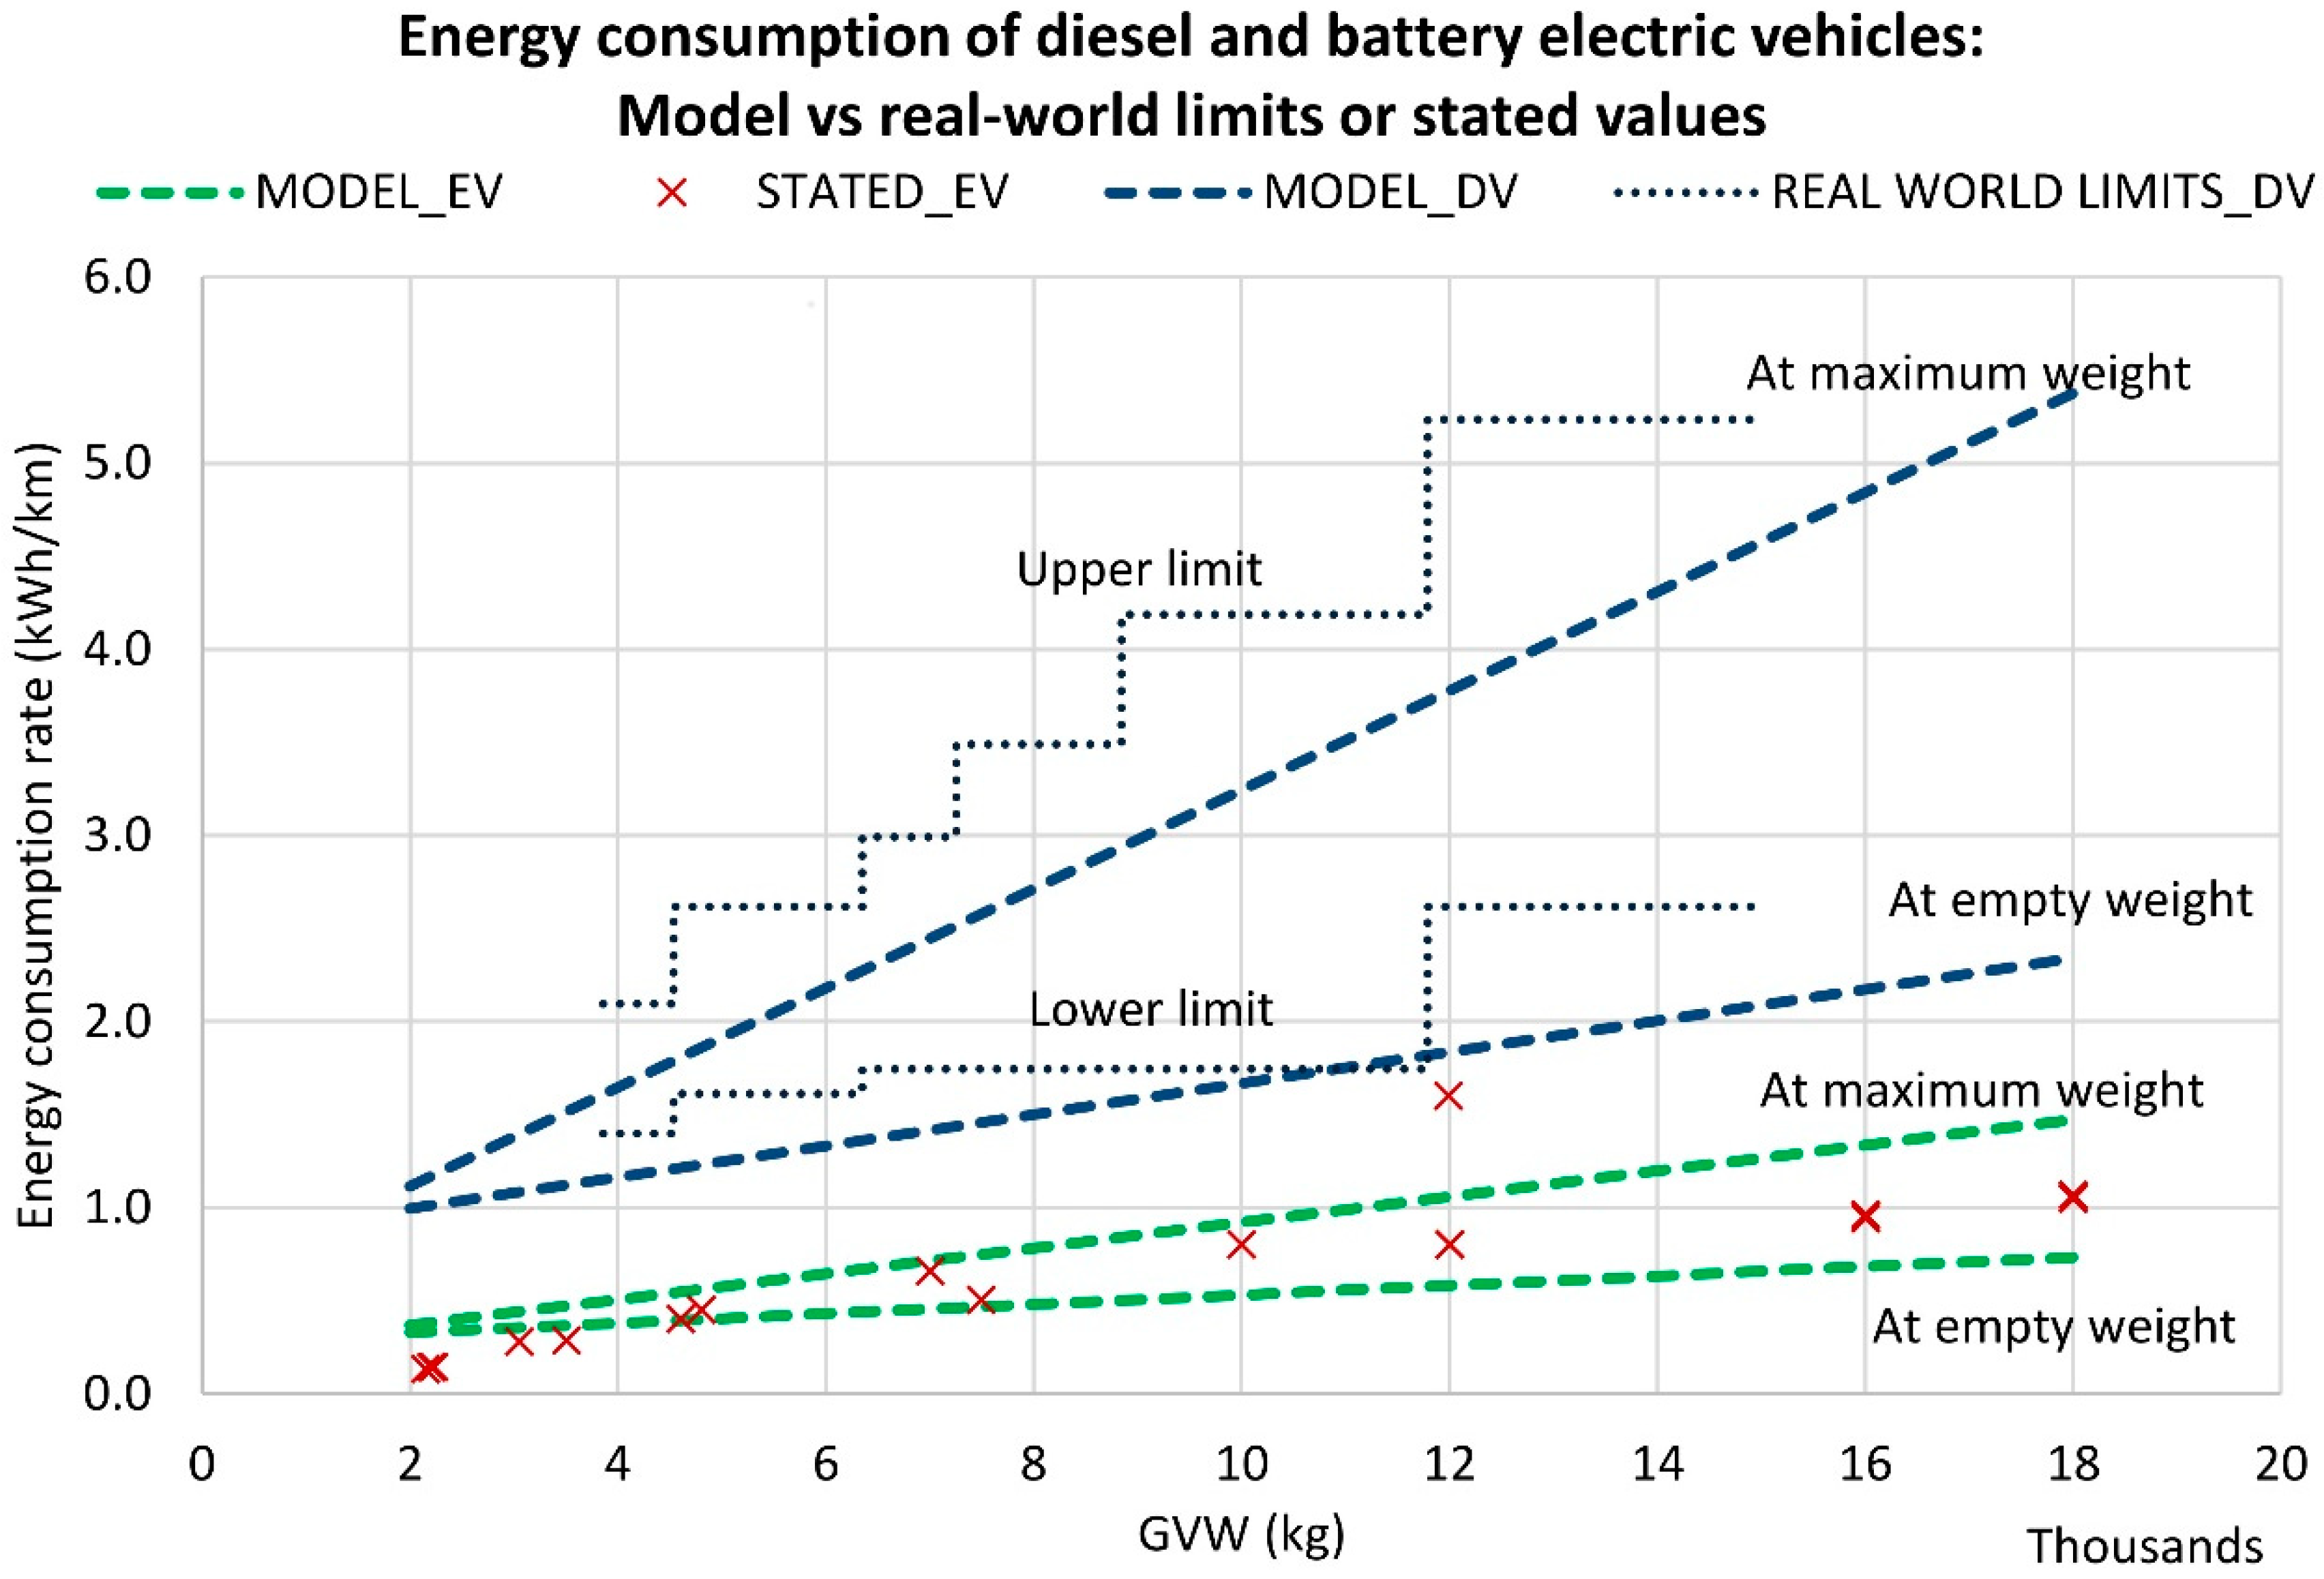
The energy consumption is calculated by multiplying the energy consumption rate at the route leg with the distance of the route leg. The rate varies according to the GVW and the current weight in each route. This rate is calculated using FASTSIM, an energy consumption simulation implemented in Excel created by Argonne National Laboratory. It incorporates factors such as vehicle weight, frontal area, length dimensions, driving profile, powertrain components, and regenerative braking [32] in its energy consumption model. Using FASTSIM on a set of dimensions of real-world vehicles, four linear models representing full and empty, diesel and electric vehicles were created (see Figure 2). The model uses the Heavy Duty Urban Dynamometer Driving Schedule as the driving profile.
To estimate the energy consumption rate for a vehicle, triangulate the weight of the vehicle at the route leg, using the GVW and empty weight and their corresponding energy consumption rates. This is calculated simultaneously with other BEV parameters.
2.3.6. Battery Capacity Estimation Depending on Charging Strategy
The use of OC alters the critical energy capacity required of the on-board battery because the energy can be topped-up during the next OC event. In the absence of OC, the battery must last for the whole day till the vehicle returns to the depot at the end of the operations. It is assumed that each vehicle in the fleet uses the same battery capacity. This makes the vehicle with the most intensive “energy critical segment” the limiting vehicle. The battery capacity estimation is derived from the energy capacity of the limiting vehicle’s energy critical segment.
Table 4 displays how the critical battery capacity is estimated. When the battery is being used, the battery level reduces, until the charging event. The charging event lasts the duration of the corresponding activity unless the battery depletes its capacity. Energy critical segments occur in between charging. The calculation of the required battery capacity considers the energy critical segments of all the vehicles in the fleet, to ensure that the battery level does not fall below 20% [44].
The vehicle’s GVW, empty weight, and battery capacity are set simultaneously, as are the energy consumption and energy charged during each vehicle’s route leg, route, and total operation. Other vehicle components are sized based on these parameters. The remaining necessary parameters are calculated as follows:
- Electric motor power: calculated based on a linear model, with the total vehicle weight as the dependent variable.
- Overnight charging power: calculated based on the battery capacity divided by the duration of overnight parking (see A8 from Figure 1).
- Battery replacement cycle in years: calculated based on a fixed charging cycle limit of 3000 cycles [30] and the energy usage of the fleet.
2.3.7. Usage of the Charging System
Efficiency of charging depends on the type of charging system used. The values used in this study are presented in Table 5. OC uses fast charging of either stationary Level 3 or dynamic fast charging systems.
2.4. Indicator Calculation
In the comparison between DVs and BEVs, the most important indicators are presented in Table 6. Each indicator has a specific impact scale [48] and relevance to the vehicle types. If a category is found irrelevant to a vehicle type, the value of the indicator is zero. The table also presents the main input variable affecting the quantity of the indicator. The study only focuses on the key indicators, which are relevant to both vehicle types, and whose calculation would not significantly overlap. These are the costs incurred to the fleet owner and the emissions of CO2.
The study does not include several indicators for the following reasons. BEVs, because of its electric powertrain, do not produce air pollution at the location where the effects of air pollution are detrimental. Instead it is emitted, usually at the outskirts, where the power plants are located. Hence, local air pollution produced by BEVs is zero. Also, though noise exposure is an important advantage of the BEV, the calculation is not possible using the methods and data collected in this study, as it requires a full traffic model and population density model [49]. Nevertheless, BEVs are significantly quieter at speeds of less than 30 km/h, just quieter at speeds less than 50 km/h, and non-distinguishable from DVs at speeds above 50 km/h [3], thus excluding them from the study will not be detrimental. Finally, the study evaluates implicitly the energy efficiencies and use of renewables in the evaluation of CO2 emissions.
The next sections present the procedures to calculate the costs using the lifecycle cost analysis method and the CO2 emissions.
2.4.1. Lifecycle Cost
The costs incurred to the fleet owner is calculated using the lifecycle cost analysis, which “focuses primarily on capital or fixed assets”, emphasizes “purchase price of the asset”, and the costs “to use, maintain and dispose of that asset during its lifetime” [50]. The costs incurred throughout the lifecycle are adjusted to the current day value using a discount factor, and finally aggregated into a single indicator, the Net Present Value (NPV) [51]. As per the observable behaviour of vehicle owners in Singapore, the NPV is calculated for the lifecycle period of 10, 15, and 20 years.
The calculated costs are presented in Table 7, together with the cost schedule and relevance to different vehicle types. The selection of cost categories is an important step. Some costs, such as parking and road pricing costs have been excluded, because of zero difference between the DV and BEV.
The discount rate implies that transactions occurring in the future have less worth, although the currency value may be completely the same. This is based on the concept of time preference in micro-economics. The discount factor used in the study is based on a discount rate of 5%, though other studies have used values ranging from 5% to 15% [2,6,15,18,23,52]. The change of the NPV of the BEV scenarios in comparison to the DV scenarios are presented in percentages.
2.4.2. Carbon Dioxide Emissions
The CO2 emitted in each scenario are estimated based on the energy produced by the power plant for the BEV and the fuel used by the DV. For the BEV, the fuel is burned at the power plant with an emission factor of 0.4332 kg CO2/kWh [53] (as of 2014), with a transmission loss factor of 1.0383 [54]. For the DV, the emission factor of 0.2677 kg CO2/kWh is used [55]. Note that the DV consumes more energy in kilowatt-hours than the BEV per distance travelled (see Figure 2), so the lower value here is not indicative of lower CO2 emissions. The change of the CO2 emissions of the BEV scenarios in comparison to the DV scenarios are presented in percentages.
3. Results
3.1. Vehicle Usage
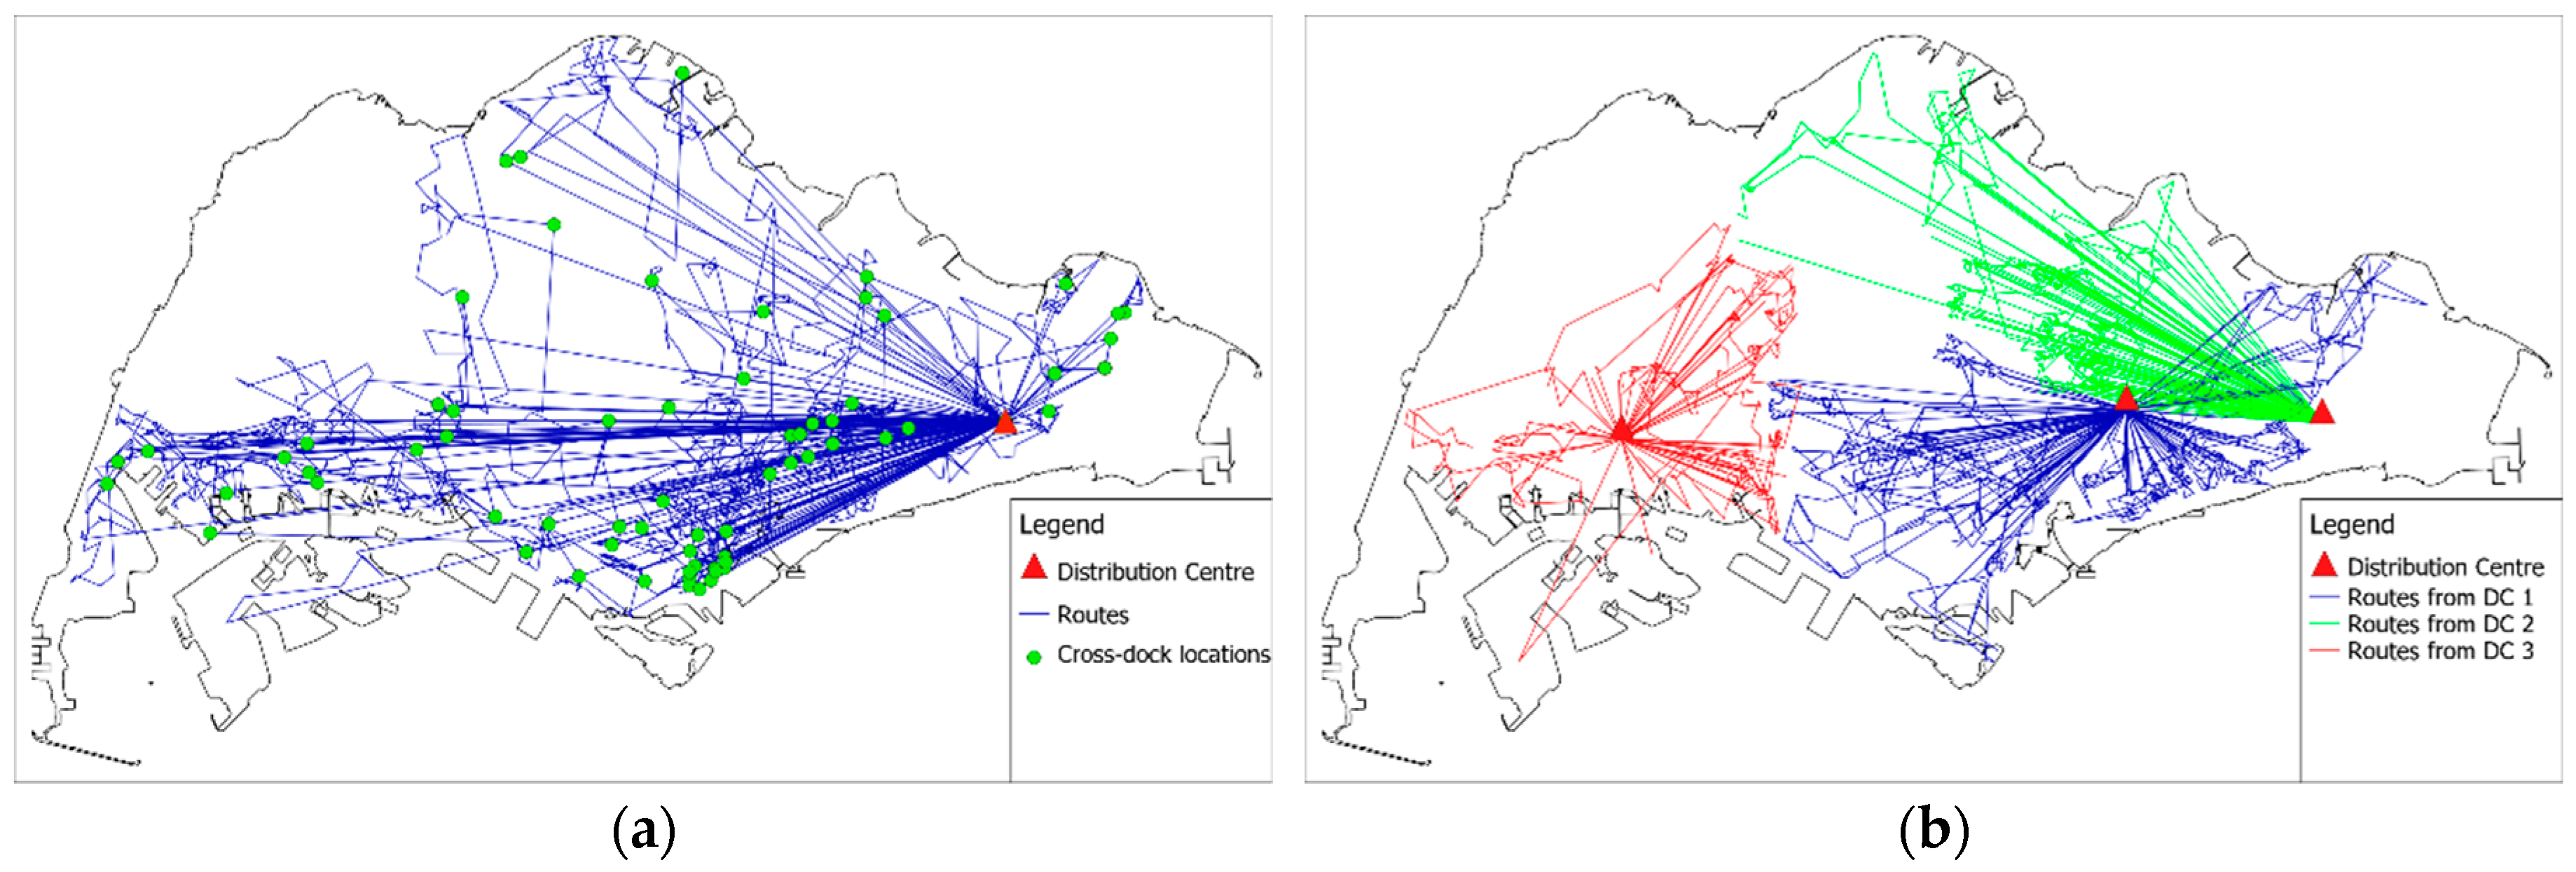
The routes of Cases A and B (see Table 2) are depicted in Figure 3. Case A (Figure 3a) has a distribution centre in the east and various cross-docking locations scattered around the rest of the island. Case B (Figure 3b) has three distribution centres in Singapore, serving the three different regions. The density of the stops is high and require multiple loading of the vehicles in the day. The routes of Cases C and D are not presented here, because they have only a single delivery location each.
A detailed look at the modelling of fleet’s distance travelled is presented in Table 8. The distance categories are chosen as it mirrors the expected critical distances for various OC strategies. Generally, the vehicle in Case C is very intensively used, about 4 times the usage in Case D, over 4 times the average distance travelled in Case B, and over 6 times the average distance travelled in Case A.
Both Cases A and B show a high discrepancy between the mean and maximum values for the various distance categories. Case B has a slightly lower discrepancy than Case A. This might be attributed to the use of three distribution centres in the latter, compared to the use of a single depot and multiple cross-docks. Note however that the route and schedule planning did not aim to balance the distances, and that this is not a general observation about multiple crossdocking.
High discrepancies for the distances mean that the battery capacity for the fleet will likely be oversized, because it is based on the requirement of the limiting vehicle. This leads to carrying additional, expensive and heavy battery in vehicles, which are mostly underused.
3.2. Vehicle System Specification
The battery capacity of BEVs is modified to meet the energy requirements of the operations, according to the different OC strategies. The percentage of energy transferred via OC in each charging scenario is presented in Table 9. The addition of battery to vehicles impacts the total vehicle weight significantly. For instance, the weight increase for S1 and S2 of Case C is 5800 kg for a 594 kWh battery, which is 45% of the weight of the DV. However, the use of OC has a strong impact on the required battery capacity, reducing it down to 29 kWh for S9 of Case C. This reduction varies from case to case, which implies varying suitability to the OC strategies.
The energy transferred via OC shows how much the BEV relied on the external charging network in the scenarios. The increased reliance on the OC network also implies that overnight charging infrastructure can be reduced. As the table shows, the reduction of the battery capacity does not strictly increase with the dependence on OC, although a logical relation can be assumed. More importantly is “when” the OC takes place, as is exemplified in comparing the required battery capacity of S3 and S4 with S9 in Case D. The energy transferred via OC is about the same, but the battery capacity of S9 is at least a quarter for S3 and S4.
3.3. Indicators
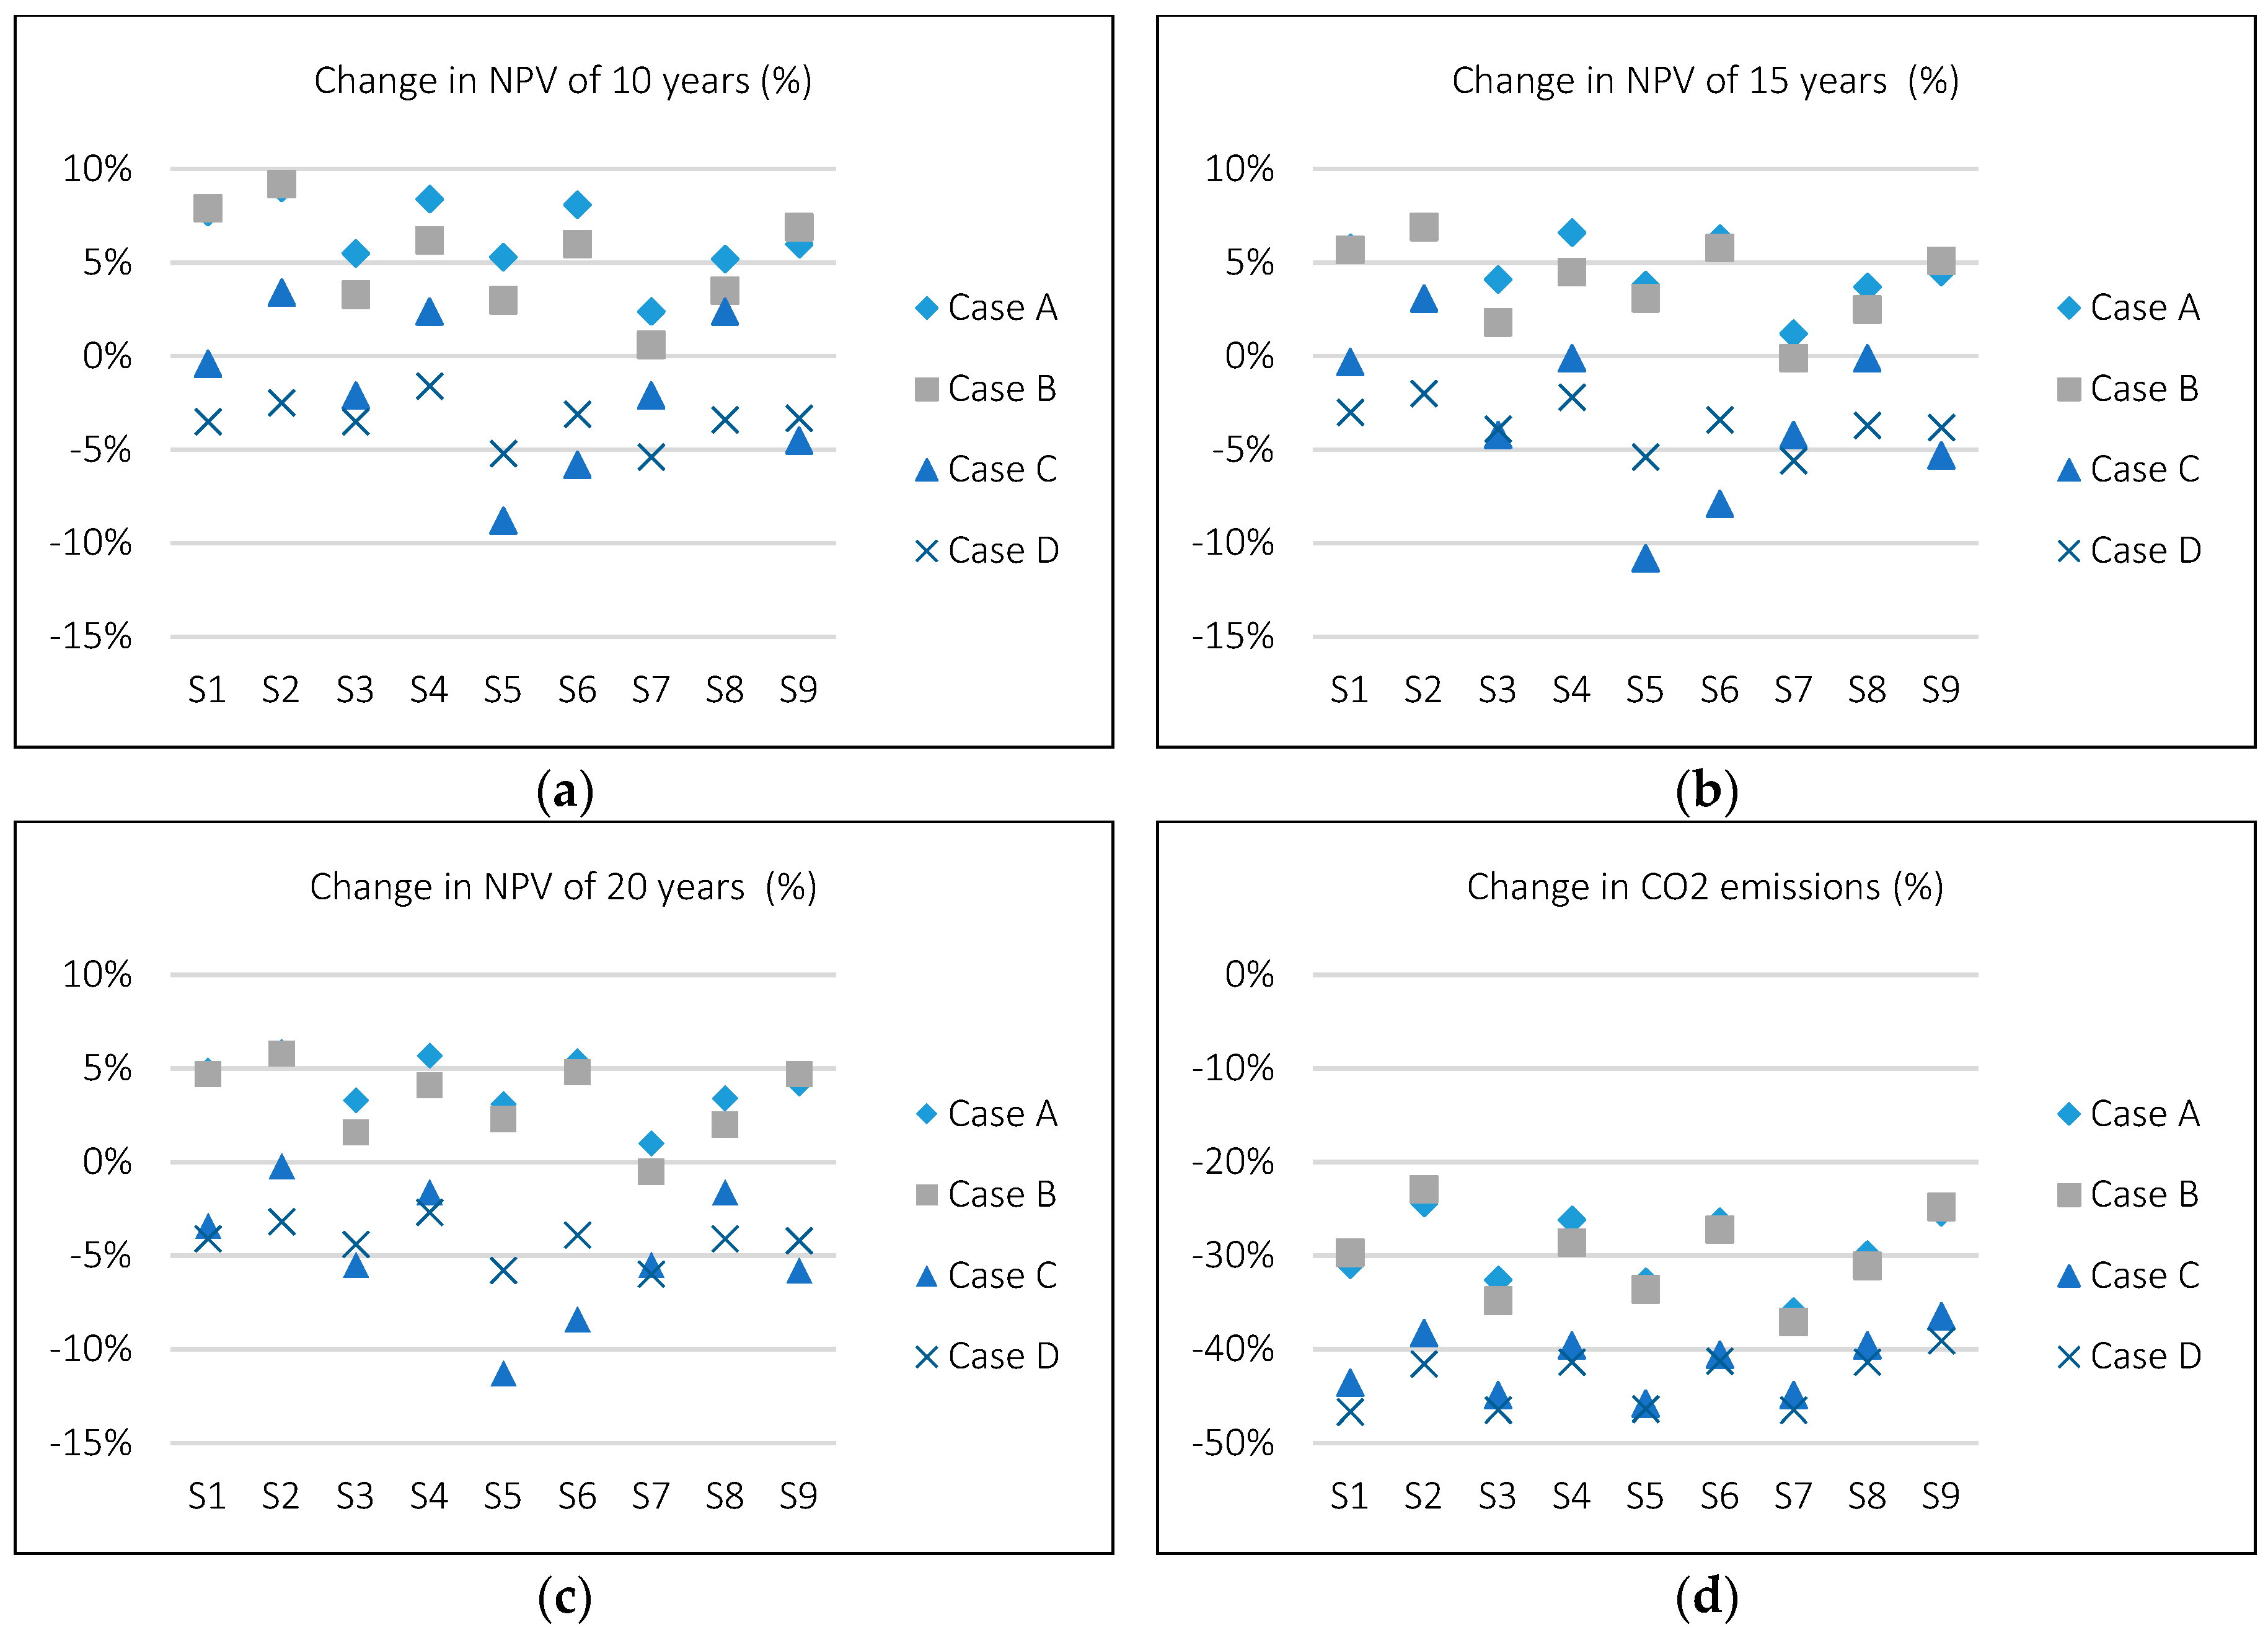
To illustrate the changes accrued by different OC scenarios, the indicators were compared with that of the DV scenarios. The change in NPV according to the respective service lifetimes are presented in Figure 4a–c. The changes in CO2 emissions are presented in Figure 4d.
The comparisons of the NPV show that BEV scenarios for the courier transport operations (Cases A and B) perform financially worse than for the furniture full-container-load transports (Cases C and D). More specifically, the BEV-based courier transports are generally not financially viable (i.e., positive change in NPV). The scenarios in Case C are mostly financially viable. The scenarios also show stark reactions to the OC scenarios and to the use of inductive charging. All scenarios in Case D are fully financially viable, even without the use of OC. They also display a moderate reaction to OC scenarios.
Based on the change in CO2 emissions, the potential reduction for courier transports (Cases A and B) are systematically less than for furniture full-container-load transports (Cases C and D). Strikingly, the reactions to the charging strategies are similar between the pairs Cases A and B and Cases C and D. There is also a clear increase of CO2 emissions in inductive charging scenarios.
4. Discussions
With reference to the two research questions, the extent to which OC supports the business case or affects the decarbonisation benefits of using BEVs are discussed.
4.1. Role of Opportunity Charging to Reduce Carbon Dioxide Emissions
The use of OC results in a reduction of CO2 emissions compared to the scenario without OC (see Rows 1–4, Table 10), except for OC during highway driving for Case C and all the scenarios in Case D. Each case reacts differently to the OC types (i.e., during breaks and shift changes, during loading activity, during unloading activity, or while driving on highways).
To put the size of the impacts into perspective, a ceteris paribus sensitivity analysis was performed testing the influence of charging technology, battery specific energy, and emissions of electricity production (Rows 5–11, Table 10).
4.1.1. Role of Charging Technology
The calculated values for OC (Rows 1–4, Table 10) are based on conductive charging technology. Moving from conductive charging to inductive charging (which could simplify operations) will significantly add to the CO2 emissions in all case studies as analysed (see Row 5, Table 10)—almost always negating the CO2 emission benefits of OC. Note that dynamic charging was performed using only inductive technology (Scenario S9) in this study, thus it is always accompanied by an increase in the CO2 emissions by a large margin. The efficiency of inductive charging should therefore be improved as an enabler of dynamic charging.
4.1.2. Role of Battery Energy Density
4.1.3. Role of Electricity Production Emission Factors
In this study, the role of emissions during electricity production was not analysed in greater detail. An average value for emissions factors based on the electricity production in Singapore of year 2014 [53] was used as the basis for the calculation. Generally, these emissions factors in Singapore could be expected to reduce with renewable energy, improved power plant technology and the import of energy from neighbouring countries [56]. However, the use of static averaged values might also mask the temporal changes of the emissions factors. For instance, Finenko and Cheah [57] showed that in Singapore, real-world emissions factors are only close to the averaged values in the early mornings on weekdays and Saturdays, and generally throughout Sundays and public holidays. The marginal emissions factors can vary up to double the averaged values [57].
A brief sensitivity analysis of the emissions factor (see Rows 8–11, Table 10) show that whether in the positive or negative direction, the value of the emissions factor has a significant impact on the benefits of BEVs, much larger than provided by OC.
4.2. Role of Opportunity Charging to Improve the Financial Business Case
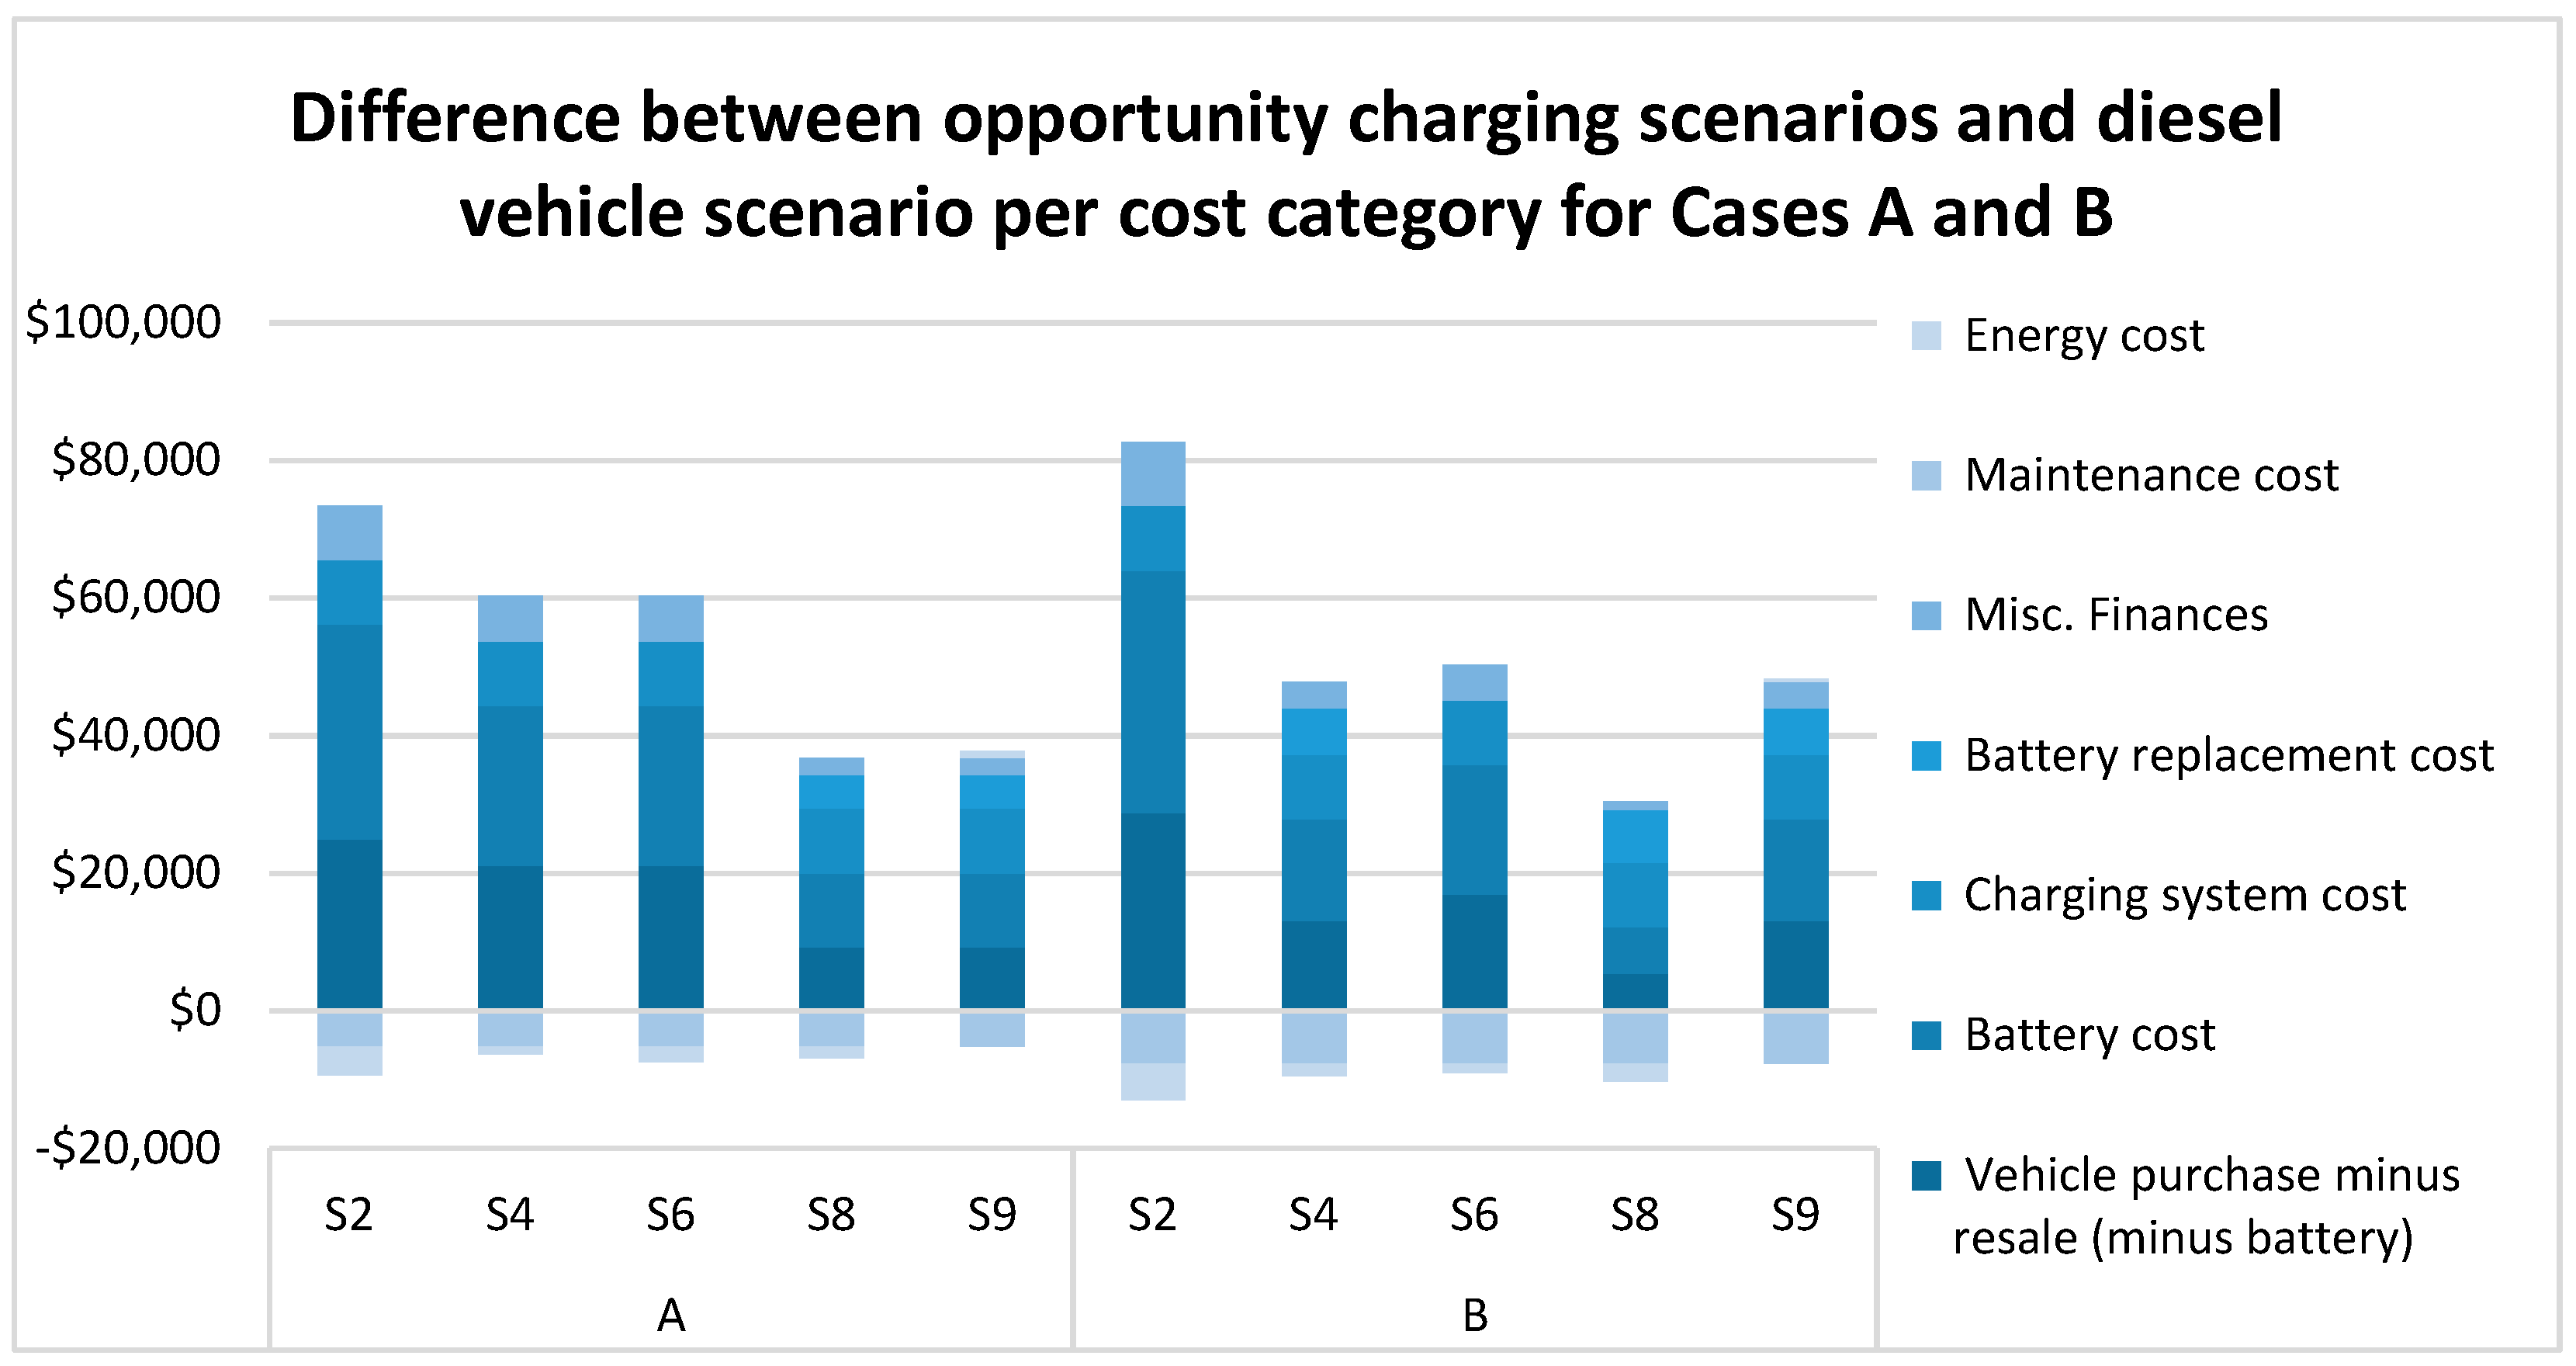
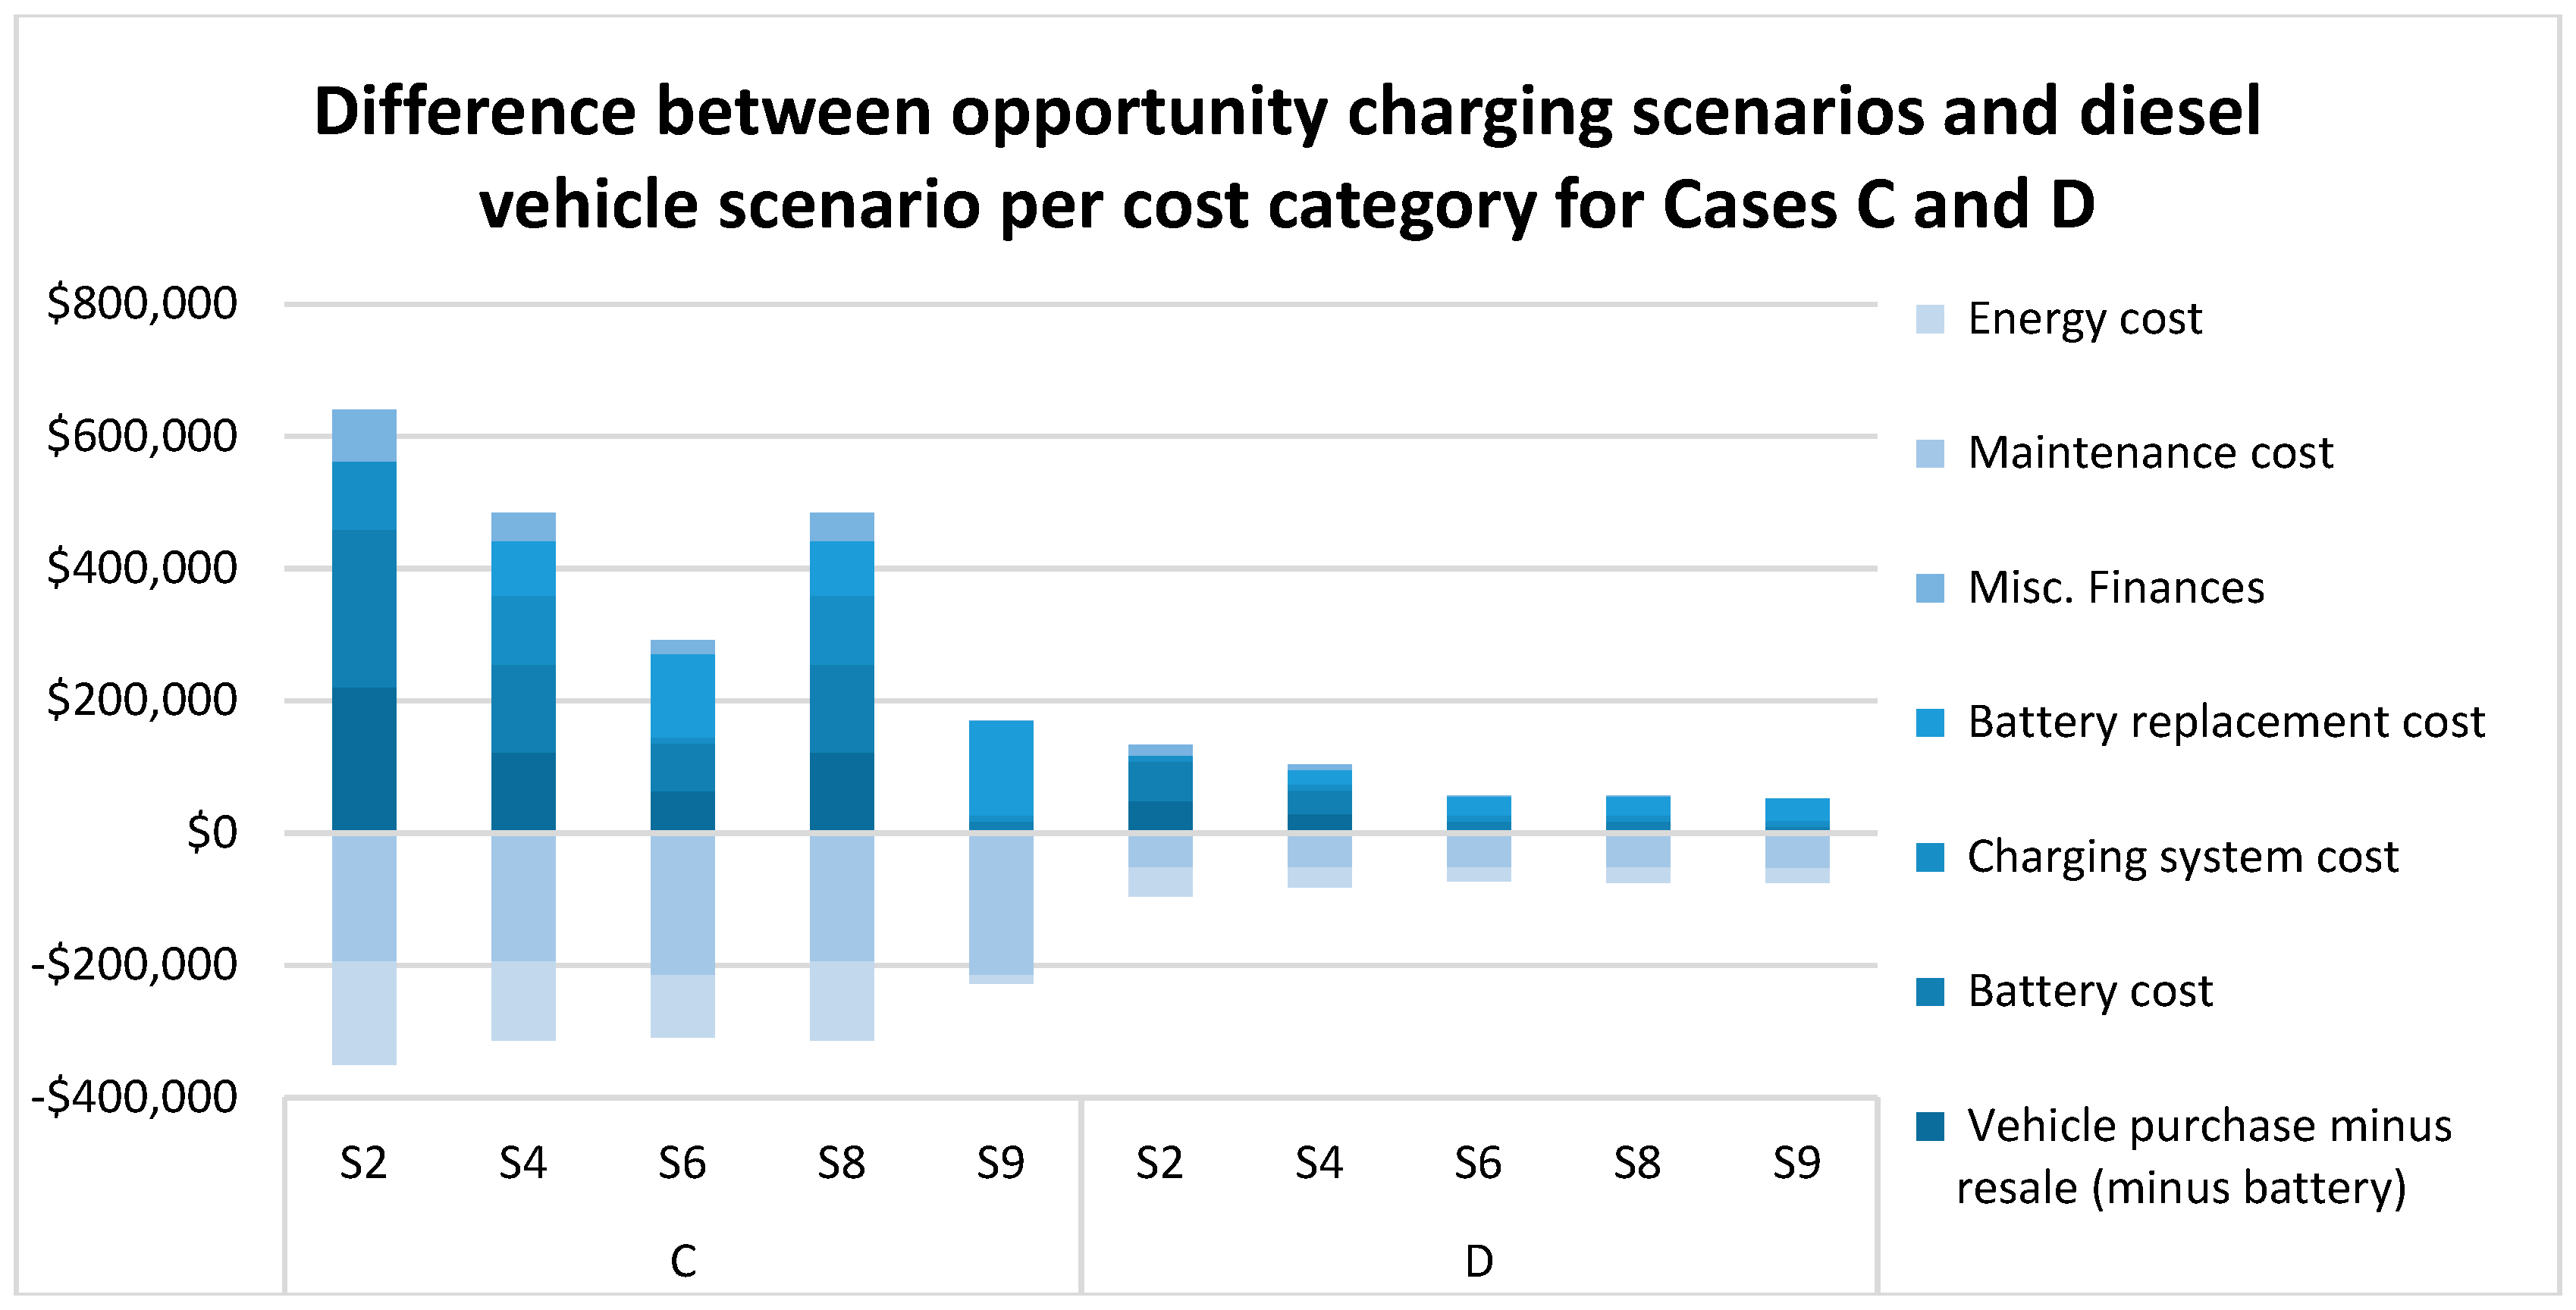
OC’s main role is to reduce the operational limitation, while improving the financial attractiveness of BEVs. To analyse the influence of OC on the lifecycle costs, the changes between inductive charging scenarios and the DV scenario were calculated for each case (see Figure 5 and Figure 6). The inductive charging scenarios (S2, S4, S6, S8, and S9) were used, since the “OC while driving on highway” strategy was calculated only with inductive charging technology. This isolates the influence of charging technology to focus solely on the difference caused by each OC.
The financial cost categories in the analysis are the same as introduced in Table 7, except for the “Misc. finances” category, which includes all taxes and registration fees, and “Vehicle purchase minus resale (minus battery)”, which is self-explanatory. The battery costs are considered separately since it is a major cost component and to compare it with the battery replacement costs. A positive value in the figure implies an increase in the cost compared to the DV scenario, and a negative value implies a benefit.
The results show that OC reduces the magnitude of both cost and benefit, for all cases. Strikingly, however, is that the costs are reduced substantially more than the benefits, particularly in the purchase costs (vehicle, charging system and battery). On the other hand, battery replacement costs increase slightly. The benefit of lower energy costs also reduces with lower purchase costs. Maintenance costs (according to vehicle model) does not reduce, although it could be expected with lighter vehicles.
In summary, OC improves the business case, although not always sufficiently (i.e., negative total difference). The magnitude of the influence of OC on the NPV is compared with other factors (charging technology, service lifetime, battery specific energy, battery unit price, and electricity prices) using a sensitivity analysis and presented in Table 11.
4.2.1. Role of Charging Technology
Like the effects on CO2 emissions, the use of inductive charging reduces the benefits of OC (see Row 5, Table 11). The magnitude is greater than most reductions using OC in all the cases, with some exceptions, like in Case C. Part of the reason for the negative influence of inductive charging is the additional costs of the systems. However, as it also substantially increased CO2 emissions, another reason would be the loss of energy efficiency caused by the systems. As the technology is still at the developmental stage, manufacturers will need to devise smarter ways to reduce the inefficiencies [58,59].
4.2.2. Role of Service Lifetime
Extension of service lifetime is generally accepted to improve the business case of BEVs [23,24], as is shown in our study (Rows 6–7, Table 11). The reasoning is that the high purchase cost of the vehicle and charging system can be potentially off-set by the relatively lower operating and maintenance costs. However, as battery replacement is considered after a fixed set of charging cycles, the potential savings may differ [52]. Further, the study did not consider degradation of the battery over time, assuming that the capacity fade is minimal at 3000 cycles [60].
4.2.3. Role of Battery Specific Energy and Price and Electricity Prices
Improving the battery specific energy (Rows 8–9, Table 11), without reducing the price of battery (Rows 10–11, Table 11) is not effective to reduce the NPV. The decreasing prices for battery replacement based on a variety of factors [61]—from production processes to market forces—was already considered in the main study. Further reduction would have a direct bearing on the purchase price of the vehicle.
Also, unsurprisingly the business case depends on the variation of the electricity prices (Rows 12–15, Table 11). The strongest effect is found in Case C, which also has highest energy usage and cost compared to the other cases (compare Figure 5 and Figure 6). This implies that operational characteristics resulting in high energy cost savings take precedence in improving the business case before the reduction of electricity prices.
4.3. Unused Battery Capacity of the Fleets
The puzzle remains as to why Cases A and B performed poorly financially compared to Cases C and D. One potential reason is the unused battery capacity of the fleet. In the study, the fleets for Cases A and B were taken to be homogeneous in terms of battery capacity and vehicle weight. The battery capacity was sized according to the need of the limiting vehicle, which had the highest workload measured in energy consumption. This meant that those BEVs with a lower workload did not fully utilize the potential cost savings from the lower energy and maintenance costs associated with driving distance range.
If this reason holds true, the effect of changes to the workload over time should also be investigated. The study tried to recreate the vehicle usage for a single day, using the available data. While the study assumed unchanging routes over time, daily transport operations happen within a more complex context, where new routes could be added, old routes modified, and re-routing occur on the fly. This too could result in unrealized savings potential.
As noted previously, OC can help with reducing the battery capacity needed on the vehicles, thus reducing waste. However, in addition, two solutions already identified in literature can also help deal with the expected variability of operational requirements in the fleet and in the future: modularity of the battery system and the use of BEV-suitable routing and scheduling decision support systems (DSS). In the first solution, within the fleet, each BEV can be fitted with the battery capacity it needs. This can be changed in the future, though probably not regularly, when the operational requirements change. In the second solution, the use of a DSS that balances energy expenditure, rather than distance or duration, would reduce energy requirement variability within the fleet or that accounts for mixed fleets with different driving ranges [15,62].
4.4. Availability of Charging Infrastructure
As previously stated, the study assumed installation of charging infrastructure at charging locations and that it is not owned by the freight carrier. Since it is not owned by the user, it is not included into the lifecycle cost analysis, although the price of electricity at different charging locations were varied to reflect different costs. The study also assumed 100% availability of the charging infrastructure at the time needed by freight carrier. These are two strong assumptions about ideal conditions for OC. But, as one can argue, these assumptions do not detract from the utility of the study, rather they highlight the importance of further research.
The need for public charging infrastructure is a common issue [11,63]. In the study, the energy unit cost for all OC was assumed to be higher than for overnight charging by more than 33% [64]. This was used to account for the commercial case of public charging services. Existing literature do not currently discuss business models of charging services for commercial vehicles. However, in comparison to charging stations for passenger vehicles, the business case for providing these services to commercial vehicles are better for the following reasons:
- BEVs for commercial trips do not occupy a parking-cum-charging slot for a long period compared to passenger vehicles, thus the turnover rate for that slot is higher.
- Related to that, existing IT-based management and booking of loading bays can help to ensure availability and high utilization of charging slots for BEVs.
- BEV drivers, which depend on OC to extend their journey, would be more willing to pay the additional premium on the charging bill.
These a priori reasons provide a basis for further research into the business models of charging services for commercial vehicles. Some interested parties could be: utility providers, who have an interest in increasing electricity usage; logistics facilities owners, who can increase revenue sustainably; or vehicle manufacturers, who have an interest in supporting its own products [65].
5. Conclusions
The study argued for the utility of four different OC strategies, particularly from the perspective of lifecycle costs and of the decarbonisation benefits. The BEV scenarios reduced CO2 emissions by at least 23%, up to at least 39% specifically for full-container-load transport cases (i.e., Cases C and D). Stakeholders, who desire to see CO2 emissions reduce in the road transport sector will find OC a good approach for most cases. In general, OC was found to reduce lifecycle costs, without a significant trade-off of the decarbonisation benefits. One notes that despite a general reduction of lifecycle costs, none of the scenarios of Case A were financially suitable. Other solutions from the fleet managers’ perspective that can be used (see Table 1) must instead be considered.
The study highlighted other potential optimal technological and operational conditions that work together with OC to reduce costs and CO2 emissions, such as restricting the use of inductive charging, increasing the service lifetime, and reducing the battery and electricity prices. Policy makers can make use of the results, particularly in supporting the business models of charging service providers, reducing regulations that limit the service lifetime of BEVs and promoting the reduction of battery and electricity prices.
Further research in this field could consider a more complete coverage of UFT operations, perhaps using agent-based models that can recreate vehicle usage at an operational level. There is also a need for further understanding the charging service ecosystem and how land use and transport policy can be co-opted to support its development in the commercial vehicle segment. Finally, future work should integrate the plethora of strategies outlined in Table 1 to find optimal bundles of solutions that can push for BEV use in urban freight.
Author Contributions
The paper is based on the Ph.D. dissertation of T.T. Conceptualization, T.T., O.K., and C.-C.T.; methodology, T.T. and O.K.; investigation, T.T.; writing—original draft preparation, T.T. and O.K.; writing—review and editing, T.T., O.K., C.-C.T. and Y.D.W., supervision, O.K., C.-C.T. and Y.D.W.
Funding
This work was financially supported by the Singapore’s National Research Foundation under its Campus for Research Excellence and Technological Enterprise (CREATE) program. This open access publication is funded by TU Delft.
Acknowledgments
The research study reported here is based on the first author’s Ph.D. dissertation under the Joint-PhD program of Technical University Munich and Nanyang Technological University Singapore.
Conflicts of Interest
The authors declare no conflict of interest. The founding sponsors had no role in the design of the study; in the collection, analyses, or interpretation of data; in the writing of the manuscript, and in the decision to publish the results.
References
- Thomas, M.; Ellingsen, L.A.-W.; Hung, C.R. Research for TRAN Committee—Battery-Powered Electric Vehicles: Market Development and Lifecycle Emissions: Study; European Parliament: Brussels, Belgium, 2018. [Google Scholar]
- Macharis, C.; van Mierlo, J.; van Den Bossche, P. Combining Intermodal Transport With Electric Vehicles: Towards More Sustainable Solutions. Transp. Plan. Technol. 2007, 30, 311–323. [Google Scholar] [CrossRef]
- Marbjerg, G. Noise from Electric Vehicles—A Literature Survey: COMPETT (WP3); Transportøkonomisk Institutt: Oslo, Norway, 2013. [Google Scholar]
- Tie, S.F.; Tan, C.W. A review of energy sources and energy management system in electric vehicles. Renew. Sustain. Energy Rev. 2013, 20, 82–102. [Google Scholar] [CrossRef]
- Sandén, B. (Ed.) Systems Perspectives on Electromobility; Chalmers University of Technology: Göteborg, Sweden, 2013. [Google Scholar]
- Lee, D.-Y.; Thomas, V.M.; Brown, M.A. Electric Urban Delivery Trucks: Energy Use, Greenhouse Gas Emissions, and Cost-Effectiveness. Environ. Sci. Technol. 2013, 47, 8022–8030. [Google Scholar] [CrossRef] [PubMed]
- Lebeau, P.; de Cauwer, C.; van Mierlo, J.; Macharis, C.; Verbeke, W.; Coosemans, T. Conventional, Hybrid, or Electric Vehicles: Which Technology for an Urban Distribution Centre? Sci. World J. 2015, 2015, 302867. [Google Scholar] [CrossRef] [PubMed]
- Yilmaz, M.; Krein, P.T. Review of Battery Charger Topologies, Charging Power Levels, and Infrastructure for Plug-In Electric and Hybrid Vehicles. IEEE Trans. Power Electron. 2013, 28, 2151–2169. [Google Scholar] [CrossRef]
- Bahn, O.; Marcy, M.; Vaillancourt, K.; Waaub, J.-P. Electrification of the Canadian road transportation sector: A 2050 outlook with TIMES-Canada. Energy Policy 2013, 62, 593–606. [Google Scholar] [CrossRef]
- Pelletier, S.; Jabali, O.; Laporte, G. Battery Electric Vehicles for Goods Distribution: A Survey of Vehicle Technology, Market Penetration, Incentives and Practices: CIRRELT-2014-43; CIRRELT: Quebec, QC, Canada, 2014. [Google Scholar]
- Lebeau, P.; Macharis, C.; van Mierlo, J. Exploring the choice of battery electric vehicles in city logistics: A conjoint-based choice analysis. Transp. Res. Part E Logist. Transp. Rev. 2016, 91, 245–258. [Google Scholar] [CrossRef]
- Borden, E.J.; Boske, L.B. Electric Vehicles and Public Charging Infrastructure: Impediments and Opportunities for Success in the United States; Center for Transportation Research: Austin, TX, USA, 2013. [Google Scholar]
- Gass, V.; Schmidt, J.; Schmid, E. Analysis of alternative policy instruments to promote electric vehicles in Austria. Renew. Energy 2014, 61, 96–101. [Google Scholar] [CrossRef]
- Christensen, L.; Klauenberg, J.; Kveiborg, O.; Rudolph, C. Suitability of commercial transport for a shift to electric mobility with Denmark and Germany as use cases. Res. Transp. Econ. 2017. [Google Scholar] [CrossRef]
- van Duin, J.H.R.; Tavasszy, L.; Quak, H. Towards E(lectric)-urban freight: First promising steps in the electric vehicle revolution. Eur. Transp. 2013, 54, 1–19. [Google Scholar]
- Taefi, T.T.; Kreutzfeldt, J.; Held, T.; Fink, A. Strategies to Increase the Profitability of Electric Vehicles in Urban Freight Transport. In E-Mobility in Europe: Trends and Good Practice; Leal Filho, W., Kotter, R., Eds.; Springer International Publishing: Cham, Switzerland, 2015; pp. 367–388. [Google Scholar]
- Teoh, T.; Kunze, O.; Teo, C.-C. Methodology to Evaluate the Operational Suitability of Electromobility Systems for Urban Logistics Operations. Transp. Res. Procedia 2016, 12, 288–300. [Google Scholar] [CrossRef]
- Davis, B.; Figliozzi, M. A methodology to evaluate the competitiveness of electric delivery trucks. Transp. Res. Part E Logist. Transp. Rev. 2013, 49, 8–23. [Google Scholar] [CrossRef]
- Ehrler, V.; Hebes, P. Electromobility for City Logistics—The Solution to Urban Transport Collapse?: An Analysis Beyond Theory. Procedia Soc. Behav. Sci. 2012, 48, 786–795. [Google Scholar] [CrossRef]
- Fuller, M. Wireless charging in California: Range, recharge, and vehicle electrification. Transp. Res. Part C Emerg. Technol. 2016, 67, 343–356. [Google Scholar] [CrossRef]
- Deflorio, F.; Castello, L. Dynamic charging-while-driving systems for freight delivery services with electric vehicles: Traffic and energy modelling. Transp. Res. Part C Emerg. Technol. 2017, 81, 342–362. [Google Scholar] [CrossRef]
- Teoh, T. Suitability of Battery Electric Vehicles and Opportunity Charging for Urban Freight Transport: An Evaluation Framework; Dr.-Ing: Munich, Germany, 2018. [Google Scholar]
- Feng, W.; Figliozzi, M. An economic and technological analysis of the key factors affecting the competitiveness of electric commercial vehicles: A case study from the USA market. Transp. Res. Part C Emerg. Technol. 2013, 26, 135–145. [Google Scholar] [CrossRef]
- Davis, B.; Figliozzi, M. Lifecycle evaluation of urban commercial electric vehicles and their potential emissions reductions Impacts. In TRB 92nd Annual Meeting Compendium of Papers; Transportation Research Board: Washington, DC, USA, 2013. [Google Scholar]
- Gallo, J.-B.; Tomić, J. Battery Electric Parcel Delivery Truck Testing and Demonstration: Public Interest Energy Research (PIER) Program; Final project report CalHEAT: Pasadena, CA, USA, 2013. [Google Scholar]
- Vonolfen, S.; Affenzeller, M.; Beham, A.; Wagner, S. Simulation-based evolution of municipal glass-waste collection strategies utilizing electric trucks. In Proceedings of the 3rd IEEE International Symposium on Logistics and Industrial Informatics, Budapest, Hungary, 25–27 August 2011. [Google Scholar]
- Eisenhardt, K.M. Building Theories from Case Study Research. Acad. Manag. Rev. 1989, 14, 532–550. [Google Scholar] [CrossRef]
- Den Boer, E.; Aarnink, S.; Kleiner, F.; Pagenkopf, J. Zero Emissions Trucks: An Overview of State-of-the-Art Technologies and Their Potential; CE Delft: Delft, The Netherlands, 2013. [Google Scholar]
- eRoadArlanda. Electrified Roads Using Third Rail, Project Website. Available online: https://eroadarlanda.com/ (accessed on 27 May 2018).
- Burke, A.F. Batteries and Ultracapacitors for Electric, Hybrid, and Fuel Cell Vehicles. Proc. IEEE 2007, 95, 806–820. [Google Scholar] [CrossRef]
- National Environment Agency. Stiffer Fines for Idling Vehicle Engine Repeat Offences from 1 June 2016, Targeted Measures to Deter Repeat Offenders and Minimise Air Pollution. Advisories. 2016. Available online: http://www.nea.gov.sg/corporate-functions/newsroom/advisories/stiffer-fines-for-idling-vehicle-engine-repeat-offences-from-1-june-2016 (accessed on 27 May 2018).
- NREL. Future Automotive Systems Technology Simulator, FASTSim. 2014. Available online: http://www.nrel.gov/transportation/fastsim.html (accessed on 13 April 2016).
- Transportation Research Board and National Research Council. Technologies and Approaches to Reducing the Fuel Consumption of Medium- and Heavy-Duty Vehicles; National Academies Press: Washington, DC, USA, 2010. [Google Scholar]
- Smith Electric Vehicles. Smith Newton, Brochure; Smith Electric Vehicles: Kansas City, MO, USA, 2011. [Google Scholar]
- Smith Electric Vehicles. Smith Edison, Brochure; Smith Electric Vehicles: Kansas City, MO, USA, 2011. [Google Scholar]
- Mercedes-Benz. The Vito E-Cell, Brochure; Mercedes-Benz: Stuttgart, Germany, 2011. [Google Scholar]
- Renault. Renault Kangoo Van ZE, Brochure; Renault: Boulogne-Billancourt, France, 2013. [Google Scholar]
- Boulder Electric Vehicle. The 500 Series, Available Configurations. 2013. Available online: http://www.boulderev.com/models.php (accessed on 6 May 2018).
- Boulder Electric Vehicle. The 1000 Series, Available Configurations. 2013. Available online: http://www.boulderev.com/models.php (accessed on 6 May 2018).
- Nissan. Nissan e-NV200, Brochure; Nissan: Yokohama, Japan, 2014. [Google Scholar]
- Peugeot. Peugeot New Partner, Prices, Equipment and Technical Specifications; Peugeot: Paris, France, 2016. [Google Scholar]
- Emoss BV. Electric Trucks. 2017. Available online: http://www.emoss.nl/en/electric-vehicles/full-electric-truck/ (accessed on 6 May 2018).
- Emoss BV. Electric Delivery Vans. 2017. Available online: http://www.emoss.nl/en/electric-vehicles/electric-delivery-van/ (accessed on 6 May 2018).
- Peters, J.F.; Baumann, M.; Zimmermann, B.; Braun, J.; Weil, M. The environmental impact of Li-Ion batteries and the role of key parameters—A review. Renew. Sustain. Energy Rev. 2017, 67, 491–506. [Google Scholar] [CrossRef]
- Sears, J.; Roberts, D.; Glitman, K. A Comparison of Electric Vehicle Level 1 and Level 2 Charging Efficiency. In Proceedings of the 2014 IEEE Conference on Technologies for Sustainability (SusTech), Portland, OR, USA, 24–26 July 2014. [Google Scholar]
- Idaho National Lab (INL). PLUGLESS Level 2 EV Charging System (3.3 kW) by Evatran Group Inc., Results from Laboratory Testing as Installed on a 2012 Chevy Volt; Idaho National Lab (INL): Idaho Falls, ID, USA, 2015.
- Idaho National Lab (INL). Production EVSE Fact Sheet: DC Fast Charger: Hasetec. 2014. Available online: http://energy.gov/sites/prod/files/2014/02/f8/dcfc_hasetec.pdf (accessed on 6 May 2018).
- Behrends, S.; Lindholm, M.; Woxenius, J. The Impact of Urban Freight Transport: A Definition of Sustainability from an Actor’s Perspective. Transp. Plan. Technol. 2008, 31, 693–713. [Google Scholar] [CrossRef]
- Verheijen, E.; Jabben, J. Effect of Electric cars on Traffic Noise and Safety: RIVM Letter Report 680300009/2010; RIVM: Bilthoven, The Netherlands, 2010. [Google Scholar]
- Ellram, L.M. Total cost of ownership. Int. J. Phys. Distrib. Logist. Manag. 1995, 25, 4–23. [Google Scholar] [CrossRef]
- Tomic, J.; Gallo, J.-B. Using Commercial Electric Vehicles for Vehicle-to-Grid. In Proceedings of the 26th Electric Vehicle Symposium 2012, Los Angeles, CA, USA, 6–9 May 2012; Curran Associates, Inc.: Red Hook, NY, USA, 2012. [Google Scholar]
- Taefi, T.T.; Stütz, S.; Fink, A. Assessing the cost-optimal mileage of medium-duty electric vehicles with a numeric simulation approach. Transp. Res. Part D Transp. Environ. 2017, 56, 271–285. [Google Scholar] [CrossRef]
- Energy Market Authority Singapore. Electricity Grid Emissions Factors and Upstream Fugitive Methane Emission Factor, Statistics. 2016. Available online: https://www.ema.gov.sg/cmsmedia/Publications_and_Statistics/Statistics/OTS12.pdf (accessed on 11 April 2016).
- Mypower. Transmission Loss Factors. 31 March 2016. Available online: https://www.mypower.com.sg/About/Transmission_Loss_Factors.html (accessed on 11 April 2016).
- Department for Environment, Food & Rural Affairs (DEFRA). 2012 Greenhouse Gas Conversion Factors for Company Reporting. 2013. Available online: https://www.gov.uk/government/publications/2012-greenhouse-gas-conversion-factors-for-company-reporting (accessed on 5 August 2017).
- Ali, H.; Sanjaya, S.; Suryadi, B.; Weller, S.R. Analysing CO2 emissions from Singapore’s electricity generation sector: Strategies for 2020 and beyond. Energy 2017, 124, 553–564. [Google Scholar] [CrossRef]
- Finenko, A.; Cheah, L. Temporal CO2 emissions associated with electricity generation: Case study of Singapore. Energy Policy 2016, 93, 70–79. [Google Scholar] [CrossRef]
- Bosshard, R.; Kolar, J.W. Inductive power transfer for electric vehicle charging: Technical challenges and tradeoffs. IEEE Power Electron. Mag. 2016, 3, 22–30. [Google Scholar] [CrossRef]
- Karakitsios, I.; Palaiogiannis, F.; Markou, A.; Hatziargyriou, N. Optimizing the energy transfer, with a high system efficiency in dynamic inductive charging of EVs. IEEE Trans. Veh. Technol. 2018, 1. [Google Scholar] [CrossRef]
- Anseán, D.; González, M.; Viera, J.C.; García, V.M.; Blanco, C.; Valledor, M. Fast charging technique for high power lithium iron phosphate batteries: A cycle life analysis. J. Power Sources 2013, 239, 9–15. [Google Scholar] [CrossRef]
- Nykvist, B.; Nilsson, M. Rapidly falling costs of battery packs for electric vehicles. Nat. Clim. Chang. 2015, 5, 329–332. [Google Scholar] [CrossRef] [Green Version]
- Lin, J.; Zhou, W.; Wolfson, O. Electric Vehicle Routing Problem. Transp. Res. Procedia 2016, 12, 508–521. [Google Scholar] [CrossRef]
- Juan, A.; Mendez, C.; Faulin, J.; de Armas, J.; Grasman, S. Electric Vehicles in Logistics and Transportation: A Survey on Emerging Environmental, Strategic, and Operational Challenges. Energies 2016, 9, 86. [Google Scholar] [CrossRef]
- Snyder, J.; Chang, D.; Erstad, D.; Lin, E.; Rice, A.F.; Goh, C.T.; Tsao, A.-A. Financial Viability of Non-Residential Electric Vehicle Charging Stations; UCLA Luskin Center for Innovation: Los Angeles, CA, USA, 2012. [Google Scholar]
- Nigro, N.; Welch, D.; Peace, J. Strategic Planning to Implement Publicly Available EV Charging Stations: A Guide for Businesses and Policymakers; Center for Climate and Energy Solutions: Arlington, VA, USA, 2015. [Google Scholar]
Figure 1.
Activity diagram of vehicle operation cycle.

Figure 2.
Comparison between energy consumption rates of diesel vehicle (DV) and BEV and the real-world limits for DVs and stated values of manufacturers of real-world BEVs.
Figure 2.
Comparison between energy consumption rates of diesel vehicle (DV) and BEV and the real-world limits for DVs and stated values of manufacturers of real-world BEVs.

Figure 3.
Routes for cases (a) A and (b) B with transhipment points.

Figure 4.
Percentage change of net present value (NPV) for service lifetime (a) 10, (b) 15 and (c) 20 years, and (d) CO2 emissions.
Figure 4.
Percentage change of net present value (NPV) for service lifetime (a) 10, (b) 15 and (c) 20 years, and (d) CO2 emissions.

Figure 5.
Cost difference breakdown of Cases A and B.

Figure 6.
Cost difference breakdown of Cases C and D.


Table 1.
Strategy to overcome operational limitations of battery electric vehicles (BEVs).
| Strategy | Measures | References |
|---|---|---|
| Reduce scope of services | Reduce size of area served | - |
| Reduce number of customers served | [7,15] | |
| Modify transport operations | Optimize routes and schedules | [15,16] |
| Use an urban consolidation centre | [15] | |
| Increase fleet size | [17,18] | |
| Modify vehicles | Mix the fleet with conventional vehicles | [14] |
| Increasing battery capacity of the BEV | [2,17] | |
| On-board power generators to supplement EVs | [10] | |
| Other efficiency measures (i.e., lightweighting, aerodynamics) | [16] | |
| Use opportunity charging (OC) | Public charging infrastructure | [14,16,19] |
| Semi-public charging infrastructure | [2,14,17] | |
| Dynamic charging | [17,20,21] | |
| Battery swap | [15,16] |
Table 2.
Case study description according to industry sector, product type, and tour structure, as well as data obtained.
Table 2.
Case study description according to industry sector, product type, and tour structure, as well as data obtained.
| Cases | Industry Sector | Product Type | Tour Structure | Data Obtained |
|---|---|---|---|---|
| Case A | Courier-Express-Parcel | Mail, parcels | 1 depot (and many cross-docking locations) to many addresses (delivery & collection) | Sample of itinerary, with addresses, shipment sizes, and service areas. Payload capacity. |
| Case B | Courier-Express-Parcel | Mail, parcels | 3 depots to many addresses (delivery & collection) | Averages of schedule; service area description. Addresses from random selection. Fleet size. Payload capacity. |
| Case C | Furniture retail chain | Containerized furniture | 1 depot to 1 store (7 shuttle trips of about 65 km each) | General schedule, fleet size. Addresses from website. Payload estimated. |
| Case D | Furniture retail chain | Containerized furniture | 1 depot to 1 store (7 shuttle trips of about 16 km each) | General schedule, fleet size. Addresses from website. Payload estimated. |
Table 3.
Scenarios investigated in the study composed of vehicle type, charging strategy and charging technology.
Table 3.
Scenarios investigated in the study composed of vehicle type, charging strategy and charging technology.
| Scenario ID | Vehicle Type | Charging Strategy | Charging Technology |
|---|---|---|---|
| S0 | DV | - | - |
| S1 | BEV | no OC | Stationary conductive charging system |
| S2 | Stationary inductive charging system | ||
| S3 | OC during break and shift change | Stationary conductive charging system | |
| S4 | Stationary inductive charging system | ||
| S5 | OC during loading activity | Stationary conductive charging system | |
| S6 | Stationary inductive charging system | ||
| S7 | OC during unloading activity | Stationary conductive charging system | |
| S8 | Stationary inductive charging system | ||
| S9 | OC while driving on highway | Dynamic inductive charging system |
Table 4.
Influence of charging strategy on battery estimation.
| Charging Strategy | Charging Event 1 | Energy Critical Segment(s) | Important Determinant for Battery |
|---|---|---|---|
| No OC | A8 | From A1 to A8 | Vehicle with most energy intensive work load in the day. |
| OC during break and shift change | A5 or A6 | From A1 to A5; from A5 to next A5 or A6 | Duration of segmented operating hours |
| OC during loading activity | A2 | From A2 to next A2 | Longest route in fleet |
| OC during unloading activity | A4 | From A1 to A4; from A4 to next A4; from A4 to A8 | Longest distance from depot to first or last unloading stop |
| OC while driving on highway | During A1, A3 and A7, on highways only | Driving on urban roads | Longest route only on urban road |
1 The charging events correspond to the activities illustrated in Figure 1.
Table 5.
Efficiency of charging.
| Charging System | Efficiency of Charging (%) | |
|---|---|---|
| Conductive | Inductive | |
| Stationary Level 1 | 85.8 [45] | 78.4 1 |
| Stationary Level 2 | 90.2 [45] | 82.3 [46] |
| Stationary Level 3 | 88.7 [47] | 81.0 1 |
| Dynamic fast charging | - | 75.0 2 |
1 Efficiency values for inductive charging stationary level 1 and level 3 were estimated based on the differences in Levels 1, 2 and 3 of conductive charging; 2 Efficiency values for inductive dynamic fast charging were not found in literature but taken as 75%.
Table 6.
Indicator relevance to DVs and BEVs, in terms of its source and influence.
| Categories | Indicators | Impact Scale | DV | BEV | Main Input Variable |
|---|---|---|---|---|---|
| Costs incurred to fleet owner | Vehicle cost (and charging system) | Individual | Yes | Yes | Fleet size |
| Energy/fuel cost | Individual | Yes | Yes | Energy used | |
| Maintenance cost | Individual | Yes | Yes | Distance travelled | |
| Taxation and subsidies | Individual | Yes | Yes | Fleet size | |
| Air and noise pollution | Nitrogen oxides emissions | Local | Yes | No | Energy used |
| Volatile organic compounds emissions | Local | Yes | No | Energy used | |
| Particulate matter emissions | Local | Yes | No | Energy used | |
| Sulphur oxides emissions | Local | Yes | No | Energy used | |
| Ozone concentration | Local | Yes | No | Energy used | |
| Noise exposure | Local | Yes | Yes | Vehicle speed in sensitive area | |
| Energy security and climate change | Efficiency of energy consumption | National | Yes | Yes | Energy used and power mix |
| Efficiency of vehicle fuel/energy consumption | National | Yes | Yes | Energy used | |
| Use of renewable energy sources | Global | No | Yes | Power mix | |
| CO2 emissions and other greenhouse gases | Global | Yes | Yes | Energy used and power mix |
Table 7.
Overview of costs calculated per vehicle in the lifecycle cost analysis.
| Cost Categories | Cost Schedule | Relevant Factors According to Vehicle Type | |
|---|---|---|---|
| DV | BEV | ||
| Vehicle purchase price | Beginning of lifecycle | ||
| Vehicle base price | Vehicle size | Vehicle size | |
| Battery cost | NA | Size of battery | |
| Electric motor cost | NA | Size of electric motor | |
| Charging receiver | NA | Charging system type | |
| Vehicle purchase cost | Beginning of lifecycle | ||
| Certificate of entitlement | Certificate of entitlement cost | Certificate of entitlement cost | |
| Vehicle registration fees | Vehicle type | Vehicle type | |
| Charging system cost | Beginning of lifecycle | ||
| Charging system price | NA | Charging system type | |
| Installation costs | NA | Charging system type | |
| Battery replacement cost | According to battery replacement cycle | NA | Battery cost in year of replacement |
| Renewal of certificate of entitlement | In year 10, if the lifetime is extended. | Extension period | Extension period |
| Road tax | Annually | Vehicle type, size, age | Vehicle type, size, age, |
| Vehicle insurance | Annually | Vehicle purchase price | Vehicle purchase price |
| Salary | Annually | Vehicle size | Vehicle size |
| Maintenance cost | Annually | Total distance travelled and vehicle type and size | Total distance travelled and vehicle type and size |
| Energy cost | Annually | Fuel prices and total energy consumed. | Eectricity prices, total energy consumed and opportunity charging strategy |
| Resale of vehicle | End of lifecycle | Vehicle price | Vehicle price |
Table 8.
Route description according to various distance categories.
| Case | Case A | Case B | Case C | Case D | ||||
|---|---|---|---|---|---|---|---|---|
| Fleet size | 64 | 53 | 1 | 1 | ||||
| Total distance | 4683 | 5230 | 453 | 114 | ||||
| Distance statistics | Mean | Max | Mean | Max | Mean | Max | Mean | Max |
| Distance driven per vehicle | 73.2 | 149.3 | 98.7 | 170.8 | 453.1 | 114.3 | ||
| Distance per schedule segment | 34.2 | 113.4 | 38.7 | 87.6 | 151.0 | 194.2 | 38.1 | 49.0 |
| Distance per route | 34.2 | 113.4 | 38.7 | 87.6 | 64.7 | 16.3 | ||
| Distance per leg | 2.3 | 47.6 | 1.7 | 31.4 | 32.4 | 33.0 | 8.2 | 8.8 |
| Urban roads distance per vehicle | 41.1 | 87.4 | 85.3 | 155.5 | 67.7 | 73.4 | ||
Table 9.
Vehicle system and effectiveness of opportunity charging (OC).
| Case | Scenarios | GVW (kg) | Battery Capacity (kWh) | Energy Transferred Via OC (%) |
|---|---|---|---|---|
| Case A | S0 | 2400 | - | - |
| S1, S2 | 3100 | 78 | - | |
| S3, S4 | 2900 | 58 | 68% | |
| S5, S6 | 2900 | 58 | 46% | |
| S7, S8 | 2600 | 27 | 73% | |
| S9 | 2600 | 27 | 79% | |
| Case B | S0 | 2400 | - | - |
| S1, S2 | 3200 | 88 | - | |
| S3, S4 | 2700 | 37 | 73% | |
| S5, S6 | 2800 | 47 | 75% | |
| S7, S8 | 2500 | 17 | 72% | |
| S9 | 2700 | 37 | 67% | |
| Case C | S0 | 13,000 | - | - |
| S1, S2 | 18,800 | 594 | - | |
| S3, S4 | 16,200 | 332 | 43% | |
| S5, S6 | 14,700 | 180 | 74% | |
| S7, S8 | 16,200 | 332 | 43% | |
| S9 | 13,200 | 29 | 100% | |
| Case D | S0 | 13,000 | - | - |
| S1, S2 | 14,400 | 150 | - | |
| S3, S4 | 13,800 | 90 | 57% | |
| S5, S6 | 13,200 | 29 | 95% | |
| S7, S8 | 13,200 | 29 | 86% | |
| S9 | 13,100 | 19 | 56% |
Table 10.
Changes to the CO2 emissions due to scenario modifications.
| Modifications to Scenario | A | B | C | D |
|---|---|---|---|---|
| OC during break or shift change | −1.8% | −5.7% | −1.3% | 0.2% |
| OC during loading activity | −2.0% | −4.3% | −2.3% | 0.3% |
| OC during unloading activity | −5.5% | −8.2% | −1.3% | 0.2% |
| OC while driving on highway | −1.0% | −1.9% | 1.8% | 2.5% |
| Inductive technology | 6.0% | 5.8% | 5.8% | 5.6% |
| 10% specific energy | −0.8% | −1.1% | −0.3% | −0.1% |
| 20% specific energy | −1.6% | −1.9% | −0.5% | −0.1% |
| +10% emissions factor | 6.9% | 7.0% | 5.6% | 5.3% |
| +20% emissions factor | 13.8% | 14.1% | 11.3% | 10.7% |
| −10% emissions factor | −6.9% | −7.0% | −5.6% | −5.3% |
| −20% emissions factor | −13.8% | −14.1% | −11.3% | −10.7% |
Table 11.
Changes to the net present value.
| Modifications to Scenario | A | B | C | D |
|---|---|---|---|---|
| OC during break or shift change | −0.6% | −3.0% | −1.0% | 0.9% |
| OC during loading activity | −0.9% | −3.2% | −9.2% | −0.6% |
| OC during unloading activity | −3.8% | −5.7% | −1.0% | −0.9% |
| OC while driving on highway | −3.0% | −2.3% | −7.9% | −0.8% |
| Inductive technology | 2.5% | 2.5% | 4.0% | 1.8% |
| +5 years’ service lifetime | −1.6% | −1.3% | −1.6% | −0.2% |
| +10 years’ service lifetime | −2.3% | −1.9% | −3.1% | −0.8% |
| 10% energy density | −0.2% | −0.4% | −0.3% | −0.1% |
| 20% energy density | −0.5% | −0.5% | −0.5% | −0.2% |
| −20% battery price | −2.1% | −2.3% | −3.7% | −1.6% |
| −10% battery price | −1.0% | −1.1% | −1.9% | −0.8% |
| 10% electricity prices | 0.3% | 0.4% | 1.5% | 0.6% |
| 20% electricity prices | 0.6% | 0.8% | 2.9% | 1.2% |
| −20% electricity prices | −0.6% | −0.8% | −2.9% | −1.2% |
| −10% electricity prices | −0.3% | −0.4% | −1.5% | −0.6% |
© 2018 by the authors. Licensee MDPI, Basel, Switzerland. This article is an open access article distributed under the terms and conditions of the Creative Commons Attribution (CC BY) license (http://creativecommons.org/licenses/by/4.0/).
Share and Cite
MDPI and ACS Style
Teoh, T.; Kunze, O.; Teo, C.-C.; Wong, Y.D. Decarbonisation of Urban Freight Transport Using Electric Vehicles and Opportunity Charging. Sustainability 2018, 10, 3258. https://doi.org/10.3390/su10093258
AMA Style
Teoh T, Kunze O, Teo C-C, Wong YD. Decarbonisation of Urban Freight Transport Using Electric Vehicles and Opportunity Charging. Sustainability. 2018; 10(9):3258. https://doi.org/10.3390/su10093258
Chicago/Turabian StyleTeoh, Tharsis, Oliver Kunze, Chee-Chong Teo, and Yiik Diew Wong. 2018. "Decarbonisation of Urban Freight Transport Using Electric Vehicles and Opportunity Charging" Sustainability 10, no. 9: 3258. https://doi.org/10.3390/su10093258
Note that from the first issue of 2016, this journal uses article numbers instead of page numbers. See further details here.