Article

Evaluation of UR-UVGI System for Sterilization Effect on Microorganism Contamination in Negative Pressure Isolation Ward

1
Department of Architectural Engineering, Sejong University, Seoul 05006, Korea
2
Department of Architectural Engineering, Hanyang University, Seoul 04736, Korea
3
Division of Infectious Diseases, Department of Internal Medicine, Incheon Medical Center, Incheon 22532, Korea
*
Author to whom correspondence should be addressed.
Sustainability 2018, 10(9), 3192; https://doi.org/10.3390/su10093192
Submission received: 25 June 2018 / Revised: 5 August 2018 / Accepted: 31 August 2018 / Published: 6 September 2018

Abstract

:
A negative pressure isolation ward prevents the outflow of airborne microorganisms from inside the ward, minimizing the spread of airborne contamination causing respiratory infection. In response to recent outbreaks of severe acute respiratory syndrome (SARS) and Middle East respiratory syndrome (MERS), Korea has increased the number of these facilities. However, airborne contaminants that flow into the ward from adjacent areas may cause secondary harm to patients. In this study, the sterilization effect of upper-room ultraviolet germicidal irradiation (UR-UVGI) on microorganisms generated within the negative pressure isolation ward and those flowing inward from adjacent areas was evaluated through field experiments and computational fluid dynamics (CFD) analysis, to assess the potential of this approach as a supplementary measure to control such microorganisms. The sterilization effect was found to be not high because of high-level ventilation. CFD analysis under various conditions shows that the sterilization effect for indoor-generated microorganisms varies with the level of UV radiation, the source locations of the indoor-generated microorganisms, air supplies and exhausts, the UVGI system, and the airflow formed under the specified conditions. Our results show that when the UVGI system is installed in the upper part of the ward entrance, contaminated air from adjacent area is strongly sterilized.

1. Introduction

Negative pressure isolation wards have mostly been used to isolate patients with airborne infectious diseases such as tuberculosis and measles. During both the severe acute respiratory syndrome (SARS) outbreak, which began in Hong Kong in 2003, and the Middle East respiratory syndrome (MERS) outbreak, which led to mass infection in Korea in 2015, negative pressure isolation wards provided important quarantine facilities for the treatment of patients in the early stages of infection or confirmation of infection in other patients [1]. After the SARS outbreak, the dire need for expansion of negative pressure isolation wards was recognized in Hong Kong, and hospitals specializing in infectious diseases that also have more than 100 negative pressure isolation wards, such as Princess Margaret Hospital, were established. Since 2006, several inpatient isolation units have been established with governmental support in Korea as a countermeasure for newly emerged infectious diseases, including SARS and new influenza viruses. When the 2015 MERS outbreak occurred, the World Health Organization (WHO) and the U.S. Centers for Disease Control (CDC) recommended airborne precaution for MERS, even though the dominant transmission mode of the infectious disease was not considered airborne [2,3]. There were 118 negative pressure isolation wards in place, but only approximately 70 were available, as the remainder were multi-bed units [1]. Since the MERS outbreak, the Korean government has once again recognized the need for such wards and has made government budget allocations to secure additional negative pressure isolation wards and to fund hospitals specializing in infectious diseases [1].
In Korea, negative pressure isolation wards are constructed in accordance with Korean standards, established with reference to the U.S. CDC guidelines [4,5], as detailed in Table 1. A separate ventilation system, negative pressure formation between rooms, anteroom installation, and air exhaustion through high-efficiency particulate air (HEPA) filters are used to prevent the outflow of airborne microorganisms from infected patients.
Of the 29 negative pressure isolation facilities supported by the Korean government, only 3 were constructed as stand-alone buildings, while the remaining 26 facilities were remodeled from existing buildings. The stand-alone facilities have the advantage of being safely isolated from other existing facilities, but difficulties may be encountered in terms of facility operation because of their need for additional manpower. On the other hand, in the remodeled facilities, the area for infected patients must be completely isolated from the area for general patients; this is achieved by, among other things, the physical separation of facilities and movement paths of infected patients and their medical personnel. However, some entrances are frequently used by medical personnel, and the air from general areas flows into the negative pressure isolation ward through these entrances. Therefore, contaminants in the air may affect patients isolated in the negative pressure isolation wards. According to the investigations of 9 hospital waiting rooms by Yanagi et al., the concentrations of airborne bacteria were higher when there were more patients or HVAC were inadequately operated [6]. In general, negative pressure isolation wards supply air at a high ventilation rate and use high-performance filters, but the ward location varies based on hospital design. Therefore, preventive measures are required to address the inward flow of various microorganisms from adjacent areas.
The 2003 U.S. CDC guidelines [4] emphasize that environmental factors affecting the presence of microorganisms in indoor air must be considered, and that there is a particular need for contamination control measures. After the outbreak and spread of tuberculosis in the U.S., a new set of guidelines was released in 2005 that incorporated preventive measures, which included information regarding the spread, infection, and environmental control of tuberculosis [5]. Furthermore, to prevent airborne infectious diseases such as tuberculosis, guidelines regarding the infection route, maintenance conditions, and risk level were established in 2007 [7]. Organizations such as the WHO and the American Society of Heating, Refrigerating, and Air-Conditioning Engineers (ASHRAE) have also provided guidelines for infection control, which include standards for airborne microorganisms, infection routes, and the operation and maintenance of ventilation systems for infection control [8,9]. The 2008 CDC guidelines also provide recommendations for the use of chemical sterilizers, equipment, etc. including instructions regarding cleaning, sterilization, and hand-washing processes as a means of infection prevention, as well as information on ultraviolet germicidal irradiation (UVGI) systems [10]. According to Lindsley et al. [11], who investigated the distribution of airborne microorganisms that cause respiratory diseases in medical facilities, airborne microorganisms are fine particulates that can spread to adjacent areas through in-patient respiration and other means possibly contributing to the spread of infection, thus necessitating the outline of control measures. In this context, special facilities such as negative pressure isolation wards have been established as preventive measures against infection, and corresponding studies on ventilation have been conducted [12,13]. Fletcher et al. [14] have strongly emphasized the importance of airborne contamination, noting the issue of infection within hospitals and medical facilities as a serious problem. They also estimated that 1 in 10 people experienced healthcare-acquired infection. The airborne contamination in these facilities is latent, extensive, and may be lethal to patients with immunodeficiency, thus requiring measures for confirmation and control.
Among the measures of infection control mentioned above, several studies have been conducted on the UVGI system, which is known for its ability to sterilize harmful airborne microorganisms such as mold, bacteria, and viruses. The sterilization effects of UV rays have been verified in many previous studies. In particular, Hollaender and Oliphant [15] and Macher et al. [16] have proven that a UV-C wave with a wavelength of 254 nm can effectively deactivate (sterilize) biological contaminants, and have suggested this technique as a means of controlling airborne bacteria. In addition, the environmental factors influencing the proliferation of airborne bacteria such as temperature, humidity, and ventilation rate, have been set as variables in studies investigating the sterilization effects of the UVGI system [17,18,19]. Although the UVGI system exhibits explicit sterilization effects on both surface [20] and airborne contaminants, caution is required with regard to irradiation of in-patients, since eye and skin irradiation are known to cause harmful effects [21]. In addition, the sterilization effects of UVGI systems installed in the upper area of the ward entrance, i.e., upper-room UVGI (UR-UVGI) systems, have been confirmed by experiments [22,23]. Memarzadeh et al. [24] suggested that the sterilization effects of UVGI systems within medical facilities should be considered a means of disinfection in addition to heating, ventilation, and air conditioning (HVAC) systems. HVAC is the major means of infection control, rather than the UVGI system, which should be considered a supplementary device. In addition, Gilkeson and Noakes [25] found that a UVGI system is an effective means of reducing airborne bacteria in an indoor environment and have advocated this system as a control measure against potential infection. As such, the UVGI system is widely applied in medical facilities for its verified sterilization effects on airborne bacteria.
Some methods have been proposed to estimate and enhance the sterilization effects of the UVGI system. For example, Xu et al. [26] confirmed and compared the sterilization effects of the UVGI system with and without ventilation (air exchanges) through computational fluid dynamics (CFD) analysis. Noakes et al. [27] suggested that system effects can be amplified by adjusting the UV radiation level. They evaluated the relationship between sterilization effects and UV radiation level, including the dose amount. Sung and Kato [28] also suggested a method for evaluating sterilization effects using the local purging flow rate and UV dose. An analysis was conducted on bacteria from patient respiration within wards to assess the correlation of the UVGI system source with UV radiation level and air age [29].
To summarize, the sterilization effect of the UVGI system has been proven in previous studies, and several methods for system performance evaluation and analysis have been proposed. However, many of those studies were conducted in general wards or within chambers, and there is a need to confirm UVGI system validity as a means of infection control within negative pressure isolation wards in relation to airborne contamination. In particular, control and counter measures are required not only for indoor airborne sources, but also for those from adjacent areas into the negative pressure isolation wards.
This study investigates the sterilization effects of a UR-UVGI system installed in the upper room area as a means of infection control for airborne microorganisms, which may be generated within negative pressure isolation wards and flow in from adjacent areas. This study was conducted in a hospital located in Incheon, Korea containing a negative pressure isolation ward (remodeled), and investigated the sterilization effects of the UVGI system through both experiment and CFD analysis.

2. Materials and Methods

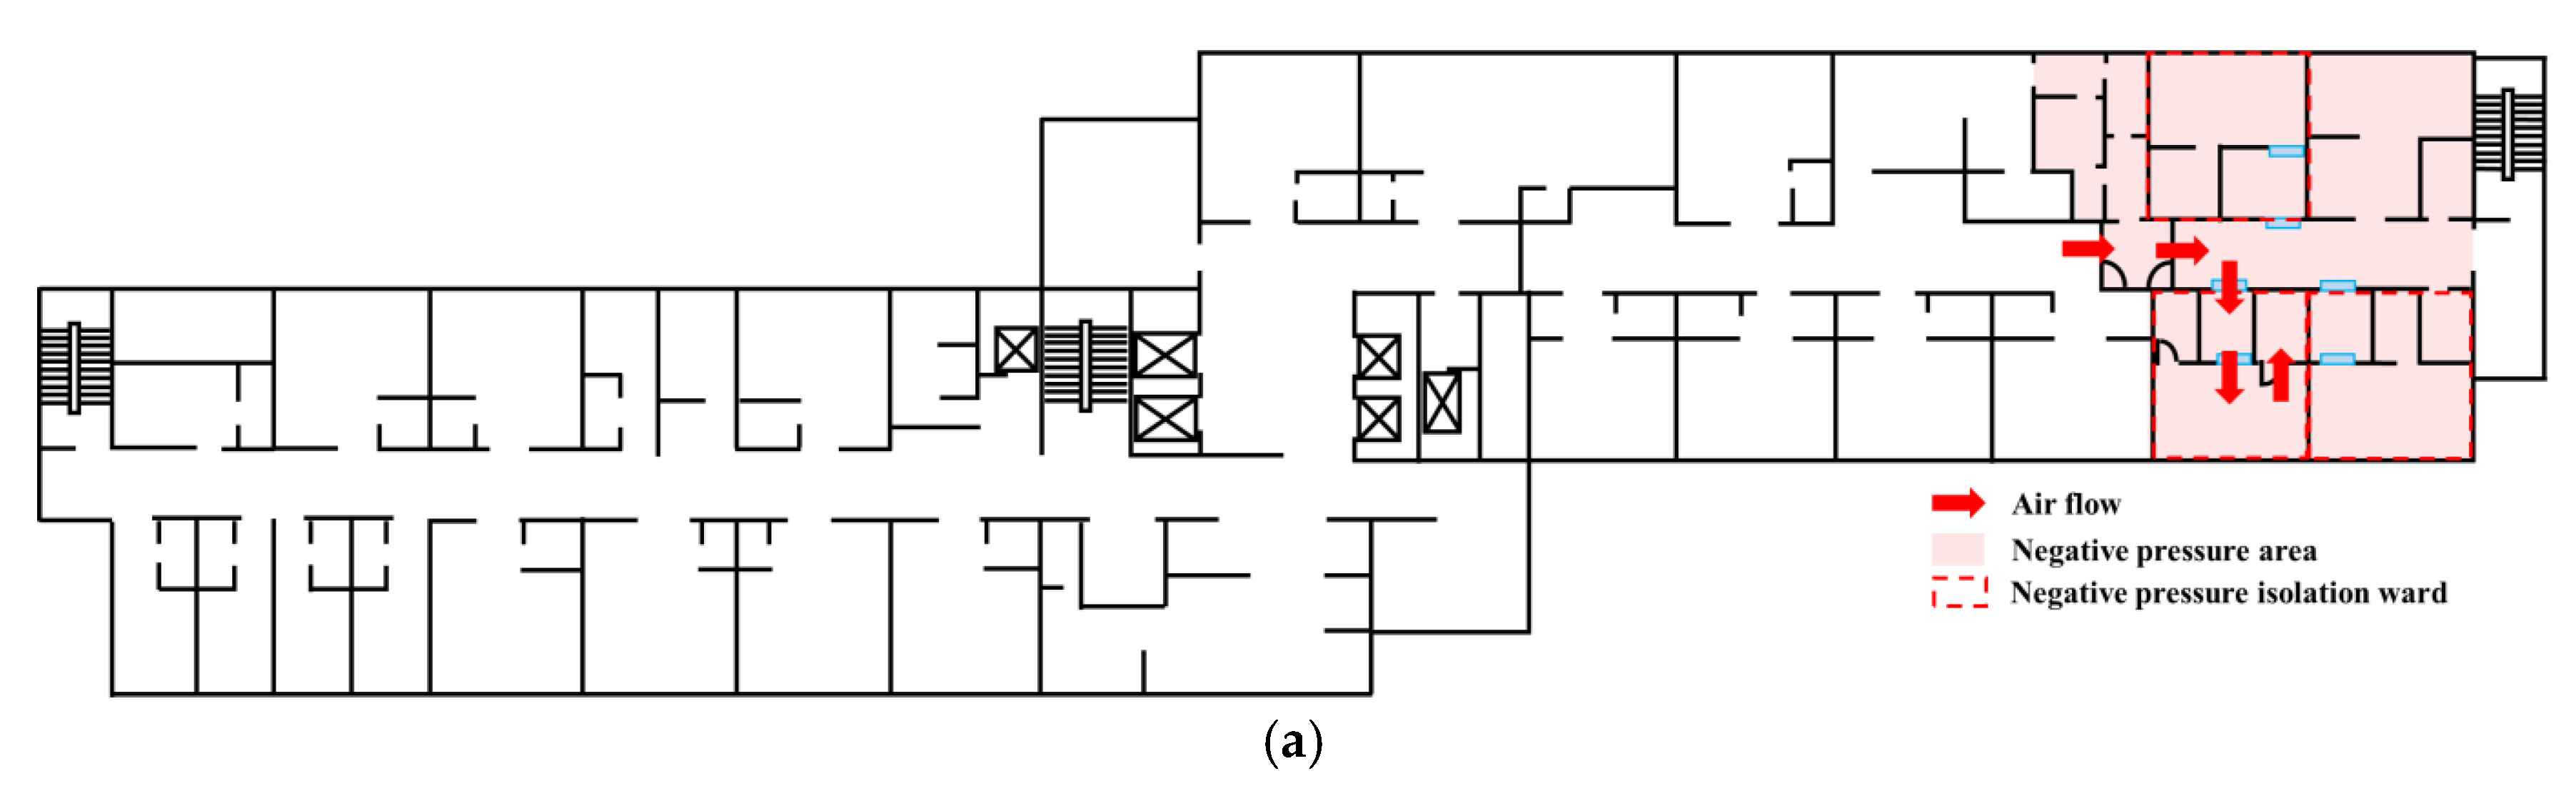
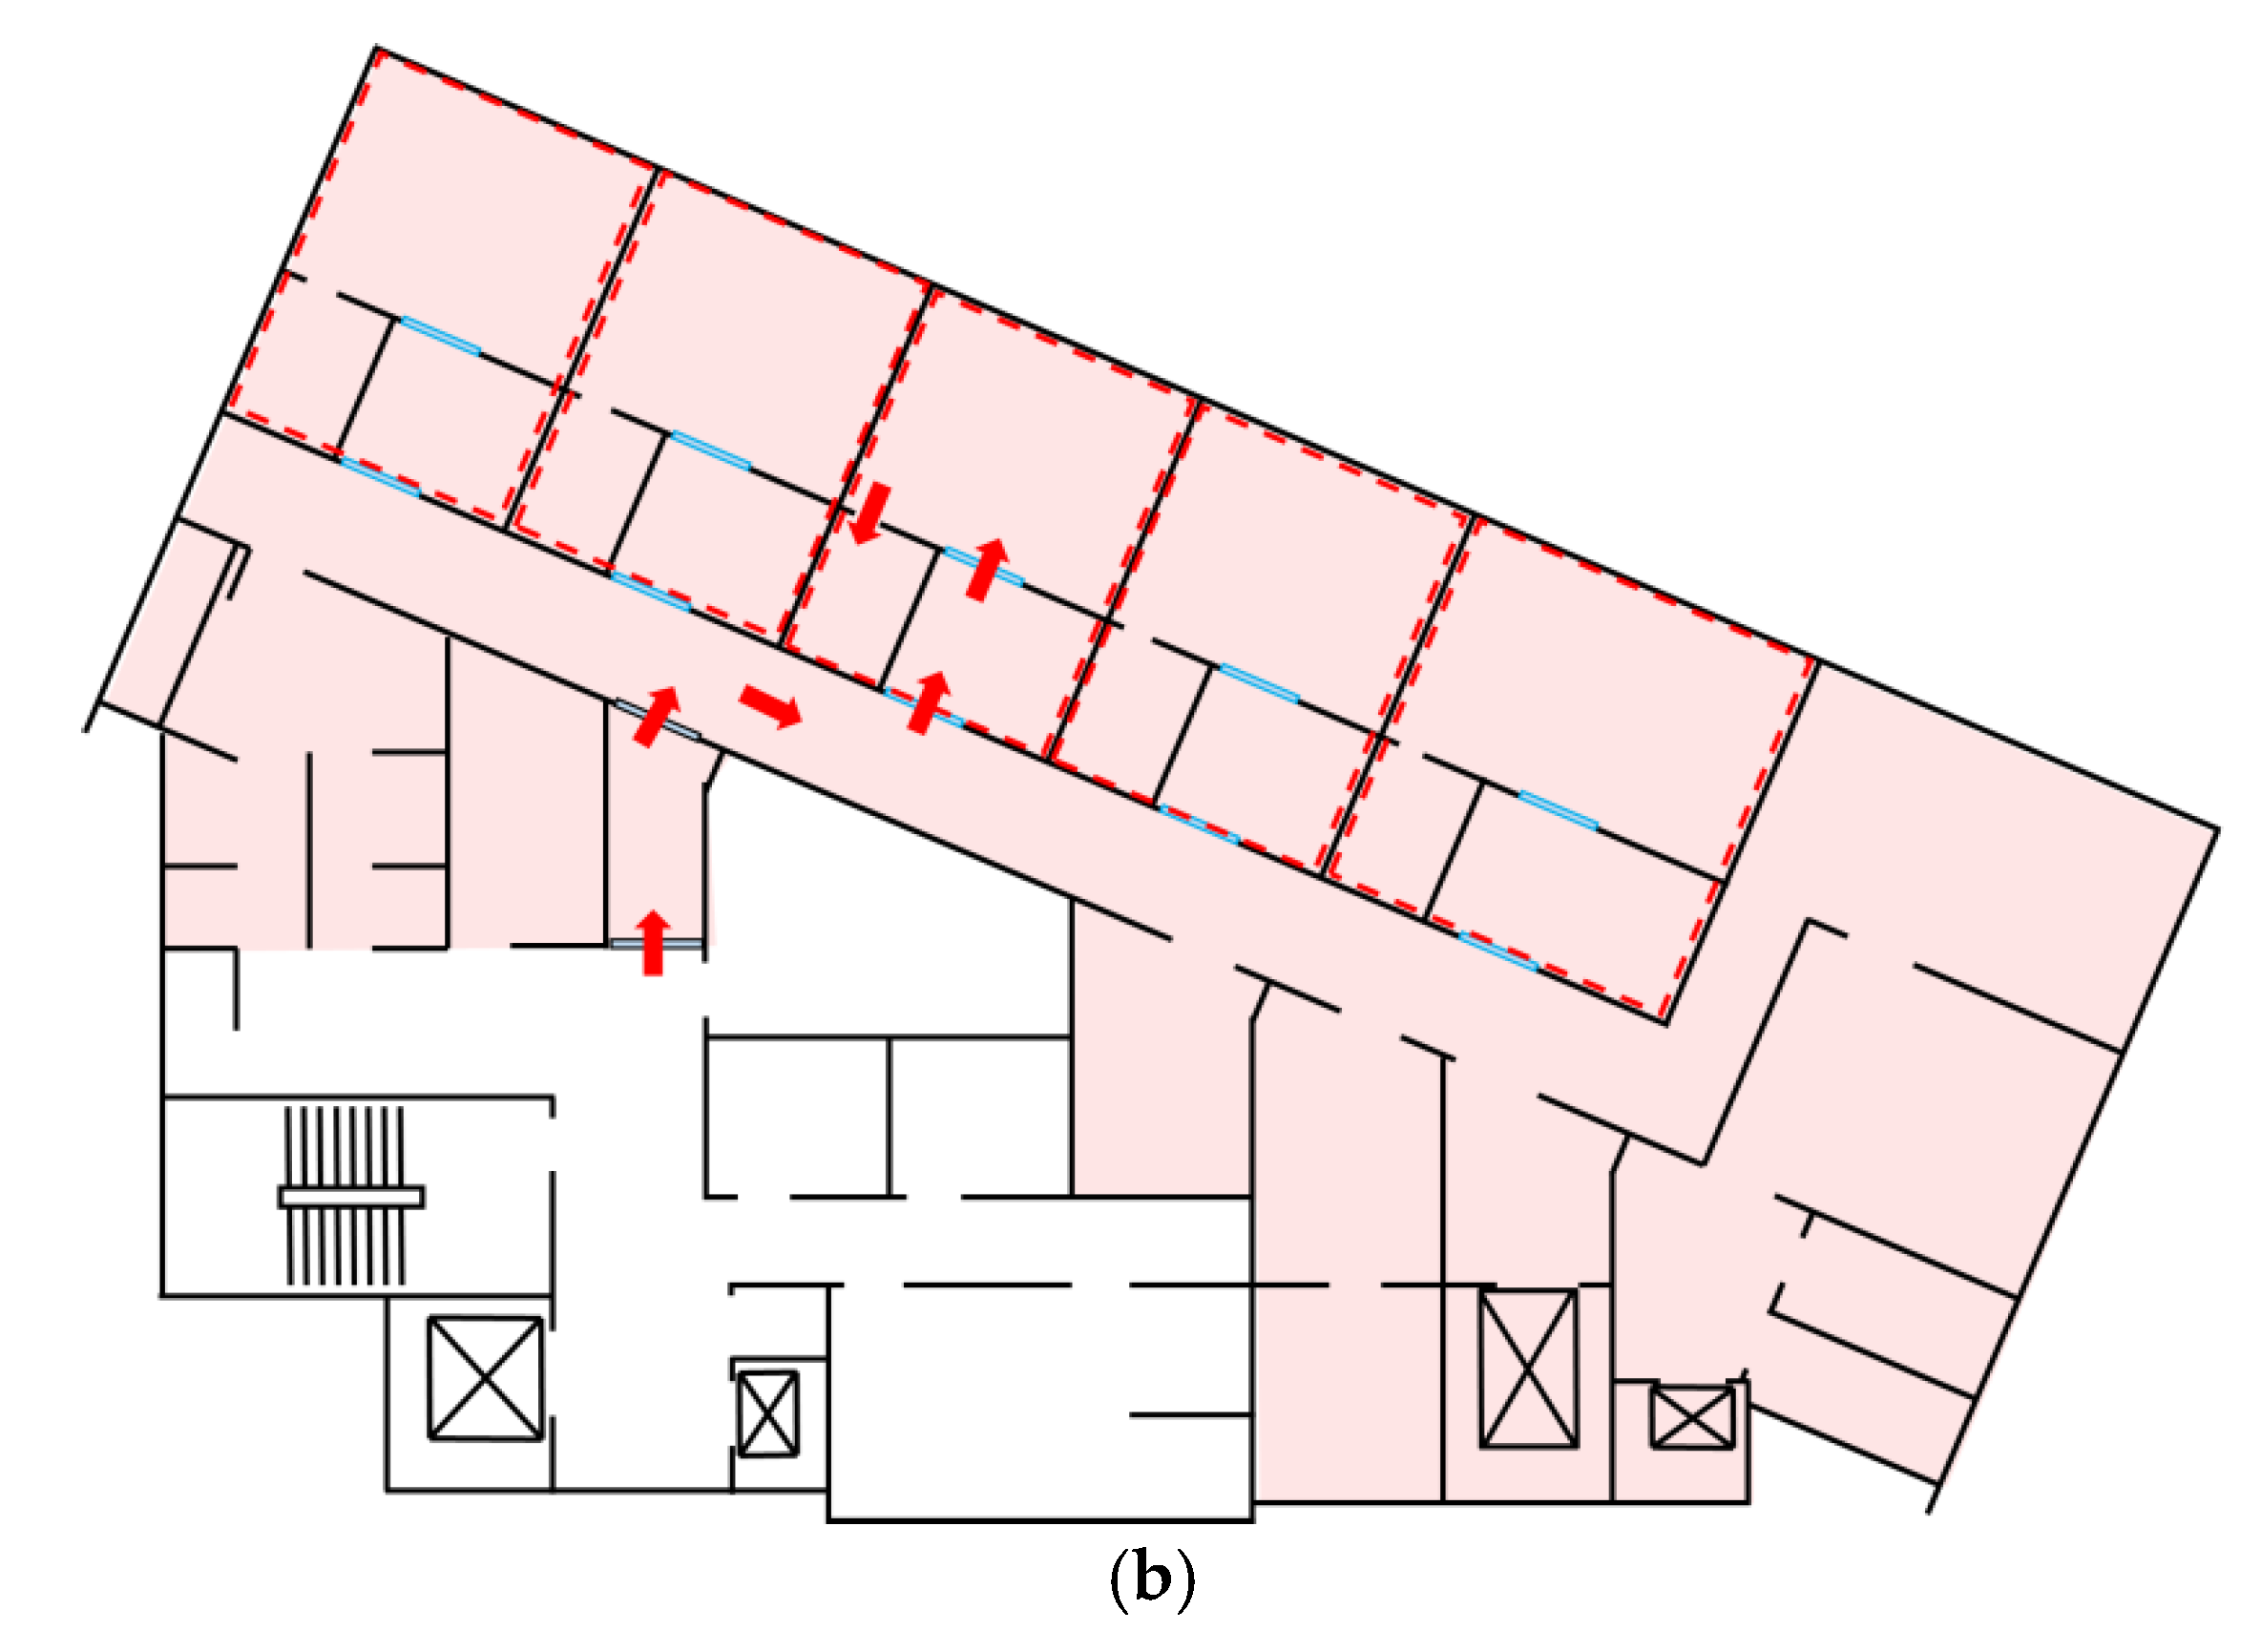
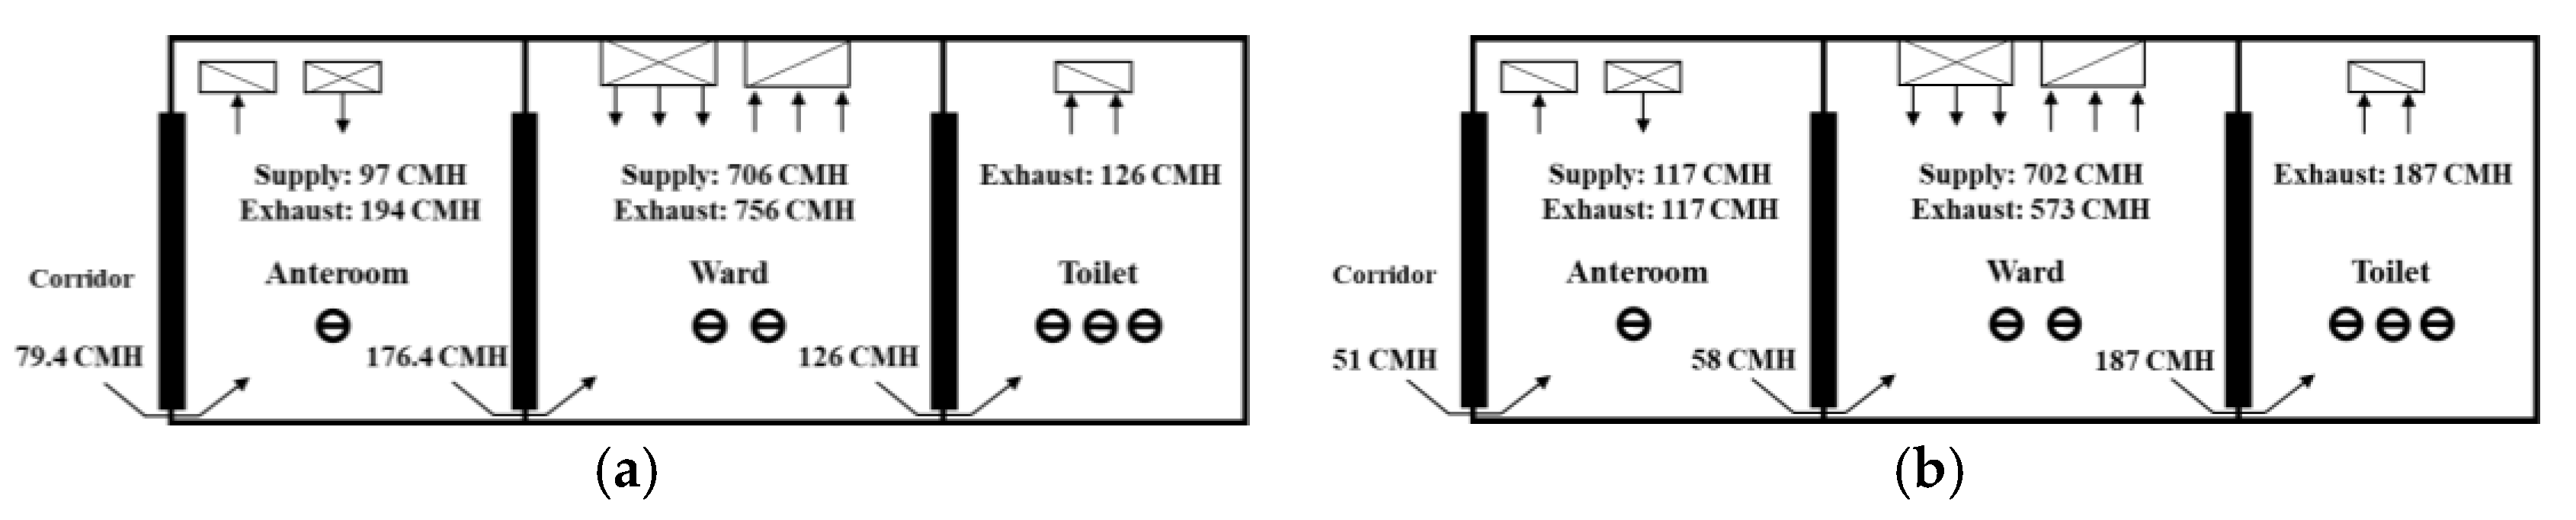
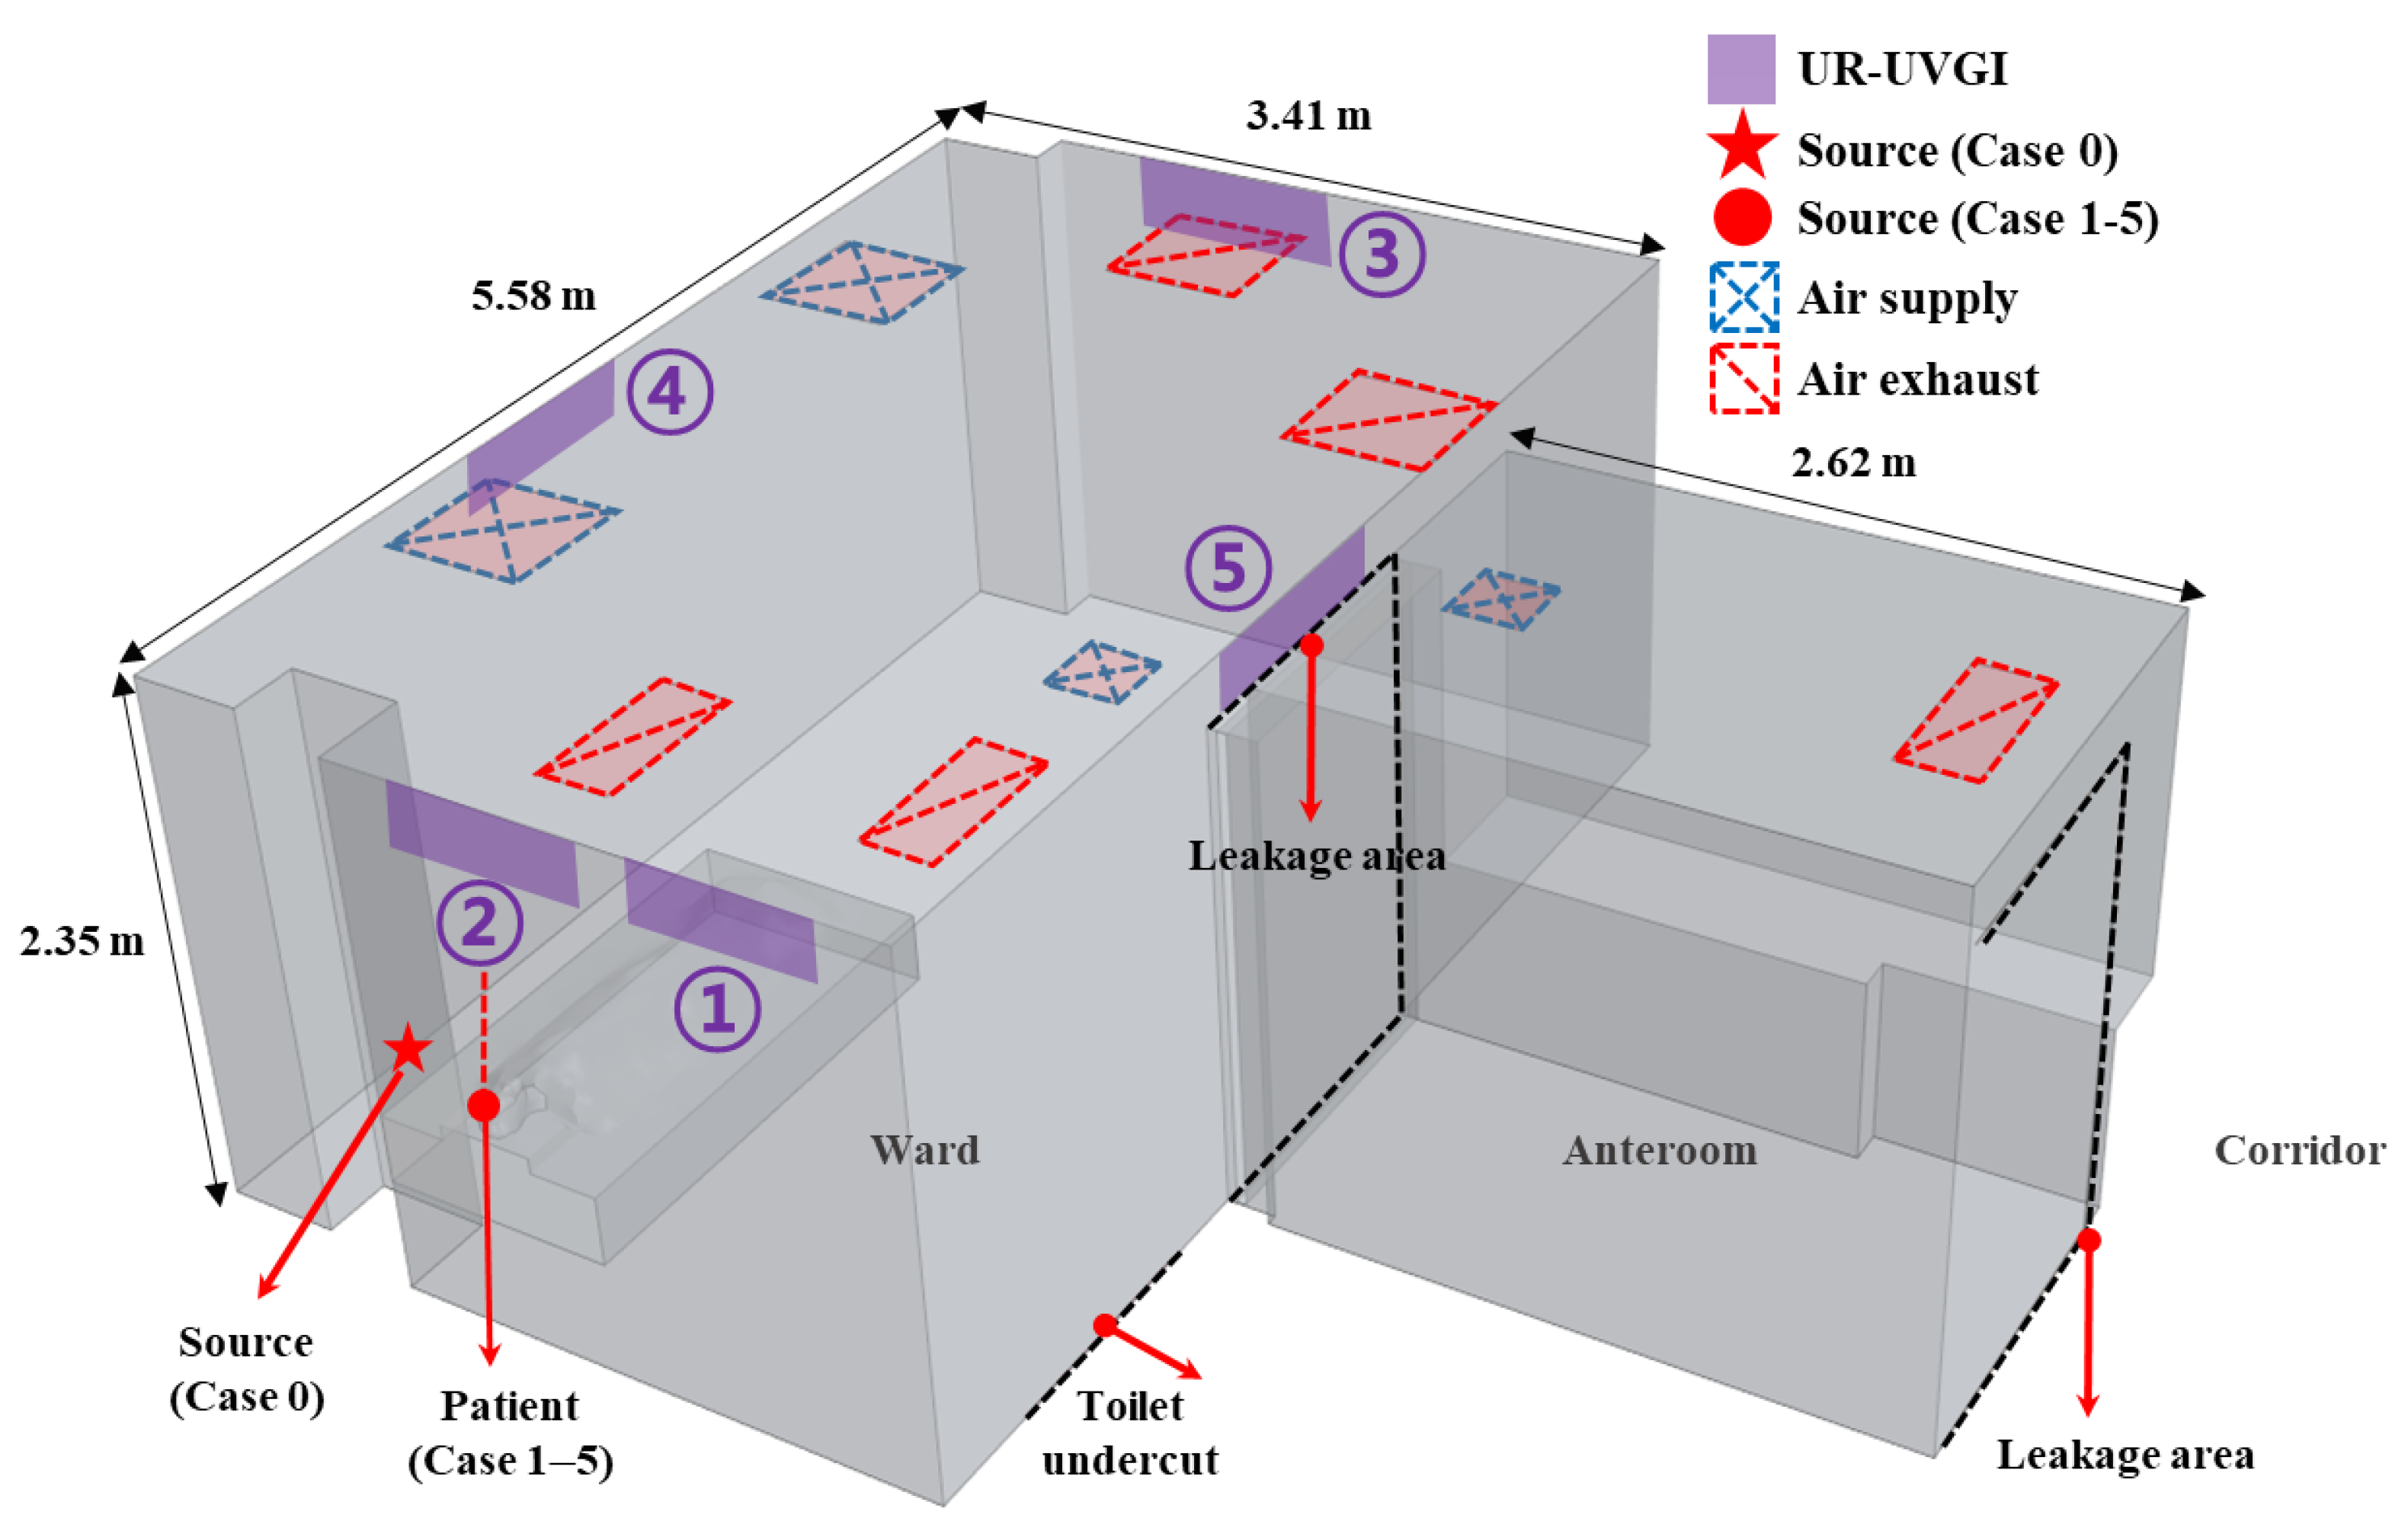
2.1. Study Subject: Negative Pressure Isolation Facility

The purpose of this study was to confirm the sterilization effects of the UR-UVGI system on not only indoor-generated airborne microorganisms, but also airborne microorganisms from adjacent areas. The concentration of airborne bacteria from adjacent areas was estimated to be lower in stand-alone negative pressure isolation facilities than in remodeled wards because the adjacent areas in the remodeled wards are used by other patients and medical staffs in the same building. Therefore, the experiment and CFD analysis on UR-UVGI performance were conducted for a remodeled facility only. Before the application of UR-UVGI, the level of airborne microorganisms flowing into a negative pressure isolation ward from adjacent areas was measured and compared for two facilities: a negative pressure isolation facility remodeled from an existing ward and a stand-alone negative pressure isolation facility.
As shown in Figure 1a, the remodeled negative pressure isolation facility consisted of a total of three negative pressure isolation wards and ancillary rooms. The measurement was performed for one of the three wards. Regarding ward ventilation, the air was supplied by an outdoor air handling unit (OHU) separately installed from the older part of the facility and removed by an exclusive exhaust fan that directed the air towards the rooftop. HEPA filters were installed at air supplies and exhausts in each negative pressure isolation ward to prevent microorganisms from flowing out of the wards. The differential pressure between rooms was maintained at 2.5 Pa or higher, with exhaust air volume being adjusted to exceed supply air volume, which generates airflow into the negative pressure isolation wards and bathrooms. The exhaust and supply air volumes used are shown in Figure 2a. The differential pressure was −6 Pa between the corridor and anteroom and −8 Pa between the anteroom and wards. The air change rate was 7.9 times/h in the anteroom and 17.9 times/h in the wards. At the time of measurement, the average temperature and humidity in the wards were 25 °C and 43%, respectively.
As shown in Figure 1b, the stand-alone negative pressure isolation facility consisted of a total of five negative pressure isolation wards and ancillary rooms. The measurement was performed in the same manner as for the remodeled facility. The facility was operated in compliance with standards, with air supply and exhaust regulated by a separate OHU, use of HEPA filters, and maintenance of differential pressure between rooms at 2.5 Pa or higher, so as to prevent microorganism outflow from the negative pressure isolation wards. The exhaust and supply air volumes are shown in Figure 2b. The differential pressure between the corridor and anteroom was −5.9 Pa and that between the anteroom and wards was −6 Pa. The air change rate was 9.8 times/h in the anteroom and 15 times/h in the wards. At the time of measurement, the average temperature and humidity in the wards were 20 °C and 50%, respectively.

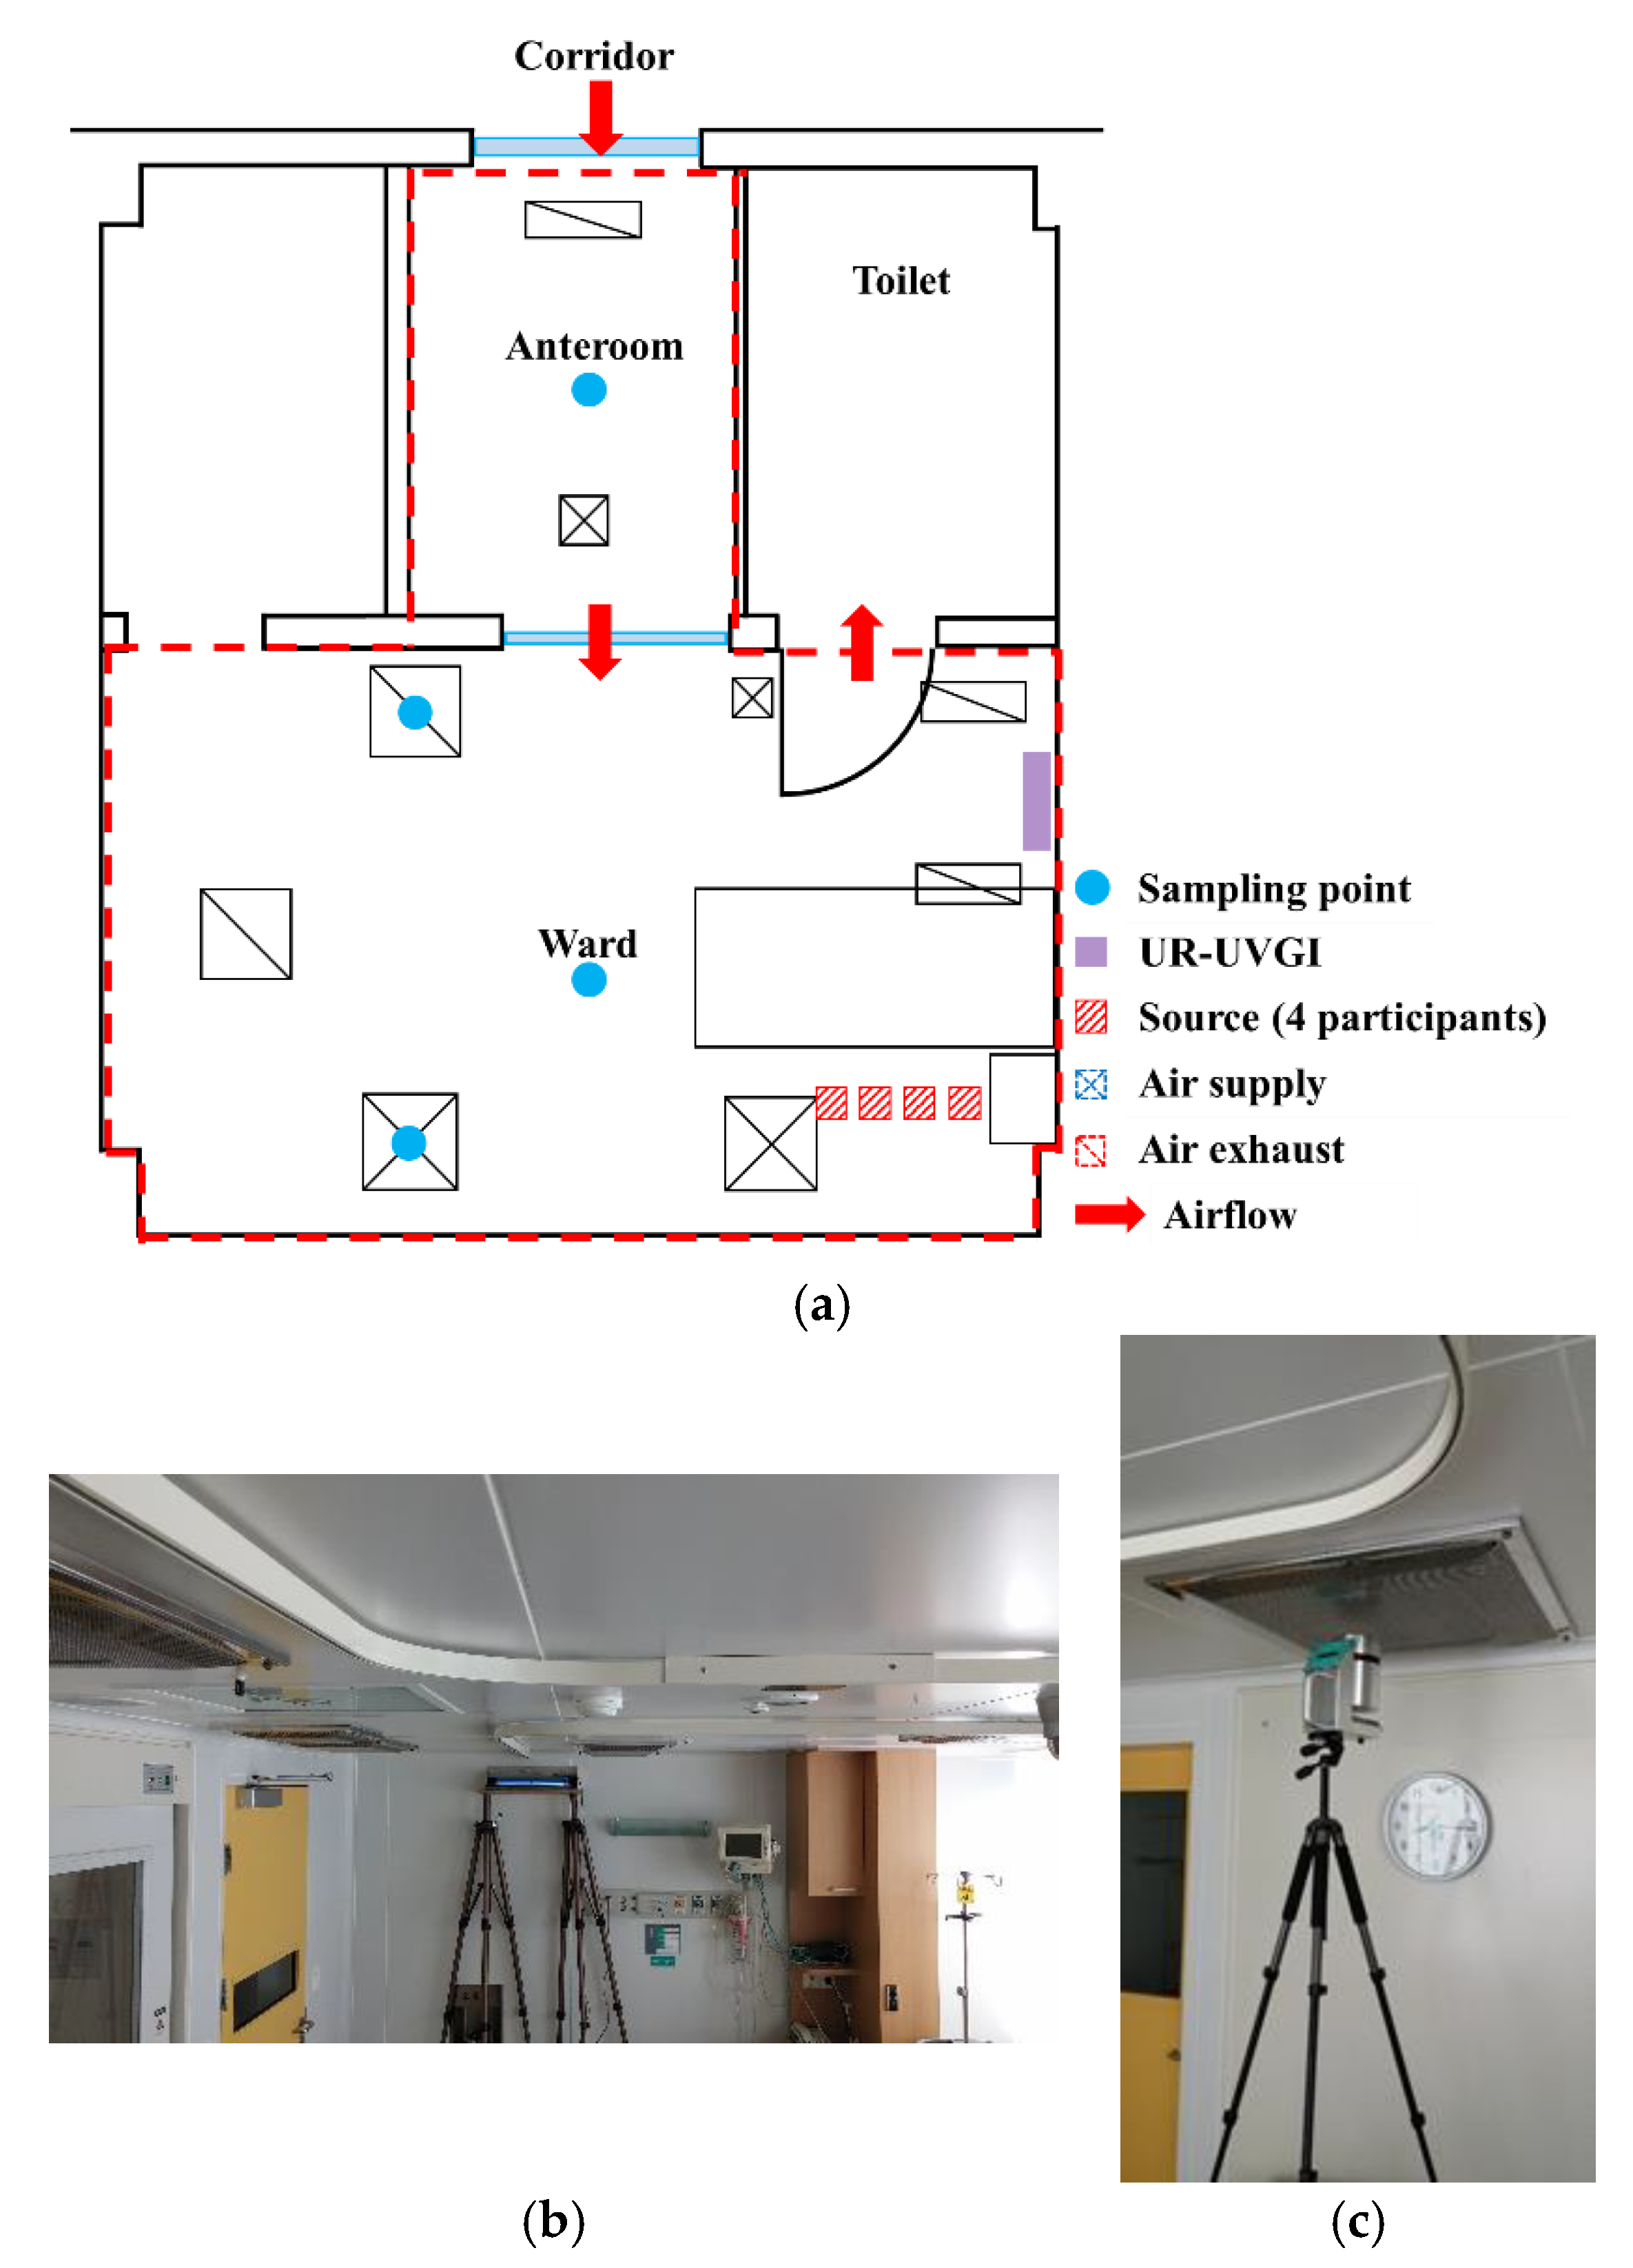
2.2. Experimental Setup

Prior to study commencement, the base concentration level was measured by sampling in order to identify airborne microorganisms flowing into the ward from adjacent areas within the stand-alone and remodeled facilities. The base concentration was sampled on trypticase soy agar (TSA) using MBS-1000 (Midori Anzen, Tokyo, Japan) and Bio-Culture (A.P. Buck, Inc., Orlando, FL, USA) impact air samplers, for 2 min and 30 s at 100 L/min. The sample was then cultured at 25 °C for two to three days before the bacterial colonies were counted and airborne bacterial concentration was quantified. The air samples were collected in the anteroom and ward center at a height of 1.2 m, near the air supplies and exhausts to minimize the environment effects.
Once the base concentration was confirmed, an XK15-60 (Shield Science, Kumamoto, Japan) UR-UVGI system with a 15-W output was installed in the upper area of the negative pressure isolation ward (Figure 3a). The system irradiates UV-C rays directly to upper space of room to sterilize airborne microorganisms. It was operated as usual to verify the sterilization effects of the UR-UVGI system with regard to airborne microorganisms. The system was installed at a height of 2.24 m from the ground beside a sickbed. The ceiling height and furniture layout in the ward were considered. In addition, comparison tests of airborne microorganism concentrations in the ward before and after operation of the UR-UVGI system were repeated four times. Apart from the airborne microorganisms flowing in from adjacent areas, airborne microorganisms were also generated within the negative pressure isolation wards, originating from the breaths and coughs of patients and during patient treatment by medical personnel. As actual patients could not participate in the study and the generation of airborne microorganisms using particle generator was not also applicable because the facility was being normally operated and used, healthy adults were employed in the study to generate airborne microorganisms instead. The number of airborne microorganisms generated by infected patients with respiratory diseases are usually higher than that by healthy people, due to coughing, sneezing and medical treatments such as intubation or suction. Four adults were positioned beside the sickbed to increase generation of airborne microorganism because microorganisms from an adult was not enough to identify the sterilization effect of UR-UVGI. The method used for sampling at this stage was identical to that used to sample the air to identify the base microbial concentration. The sampling locations were at the ward center and near the air supplies and exhausts, as shown in Figure 3a. The measurements were conducted for 1 h at 10-min intervals before operation of the UR-UVGI system (Figure 3b), and for 1.5 h in 10-min intervals after system operation was begun (Figure 3c).

2.3. Numerical Simulation

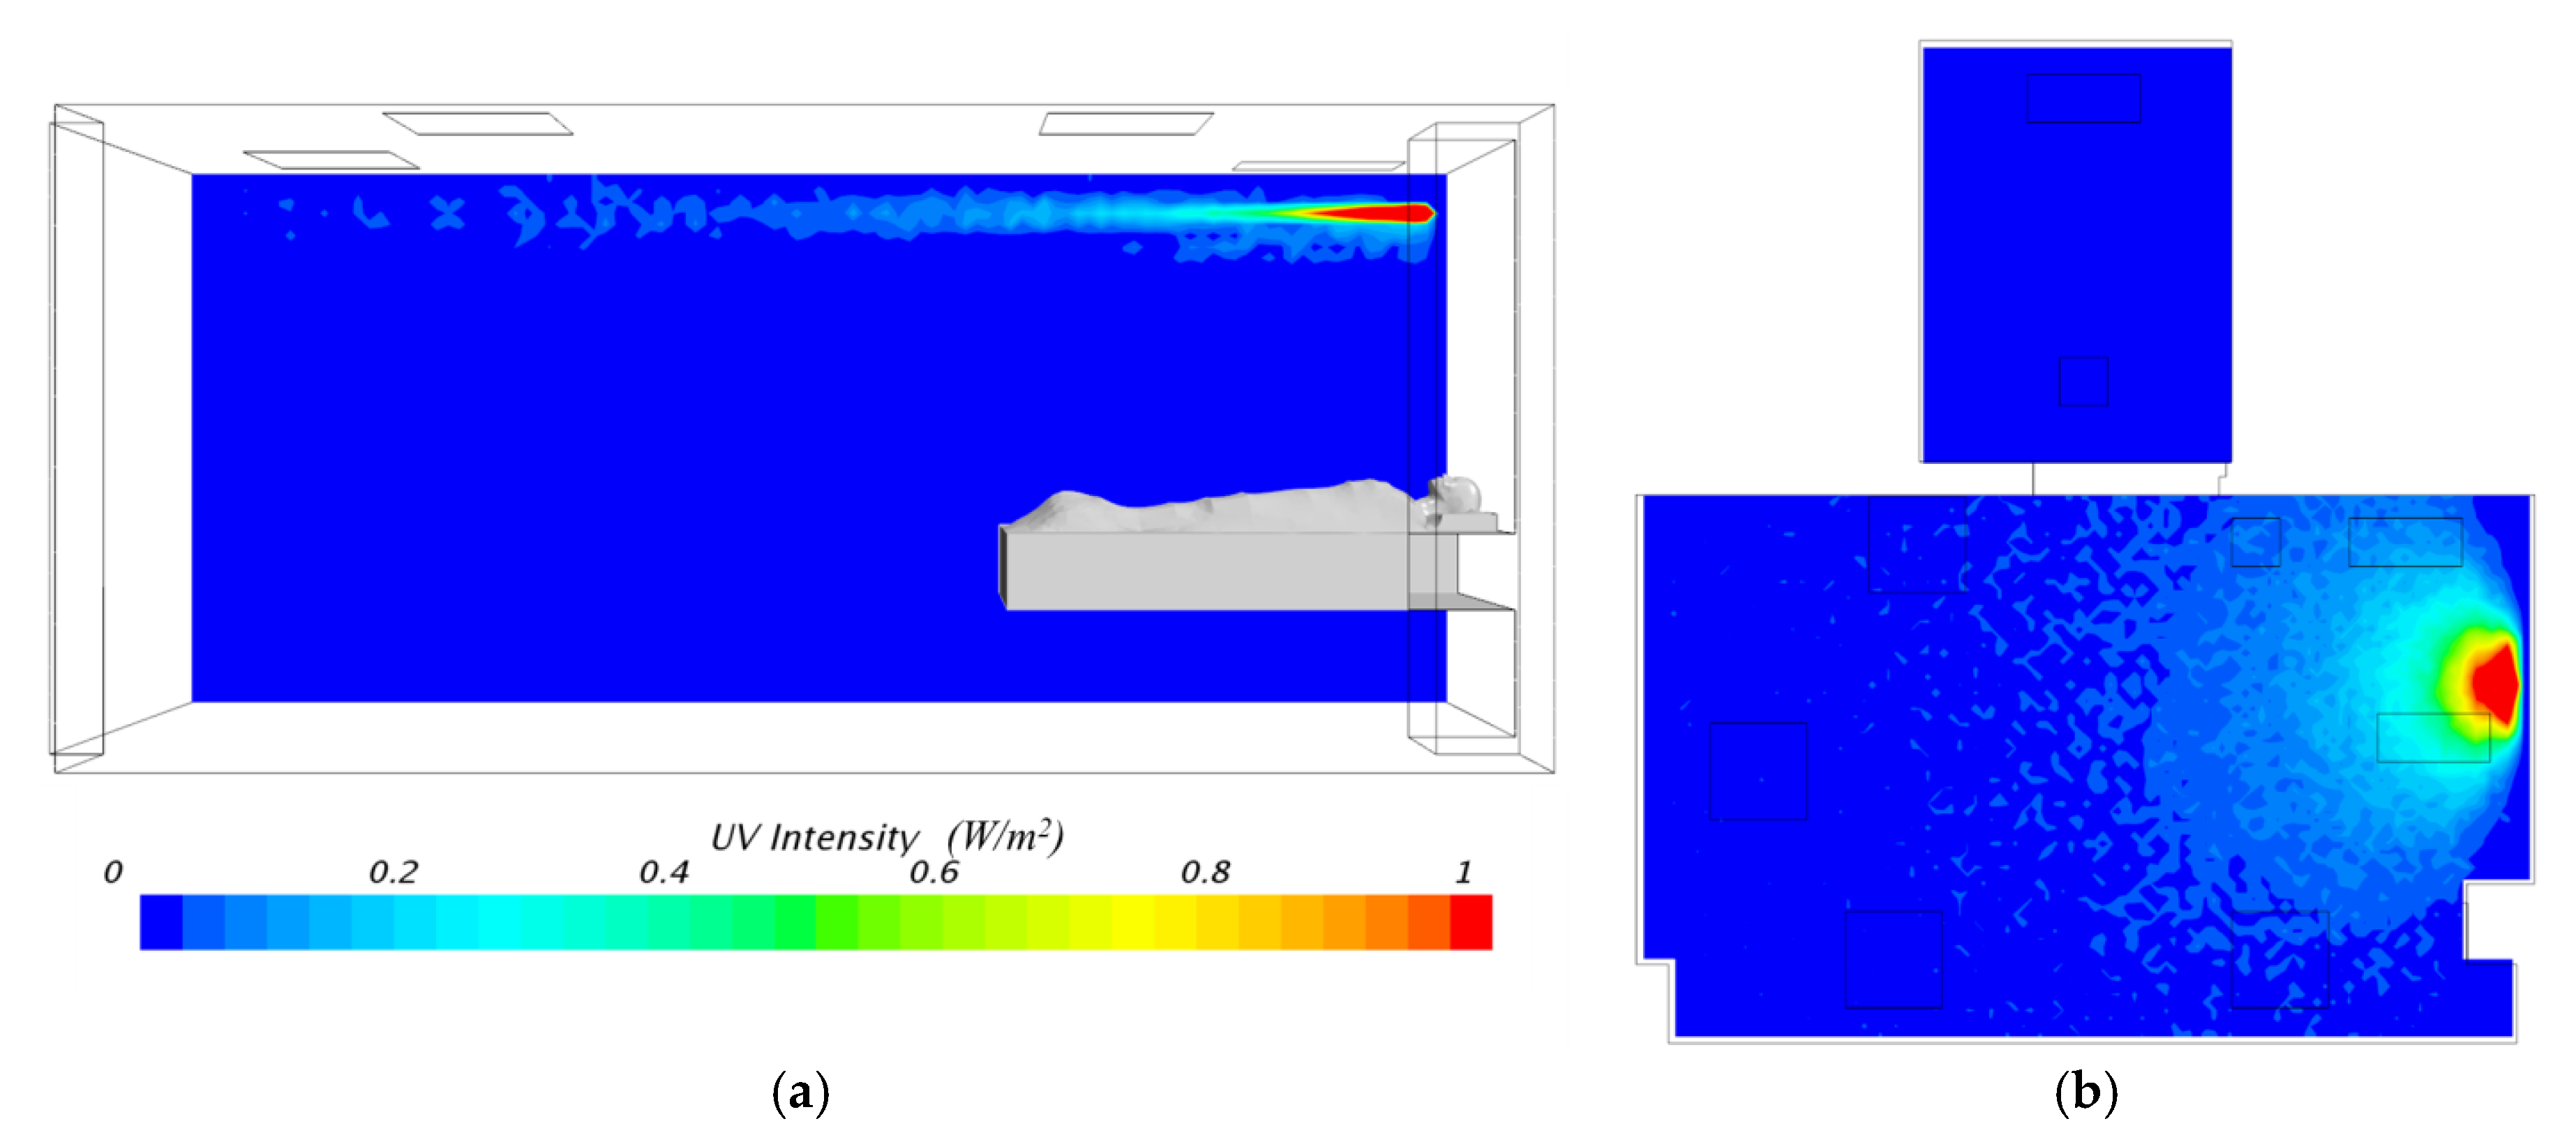
2.3.1. UV Intensity Distribution

The UV intensity distribution required to estimate UR-UVGI system performance was calculated using the Radiance raytracing package developed by Lawrence Berkeley National Laboratory. As shown in Figure 4, a model of the UR-UVGI system used in the study was constructed. The material reflectivity of the UR-UVGI system components given by the model are listed in Table 2 [30]. The output of the UV lamp was determined by comparing experimental measurements performed at 1 m distance from the UR-UVGI system.

2.3.2. CFD Simulation

To estimate and compare UR-UVGI performance under more varied conditions, a CFD simulation was conducted using the STAR CCM+ commercial program (Siemens, Erlangen, Germany). A model of the negative pressure isolation ward in which the actual field experiment was performed was created, as shown in Figure 5. The number of grid units (trimmer mesh) for analysis was approximately 700,000. The realizable k-ε turbulence model which is acceptable for solving indoor air problem [31] was used, and measured values were used to determine the environmental conditions, such as the exhaust and supply air volumes. The airborne microorganism concentrations in the CFD model were determined at the ward center and near the air exhausts, corresponding to the sources used for the experiment samples. The average concentration for the ward was also determined. The airborne microorganisms were categorized into two groups before implementation of CFD analysis: microorganisms flowing inward from adjacent areas through the anteroom (ABInflow) and those generated by patients in the ward (ABPatient).
Prior to conducting CFD analysis for the different sources of the UR-UVGI system, an analysis to obtain results from the actual experiment was conducted for comparison. The simulation conditions described above were used, and the contaminant source position was selected 0.6 m above floor and about 0.2 m from bedside to correspond to the positioning of the four adults in the field measurement (Case 0). For subsequent cases, the contaminant source was positioned on the face of a patient model on the sickbed as shown in Figure 5. All case simulations were conducted under steady-state conditions. In addition, CFD analysis was performed for locations corresponding to different UVGI system locations on the center of each upper wall, which were selected to irradiate UV-C rays from UR-UVGI to the entire upper room area, as shown in Figure 5. Five case simulations were conducted with different UR-UVGI installation locations. In Case 1, the simulated UR-UVGI system was installed in the same location as in the field experiment. In Case 2, the system was installed immediately above the patient’s head and in the upper part of the sickbed. In Case 3, the system was installed in a location opposite to that of Case 2. In Case 4, the simulated UR-UVGI system was installed opposite to the entrance and in Case 5, it was installed above the entrance, at a point opposite to the Case 4 location.
We estimated the sterilization effect of the UR-UVGI system used in this study on airborne microorganisms using a scalar transport equation for CFD analysis. The survival rate (SR) of microorganisms with the UR-UGVI system is defined as follows:
S R = C t / C o =   e k I t ,
where Ct is the airborne microorganism concentration level after t seconds exposure and Co is the initial concentration. k indicates the UV sterilization coefficient (m2/J) which is a characteristic of each microorganism how sensitive it is to UV-C rays. I is the UV intensity (W/m2), and t indicates the exposure duration (s). In other words, the sterilization effects are determined by k, I, and t.
The airborne microorganism concentration distribution is obtained from the scalar transport equation:
C t + U C x j =   x j ( v t σ C x j ) + S ,
where C is the concentration of microorganisms per unit volume (cfu/m3), U is the (u, v, w) velocity of the transporting fluid (i.e., air (m/s)), v t is the kinematic diffusivity (m2/s),   x is a coordinate and S is a volumetric source or sink term (cfu/m3s). By adding derivative of Equation (1) for S as a sink term in Equation (2), we obtain the following [32]:
C t + U C x j =   x j ( v t σ C x j ) k I C ,
We can calculate the concentration distribution of airborne microorganisms decreased by UR-UVGI using Equation (3). Equation (3) involves k; thus, a value corresponding to the type of airborne microorganism must be decided before the calculation. In this study, Mycobacterium tuberculosis (k = 0.472 m2/J) was designated as ABPatient and the H1N1 influenza virus (k = 0.12 m2/J) was designated as ABInflow. ABPatient was the microorganism contamination positioned at the face of the patient on the sickbed, whereas ABInflow represented the contamination that entered through the gap between the corridor and anteroom. ABInflow concentration was calculated based on air volume flowing in from the corridor to the anteroom, the supply and exhaust air volumes in the anteroom, and the concentration of airborne microorganisms in the ward center. The generated ABPatient level was calculated by excluding contaminants due to air inflow into the ward and the contaminants flowing into the ward center.

3. Results

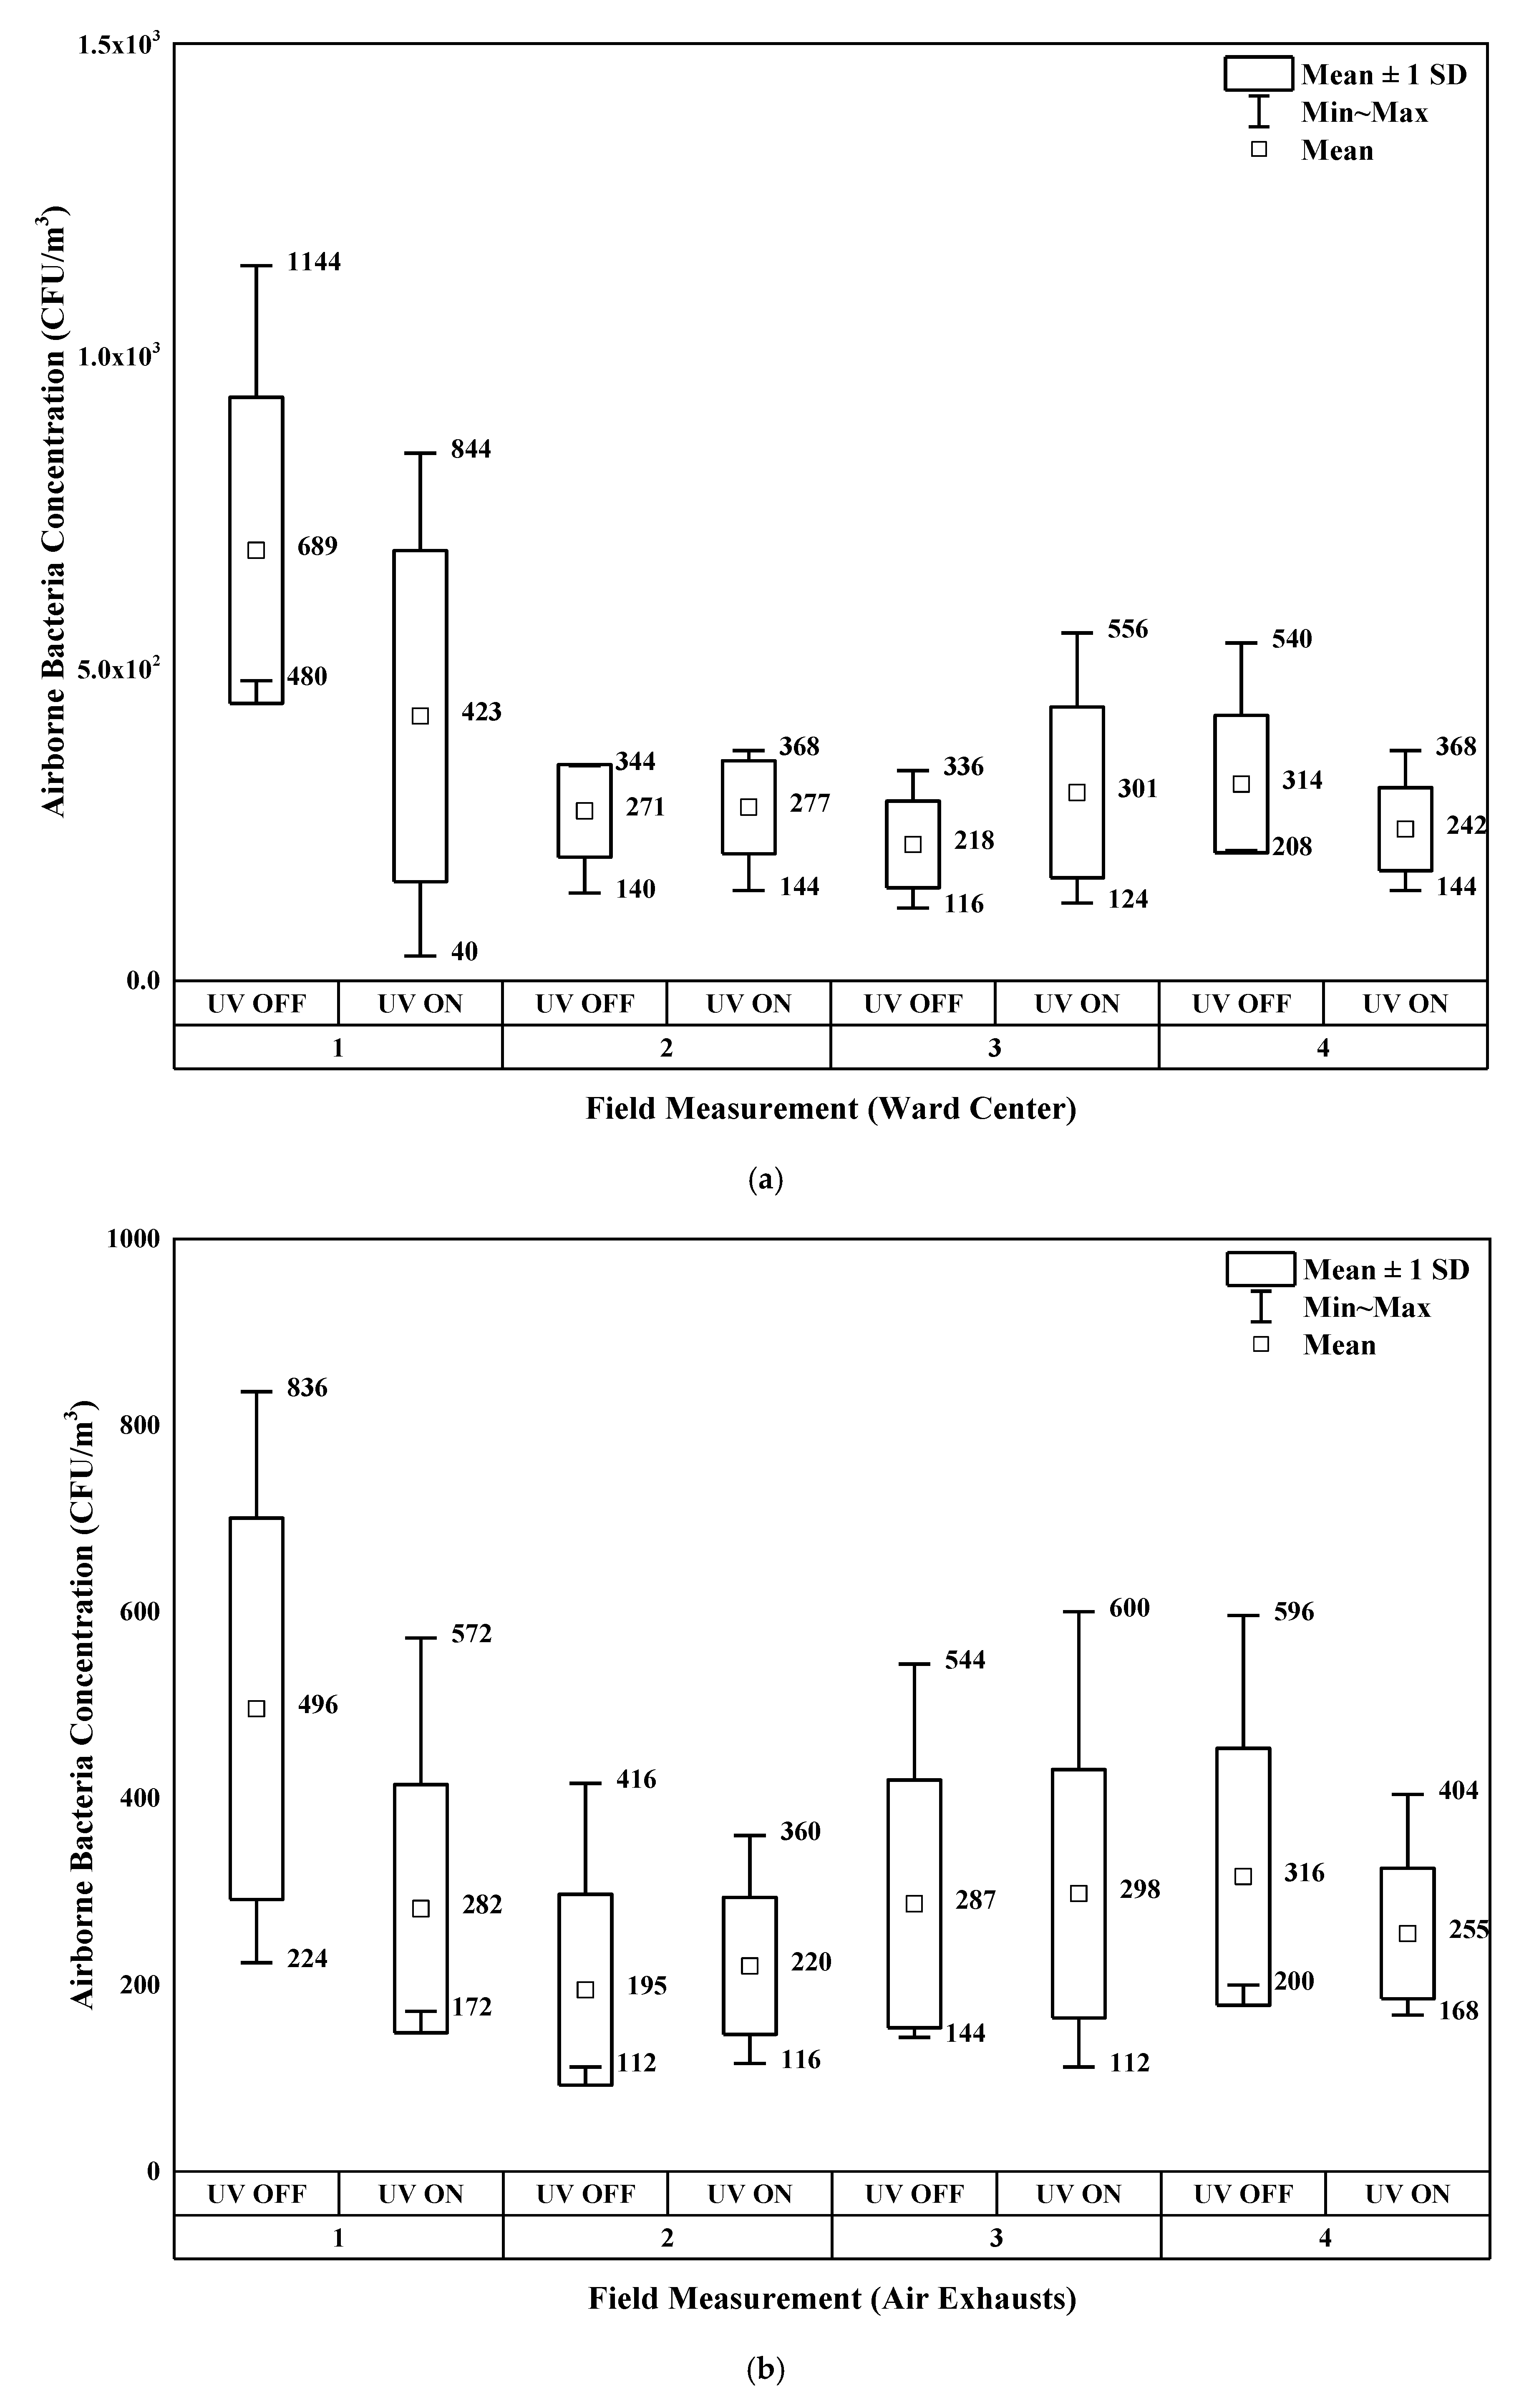
3.1. Experimental Results

Table 3 lists the measured base concentrations of airborne microorganisms in the remodeled and stand-alone negative pressure isolation facilities. The base concentrations measured in the remodeled facility were high in both the anteroom and ward. This is assumed to be a result of the inflow of airborne microorganisms into the ward from the corridor and adjacent areas, as there were almost no sources of contaminants within the ward or airborne microorganisms in the air supplied from the HEPA filters. The base concentration in the stand-alone facility was significantly lower than that in the remodeled facility, with almost zero inflow of airborne microorganisms into the ward from the anteroom, where a certain level of airborne microorganisms was observed. Therefore, the application of the UR-UVGI system in the stand-alone negative pressure isolation ward was not investigated further.
The results of the experiment using UR-UVGI in remodeled facility are shown in Figure 6. In the first measurements, the concentration of airborne microorganisms in the negative pressure isolation ward showed a general tendency to decrease. The average concentrations were 689 (±245) and 423 (±265) CFU/m3 in the ward center before and after operation of the UR-UVGI system, respectively, indicating a reduction of approximately 39%. The average concentrations were 496 (±205) and 282 (±133) CFU/m3 near the air exhausts before and after operation of the UR-UVGI system, respectively, indicating a reduction of approximately 43%. In the second set of measurements, the average concentrations were 271 (±74) and 277 (±75) CFU/m3 in the ward center before and after operation of the UR-UVGI system, respectively, indicating an increase of approximately 2%. The average concentrations were 195 (±102) and 220 (±73) CFU/m3 near the air exhausts before and after operation of the UR-UVGI system, respectively, indicating an increase of approximately 13%. This result is assumed to be to the result of fluctuation in the airborne microorganism concentration levels during measurement and the lower base concentration in the second set of measurements compared to the first, yielding less clear sterilization effects from the system. In the third set of measurements, the average concentrations were 218 (±69) and 301 (±137) CFU/m3 in the ward center before and after operation of the UR-UVGI system, indicating an increase of approximately 38%. Furthermore, the average concentrations were 287 (±133) and 298 (±133) CFU/m3 near the air exhausts before and after operation of the UR-UVGI system, respectively, indicating an approximately 4% increase in concentration. This result is assumed to be to the result of an increase in the concentration of airborne microorganisms in adjacent areas, as persons (instructors and trainees) were present during operation of the UR-UVGI system when the third set of measurements were performed. In the fourth set of measurements, the average concentrations were 314 (±110) and 242 (±66) CFU/m3 in the ward center before and after operation of the UR-UVGI system, respectively, indicating a decrease of approximately 23%. Furthermore, the average concentrations were 316 (±138) and 255 (±70) CFU/m3 near the air exhausts before and after operation of the UR-UVGI system, indicating an approximately 19% decrease.

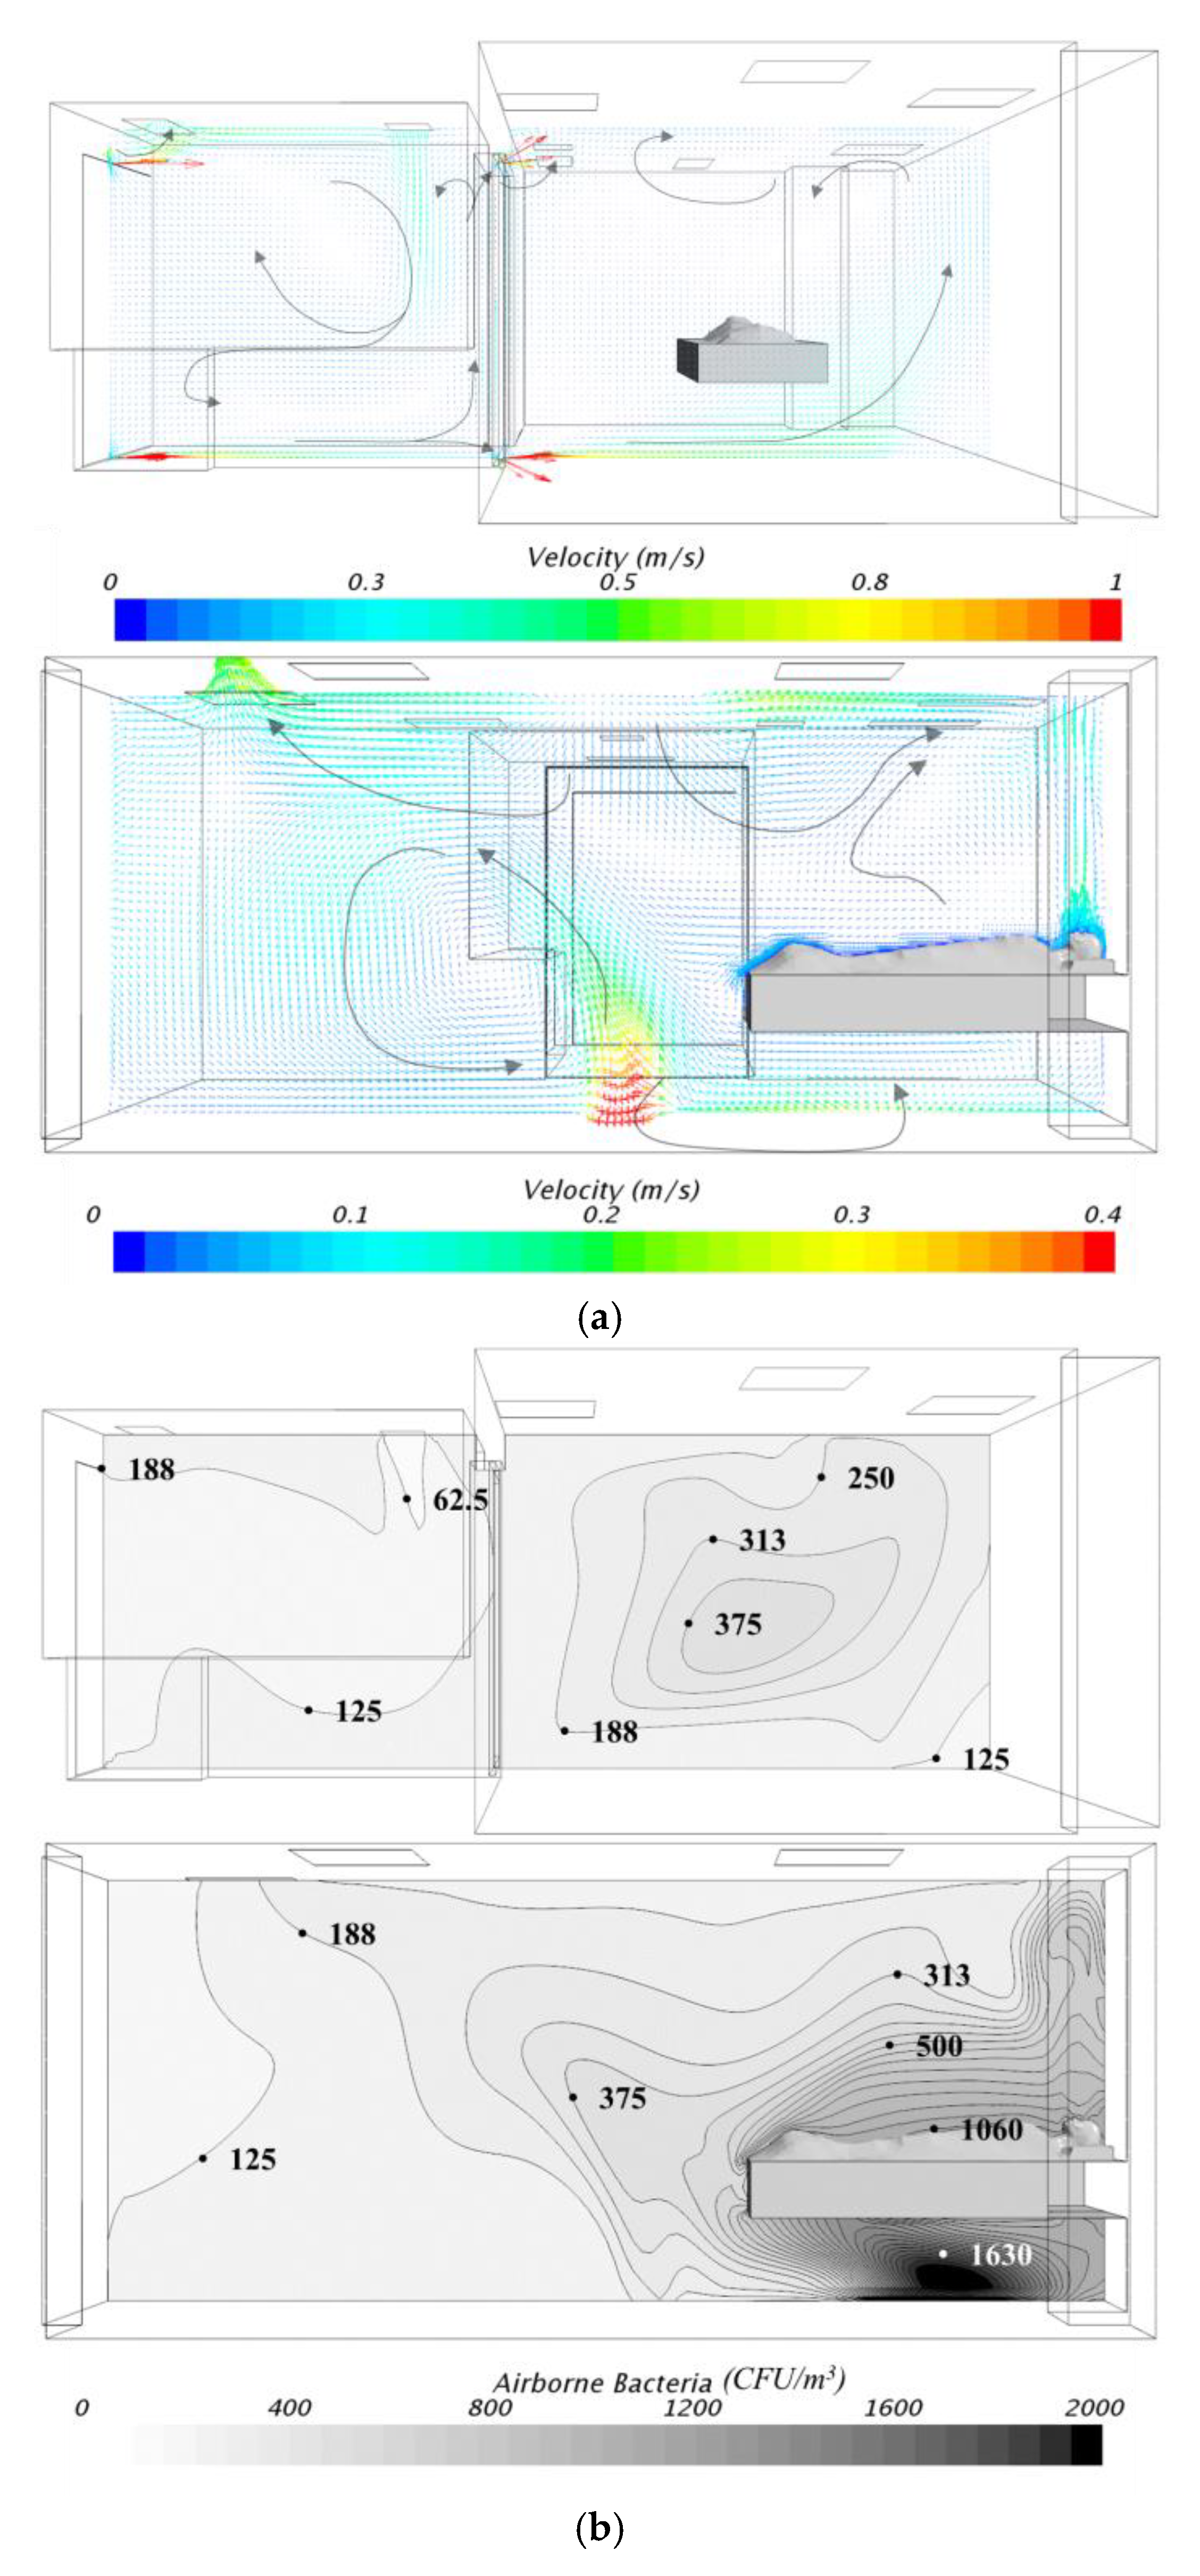
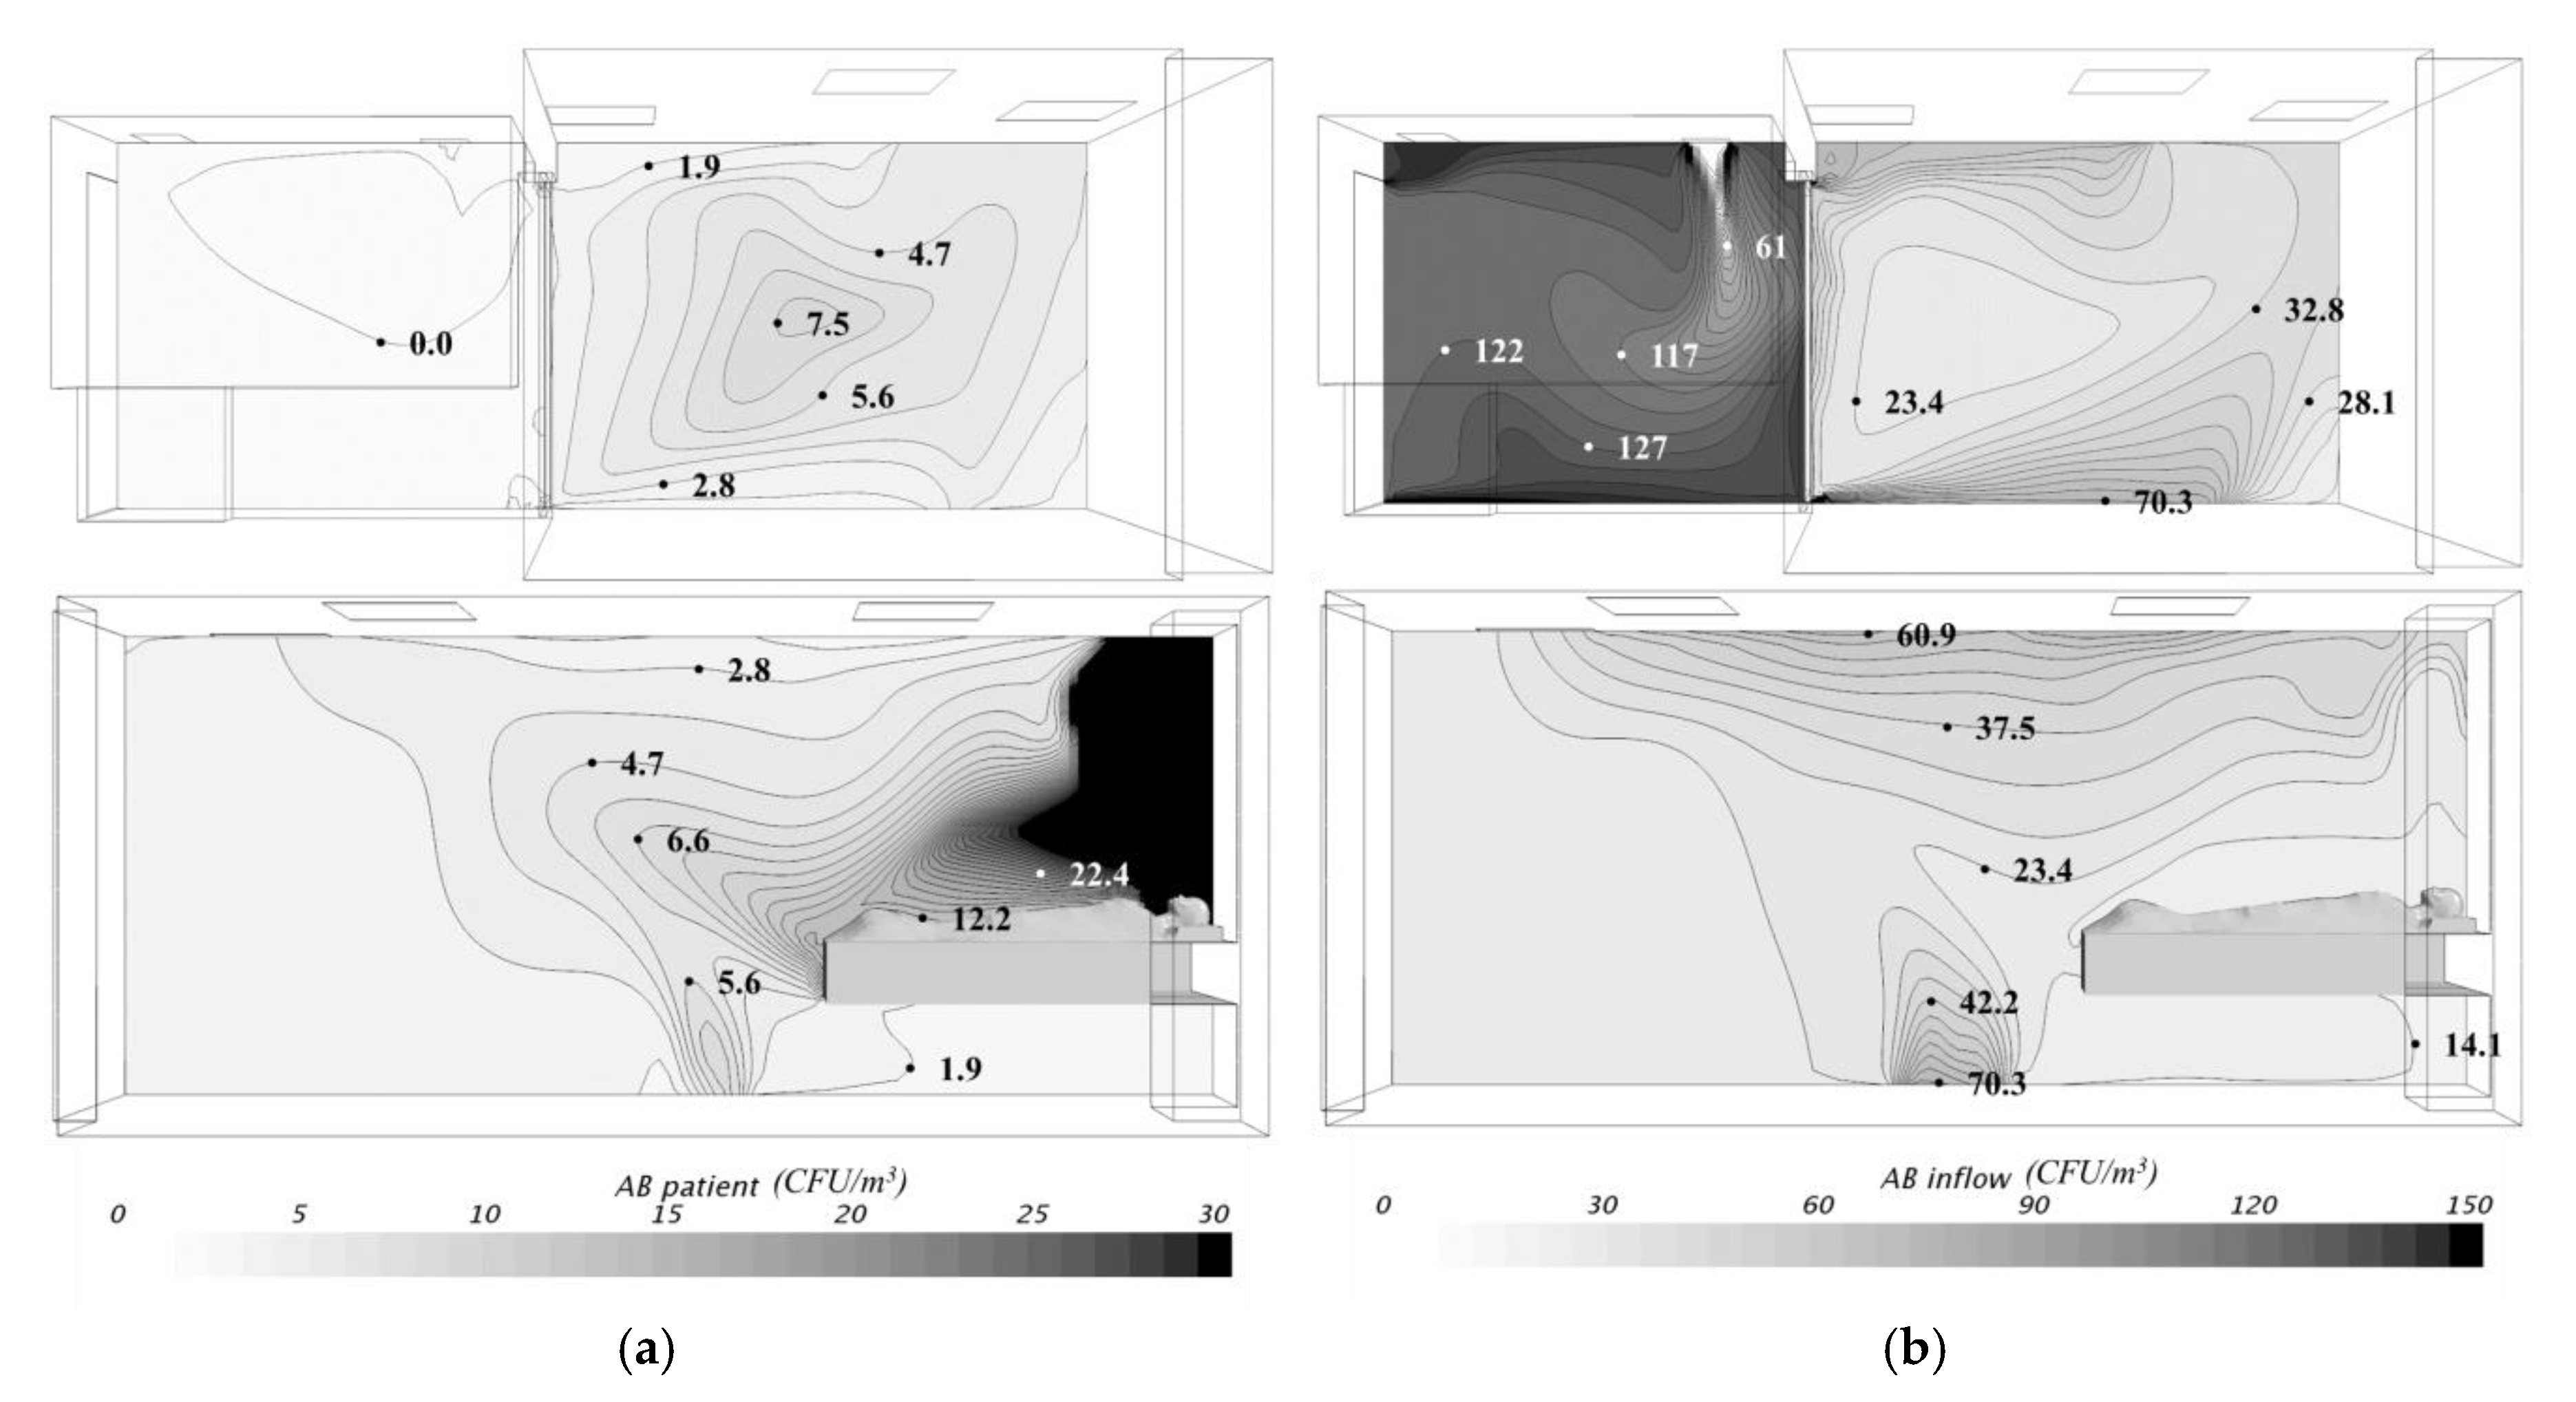
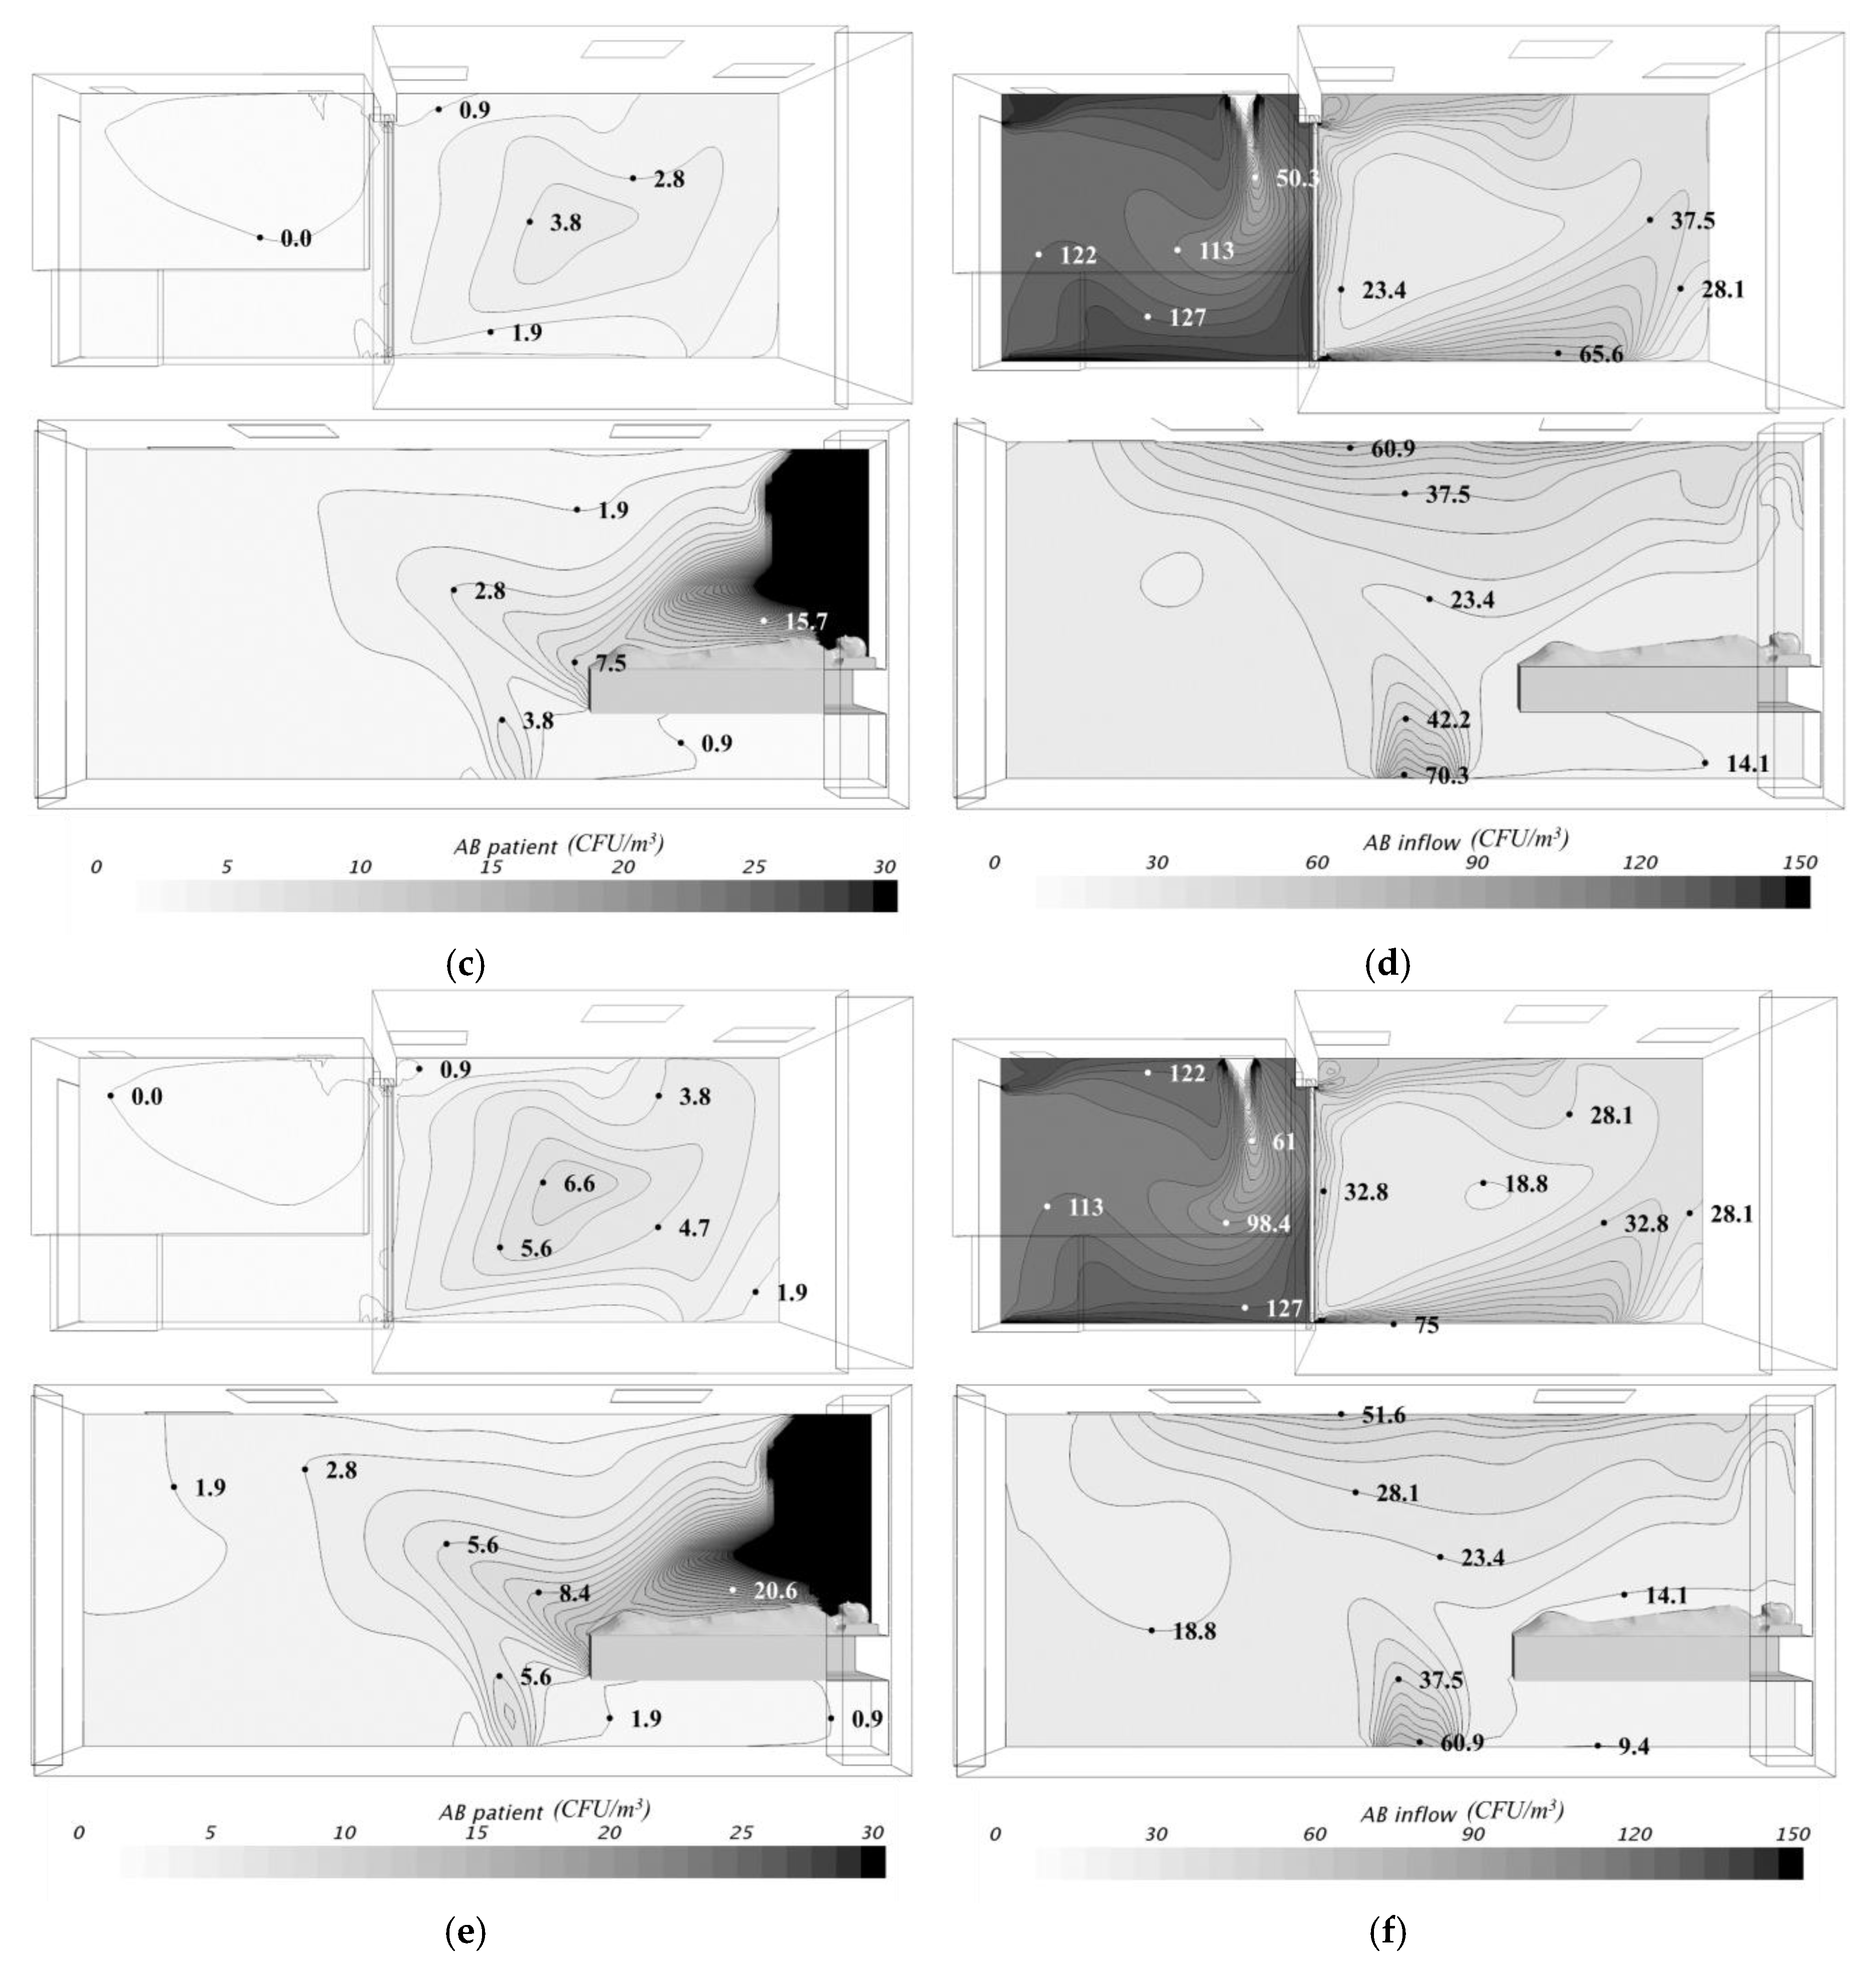
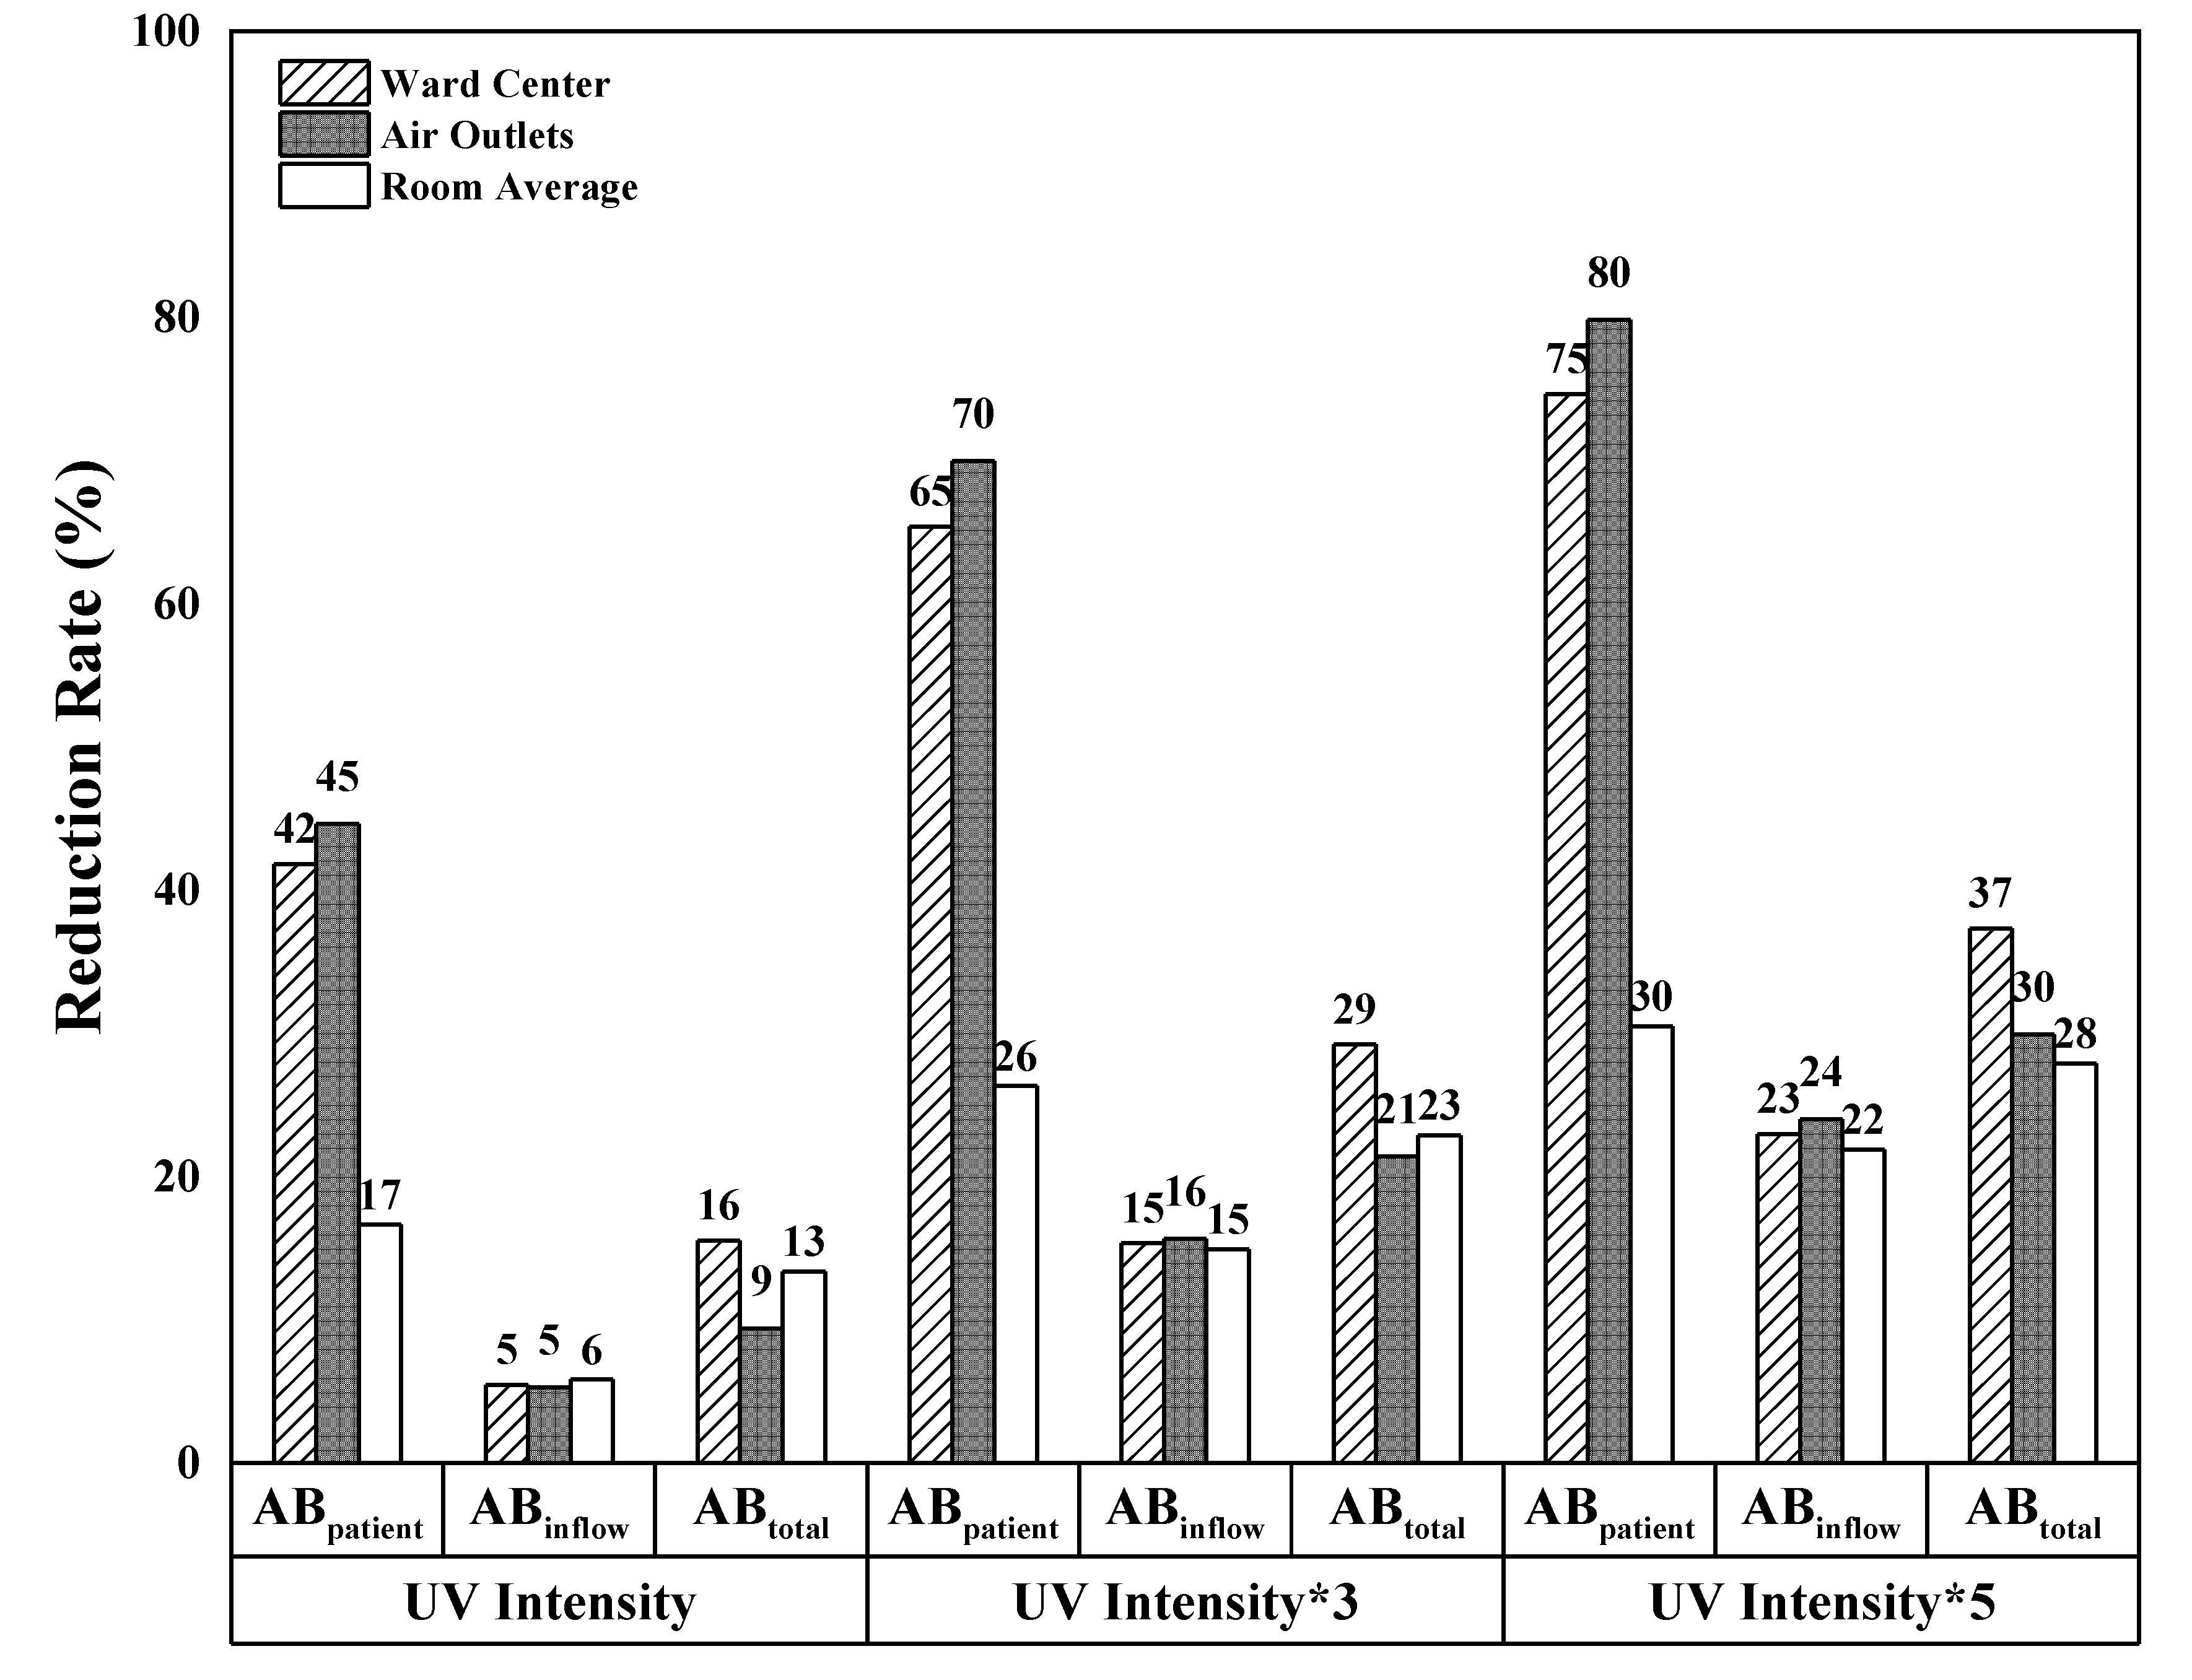
3.2. Numerical Simulation Results

Figure 7 shows the vertical and horizontal UV intensity distributions obtained from radiance data applied to the CFD model. The horizontal section (Figure 7b) is the distribution at a height of 2.24 m, i.e., the UVGI system installation location, and the vertical section (Figure 7a) is the distribution in relation to the sickbed. When these distribution data were applied to the negative pressure isolation ward, the UV was shown to have radiated only to the upper area of the ward and not to the activity range of the patient, resulting in almost zero exposure to the patient and medical staffs.
As shown in Figure 8a, the results of CFD analysis confirmed that the air flowed from the corridor to the anteroom, ward, and bathroom, in the stated order, as in the negative pressure isolation ward studied in the field experiment. The differential pressure between rooms (the anteroom and ward) was also approximately 3 Pa, satisfying the standard of 2.5 Pa prescribed by the CDC guidelines [4,5]. The air flowed into the ward from the corridor through the anteroom, via the airflow resulting from the irregular locations of the air supplies and exhausts. The air flowing inward from the corridor through the anteroom entrance was directly transferred by the exhaust located in the upper area, and the air in the lower area was partly transferred to the ward by the negative pressure formed. The air in the anteroom then flowed back into the ward, with some of the inflow air forming an upward current at the ward center. Another portion of the air flowed into the lower area of the ward and was exhausted through the bathroom. The airflow around the patient mainly flowed upward because of the air exhaust located in the upper area above the sickbed, or spread towards the ward center and then throughout the ward via the airflow resulting from the supply and exhaust locations within the ward.
Figure 8b shows the result of the analysis in which the contaminants as airborne microorganisms were generated near the sickbed in the negative pressure isolation ward and were set to flow in from the corridor as in the actual field experiment, with the UVGI off (Case 0). Table 4 lists the results for the comparative investigation of the sterilization effects of the UR-UVGI system with four adults located near the sickbed acting as the indoor contaminant source (i.e., Case 0), as well as the CFD analysis. In the experiment, the average indoor-generated microorganism concentration (from all four sets of measurements) was 373 CFU/m3 in the ward center before operation of the UR-UVGI system. The average decrease in concentration achieved by operating the UR-UVGI system throughout the four experiments was 15.7 to 16.9%, which is relatively low. The CFD analysis result showed that the concentration in the ward center was similar to the measurements, but the reduction rate was 2.6 to 7.4%, which was lower than the experimental value. It is assumed that all experiments, as well as the CFD analysis result showed low reduction rates because the air supply was located immediately above the contaminant source and the generated contaminants circumvented the sickbed to be partly exhausted to the bathroom. They also spread along the formed airflow, preventing most of the airborne microorganisms from being exposed to strong UV radiation, as shown in Figure 8b. Another probable cause of the discrepancy is the different microorganisms assumed in the CFD simulation from those in the experiment. UV rate constants (k) of M. tuberculosis and influenza virus, which might not exist during the experiment, were used for the CFD simulation. Therefore, higher UV susceptibilities of microorganisms in the experiment than those in the CFD simulation can cause higher sterilization effects.
Figure 9a,b shows the results of the control case without UVGI operation, in which the conditions of Case 0 were modified so that the contaminant source was positioned on the face of a patient on the sickbed. Based on ABPatient and ABInflow distributions, ABInflow concentration was high in the anteroom, but the ventilation greatly reduced the number of microorganisms that flowed into the ward. In addition, as the air exhaust was located above the sickbed, the ABPatient contaminants were observed to flow directly towards the exhaust via the airflow. Contaminants generally spread to the ward center, but did not seem to spread a relatively far from the source. This behavior is assumed to be a result of the irregular locations of the air supplies and exhausts in the ward.
After control case analysis, analysis involving different UR-UVGI system installation locations was conducted. Similar contaminant distributions were obtained, but there was a difference in the reduction in concentration. Table 5 lists the average concentration and reduction rates in the anteroom center, ward center, air exhausts (measurement points), and the entire ward based on the CFD analysis results. The sterilization effects greatly varied with location of the installed UVGI system.
To understand reduction rates by case, Cases 1 and 2, with the UR-UVGI system installed above the patient’s head, showed relatively high reduction rates for ABPatient at not only the measurement points, but also throughout the ward in general. This may be because the ABPatient microorganisms that flowed upward in the ward were sterilized by the strong UV radiation generated by the UR-UVGI system. In addition, Case 1 (Figure 9c,d), with the system installed close beside the patient, yielded a higher sterilization rate than Case 2, where the system was installed immediately above the patient’s head. This could be because the system was located closer to the air exhaust in Case 1, allowing the ABPatient microorganisms to flow upward and spread towards the exhaust. However, there was no significant difference in reduction rate for ABInflow from adjacent areas and only low reduction rates were observed.
In Case 3, where the system was installed opposite the Case 2 location, the lowest sterilization effects among all cases were observed for both ABPatient and ABInflow. This could be because of the large distance between the patient (the ABPatient contaminant source) and the ABInflow entrance. Sterilization effects of 10% for the indoor-generated microorganisms were calculated at the ward air exhaust. This is assumed to be a result of the relatively small distance between the air exhaust and the system in this case.
In Case 4, the system was installed in the upper area of the ward on the opposite side to the entrance, and in Case 5 (Figure 9e,f), the system was installed immediately above the entrance. These two cases yielded weaker sterilization effects for ABPatient compared to Cases 1 and 2, but stronger sterilization effects for ABInflow, since those microorganisms could be directly sterilized upon entering the ward. In addition, the strong sterilization effects for ABPatient measured at the air exhaust are assumed to be to the result of the small distance between the exhaust and system, as in Case 3.
In a study by Sung and Kato [28], the UV intensity distribution of a UR-UVGI system was obtained from field measurements for use in their CFD analysis. The sterilization effects were relatively high, because UV intensity in that study was higher than that achieved by the system used in this study. Therefore, the UV intensity of the system in this study increased five-fold, to a level similar to the intensities measured in a previous study [29], and the sterilization effects were compared. As shown in Figure 10, when the UV intensity was increased five-fold, the sterilization effects did not increase in a linear manner. The reduction rate for indoor-generated airborne microorganisms increased by approximately two-fold and the reduction rate for airborne microorganisms flowing in from adjacent areas increased by approximately four-fold. This is assumed to be because UV intensity has a significant impact on the sterilization effects of the UVGI system, as reported in the previous study [29]. However, while higher UV intensity yields stronger sterilization effects as proven in CFD analysis, caution is required to prevent harmful irradiation of patients in the ward.

4. Discussion

For a negative pressure isolation ward with an anteroom, the anteroom with higher negative pressure or positive pressure than both corridor and isolation ward has been suggested to prevent airflow between the ward and corridor [4]. However, this is not recommended, as it may induce increased outflow of the airborne microorganisms from the ward upon entry and exit of medical personnel. Therefore, the 29 facilities in Korea are operated by inducing a gradual formation of negative pressure in the following order of places: corridor, anteroom, and then the ward. This study aimed to identify measures to counteract the potential inflow of contaminants into the negative pressure isolation ward from adjacent areas.
Based on the experimental results and CFD analysis, clear differences were observed in the sterilization effects of the UR-UVGI system in the negative pressure isolation ward depending on the locations of the indoor-generated microorganism source, the air supplies and exhausts in the ward, and the UVGI system. Previously, Gilkeson and Noakes [12] stated that the UVGI system holds value as a control measure for potential infection, and also reported that UV distribution is affected by the vent locations and the amount of ventilation (air exchanges).
The present study also confirmed sterilization effects of the system on both indoor-generated microorganisms and microorganisms flowing into the ward from adjacent areas. In terms of the sterilization effects on airborne microorganisms from adjacent areas, significant reduction rates were achieved when the UVGI system was installed in the upper area above the anteroom entrance. This may be a result of sterilization of microorganisms as they flowed in through the anteroom entrance, as microorganisms from adjacent areas necessarily had to flow through the anteroom to reach the ward. However, the reduction rate was not significant when the UVGI system was installed elsewhere. This is assumed to be the result of reduced inflow into the ward and the impact of influential factors on the effects of the UVGI system (the locations of the contaminant source, air supplies and exhausts, and UVGI system, as well as the airflow formed in the ward), which yielded lower reduction rates. For the indoor-generated airborne microorganisms, differences were observed in the reduction rates because of differing airflow resulting from differing locations of contaminant source (patient) and air supplies and exhausts. In particular, note that negative pressure isolation wards currently in operation have air exhausts above the patient respiratory equipment or sickbed head, with an air supply on the opposite side to control the spread of microorganisms. However, the ward considered in this study had air supplies and exhausts at relatively irregular locations compared to general negative pressure isolation wards. The resultant airflow is assumed to be the cause of reduced efficiency of sterilization by the system. This factor must be considered when employing a UR-UVGI system.

5. Conclusions

In this study, the sterilization effects of a UR-UVGI system were verified and analyzed for airborne microorganisms generated indoors and flowing into negative pressure isolation wards from adjacent areas. The experimental results and CFD analysis confirmed the sterilization effects of the UR-UVGI system. Furthermore, the effects were found to vary based on several factors associated with the negative pressure isolation ward.
Regarding the indoor-generated airborne microorganisms, locations of the contaminant source and the air supplies and exhausts have a significant impact on the sterilization effects of the system. The sterilization effects are strong when the UR-UVGI system is installed above the contaminant source, and it is assumed that the effects vary depending on the locations of the air supplies and exhausts in the ward because the system affects the structure of the airflow, which then induces variations in the effective UV radiation levels. In this sense, air exhausts and a UVGI system located immediately above the contaminant source are expected to demonstrate the strongest sterilization effects.
Regarding the airborne microorganisms flowing in from adjacent areas, it was observed that the microorganisms are primarily filtered through the ventilation in the anteroom and the remainder flow into the ward through entrances. The sterilization effects on the microorganisms flowing inward from adjacent areas are strong when the UVGI system is installed above the entrance or on the opposite side of the entrance.
In addition, when the UV intensity increased three or five times, the sterilization effects were estimated to be approximately two to four times stronger compared to effects of the less intense UV radiation. Thus, the sterilization effectiveness of the UR-UVGI system in the negative pressure isolation ward is affected by the location of the UVGI system, UV intensity, and the locations of the contaminant source and air supplies and exhausts. The present study was limited by the fact that only one facility was considered in the experiment and CFD analysis, rather than multiple locations.
In future, the effects of a UVGI system installed in the anteroom may be examined. Another future study is the identification of a novel method to reduce the level of microorganisms from the adjacent area of a negative pressure isolation ward, besides the use of UVGI systems.

Author Contributions

J.-I.B. designed the research, conducted the simulations, and finished the writing of the paper; J.P. contributed to designing and conducting experiments; J.-W.J. and A.C. gave comments on the experiment methods and results; J.Y.K. gave comments on the facility; M.S. supervised the research design and execution and provided valuable suggestions during manuscript writing.

Acknowledgments

This research was supported by the Basic Science Research Program of the National Research Foundation of Korea (NRF), and funded by the Ministry of Education [grant number NRF-2017R1D1A1B03033016].

Conflicts of Interest

The authors declare no conflict of interest.

References

  1. Korea Center for Disease Control and Prevention. Guidelines for Operation and Management of Nationally Designed Hospital Beds; Ministry for Health and Welfare: Cheongju-si, Korea, 2017.
  2. Interim Infection Prevention and Control Recommendations for Hospitalized Patients with Middle East Respiratory Syndrome Coronavirus (MERS-CoV). Available online: https://www.cdc.gov/coronavirus/mers/infection-prevention-control.html (accessed on 6 August 2018).
  3. Frequently Asked Questions on Middle East Respiratory Syndrome Coronavirus (MERS-CoV). Available online: http://www.who.int/csr/disease/coronavirus_infections/faq/en/ (accessed on 6 August 2018).
  4. Sehulster, L.; Chinn, R.Y.; Arduino, M.J.; Carpenter, J.; Donlan, R.; Ashford, D.; Besser, R.; Fields, B.; McNeil, M.M.; Whitney, C. Guidelines for environmental infection control in health-care facilities. MMWR Recomm. Rep. 2003, 52, 1–42. [Google Scholar] [PubMed]
  5. Jensen, P.A.; Lambert, L.A.; Iademarco, M.F.; Ridzon, R. Guidelines for Preventing the Transmission of Mycobacterium Tuberculosis in Health-Care Settings; Center for Disease Control and Prevention: Atlanta, GA, USA, 2005.
  6. Yanagi, U.; Kagi, N.; Ikeda, K.; Nishimura, N.; Yoshino, H.; Obata, M.; Saito, H.; Saito, K.; Kamakura, R. A Study on the Way of Maintenance of Sanitary Environment in Medical Facilities: Part2-The actual status and countermeasures of airborne microbe contamination in waiting rooms. Trans. Soc. Heat. Air Condit. Sanit. Eng. Jpn. 2008, 33, 9–17. [Google Scholar] [CrossRef]
  7. Siegel, J.D.; Rhinehart, E.; Jackson, M.; Chiarello, L.; Health Care Infection Control Practices Advisory Committee. 2007 guideline for isolation precautions: Preventing transmission of infectious agents in health care settings. Am. J. Infect. Control 2007, 35, S65–S164. [Google Scholar] [CrossRef] [PubMed]
  8. World Health Organization. Interim WHO Infection Control Guidelines for Health Care Facilities: AI, including Influenza A (H5N1) in Humans. Available online: http://www.wpro.who.int/emerging_diseases/documents/AI_Inf_Control_Guide_10May2007/en/ (accessed on 6 August 2018).
  9. Schoen, L.J.; Hodgson, M.J.; McCoy, W.F.; Miller, S.L.; Li, Y.; Olmsted, R.N.; Sekhar, C. ASHRAE Position Document on Airborne Infectious Diseases; ASHRAE: Atlanta, GA, USA, 2009. [Google Scholar]
  10. Rutala, W.A.; Weber, D.J. Guideline for Disinfection and Sterilization in Healthcare Facilities; Center for Disease Control and Prevention: Atlanta, GA, USA, 2008.
  11. Lindsley, W.G.; Blachere, F.M.; Davis, K.A.; Pearce, T.A.; Fisher, M.A.; Khakoo, R.; Davis, S.M.; Rogers, M.E.; Thewlis, R.E.; Posada, J.A.; et al. Distribution of airborne influenza virus and respiratory syncytial virus in an urgent care medical clinic. Clin. Infect. Dis. 2010, 50, 693–698. [Google Scholar] [CrossRef] [PubMed]
  12. Gilkeson, C.A.; Noakes, C.J.; Khan, M.A.I. Computational fluid dynamics modelling and optimisation of an upper-room ultraviolet germicidal irradiation system in a naturally ventilated hospital ward. Indoor Built Environ. 2014, 23, 449–466. [Google Scholar] [CrossRef] [Green Version]
  13. Huang, J.-M.; Cheng, H.-T. The influence of the bed with a semiopen hood on bacteria removal in a negative-pressure isolation room. Adv. Mech. Eng. 2014, 6, 468232. [Google Scholar] [CrossRef]
  14. Fletcher, L.A.; Noakes, C.J.; Beggs, C.B.; Sleigh, P.A. The importance of bioaerosols in hospital infections and the potential for control using germicidal ultraviolet irradiation. In Proceedings of the First Seminar on Applied Aerobiology, Murcia, Spain, 20 May 2004. [Google Scholar]
  15. Hollaender, A.; Oliphant, J.W. The inactivating effect of monochromatic ultraviolet radiation on influenza virus. J. Bacteriol. 1944, 48, 447–454. [Google Scholar] [PubMed]
  16. Macher, J.M.; Alevantis, L.E.; Chang, Y.-L.; Liu, K.-S. Effect of ultraviolet germicidal lamps on airborne microorganisms in an outpatient waiting room. Appl. Occup. Environ. Hyg. 1992, 7, 505–513. [Google Scholar] [CrossRef]
  17. Memarzadeh, F.; Jiang, J. Methodology for minimizing risk from airborne organisms in hospital isolation rooms. ASHRAE Trans. 2000, 106, 731–747. [Google Scholar]
  18. Ko, G.; First, M.W.; Burge, H.A. The characterization of upper-room ultraviolet germicidal irradiation in inactivating airborne microorganisms. Environ. Health Perspect. 2002, 110, 95–101. [Google Scholar] [CrossRef] [PubMed] [Green Version]
  19. Xu, P.; Peccia, J.; Fabian, P.; Martyny, J.W.; Fennelly, K.P.; Hernandez, M.; Miller, S.L. Efficacy of ultraviolet germicidal irradiation of upper-room air in inactivating airborne bacterial spores and mycobacteria in full-scale studies. Atmos. Environ. 2003, 37, 405–419. [Google Scholar] [CrossRef]
  20. Menzies, D.; Popa, J.; Hanley, J.A.; Rand, T.; Milton, D.K. Effect of ultraviolet germicidal lights installed in office ventilation systems on workers’ health and wellbeing: Double-blind multiple crossover trial. Lancet 2003, 362, 1785–1791. [Google Scholar] [CrossRef]
  21. Brickner, P.W.; Vincent, R.L. Ultraviolet germicidal irradiation safety concerns: A lesson from the tuberculosis ultraviolet shelter study: Murphy’s law affirmed. Photochem. Photobiol. 2003, 89, 819–821. [Google Scholar] [CrossRef] [PubMed]
  22. Chang, C.-W.; Li, S.-Y.; Huang, S.-H.; Huang, C.-K.; Chen, Y.-Y.; Chen, C.-C. Effects of ultraviolet germicidal irradiation and swirling motion on airborne Staphylococcus aureus, Pseudomonas aeruginosa and Legionella pneumophila under various relative humidities. Indoor Air 2013, 23, 74–84. [Google Scholar] [CrossRef] [PubMed]
  23. Kanaan, M.; Ghaddar, N.; Ghali, K.; Araj, G. New airborne pathogen transport model for upper-room UVGI spaces conditioned by chilled ceiling and mixed displacement ventilation: Enhancing air quality and energy performance. Energy Convers. Manag. 2014, 85, 50–61. [Google Scholar] [CrossRef]
  24. Memarzadeh, F.; Olmsted, R.N.; Bartley, J.M. Applications of ultraviolet germicidal irradiation disinfection in health care facilities: Effective adjunct, but not stand-alone technology. Am. J. Infect. Control 2010, 38, S13–S24. [Google Scholar] [CrossRef] [PubMed]
  25. Gilkeson, C.A.; Noakes, C. Application of CFD simulation to predicting upper-room UVGI effectiveness. Photochem. Photobiol. 2013, 89, 799–810. [Google Scholar] [CrossRef] [PubMed]
  26. Xu, P.; Fisher, N.; Miller, S.L. Using computational fluid dynamics modeling to evaluate the design of hospital ultraviolet germicidal irradiation systems for inactivating airborne mycobacteria. Photochem. Photobiol. 2013, 89, 792–798. [Google Scholar] [CrossRef] [PubMed]
  27. Noakes, C.J.; Sleigh, P.A.; Fletcher, L.A.; Beggs, C.B. Use of CFD modelling to optimise the design of upper-room UVGI disinfection systems for ventilated rooms. Indoor Built Environ. 2006, 15, 347–356. [Google Scholar] [CrossRef]
  28. Sung, M.; Kato, S. Method to evaluate UV dose of upper-room UVGI system using the concept of ventilation efficiency. Build. Environ. 2010, 45, 1626–1631. [Google Scholar] [CrossRef]
  29. Sung, M.; Kato, S. Estimating the germicidal effect of upper-room UVGI system on exhaled air of patients based on ventilation efficiency. Build. Environ. 2011, 46, 2326–2332. [Google Scholar] [CrossRef]
  30. Kowalski, W. Ultraviolet Germicidal Irradiation Handbook: UVGI for Air and Surface Disinfection; Springer Science & Business Media: Berlin, Germany, 2010. [Google Scholar]
  31. Rohdin, P.; Moshfegh, B. Numerical modelling of industrial indoor environments: A comparison between different turbulence models and supply systems supported by field measurements. Build. Environ. 2011, 46, 2365–2374. [Google Scholar] [CrossRef]
  32. Noakes, C.J.; Fletcher, L.A.; Beggs, C.B.; Sleigh, P.A.; Kerr, K.G. Development of a numerical model to simulate the biological inactivation of airborne microorganisms in the presence of ultraviolet light. J. Aerosol Sci. 2004, 35, 489–507. [Google Scholar] [CrossRef] [Green Version]
Figure 1. (a) Remodeled and (b) stand-alone negative pressure isolation facilities considered in this study.
Sustainability 10 03192 g001aSustainability 10 03192 g001b
Figure 2. Air volume and differential pressure in (a) remodeled and (b) stand-alone negative pressure isolation wards.
Sustainability 10 03192 g002
Figure 3. (a) Plan of negative pressure isolation ward; (b) installation of UR-UVGI system; and (c) airborne bacteria sampling (bacteria used in experiments).
Sustainability 10 03192 g003
Figure 4. UR-UVGI (XK15-60) model.
Sustainability 10 03192 g004
Figure 5. CFD simulation model and boundary conditions.
Sustainability 10 03192 g005
Figure 6. Experimental results for (a) ward center and (b) air exhausts, for four sets of measurements.
Sustainability 10 03192 g006
Figure 7. UV intensity distributions: (a) vertical and (b) horizontal.
Sustainability 10 03192 g007
Figure 8. (a) Airflow and (b) airborne bacteria concentration distribution in negative pressure isolation ward for Case 0, with UR-UVGI OFF.
Sustainability 10 03192 g008
Figure 9. Airborne bacteria distributions for (a,b) control case without UVGI operation (ABPatient and ABInflow, respectively); (c,d) Case 1 (ABPatient and ABInflow, respectively); and (e,f) Case 5 (ABPatient and ABInflow, respectively).
Sustainability 10 03192 g009aSustainability 10 03192 g009b
Figure 10. Comparison of reduction rates for varying degrees of UV intensity Section 3.1.
Sustainability 10 03192 g010
Table 1. Negative pressure isolation ward standards.
ItemsDetails
Pressure differenceMaintenance of negative pressure between rooms (adjusted by setting exhaust air volume at a greater value than supply air volume)
2.5 Pa or higher (0.01 mmAq)
Ventilation rate6 ACH or higher (12 ACH recommended)
AirflowInflow of air into ward for infected patients
OthersInstallation of HEPA filters that can eliminate 99.97% of particles of size 0.3-μm or greater passing through the air exhaust
If the leakage area is 0.5 ft2, the difference in volume of supply and exhaust air is 125 cfm or higher
Table 2. Material reflectivity of UR-UVGI components.
ComponentUV-C Reflectivity (%)Visible Light Reflectivity (%)
Aluminum, etched8890
Black lacquer paint59
Table 3. Comparison of base concentrations of airborne microorganisms in stand-alone and remodeled facilities.
CFU/m3)Remodeled FacilityStand-Alone Facility
Ante-RoomWardAnte-RoomWard
CenterAir SupplyAir ExhaustCenterAir SupplyAir Exhaust
Average (±standard deviation)110.4 (±57)102.4 (±79)3.2 (±4.7)97.6 (±61)22.5 (±17)2.5 (±3)1.3 (±2)5 (±4)
Table 4. Results of experiment and CFD simulation (Case 0).
CFU/m3UR-UVGI OFFUR-UVGI ONReduction Rate (%)
Ward-CenterWard-ExhaustWard-CenterWard-ExhaustWard-CenterWard-Exhaust
Experiment373 ± 232 *312 ± 179310 ± 165263 ± 10316.915.7
Simulation (Case 0)3921623821502.67.4
* The cell values are the average ± standard deviation.
Table 5. CFD Simulation Results (values in parentheses are reduction rates (%); AB = ABInflow + ABPatient).
Airborne Bacteria Concentration (CFU/m3)Anteroom CenterWardRoom Average (Ward)
CenterAir exhausts
Control case (UV off)ABPatient-8.52.857.3
ABInflow117.122.123.324.8
AB117.130.726.182.1
Case 1ABPatient-4.9 (41.8%)1.5 (44.6)47.8 (16.6)
ABInflow117.220.9 (5.4)22.1 (5.2)23.3 (5.8)
AB117.225.9 (15.5)23.7 (9.4)71.1 (13.4)
Case 2ABPatient-6.4 (24.2)2.0 (28.1)50.5 (11.9)
ABInflow117.220.8 (6.1)22.1 (5.5)23.1 (6.6)
AB117.227.3 (11.1)24.0 (7.9)73.7 (10.3)
Case 3ABPatient-8.4 (1.2)2.5 (9.9)57.2 (0.2)
ABInflow117.221.5 (3.0)21.8 (6.8)23.8 (3.8)
AB117.229.9 (2.5)24.3 (7.1)81.1 (1.3)
Case 4ABPatient-7.2 (15.5)2.1 (22.4)55.3 (3.6)
ABInflow117.220.2 (8.9)21.4 (8.4)22.8 (7.9)
AB117.227.4 (10.7)23.5 (9.9)78.1 (4.9)
Case 5ABPatient-8.0 (6.3)2.4 (11.7)56.4 (1.7)
ABInflow117.218.9 (14.6)20.3 (13.3)21.2 (14.2)
AB117.226.9 (12.3)22.7 (13.1)77.6 (5.5)

