1. Introduction
With the rapid development of social networks, more and more people tend to spend a lot of time in online communities, such as online video sharing platforms or online music platforms. For example, Net Ease Cloud Music (
http://music.163.com) is one of the most popular online entertainment communities in China and has attracted millions of users. The large number of users in online communities can bring huge marketing values and business values to enterprises, e.g., through online advertising. So far, online communities are mostly based on the application of User-Generated Content (UGC), which allows users to create personalized information and share them to online communities [
1]. Many UGC systems adopt a voluntary voting mechanism to identify valuable reviews that can help users browse content efficiently [
2]. However, we note that there is a paradox of review voting in online communities, i.e., the number of votes is not consistent with the quality of the corresponding content. Especially, some content with low quality surprisingly receives more votes than others with high quality. Such a paradox has a close relationship with the crowd intelligence of online communities, and might have an impact on the sustainable development of online communities. Previous studies have pointed out that the bias of ratings existed in online reviews [
3]. However, so far there are no studies focusing on the paradox of review voting in online communities.
In this paper, we regard the paradox of review voting in online communities as the crowd intelligence paradox. The crowd intelligence paradox has negative effects on resource allocation and the sustainable development of online communities, because it may lower the quality of UGC, which violates the initial objective of the review voting mechanism, i.e., to recommend high quality content. Furthermore, online communities have more users than traditional communities. Therefore, the crowd intelligence paradox in online communities will lead to an unfair distribution of community resources such as content ranking, exposure time, and bonus points. As a result, the crowd intelligence paradox of review voting might inhibit users who wish to participate in UGC and hinders the development of online communities.
This paper aims to address the crowd intelligence paradox and to study the inconsistency between review voting and review quality in online communities. Particularly, we aim at answering two research questions:
- (1)
What is the paradox of review voting?
- (2)
Why does the crowd intelligence paradox exist?
In order to answer what the paradox of review voting is, we designed two aspects of work. Firstly, we analyzed the distribution of review votes in a real online community (Net Ease Cloud Music) using the power law distribution theory, in which a large data set including 351, 578 reviews are used. This aims at exploring the distribution of review votes in online communities and matches the 80/20 rule—only a few reviews can receive votes. Secondly, we also propose a hierarchical-regression-based method to verify the existence of the crowd intelligence paradox. This aims at indicating that review voting is not closely connected with the quality of reviews. The above successive issues will quantitatively measure the existence of the crowd intelligence paradox in online communities.
Furthermore, aiming at answering factors influencing the crowd intelligence paradox, we present a new research model named Voting Adoption Model (VAM), which is an integration of the information adoption model (IAM), the self-determination theory (SDT), and the signal theory. Based on the VAM model, we propose six hypotheses and analyze the imbalance of voting motives and the signals of the crowd intelligence paradox based on tests with respect to measurement model evaluation and structural model evaluation. In summary, we make the following contributions in this paper:
- (1)
We first study the crowd intelligence paradox in online communities, and experimentally reveal the distribution features of the review votes in online communities.
- (2)
We conduct experiments over a reviews dataset and discover that the number of review votes is not consistent with the quality of corresponding UGC, which demonstrates the existence of the crowd intelligence paradox of review voting in online communities.
- (3)
We propose a new research model called Voting Adoption Model (VAM) and six hypotheses to study why the crowd intelligence paradox exists in online communities. Compared with information credibility, perceived ease of use, and social influence, the influence of commentary quality is not significant. Hence, high-quality reviews do not always receive high votes.
- (4)
We present discussions on the experimental results and give some suggestions for the sustainable development of online communities.
To the best of our knowledge, this work provides the first empirical study on the crowd intelligence paradox in online communities. The crowd intelligence paradox of review voting reflects an unreasonable allocation of community resources. High-quality resources are not necessarily recognized, while low-quality ones get a lot of attention. This is a potential crisis for the UGC ecological environment and may restrict the traffic monetizing. Understanding the mechanism of the existence of the crowd intelligence paradox in review voting can help people solve the voting problem by increasing the cost of the voting signals and enhancing the demand of autonomy and competence.
The remainder of the paper is organized as follows. In
Section 2, we survey the related work. In
Section 3, we combine the distribution of review votes in online communities with a hierarchical regression to discuss the measurement of the crowd intelligence paradox. In
Section 4, we construct a research model to study why the crowd intelligence paradox exists.
Section 5 presents discussions of the data analysis as well as some suggestions for the sustainable development of online communities. Finally,
Section 6 concludes the paper.
3. Validation of the Crowd Intelligence Paradox
In this section, we validate the following two propositions: (1) The distribution of review votes in online communities matches the 80/20 rule and only a few comments can receive votes; and (2) the inconsistency between review voting and review quality exists in the reviews receiving many votes.
Practically, we study the distribution of review votes in online communities by conducting data analysis on a real online community, Net Ease Cloud Music, which is one of the most popular online entertainment communities in China. In
Section 3.1, we give the details about the vote dataset and subsequent survey data, and in
Section 3.2, we present the results of distribution tests on the reviews dataset. Finally, we measure the crowd intelligence paradox in
Section 3.3.
3.1. Dataset
Net Ease Cloud Music was officially released in 23 April 2013. Compared with other music software, Net Ease Cloud Music pays more attention to music socialization and creates music community with UGC, especially its music comment function attracting so many people. As of April 2017, Net Ease Cloud Music users exceeded 300 million people, singles exceeded 400 million. We choose Net Ease Cloud Music community as a research platform to study the paradox of review voting. We need to prepare two kinds of data, one is the vote data from Net Ease Cloud Music, and the other is the community survey data. The respondents to the survey are randomly selected from reviewers of above 17 songs, and all the reviews delivered by the respondents are among the total 351, 578 reviews.
3.1.1. Vote Data
The vote dataset is prepared by two steps: Data crawling and text mining. We crawled review votes from Net Ease Cloud Music and finally got a dataset containing 351, 578 reviews on 17 songs.
The format of crawled data is shown in
Table 1.
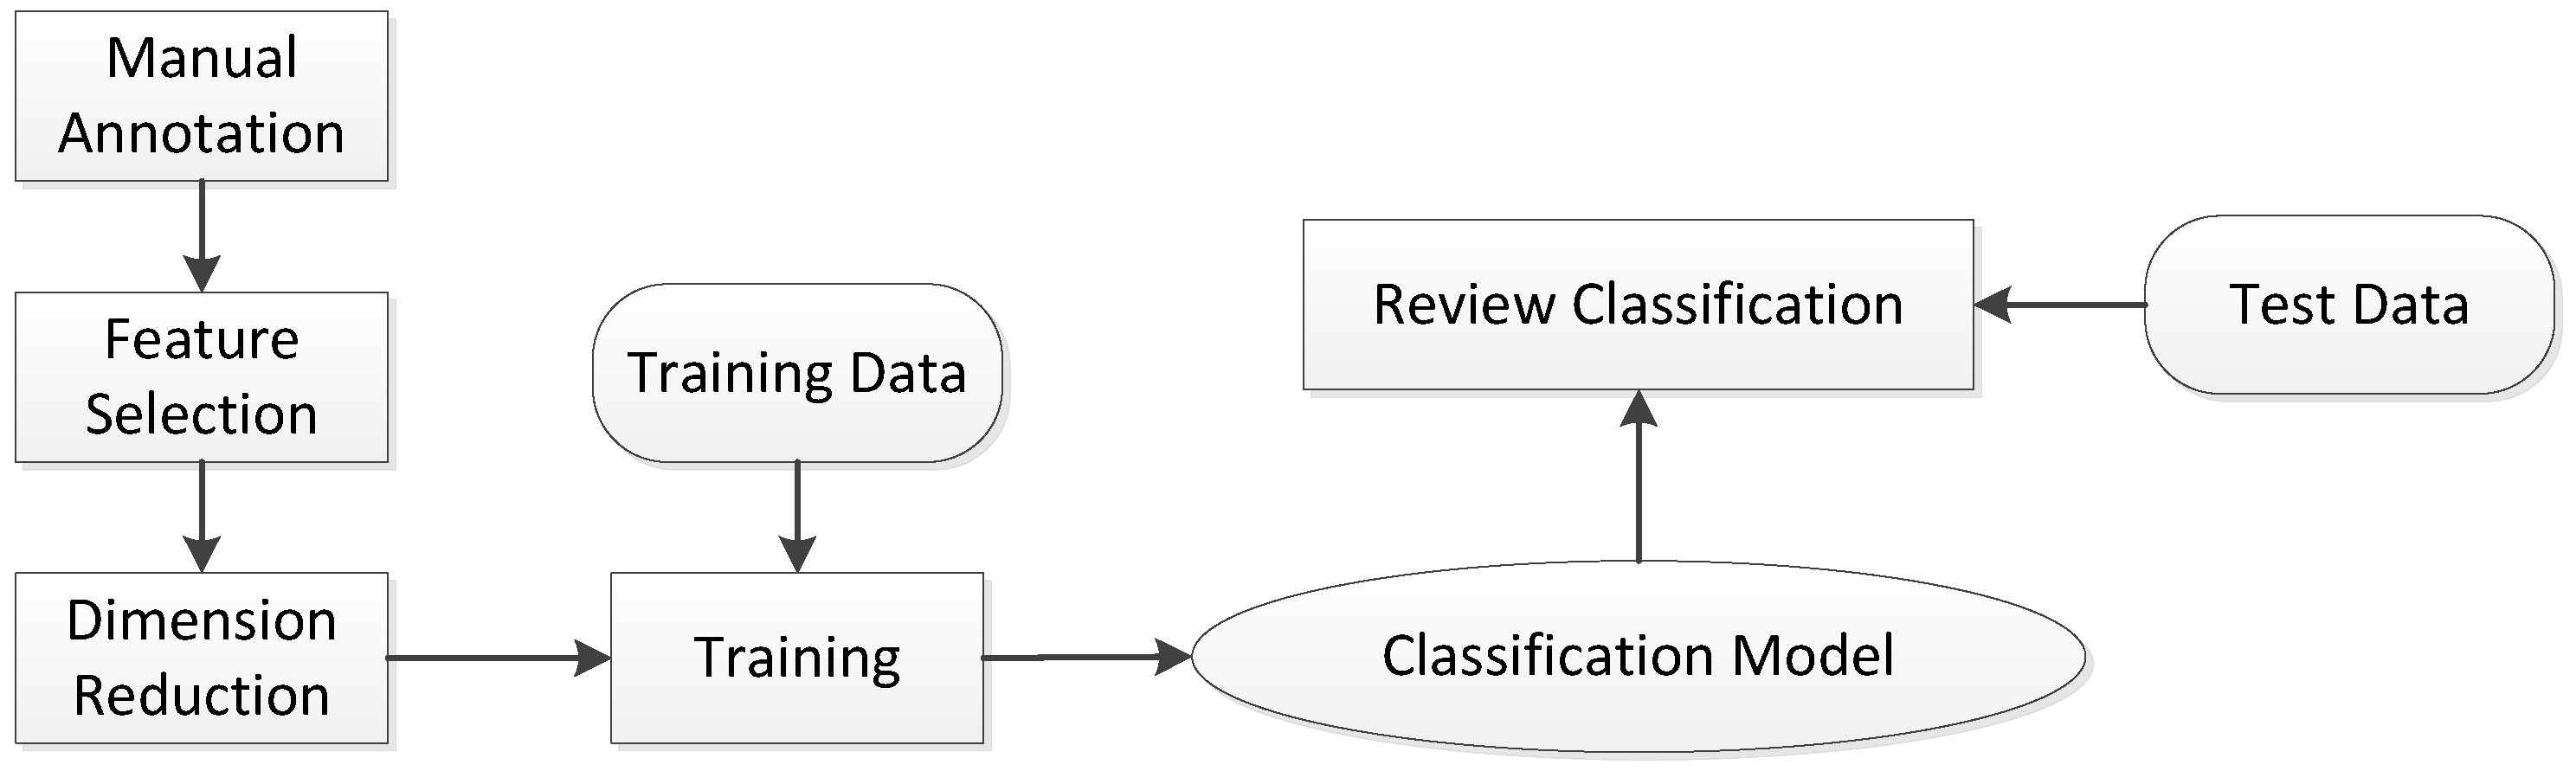
In order to effectively distinguish high quality reviews from low quality ones, we use text classification to perform review classification on the crawled data. There are many classification models proposed in the area of data mining, such as SVM (Support Vector Machine), KNN (K nearest neighbors), and Naive Bayes Model (NB) [
39]. The process is shown in
Figure 1.
In the manual annotation step, we extract a random sample of 20,000 reviews from our set (351,578 reviews). Five postgraduates do the manual annotation about quality in five days from 25 August 2017 to 30 August 2017. The quality score is labeled by a five-point Likert-scale, ranging from strongly disagree (1) to strongly agree (5), according to personal perception. Because they belong to users of Net Ease cloud music, personal labeling is a simple but effective way. We roughly split the annotated reviews according to the average score [
9]. Basically, the reviews with above-average scores are marked as high-quality reviews, and those with below-average scores are regarded as low-quality reviews. We did not use the full scoring scale because the annotated data was not large enough to conduct a full-scale analysis. Consequently, we get 8500 high quality reviews (above-average scores) and 8500 low quality reviews (below-average scores). The data is tested by the significance testing of an internal consistency reliability (Cronbach’s
α = 0.809).
In the feature selection step, we select single and double words as features. In the step of dimension reduction, we use a Chi-square method based on the features. We select 60% data as the training data and the rest are used as test data. Then, we construct classifiers with different classification algorithms over the training data. To ensure the generality of the experiments, we randomly change the sequence of records in the training dataset and repeat the training process five times to get the average results.
Table 2 shows the classification results on reviews, where four classification models are compared, including Bernoulli Native Bayes (denoted as
BernoulliNB in
Table 2), Multinomial Native Bayes (denoted as
MultinomialNB in
Table 2), Logistic Regression, and SVM. We use the metrics of precision, recall, and the F-measure to indicate the performance of classification. These metrics are commonly used in classification and text mining.
3.1.2. Survey Data
The survey dataset is designed using a multi-item approach. All variables were carried out by a seven-point Likert-scale, ranging from strongly disagree (1) to strongly agree (7). Items were borrowed from previous literature and modified for the context of this study.
The questionnaire consists of three parts:
- (1)
Sample selection: Ask a question of whether user vote on the hot review in a song.
- (2)
Sample characteristic: This part mainly measures the sex, age, and community age of user.
- (3)
Variable questionnaire: As shown in
Table 3, this study includes six latent variables, which are information quality (IQ), information credibility (IC), perceived ease of use (EOU), social influence (SI), information usefulness (IU), and vote adoption (A). Items were borrowed from previous literature and modified for the context of online reviews. Specifically, ‘EOU’ is adapted from the study of Gefen et al. (2003). ‘IQ’ is assessed by adapting three items used by Park et al. (2007). ‘IC’ is based on Prendergast et al. (2010). Finally, to examine ‘IU’ and ‘A’, six statements were adopted from Ismail Erkan et al. (2016).
The 500 questionnaires are distributed by artificial network through the short message of Net Ease Cloud Music. Respondents are randomly equably selected form reviewers of above 17 songs. A total of 273 questionnaires are recovered and finally obtains 244 after the cleaning work. The effective recovery rate was 48.8%. We then examined if the common method bias is a concern in this study. An exploratory factor analysis of all items extracted six factors which explain 75.08% of all the variance, with no single factor accounting for significant loadings (
p < 0.10) for all items. We conclude that the common method variance (CMV) is probably not a concern in this data set. The sample characteristics are shown in
Table 4.
3.2. Distribution of Review Votes
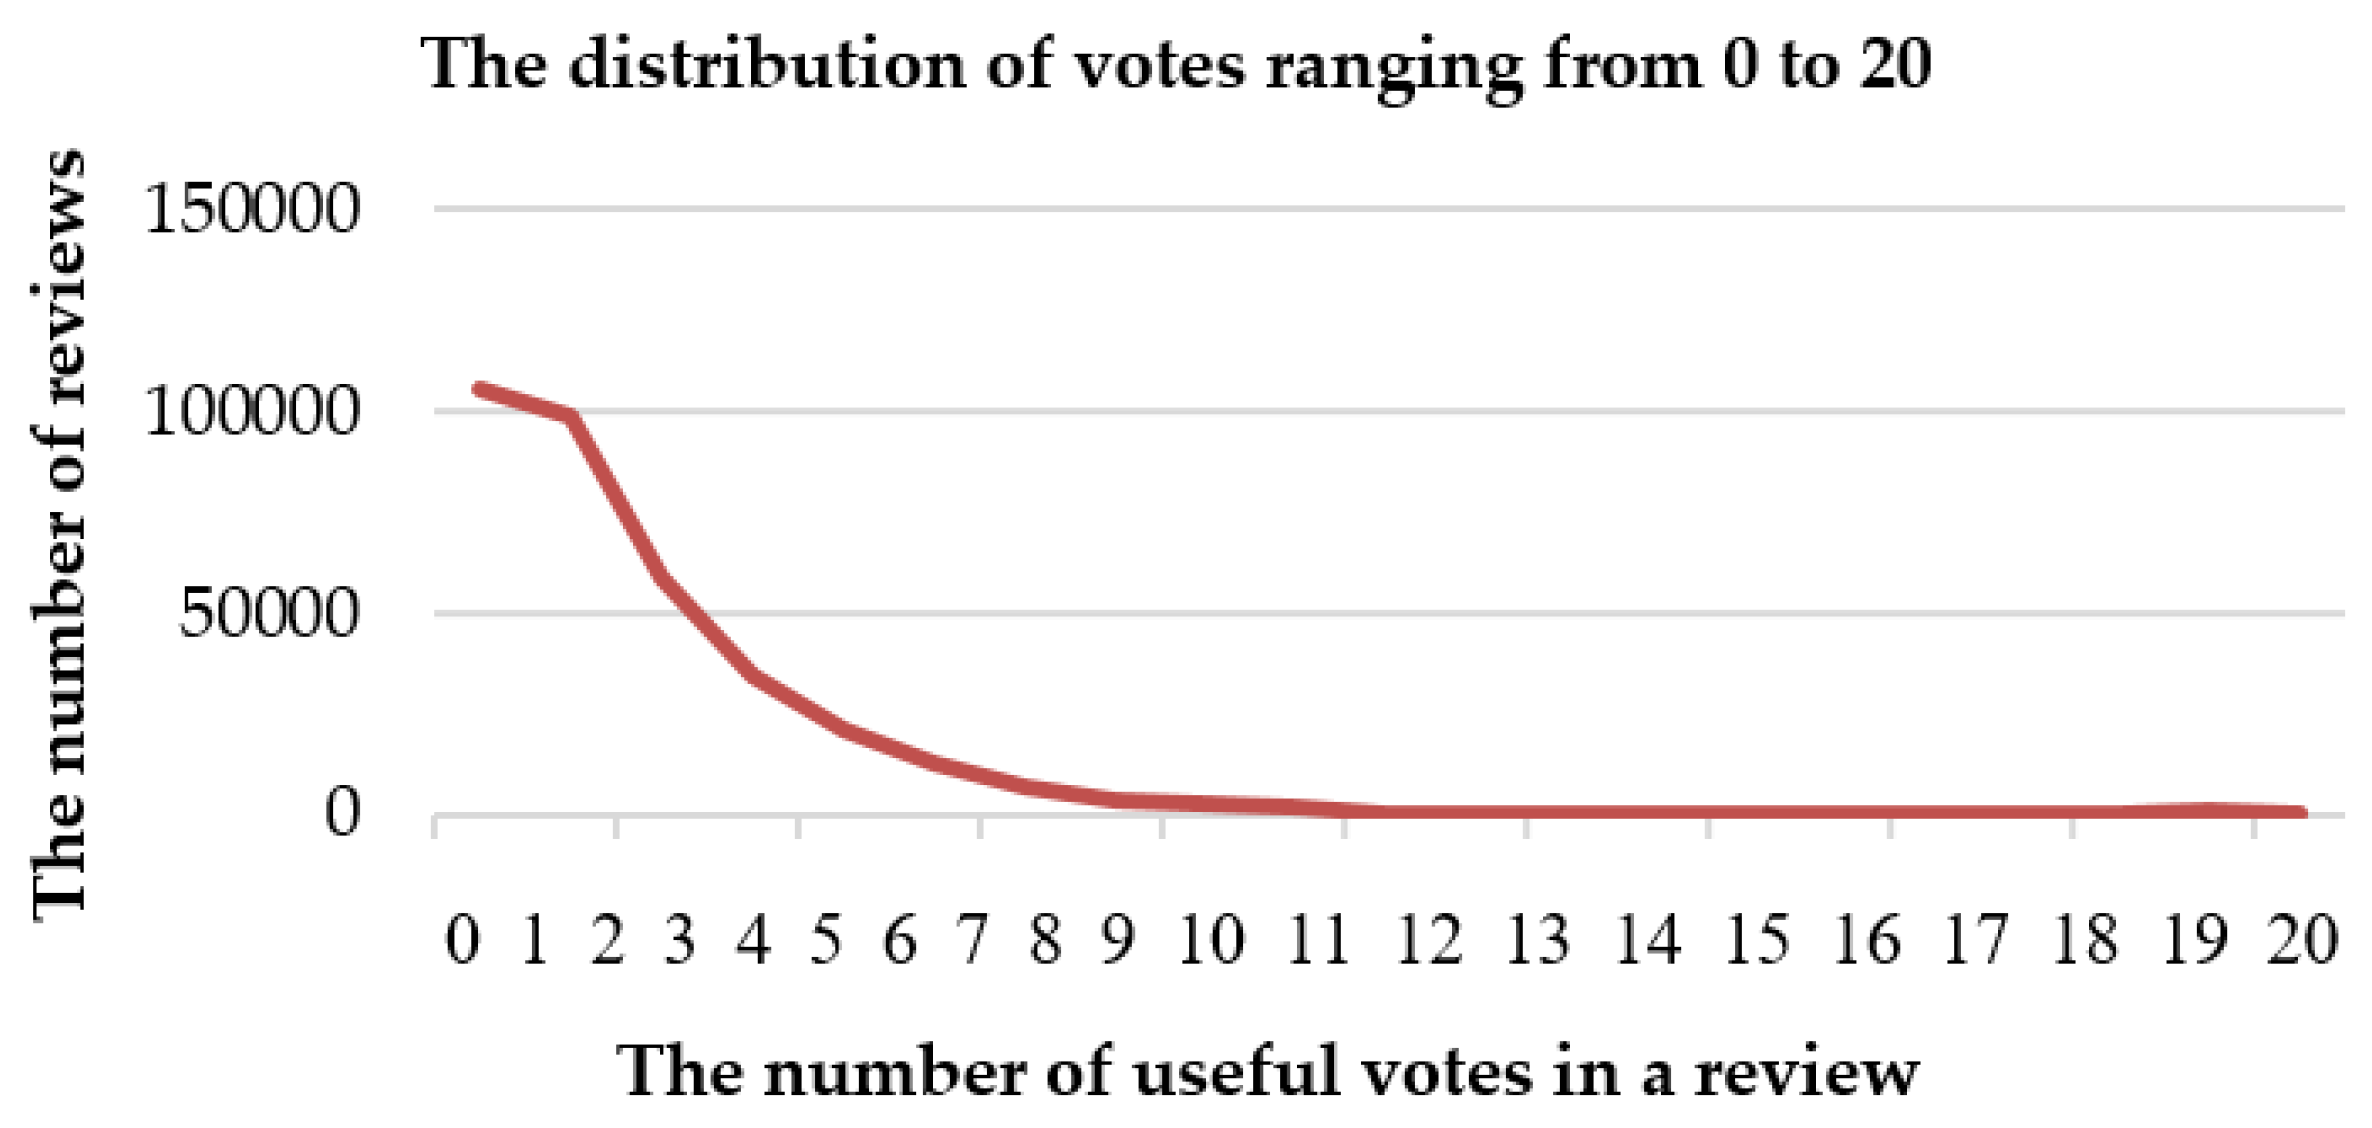
Table 5 shows the descriptive statistic of the vote data, which contains 351,578 reviews. We can see that the distribution of the number of votes is extremely skewed. Among the whole data set, the maximum value is 125,381 while the minimum value is zero. Additionally, 99.5% of the votes are less than 21.
Figure 2 shows the distribution of votes ranging from 0 to 20.
By observing review voting in Net Ease Cloud Music, we suppose that review voting may match the power law distribution. Power law distribution implies that the probability of occurrence of an event is extremely skewed. The event of small observation occurs in large numbers. However, the event of big observation occurs in small numbers. As UGC connects massive users, users’ commentary reply behaviors over time intervals have been found to match the power law distribution [
43].
As a long tail of the power law distribution is complex and has a greater volatility, there may be a large error when using the least squares method. In addition, it cannot be effectively compared with other forms of distributions. Thus, according to the method of fitting the power law distribution data [
44], we apply the Maximum Likelihood (ML) method on the dataset and evaluate the results with the Kolmogorov-Smirnov testing method. Based on the algorithm developed by Python 3.6 [
45], we examine the votes
k and the corresponding occurrence number
P(
k) for the 351, 578 reviews. The results are shown in
Table 6 and
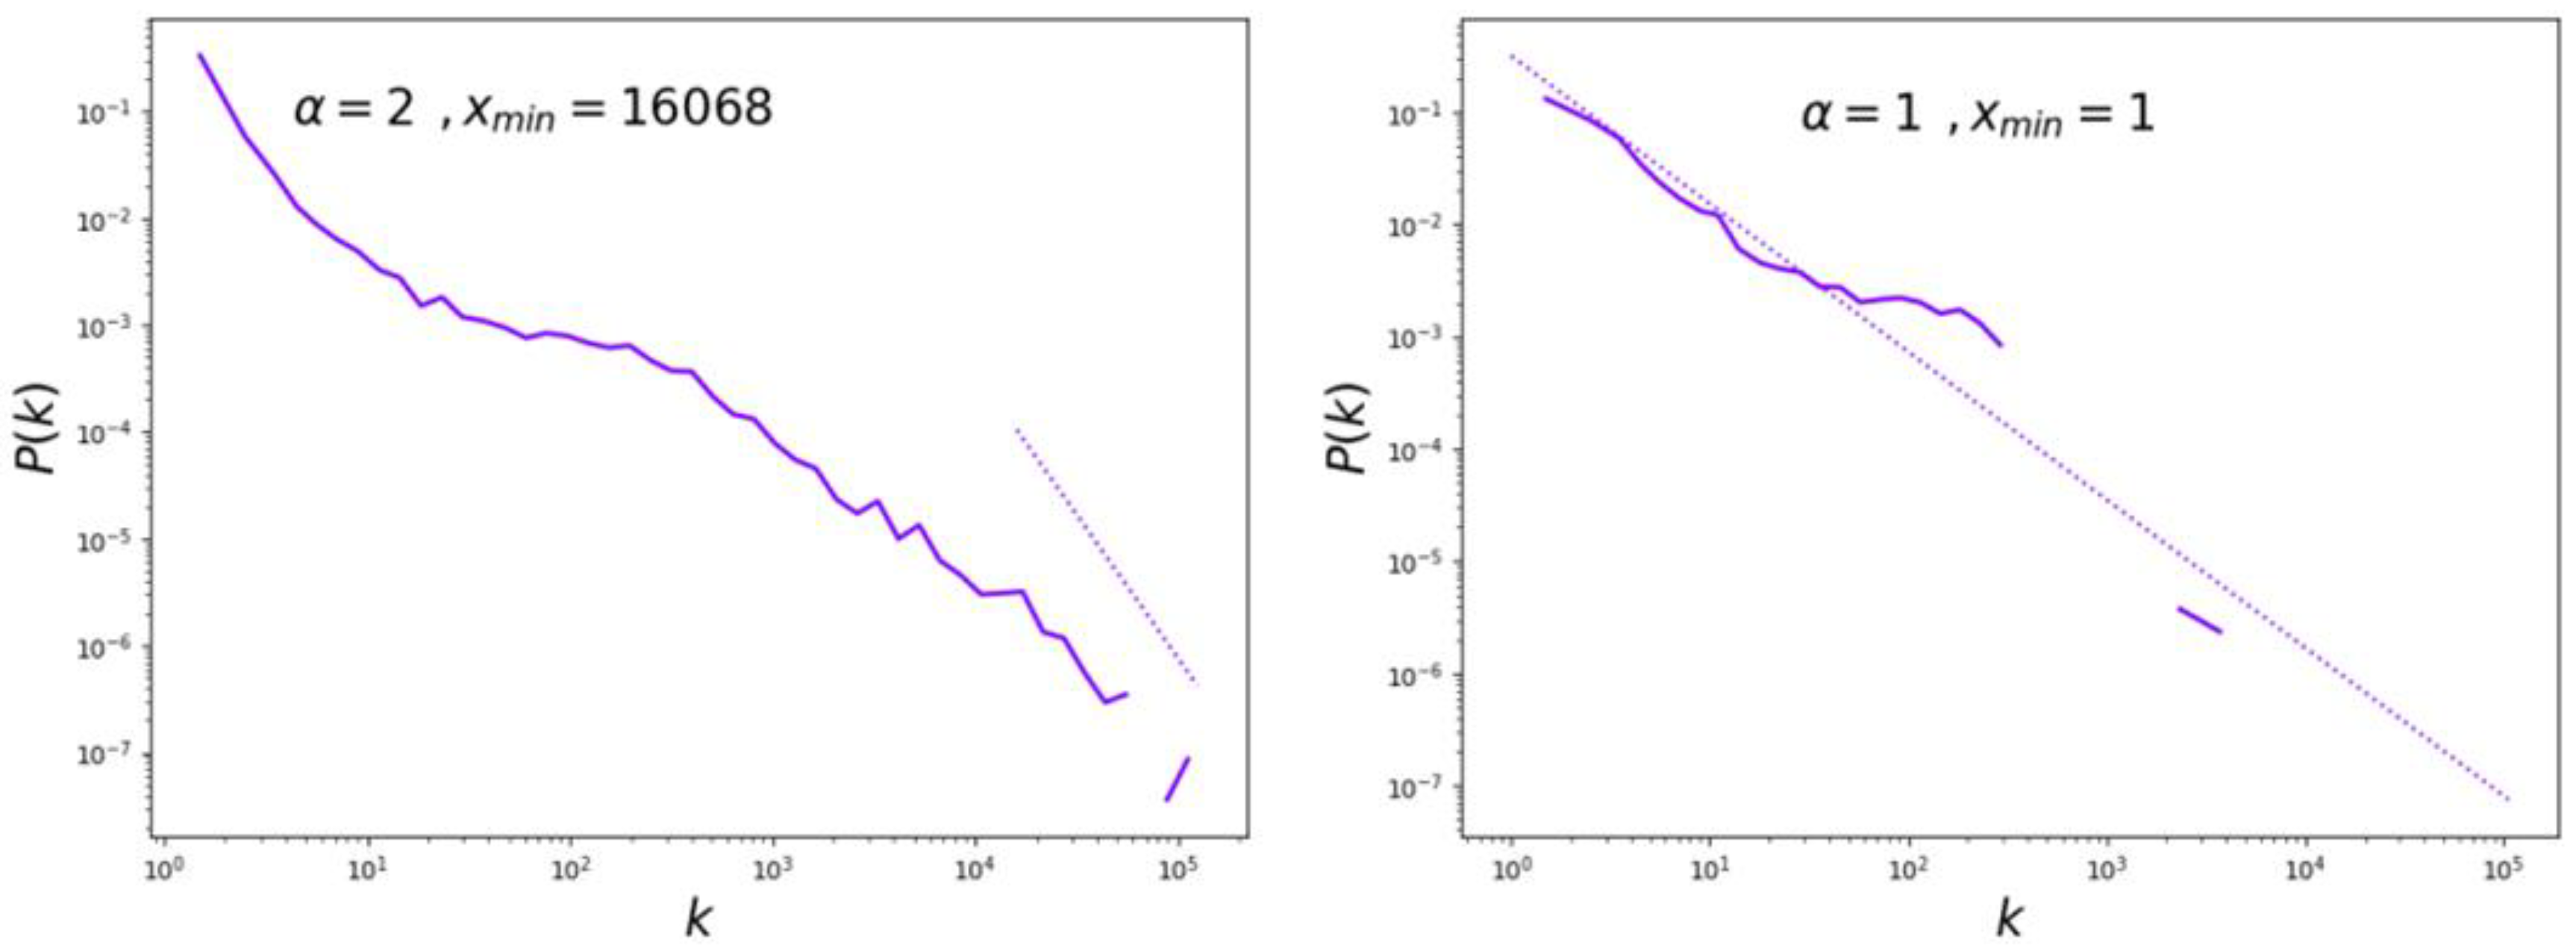
Figure 3. We discovered that the data distribution has a multi-segment truncation feature and does not conform to a strict power law distribution.
As shown in
Table 6, in the high range from 16,068 to 125,381, the power law is satisfied (
α = −2.68,
P = 0.057). However, compared to the entire data set, it discards a lot of data. In the lower range from 1 to 303, the power law is not satisfied (
α = −1.31,
P = 0.16).
Therefore, we conclude that the distribution of review voting is not always a power law distribution. There are two possible reasons. First, the power law distribution of online behavior changes with time, meaning that different voting behavior may occur in different time. Second, the dataset is relatively small compared to the entire community data; thus it cannot cover all review characteristics. However, we can see that review voting matches the 80/20 rule in our study. An event of small votes occurs in large numbers while an event of big vote occurs in small numbers.
3.3. Measuring the Crowd Intelligence Paradox
In this,
Section 3.3, we aim to measure the existence of the crowd intelligence paradox in online communities. From
Section 3.2, we know the distribution of review votes in online communities and matches the 80/20 rule and only a few reviews can receive votes. As to reviews with many votes, if they failed to reflect the quality of review content, this voting mechanism cannot reflect crowd intelligence, and it means that there is a crowd intelligence paradox in online communities.
3.3.1. Measures
Based on previous literature about the characteristics of information and information publisher, we choose content length, release time, content quality, hot-site (a mark of whether the content is/was entering the hot list), and the characteristics of information publisher, including activity, fans, likes, and levels. We construct a hierarchical regression model to analyze the effect of variables by the ordinary least squares method (OLS).
The multiple regression model is set as follows:
There is a dependent variable in our model: Voting. We measure voting by the increased number of votes [
2] to a music review between two periods—20 August 2017 and 21 September 2017 in our experimental dataset. For instance, if a review had 100 votes on 20 August 2017, and had 300 votes on 21 September 2017, the increased number of the votes is 200. There are eight independent variables, including quality, time, words, activity, fans, hot-site, level, and like, as shown in
Table 7. The variable quality is measured by the score of content quality, which comes from our text mining of content. High quality review valence is the value of the probability of quality classification. We measure time by a time difference between the release time of some review in a song and the earliest review in the same song. The variable words are measured by the number of words in the review. The variable hot-site is measured by a binary value indicating whether a review was included in the hot list on 20 August. “1” denotes that the review was in the hot list and “0” means that the review did not appear in the hot list. In addition, and through the collection of community data, we measured four commentator variables: Level, by the level of community account; activity, by the mark that often logs in and browses the community content; fans, by the fans of the user; and likes, by the number of users who take an initiative to pay attention to someone (e.g., Facebook’s Likes).
Table 7 presents the descriptive statistics and correlations of the variables.
3.3.2. Results
We analyzed the sub-dataset with the hierarchical regression method using Stata 14.0 and the ordinary least squares method (OLS).
Table 8 shows the results of the regression model between the independent variables and the dependent variable, as shown in the left-most column of
Table 7.
Considering the problem of heteroscedasticity, we applied the logarithmic transform on all variables (except the Hot-site). We used heterosexuality-robust standard error to fix the model. Based on the test of Variance Inflation Factor (VIF ranges from 1.3 to 4.9) and the above correlations of variables, we argue that there is no severe multiple collinearity.
We first estimated a basic model that contains time, words and the other four commentator variables. We report the results in column (1) of
Table 8. Those results are similar to the previous studies [
2,
17,
30]. Specifically, the effect of content length is an inverted U curve (Words:
β = 0.595,
P < 0.001; Words2:
β = −0.239,
P < 0.001) [
17]. The more words the review has, the more information it can present. However, if a sentence had too much information, it would bring an information burden to users and affects the acceptance of information [
2]. Four commentator variables have different influences to review voting. Fans has a significant influence (
β = 0.023,
t = 8.76,
P < 0.001), which is corresponding with the fact, because the commentator will have more personal channels to get votes from fans. Activity (
β = −0.008,
t = −4.52,
P < 0.001) and Like (
β = −0.012,
t = −5.67,
P < 0.001) have a significant negative influence, which may indicate that paying attention to external activities does not attract others to focus on themselves. Additionally, the action reduces to a time to think and write. Furthermore, because of the weak ties of network community, people do not pay more attention to others who concern about themselves. Additionally, the level (
β = −0.004,
t = −0.88,
P > 0.05) has no significant influence. As sharing and listening to music is the main activity in Net Ease Cloud Music, the review part is relatively un-associated with experience level.
Second, we add quality to the estimation and the results are presented in column (2) of
Table 8. We can see that quality has a positive influence on voting (
β = 0.036,
t = 4.99,
P < 0.001). However, the coefficient value is low and the model fitting degree changes very little (
= 0.0003,
P < 0.001).
Third, we add hot-site to the estimation and the results are shown in column (3) of
Table 8. The model fitting degree changes a lot (
= 0.1882,
P < 0.001) and hot-site has a significant positive influence on voting (
β = 2.498,
t = 41.28,
P < 0.001). This indicates that the acquisition of hot-site will make votes increase by 249.8%. But 1% promotion of quantity only lets votes increase by 0.022%, which indicates that hot-site are more important than quality. In addition, the words (
β = 0.508,
t = 18.01,
P < 0.001), time (
β = 0.022,
t = 34.49,
P < 0.001) and fans (
β = 0.008,
t = 5.00,
P < 0.001) have much smaller coefficients than hot-site. Therefore, hot-site is a dominant factor of review voting. This result is easy to understand. The hot-site value of a review is either one (i.e., the review is listed in the hot list) or zero (the review is not listed in the hot list). In our study, if a review is listed in the hot list of the online community “Net Ease Cloud Music” on 20 August 2017, its hot-site value is set to one, otherwise is set to zero. Generally, the reviews in the hot list are more likely to be viewed and commented on by users, yielding the increasing of the review votes to the hot-site reviews. This indicates that the hot-site value of reviews has a highly positive influence on review votes.
What is more, time (β = 0.022, t = 34.49, P < 0.001) indicates that early reviews are easier to get votes, because users are more likely to be attracted by new songs.
Combined with the distribution of review votes, reviews with many votes fail to reflect the quality of review content, and this voting mechanism cannot reflect crowd intelligence. Hence, the crowd intelligence paradox exists in review voting in online communities. Additionally, the crowd intelligence paradox is different from previous studies [
2,
30,
31], which argued that the quality of reviews was the main factor influencing review voting in trading communities.
In addition, we found out that hot-site have a dominant influence on review voting. The distribution of review votes matches an extreme 80/20 rule and the content is inconsistent with quality. The voluntary voting mechanism is a way to recommend high quality content, but this mechanism sometimes results in content with low quality. Thus, the crowd intelligence paradox affects the UGC ecological environment.
4. Factors Influencing the Crowd Intelligence Paradox
In this section, we analyze why the crowd intelligence paradox exists. From
Section 3, we know that the crowd intelligence paradox exists. However, it is much more important for enterprises to know the reasons behind the paradox. Thus, we construct a research model that includes a set of variables to study the influences of different factors on the crowd intelligence paradox. Compared with previous research, this fresh model explores the influencing factors of why the paradox exists from the perspective of receiver characteristics, on the basis of SDT and signal theory.
4.1. Research Model and Hypotheses
First, based on the organismic integration theory of SDT [
36], the internalization of external motivation has four steps, including external regulation, introjection regulation, identification regulation, and integration regulation. Autonomy, competence and relatedness are three important factors to promote the internalization of external motives and influence actions. Usually, these three needs make up an organic entirety. However, relatedness is a decisive factor for review voting. Autonomy and competence almost do not work because of the special environment.
Specifically, social relations are the main part of the demand for user relations in online communities [
18]. First, because of the community’s emphasis on the users’ experience, the vote does not require operational capabilities. Second, comment on some songs is easy to understand, so it does not need much cognitive effort. Third, people are completely autonomous in voting. As previous studies pointed out, self-efficacy is not related with the comment [
19]. Therefore, relatedness is relatively more important. Meanwhile, community points externally influenced review voting. What is more, altruism and herd mentality strengthen this voting behavior. Taking into account the tendency of collectivism in Chinese culture, this strengthening is more significant. That means only relatedness can affect users’ voting behaviors to some extent, at least to some degree. “Readily praise (unconditionally vote)” becomes a custom under the imbalance of voting motives. People use voting rights to exchange social satisfaction.
On the other hand, except for the number of votes, there is no more signal in Net Ease Cloud Music. People tend to judge the quality of the content based on the number of votes. But the signal is useless because it does not have a higher time cost, operating cost, reputation cost, and cognitive cost [
38]. Thus, the fake votes influence user behaviors.
Specifically, while watching a comment, users can vote without waiting. Moreover, operating costs can be ignored due to the strengthening of perceived ease of use. The mechanism of content voting is extremely convenient, for increasing community traffic and interactions. In addition, voting has anonymity. Users’ reputation will not change after voting. Furthermore, people do not want to think about the true value of the content for the herd mentality.
Therefore, the low cost signals cannot be an effective tool for reducing or eliminating information asymmetry [
9]. That means that the votes cannot represent the quality of the content. But the community usually tends to design rankings according to the number of votes. The paradox comes with the useless signal.
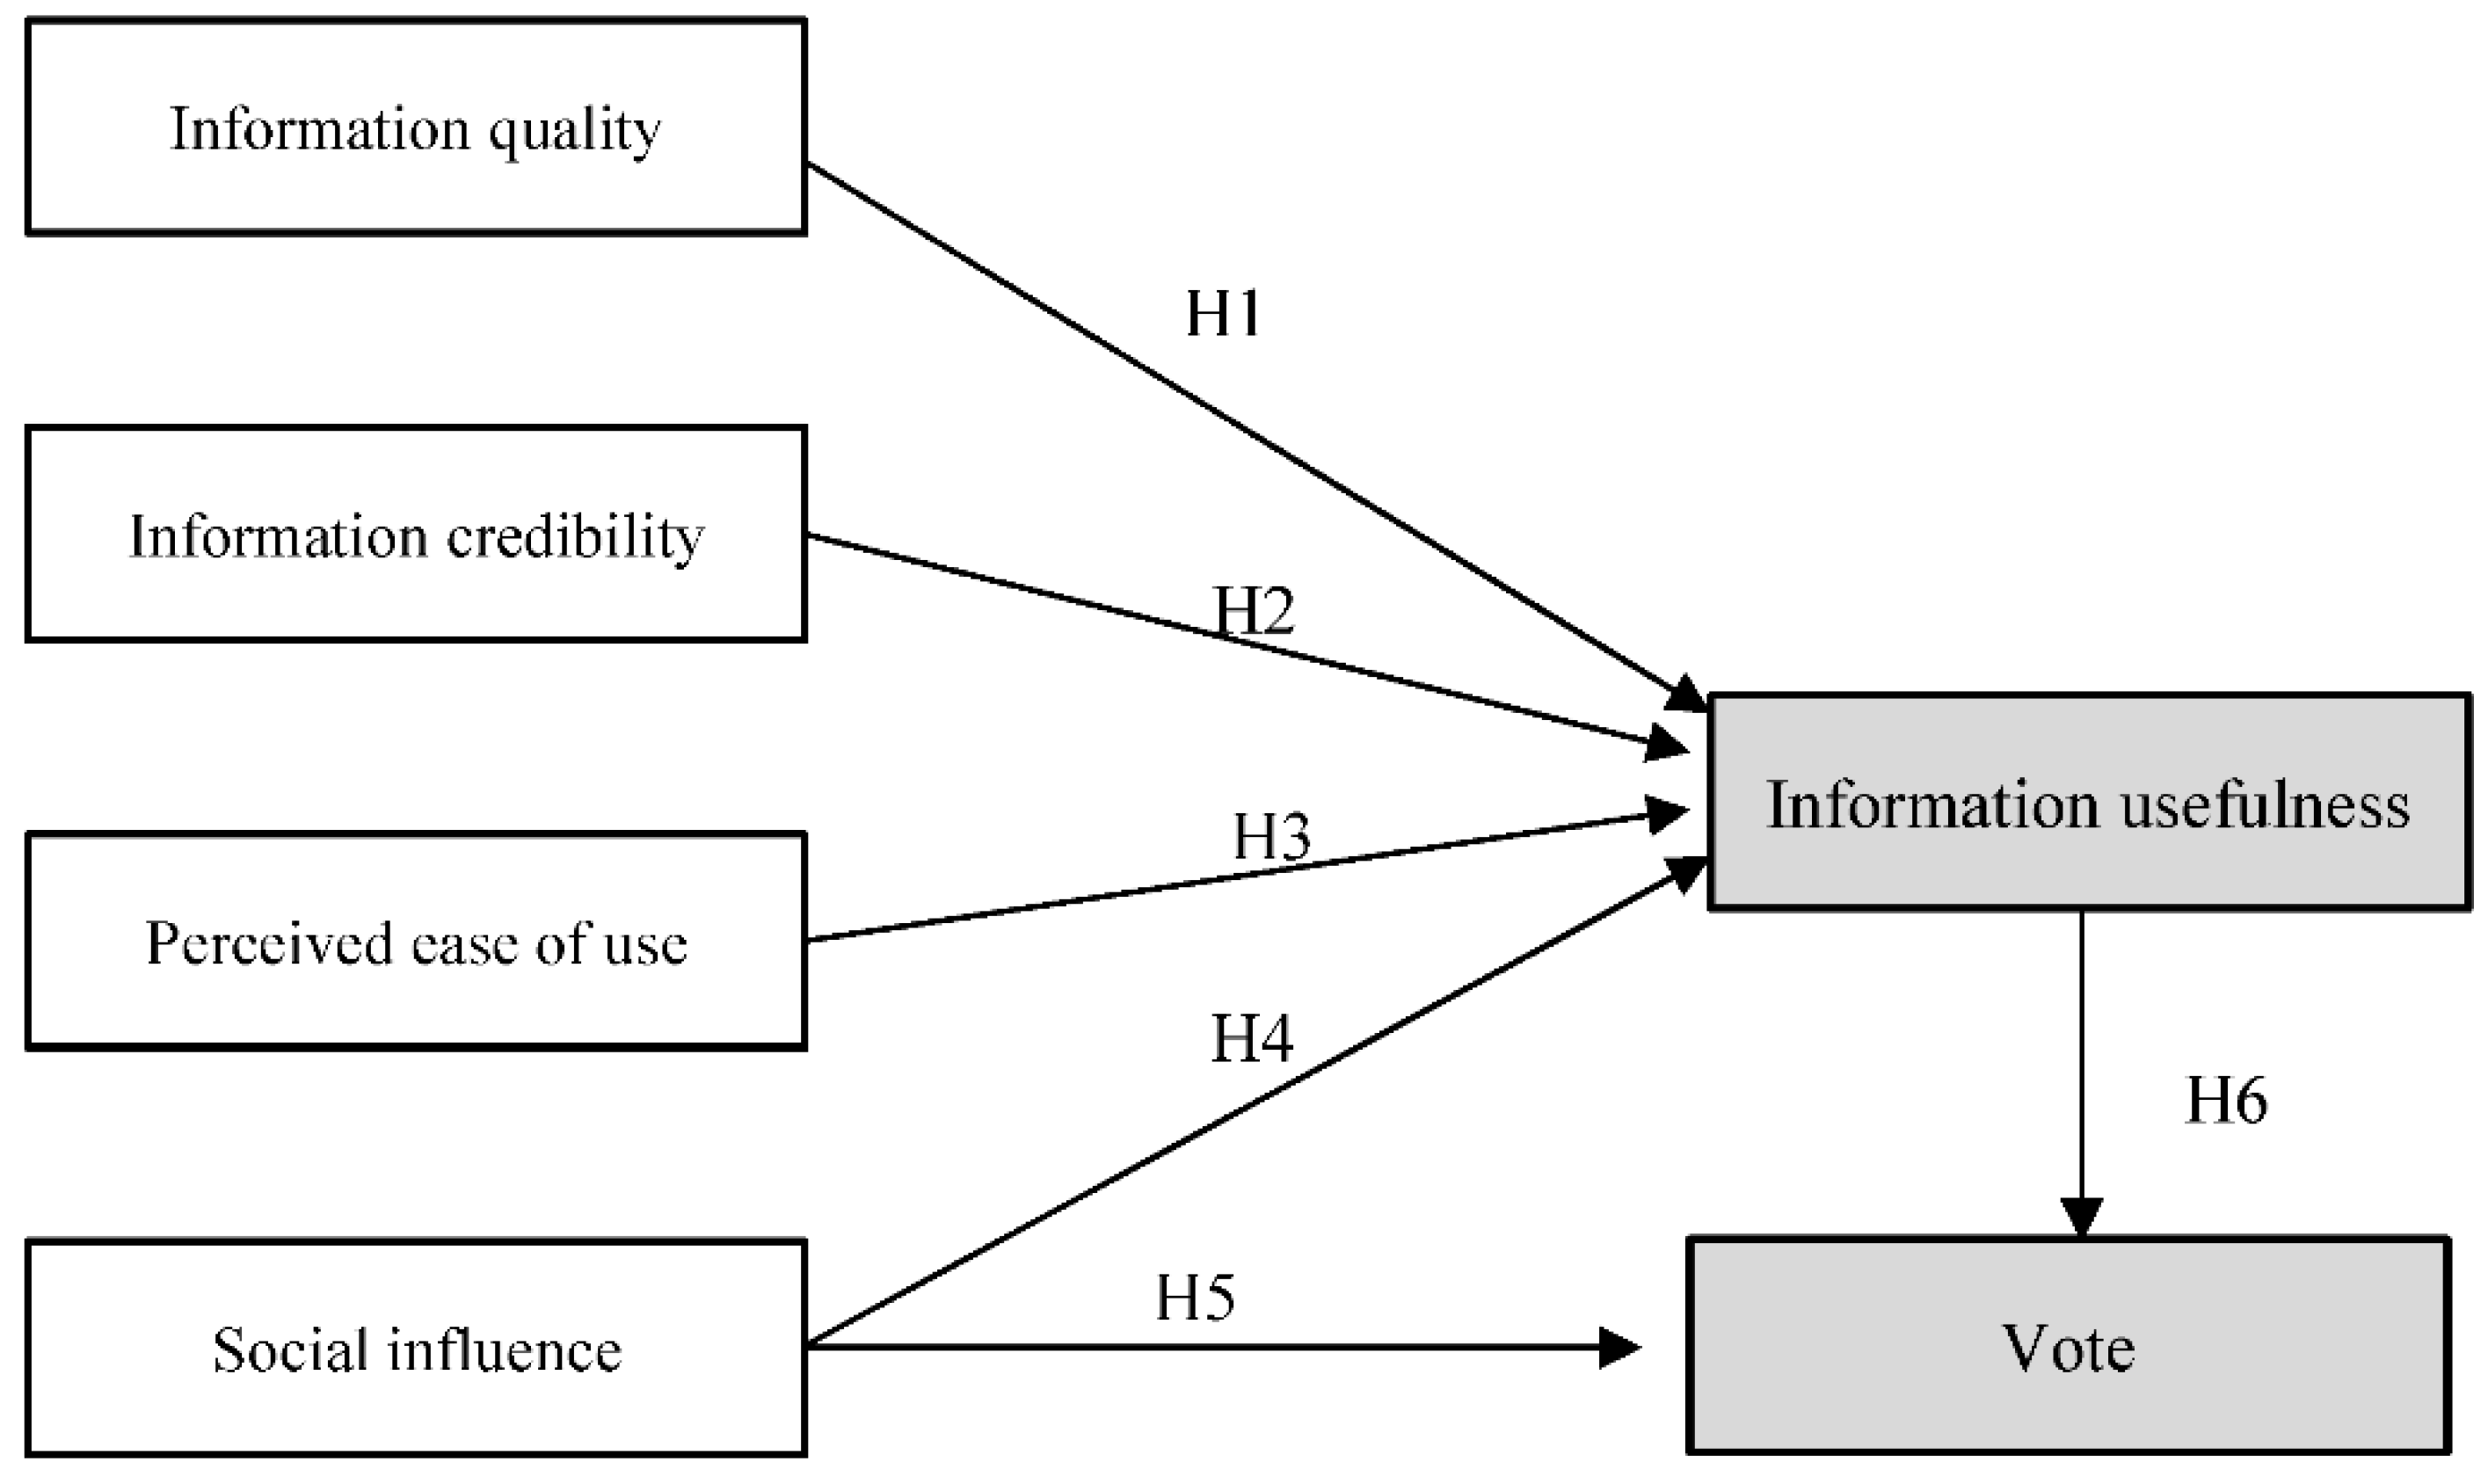
In summation, we propose the following variables, including information quality, information credibility, perceived ease of use, and social influence to study the factor influences on the crowd intelligence paradox. Based on this, we present the voting adoption model (VAM) in
Figure 4.
Next, we propose the following assumptions.
Hypothesis 1 (H1). Information quality of review significantly increases users’ decision on review usefulness.
Hypothesis 2 (H2). Information credibility of review significantly increases users’ decision on review usefulness.
Hypothesis 3 (H3). Perceived ease of use significantly increases users’ decision on review usefulness.
Hypothesis 4 (H4). Social influence significantly increases users’ decision on review usefulness.
Hypothesis 5 (H5). Social influence significantly increases users’ decision to provide a vote on the review.
Hypothesis 6 (H6). Information usefulness significantly increases users’ decision to provide a vote on the review.
4.2. Measurement Model Evaluation
The measurement model evaluation mainly includes three pieces of content: Reliability analysis, convergent validity, and discriminant validity.
Reliability is usually examined by using internal consistency reliability and composite reliability. As shown in
Table 9, the internal consistency reliability is over 0.70. The composite reliability (CR) of all constructs is also over 0.70. Therefore, the reliability validity is achieved, which indicates that the variables within the VAM model are consistent.
Convergent validity is usually examined by using a composite reliability (CR) and an average variance is extracted (AVE). As shown in
Table 9, all items load significantly on their respective constructs and none of the loadings are below the cutoff value of 0.60. The AVE of each variable is over 0.50 (except one value which is 0.485). Thus, the convergent validity is achieved.
Discriminant validity is proposed to examine whether a measurement is a reflection of any other measurement. As shown in
Table 10, the square root of AVE for each variable is greater than other correlation coefficients. Thus, the discriminant validity is achieved.
4.3. Structural Model Evaluation
Next, we perform structural model evaluation using AMOS 23.0. The results of hypotheses verification are presented in
Table 11, and
Table 12 shows the goodness of fitting.
Five hypotheses between variables are found statistically significant while one hypothesis is not significant.
H1 states that the information quality significantly increases users’ decision on review usefulness, which is not supported (b = 0.04, p > 0.5).
H2 states that information credibility significantly increases users’ decision on review usefulness, which is supported (b = 0.24, p < 0.001).
H3 states that perceived ease of use significantly increases users’ decision on review usefulness, which is supported (b = 0.29, p < 0.001).
H4 states that social influence significantly increases users’ decision on review usefulness, which is supported (b = 0.37, p < 0.001).
H5 states that social influence significantly increases users’ decision to provide a vote on the review, which is supported (b = 0.55, p < 0.001).
H6 states that information usefulness significantly increases users’ decision to provide a vote on the review, which is supported (b = 0.22, p < 0.001).
Additionally, in order to test the mediating effect of the information usefulness in the model, we choose the bootstrapping method (using 2000 samples) [
46]. At a significant level of 95%, the mediation of information usefulness exists between information quality and vote adoption (0.057, 0.218), and between perceived ease of use and vote adoption (0.160, 0.520). The mediating effect of the information usefulness is achieved, which means that voting the hot review is usually as a result of information usefulness.
5. Discussions and Suggestions
5.1. Discussions
According to the data analysis in
Section 4, the survey data confirms that reliability, perceived ease of use, and social influence are the main factors influencing review voting. However, the correlation between behavior and text quality has not been validated. The imbalance of voting motives and the failure of voting signals may be the causes of the uselessness of information quality. Therefore, the analysis supports our assumption on the causes of the crowd intelligence paradox.
Specifically, strong social needs repress the work of autonomy and competence. An economic person is embedded in a social structure [
47]. In online communities, everyone is deeply embedded in a community environment. They constantly collect information and make decisions in the interaction process between individuals and then consciously or unconsciously make a choice under the influence of others. When people provide a vote to a song, they are implicitly connected with other users who follow the song. As the voters and the followers of a song are supposed to have similar interests, they are much likely to interact with each other in the online music community. So the quality of a review is insignificant. The satisfaction of social need is much greater than the satisfaction of the cognitive value of a review [
19]. At the same time, group praises form a huge pressure of identity. Voting for a hot review is a way to escape the pressure of judgment. Therefore, “Readily praise (unconditionally vote)” becomes a custom under an imbalance of voting motives.
Information reliability has a significant impact, which is similar to previous studies. The reliability of the information source (as an edge path) has an impact on information receivers [
30]. However, there is a lack of heterogeneous signals in online communities, compared to the trading community. Users assess the reliability and often rely on the number of previous points. Because the low-cost signals cannot be an effective tool for reducing or eliminating information asymmetry, the number of votes cannot represent the quality of content. A comment that is relatively low or even of no value will receive the majority of votes under the fake signal. It may mislead users, which is similar to the bias of the ratings [
3]. This principle can also be observed by a counter example. For example, Stack Overflow (
https://stackoverflow.com/) is the largest, most trusted online community for developers to learn, share their programming knowledge, and build their careers. A voting mechanism is relatively good in Stack Overflow. Because the knowledge of communication is more professional and standard, users need to spend a certain time to do a mental work. Based on a professional and technical literacy, users pay more attention to their reputations. Therefore, the cost of voting is high and the signal is relatively good.
5.2. Suggestions for the Sustainable Development of Online Communities
Based on the empirical research, we provide some research implications and advice for the sustainable development of online communities.
We suggest increasing the cost of the voting signal. Based on the cost point, we can set a time interval to avoid voting for three reviews in a second. This may increase a selection cost and a time cost, while potentially not affecting normal voting. We can also set a negative vote to amend the integral of votes by forcing users to actively and subjectively evaluate. In order to avoid a negative feedback from negative votes to publishers, we can only open to the recipient and cannot display information publicly.
We suggest setting up multiple signals for review voting in online communities. Due to a lack of signals, users usually judge the value of content based on the number of votes. We can set multiple signals to weaken the strength of the voting signal. For example, give a preset score for content (through arithmetic) and then encourage people to independently revise the score. Because changing the score requires some certain ability, it may enhance the satisfaction of autonomy and competence. Therefore it may reduce the impact of social voting motives.
It is better to provide behavioral data, especially the record of voting data, in the review voting environment. For example, we can list the historical content of the votes, as well as the feedback of voting, specifying how many people vote for the same content. This may make users reflect their voting behavior and enhance the demand of autonomy and competence.
Enterprises need to avoid traffic traps. A key indicator of community development is user traffic. Community administrators are accustomed to seeing a large number of frequent voting interactions as a help of improving community activity—however, it ignores the harm of the “Readily praise (unconditionally vote)”. Content publishers often face many praises, but only a small amount of feedback content. This long-term, frequent, and ineffective interaction affects the publishers’ enthusiasm. Community managers should carefully avoid traffic traps and maintain the UGC ecological environment. Additionally, paying more attention to traffic and less attention to quality is an extensive development pattern. At early stages, massive users provide natural resources for online communities. Additionally, network externality has strengthened the power of a crowd. However, the Internet is becoming more and more mature and the demographic dividend is relatively disappearing. Refined management will become a feasible way to get competitive advantages.
6. Conclusions and Future Work
In this paper, we discovered what the crowd intelligence paradox of review voting in online communities is and why it exists. We first testify that the distribution of review votes in online communities matches the 80/20 rule and only a few comments can receive votes. Then, as to those reviews with many votes, not all reviews are related to high-quality comments. We found that they fail to reflect the quality of review content and this voting mechanism cannot reflect crowd intelligence, and it means that there is a crowd intelligence paradox in online communities. The above successive aspects quantitatively measure the existence of the crowd intelligence paradox in online communities.
Furthermore, we constructed a new research model called VAM (voting adoption model) to uncover the imbalance of voting motives and the failure of voting signals. The survey data confirms that reliability, perceived ease of use, and social influence are main factors influencing review voting. Based on SDT, strong social needs repress the work of autonomy and competence. The satisfaction of social need is much greater than the satisfaction of the cognitive value of a review. Therefore, “Readily praise (unconditionally vote)” becomes a custom under an imbalance of voting motives. On the other hand, because the low-cost signals cannot be an effective tool for reducing or eliminating information asymmetry, the number of votes cannot represent a quality of content. A review that is relatively low or even of no value will receive the majority of votes under the fake signal.
One limitation of this study is that the manual annotation might not reflect users’ real intention, because the involved volunteers for annotation are different from users in online communities. This is always a crucial issue in classification and other text mining tasks, and in the future we will explore other feasible approaches that can get results close to natural voting. Another future work is to investigate more online communities to verify the crowd intelligence paradox. In addition, we will also explore the application of the research results on a real online community to improve the efficiency and effectiveness of online businesses.


