Sustainability Performance in Food Supply Networks: Insights from the UK Industry


Centre for International Manufacturing, Department of Engineering, Institute for Manufacturing (IfM), School of Technology, University of Cambridge, 17 Charles Babbage Road, Cambridge CB3 0FS, UK
*
Author to whom correspondence should be addressed.
Sustainability 2018, 10(9), 3148; https://doi.org/10.3390/su10093148
Submission received: 24 July 2018
/
Revised: 27 August 2018
/
Accepted: 30 August 2018
/
Published: 3 September 2018
(This article belongs to the Section Environmental Sustainability and Applications)
Abstract
:The purpose of this research is to introduce a qualitative sustainability performance assessment framework for food supply networks, based on the perception of their key stakeholders’ upper management. Moreover, the paper provides industry insights by exemplifying the value of the proposed framework for the UK food industry. A critical review on the most acknowledged sustainability assessment methodologies and tools resulted in the synthesis of the proposed framework. An illustrative application follows, based on data from semi-structured interviews with C-level executives from key players of the UK poultry sector. The results demonstrate an easy-to-use approach, with a comprehensive and sharp outcome on supply chain sustainability performance assessment. Industry insights demonstrate an adequate sustainability performance with respect to the entire supply chain. A detailed view on different echelons reveals specific areas that could be improved, such as the environmental performance at both farming (production) and processing levels. This work extends the scope of current sustainability performance assessment tools by providing a tangible triple bottom-line overview, as well as echelon-specific and indicator-specific details, in a user-friendly, yet straightforward, way. UK food industry insights are valuable for practitioners and academics. The illustration is based exclusively on C-level executives’ viewpoint; thus, any generalization of the results should be considered to this effect. Supply chain stakeholders, policy-makers, and researchers could perform a quick and reliable supply network sustainability performance assessment.
1. Introduction
Stakeholder expectations along with growing institutional pressures over today’s sophisticated supply chains drive firms to adjust the traditional economic-driven network archetypes and embrace socially and environmentally sustainable business operations [1]. More specifically, food systems’ sustainability is becoming more pronounced considering the projected increase in food demand by 70% in 2050 [2] in tandem with the global challenges of natural resources’ overexploitation and diversified dietary norms [3]. In this regard, food chain stakeholders continuously reconsider the most critical issues that need to be collectively addressed for the effective management of such complex multi-tier networks in order to ensure efficiency and sustainability [4].
In recent years, sustainable food supply chain management, especially in Western societies, has been epitomized by emerging challenges and concerns at both regional and global levels, including [5]: (i) production costs and value distribution; (ii) natural resources’ scarcity and environmental impact; and (iii) food safety and ethical issues. Indicatively, stringent standards and guidelines effective in the United Kingdom (UK) exert coercive pressures across end-to-end food supply chain operations to improve the sustainable performance. In economic terms, in 2014, the UK food industry comprised 16% of all UK manufacturing (over 6000 firms), with an annual turnover of £80 billion and exports reaching £12.6 billion [6]. In terms of environmental repercussions, the wider UK food industry accounts for up to 40% of the total UK greenhouse gas emissions [7], while the generated post farm-gate food waste amounts to 10 million tonnes with an annual value of over £17 billion [8]. Furthermore, the food sector is associated with major social sustainability implications as it promotes community cohesion and food security [9].
Notwithstanding the significance of food supply chains, the extant literature on related networks’ sustainability assessment is rather limited, while an evident diversification on the sustainability focus and the elaborated methodological approaches exists. Findings provided by Brandenburg et al. [10] reveal that approaches for evaluating supply chain sustainability could be mainly recognized by life-cycle oriented analyses or multi-criteria decision-making models which are rather myopic by neglecting spatial and temporal dynamics. In addition, the majority of existing methods are specific raw data dependent, thus requiring sophisticated data gathering software and in-depth knowledge of the concerned network operations [11]. In this context, proposed composite metrics and complicated computational approaches are contested and still much debated as they might have neither direct real-world applicability, nor any potent managerial value [12].
The present manuscript contributes to sustainable supply chain research by extending the scope of relevant performance assessment tools. In particular, the study proposes an easy-to-use triple bottom-line sustainability performance evaluation approach through capturing echelon-centric and indicator-specific details, in a user-friendly, yet straightforward, manner. In particular, this research first reviews existing sustainability assessment frameworks and identifies common performance indicators that capture the triple bottom-line of sustainability at three main food supply chain echelons of operations, namely: (i) farming (production); (ii) processing; and (iii) retailing. Secondly, the proposed assessment framework was communicated to thirteen C-level executives from the UK poultry industry to develop a contemporary view of the sector’s sustainable performance. Furthermore, the paper demonstrates the usefulness and challenges related to the application of the proposed assessment framework for a specific case under study. The poultry industry is under the constant scrutiny of public attention, especially after the recent revelations about a series of hygiene failings in the UK poultry industry [13] and the pan-European eggs’ scandal [14].
The remainder of the paper is structured as follows. In Section 2, we provide a brief background about sustainability performance evaluation in the field of food supply chains. In Section 3, we describe the research methodology applied for the purposes of the present study. Following that, in Section 4, we identify an index along with detailed indicators for food supply chain sustainability assessment and we integrate the identified measures into a robust evaluation framework that supports the networks’ performance analysis. The application of the proposed framework is further illustrated by the real-world case study of the UK poultry industry, in Section 5, along with interesting managerial insights for practitioners and academics alike. Conclusions, limitations, and recommendations for future research are discussed in the final Section 6.
2. Food Supply Chain Sustainability Assessment: Background
Sustainable food farming, processing, distribution, and consumption, along with the associated challenges, comprise pertinent topics in academic curriculums, research discourse, and corporate agendas [15]. Nonetheless, the plethora of extant studies fail to legitimately capture the breadth and interplay of stakeholders’ sustainability notion involved in end-to-end food supply chains [16], further elaborating metrics attached to single sustainability constituents (e.g., economic efficiency, greenhouse gas emissions) and ignoring ramifications at the other pillars (e.g., food safety, ethical trading). Indicatively, Gerbens-Leenes et al. [17], motivated by the lack of commonly accepted standards for business sustainability reporting, proposed a systems-based environmental sustainability evaluation approach and applied it to the case of a cake production chain in the Netherlands. More recently, Bourlakis et al. [18] developed an 18-metrics sustainability assessment methodology for food supply chains and applied it to the case of Greece, finding that micro-, small-, and medium-sized firms exhibit different sustainability characteristics with respect to their supply chain stage.
In addition, Egilmez et al. [19] elaborated a life cycle-based approach to assess the environmental sustainability of 33 food manufacturing sectors in the United States of America, from a supply chain perspective, and concluded that the poultry processing sector has the greatest environmental impact compared to its generated production output. Furthermore, Martindale [20] conducted a consumers’ survey to identify associations between households’ diet composition and generated food waste. The study findings reveal that diets comprised of frozen foods generate significantly lower greenhouse gas emissions compared to fresh food diets due to the lower amount of generated waste. Beske et al. [21], aiming to integrate the theories of Sustainable Supply Chain Management and Dynamic Capabilities, systematically assessed peer-reviewed papers on food networks and identified distinctive capabilities that could foster sustainable performance.
Recently, van der Goot et al. [22] stressed the adverse ramifications of today’s food production systems and recommended the redesign of food processing chains for promoting environmental sustainability and nutritional value. Manning and Soon [23] reviewed the related literature and developed a sustainability indicator scoring framework to promote the triple bottom-line of sustainability in food supply chains, at the strategic level.
3. Materials and Methods
3.1. Performance Assessment Framework: Theoretical Foundations
The sustainability measures that inform the proposed supply chain sustainability performance assessment framework are grounded on a synthesis of publications emanating from both scientific research and business practice. In total, twenty-seven sustainability evaluation frameworks were initially reviewed, which might not exclusively consider the food sector, available from major academic, institutional, and corporate actors including, amongst others: (i) Food Trade Sustainability Leadership Association; (ii) Global Environmental Management Initiative; (iii) Global Reporting Initiative (GRI); (iv) Social Life Cycle Assessment (SLCA); (v) Stewardship Index for Specialty Crops; (vi) Sustainability Assessment of Food and Agriculture systems (SAFA); (vii) Sustainable Packaging Coalition; (viii) Wal-Mart Stores, and other major wholesalers and retailers. Considering the present study’s aim to tackle sustainability performance across food network operations from a practical viewpoint, any reviewed frameworks that follow a merely theoretical perspective were excluded from this research. In this regard, the proposed framework adopts elements from the following three constructs for sustainability evaluation: (i) the framework developed by the non-profit organization GRI [24]; (ii) the SAFA framework developed by the Food and Agriculture Organization of the United Nations [25]; and (iii) the SLCA framework developed by the United Nations along with the Society of Environmental Toxicology and Chemistry [26].
In particular, the GRI was selected as one of the three reference frameworks as it requires the reporting of economic, environmental, and social firm performance information [27]. To this effect, decreased information asymmetry among supply chain actors is ensured [28], whilst assisting companies in their sustainability-focused evolutionary efforts [29]. Following that, the value of the SAFA framework lays within its broader impact assessment scope that embraces the triple bottom-line of sustainability [30], while introducing governance as a fourth sustainability pillar for the evaluation of food and agricultural enterprises [31]. Finally, the SLCA framework indirectly covers food security and supply trade-related issues, further capturing social sustainability within a spatial context [32] such as socio-cultural tradition, natural heritage, and local employment.
In this sense, our critical analysis of the three reference frameworks reveals that the theoretical lens on the design, analysis, and assessment of sustainable food chains should focus on an integrated triple helix index capturing economic, environmental, and social elements, as these are mapped at each food supply chain echelon. Following that, the aforementioned index has to be coupled with detailed indicators for assessing and interpreting operations’ performance corresponding to sustainability-oriented interventions.
3.2. Empirical Evidence
The sustainability assessment performed in this research, at each food supply chain stage, involves subject matter expert interviews. Overall, thirteen semi-structured interviews were conducted with C-level executives from UK companies—involved in the poultry industry either in specific (i.e., just processing) or multiple (i.e., processing and retailing) supply chain echelons. The experts’ selection was based on their long-term empirical participation in the food industry and their knowledge and understanding about food network operations. A qualitative and quantitative content analysis of the interviews’ transcripts was then conducted. The retrieved descriptive responses were compared to the identified best practices in the sector, thus assisting in performing a semi-quantitative grading (i.e., qualitative by using scoring system) to evaluate performance at each sustainability index and across every food network level. More specifically, the sustainability performance of each food chain operation was ranked on a scale of 1.0 (“lowest performance”) to 5.0 (“best performance”), with the practitioners participating in the interview process not providing any input on the quantitative stage of this work.
3.3. Research Design
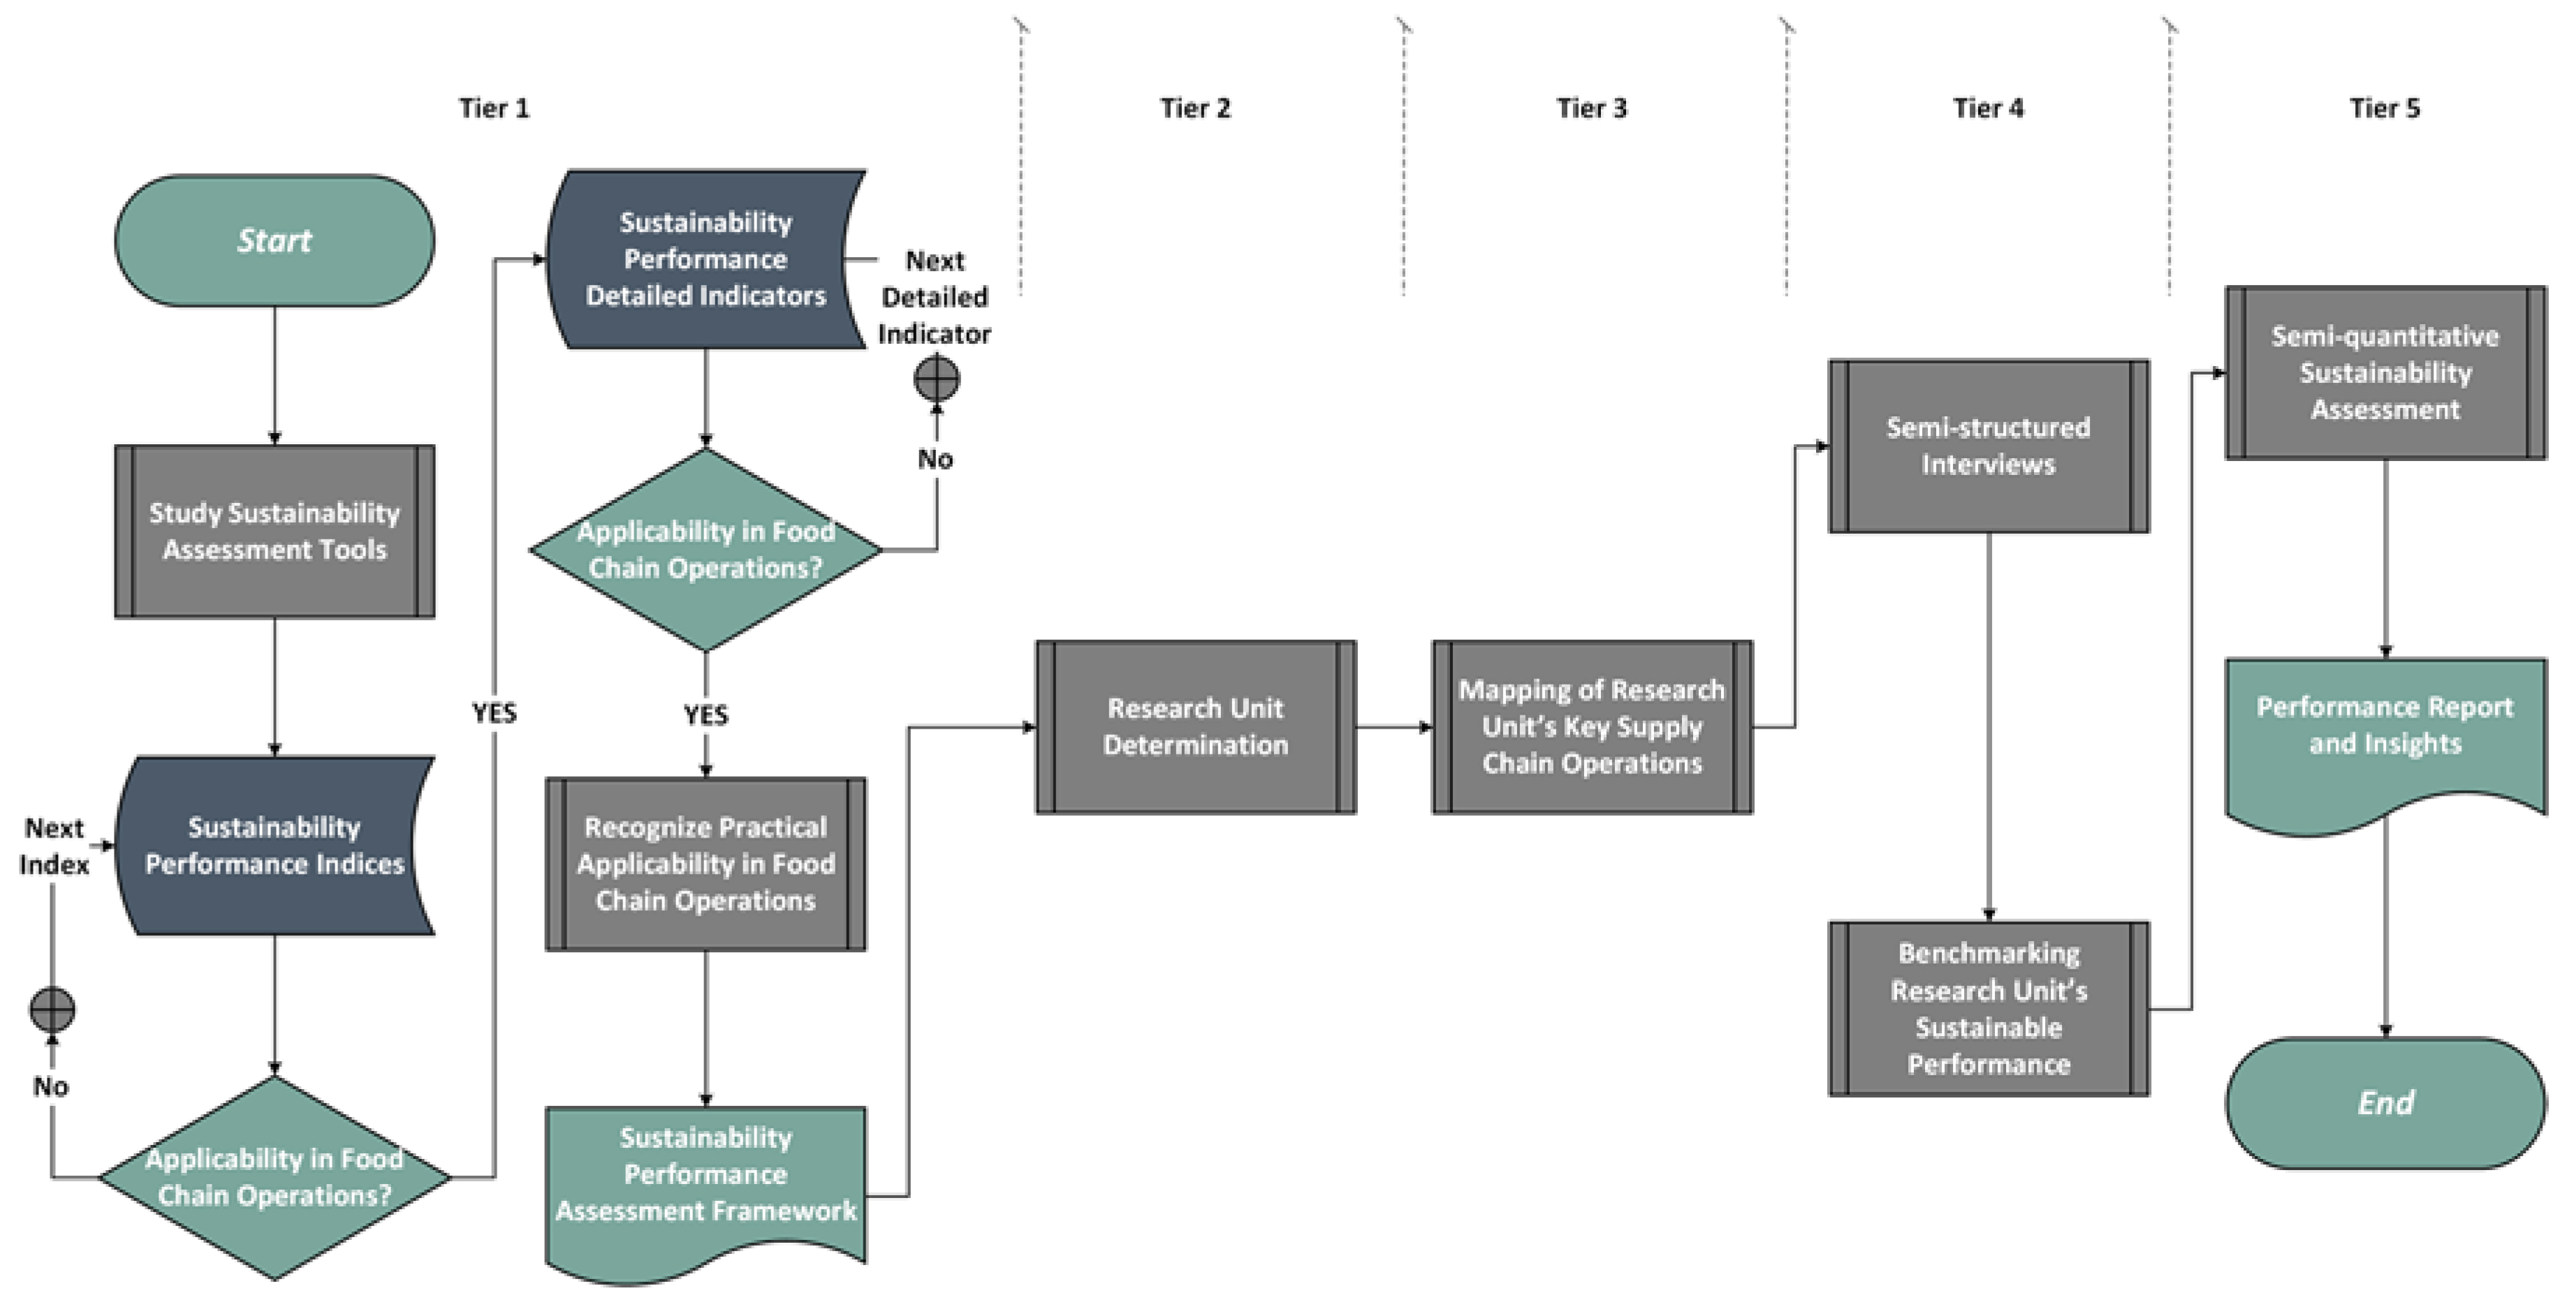
The utilized research steps for developing the proposed framework are illustrated in Figure 1 through the corresponding flowchart. The research design pursued incorporates the abovementioned research steps, i.e., primary and secondary research, and is based on a five-tier abstraction process. Tier #1 captures the development stages of the proposed sustainability performance assessment framework. In Tier #2, we determine the research unit, i.e., the “UK Poultry Industry”, to apply the developed framework. Tier #3 suggests the mapping of the poultry supply chain to have a generic overview and understanding of the determined research unit. Semi-structured interviews and benchmarking takes place at Tier #4. At this stage of our research, we adopt the ‘quantitizing’ methodology to codify and transform the retrieved views of the interviewees into a form amenable to further quantitative representation and assessment. According to Sandelowski et al. [33], quantitizing is defined as “the process of assigning numerical (nominal or ordinal) values to data conceived as not numerical (or to experience formed into words, visual displays, or something else conceived as qualitative)” and is regarded as a component of mixed methods research [34,35]. In fact, quantitizing is selected as the analysis process to: (i) apprehend the complexity and ambiguous content of the interviewees’ responses [33,36]; (ii) engineer the retrieved qualitative data and extract meaningful quantitative scores in a simplified manner [37]; (iii) perform a realistic and constructive analysis [38]; and (iv) extract useful information and discursive structures [33]. In this regard, we claim that the interpreted scales could be used as predictors to facilitate further statistical analysis processes that involve analysis of variance. Finally, performance reporting and insights are generated in Tier #5. The critical review of the sustainability performance assessment frameworks and the interviews were conducted as part of our on-going research on sustainable food supply networks.
4. Methodological Framework for Food Supply Chain Sustainability Assessment
4.1. Performance Index
The critical review of twenty-seven sustainability assessment frameworks revealed that an evaluation approach should lay its foundations on the sustainability mosaic, hence capturing: (i) investments, production, and material costs at the economic dimension; (ii) energy, water, and resources at the environmental pillar; and (iii) health & safety, charity, and certification at the social constituent. Thereafter, the selection of detailed performance indicators should correspond to the abovementioned triple bottom-line sustainable index and should be tailored to the nature of each level’s operations. Additionally, the selected performance indicators have to be: (i) traceable and assessable through time; (ii) extractable through available information; and (iii) direct and clear. Table 1 synthesizes the main findings of the literature review by providing a taxonomy of the resulting performance indicators.
4.2. Integrated Framework
The proposed sustainability assessment framework embraces the main food supply chain operations across the economic, environmental, and social pillars. Figure 2 illustrates the structure of the framework which includes major performance indices that give impetus to network sustainability stewardship. For every pillar, the three most predominated indices outline the boundaries of the sustainability assessment. Specific indicators for each index, with respect to every supply chain echelon (see details in Table 1), create a pool of sustainability performance indicators. Thus, a reliable assessment equally covering the most important processes in every supply chain echelon, from economic, environmental, and social perspectives, is enabled. This framework is by no means a rigid model, nor it is based on an exhaustive list of all relevant indicators, but rather acts as a synthesis of major performance assessment elements that we have identified as part of our on-going research.
The proposed framework aims at assisting food companies in achieving an integrated economic, environmental, and social sustainability evaluation of their supply network in a direct and efficient manner. The suggested evaluation areas per sustainability constituent (i.e., production and material costs, investments for economic sustainability; energy, water, resources for environmental sustainability; health & safety, charity, certification for societal sustainability) indicate the crucial elements that stakeholders need to continuously consider for ensuring sustainable performance. The value of the proposed framework is encapsulated in the inherent capability to periodically re-evaluate and update the corporate/sector sustainability profile, without the necessity to extensively deploy time-consuming and effort-demanding sustainability evaluation protocols.
In the economic pillar, material and production processes in the food industry are determinant elements which are reflected by the market-sensitive attributes of perishability and quality. Therefore, farming and processing expenditures impact corporate economic viability. In this regard, investments in the industry mainly aim to explore product and production improvements that promote reductions in the latter cost elements whilst ensuring sales volumes. Supply chain reconfiguration options also aim to identify cost-effective suppliers for sustainable production. From an environmental standpoint, the consumption of resources and energy, along with waste generation and treatment, are integral production functions in the food industry. More specifically, considerable energy consumption and appropriation of natural resources, e.g., freshwater, are attributed to food farming; the associated environmental impact could be detrimental, especially in geographical regions with loose regulations and policy schemes. From a social perspective, health and safety issues and commodities’ certification are highly appreciated by consumers. Additionally, as food losses are of a significant magnitude, charity events to support humanitarian operations can have a major societal impact. In case of inevitable food waste due to perishability, the treatment of the discarded organic matter attracts public attention; however, the exploitation of food waste to produce added-value intermediates or end-products should also be considered to improve the corporate social image within a circular economy context.
5. Results and Discussion
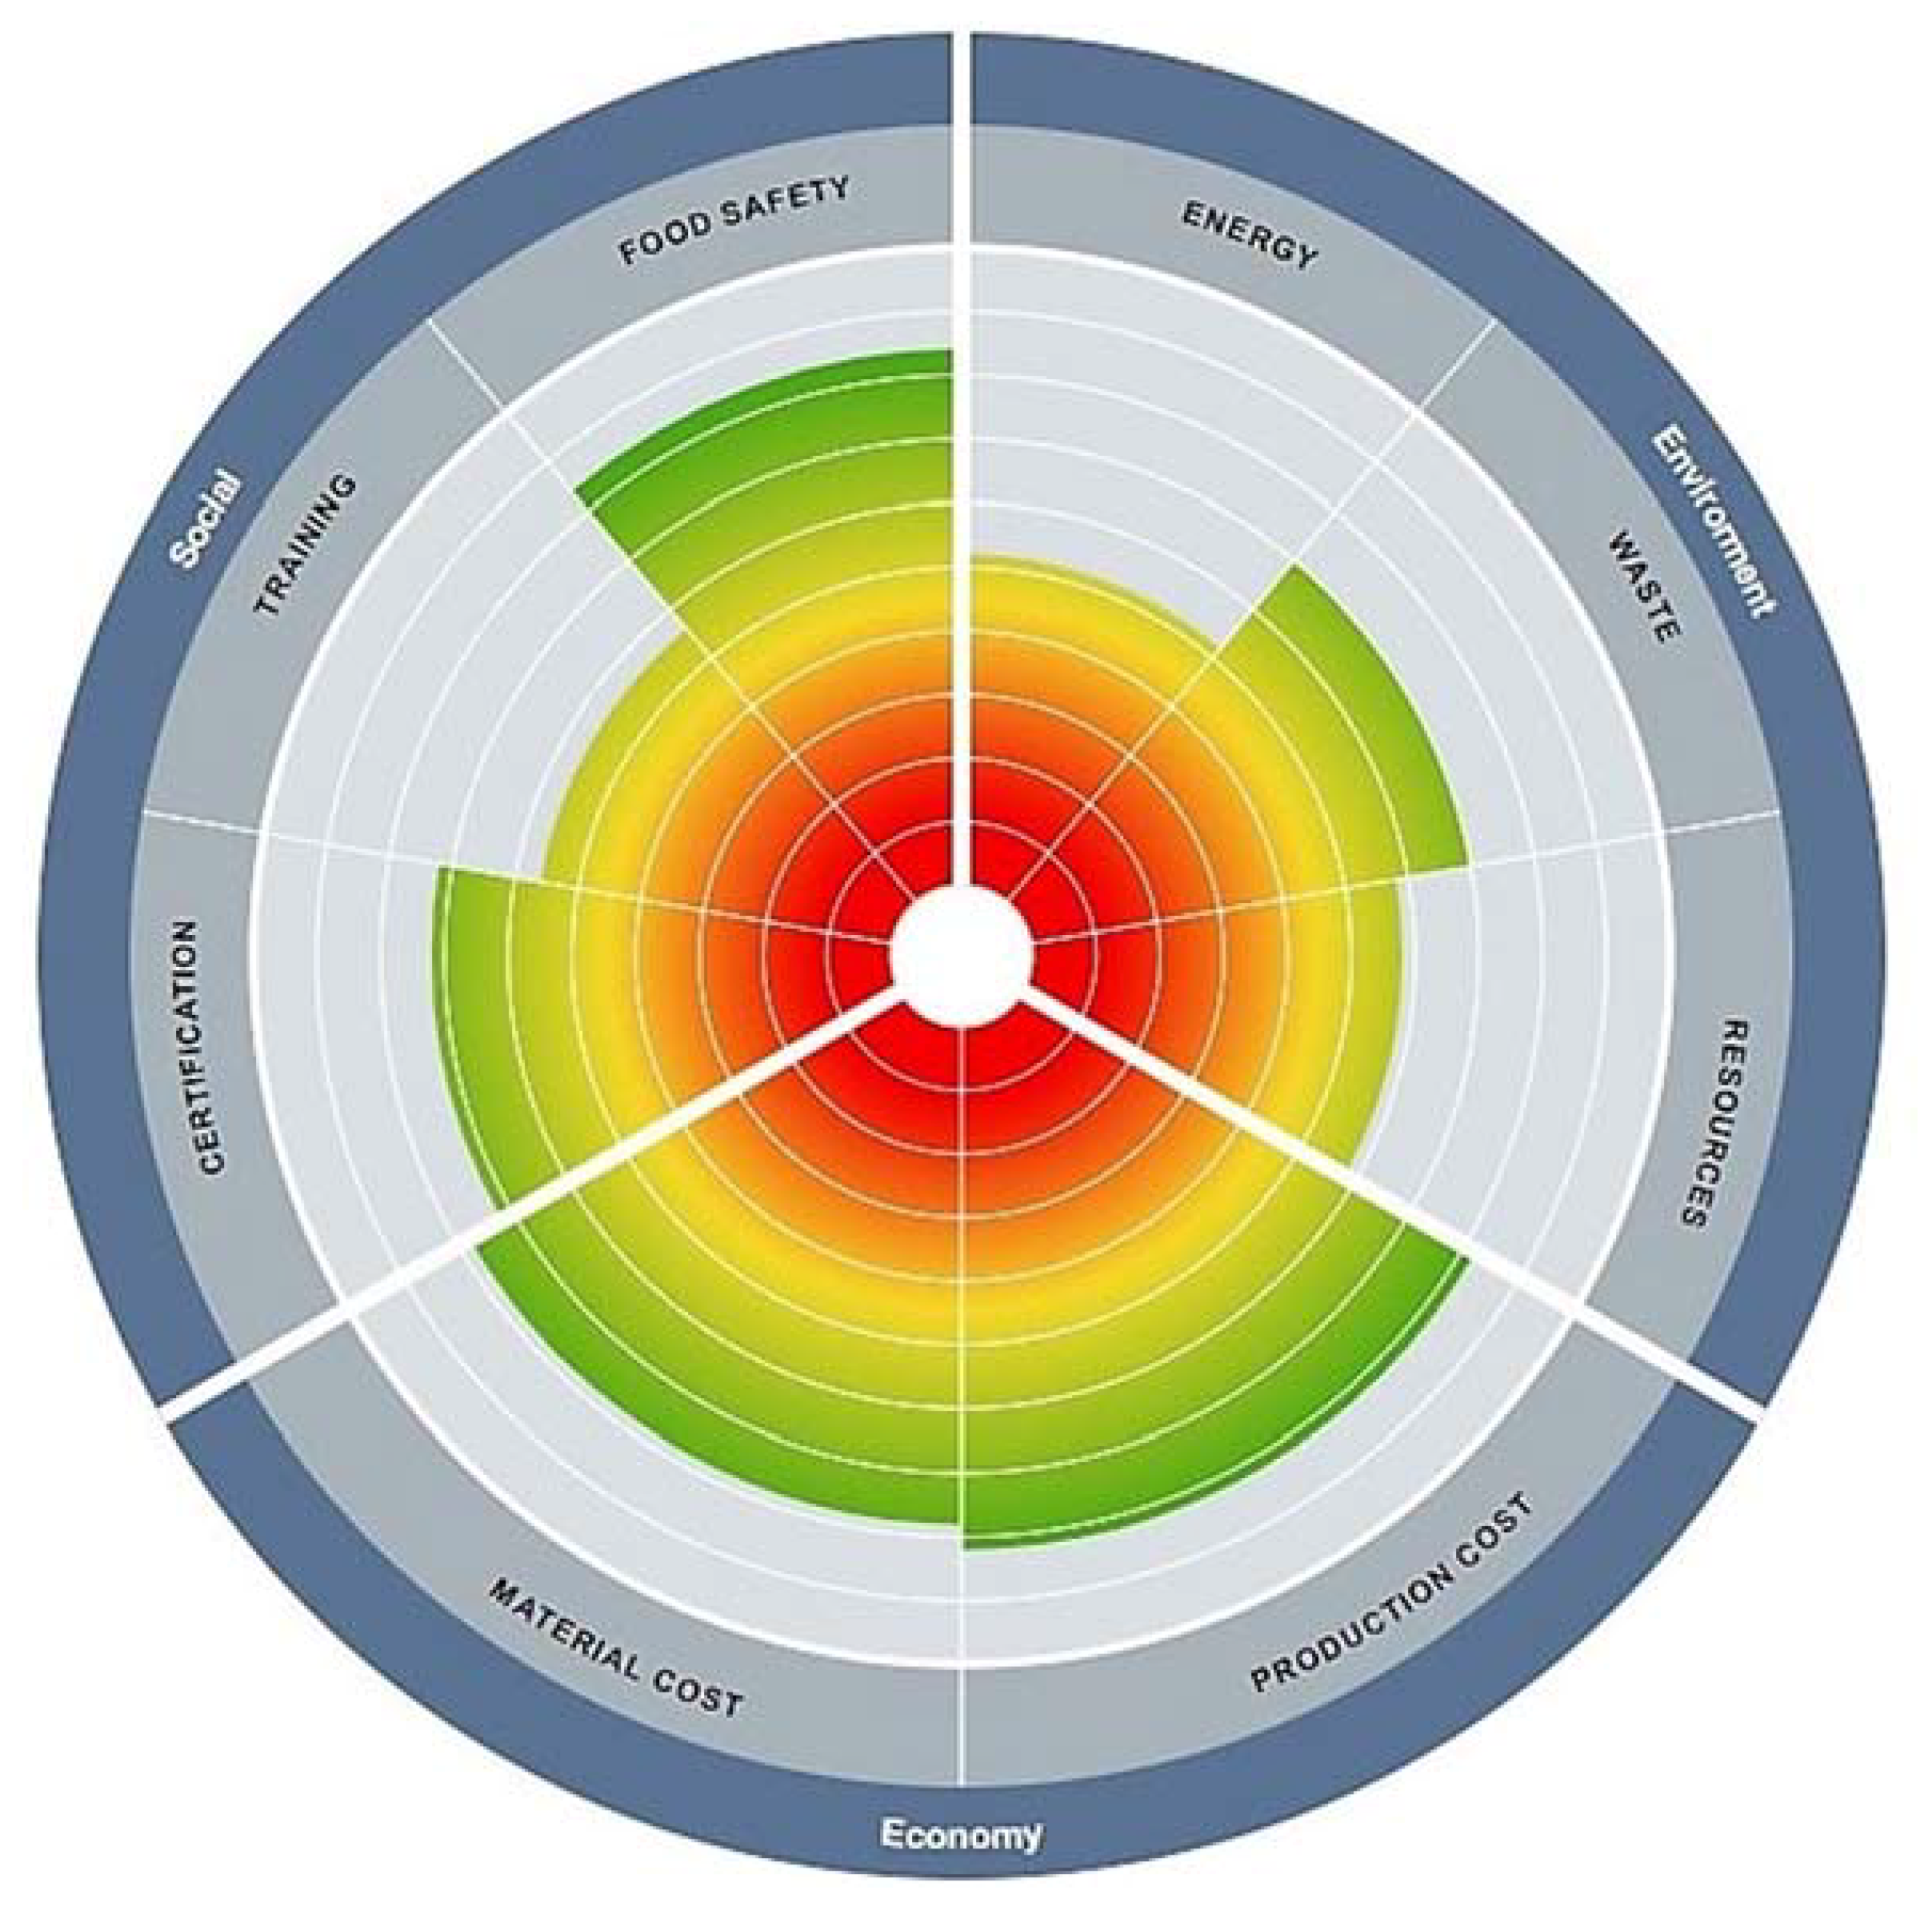
The development of the proposed framework is underpinned by literature evidence and is also verified by the interviewed experts. As mentioned previously, the value assigned to each sustainability performance indicator resulted from the benchmarking of recognized best practices with qualitative answers provided during the semi-structured interviews with executives of the research unit. The benchmarking results per echelon and process of the examined food supply chain are presented in Figure 3, Figure 4 and Figure 5 on the basis of rating the written accounts (i.e., qualitative data retrieved from the interviewed experts’ responses) on a scale between 1.0 and 5.0 (see Section 3.1). The resulting rating constitutes our ‘abstracted representation’ of the respondents’ conceived reality [39], hence entailing a degree of subjectivity as “… nothing becomes data without the intervention of a researcher who takes note—and often makes note—of some things to the exclusion of others” [40]. A high score represents high sustainability performance, while a lower score indicates that more work is required from a sustainability performance perspective. Specifically, there are three grades: (i) low performance, scoring from 1.0 up to 2.5; (ii) average performance, scoring from 2.6 up to 3.5; and (iii) best performance, scoring from 3.6 up to 5.0 (see Section 3.2 and Section 4.1). Respectively, the graph illustration utilizes different colors i.e., red—orange (low performance), yellow—light green (average performance), and green—dark green (best performance). This way, it is straightforward and very easy to understand a specific echelon’s sustainability status at a glance. Further supporting the proposed framework’s added-value with respect to the way that it is communicating its output, we present industry insights from the UK poultry sector assessment—to exemplify our framework—exclusively by three graphs, with one graph per supply chain echelon.
Firstly, Figure 3 demonstrates that the performance of the UK poultry industry in the farming (production) echelon is decent, with an overall average performance of 3.2. In particular, the sector is economically sustainable, with investments being regarded as very satisfactory (score of 3.8) for maintaining the sector’s competitiveness. Additionally, sustainable performance in production and material costs is moderate, with the average performance being equal to 3.5 and 3.6, respectively. Interestingly, environmental performance is not satisfactory in terms of material use and generated waste, with the average scores being 2.6 and 3.0, respectively. Similarly, the performance regarding energy consumption is evaluated as 2.9. Interestingly, considering that the UK national standards body published the world’s first standard on circular economy, namely the ‘BS 8001: 2017: Framework for implementing the principles of the circular economy in organizations’ [41], one would expect that circular economy principles are applied in the poultry sector as it offers many business opportunities, e.g., use of poultry waste for producing protein-rich animal feed varieties. Finally, certification and training are satisfactory, with average scores of 3.0 and 3.3, implying that efforts are required on these aspects.
Secondly, the average sustainability performance of the research unit considering the industrial processing stage is on average equal to 3.5, exhibiting a good performance, mainly with respect to economic indicators and partially on the social side, as demonstrated in Figure 4. From an economic perspective, production and material costs are judged very satisfactory, with a respective ranking of about 4.0. Notable weaknesses are observed at the energy (score of 2.6), resources (score of 2.9), and waste (score of 3.5) dimensions, thus necessitating appropriate interventions. At the social sustainability front, staff training is considered weak, with an average score of 2.8, while performance in terms of certification (score of 3.6) and food safety (score of 4.2) is deemed very good.
Finally, the UK poultry industry, from a retailing perspective, exhibits very good performance, with an overall average rating of 4.1. Figure 5 depicts that the research unit of focus elaborates best practices at economic (i.e., sales—score of 4.0, no-waste optimization—score of 4.5) and social (i.e., charity—score of 4.7, ethical trading—score of 4.3) levels. Nevertheless, interventions are needed for improving energy consumption (score of 3.5) and waste management (score of 3.6).
As illustrated above, one of the major strengths of this research is the visualization of its output: a ‘sustainability snapshot’. For every echelon, at a glance, there is a fully detailed assessment providing both an overview (i.e., triple bottom-line for the echelon’s performance) and specifics for each indicator. Comparing the overall performance among the different supply chain stages, farming (production) and processing seems to score much lower compared to retailing, which is consistent with previous studies [42]. However, the individual comparison of the environmental, economic, and social sustainability performance yields adverse findings: from an economic perspective, all three echelons perform well; environmentally-wise there is a gradation, where retail performs good, processing moderate, and farming (production) poor; socially-wise, only retailing is satisfactory.
6. Conclusions
Sustainable food supply chains constitute an essential aspect of operations management [43]. However, operations management researchers and sustainability-oriented scholars confront challenges in integrating sustainability issues within the traditional supply chain areas of interest [44]. Therefore, stakeholders need to identify and prioritize sustainability issues prior to planning and executing interventions at the related food supply network echelons and then assess the associated performance impact [45]. In this context, this work proposes an easy-to-use framework with a comprehensive and sharp outcome on supply chain sustainability performance assessment. Insights from interviews with C-level executives for the UK poultry industry highlight an adequate sustainability performance with respect to the entire supply chain. A detailed view on different echelons reveals specific areas that could be improved, such as the environmental performance at both farming (production) and processing levels. In particular, the sustainability performance assessment enabled by the proposed framework is multi-faceted owing to the utilization of a range of diverse indicators, in line with recommendations by experts in the European and international food industry [46].
The contribution of the current work relies on both the origin of the data and the visualization/presentation of the output. With respect to the first, the vast majority of existing sustainability assessment tools/methodologies are based on secondary databases with obsolete entries (e.g., 10–15 years old in most of the LCA-focused tools); also, these approaches usually fail to capture the sustainability impact of technological advancements across the supply network. Thus, drawing conclusions on the understanding of C-level executives provides a more timely and authentic assessment reflecting the views and needs of a specific industry or organizational unit. Regarding the latter point, interpretation and understanding of sustainability performance is challenging. Most of the reviewed methodologies result in an output that requires both a technical background and time-consuming analysis to make insightful inferences. On the other hand, the proposed ‘sustainability snapshot’ requires neither technical-based explanation nor additional information.
Overall, the proposed framework is anticipated to assist researchers and practitioners alike in the design and planning of sustainable food networks through selecting appropriate management policies, corresponding to the proposed triple helix index, prior to their implementation. This framework could then inform quantitative analysis methods for assessing future technology and regulatory-based intervention scenarios in terms of the resulting sustainability impact [45]. Implications on a managerial and policy-making level are based on the easy, fast, and accurate input regarding the sustainability performance assessment.
In conducting this study, some limitations exist which provide motivating grounds for expanding our research horizons. In particular, considering that our findings are based exclusively on executives’ viewpoint, any generalization of the results should be considered to this effect. Additionally, in our framework, we only assess sustainable performance in three echelons of food supply network operations, namely farming (production), processing, and retailing, while transportation and distribution are neglected. However, transportation and distribution operations can have a significant impact on the sustainability performance of food networks in terms of food losses and waste. To that end, in today’s digital supply chain discourse, the assessment of the technology adoption level, especially of the Internet of Things, across end-to-end food network functions, has to be included in order to ensure value delivery to consumers [47]. Finally, a degree of subjectivity can be attributed during the quantitizing analysis process which is elaborated in this research to interpret and apprehend the retrieved qualitative data.
Regarding future research directions, we aim to demonstrate the applicability of the proposed framework to other food industry sectors. This research could promote the development of a novel methodology for sustainability assessment across diverse supply chains in the food industry, both horizontally (e.g., meat, dairy, fish chains) and vertically (e.g., organic and non-organic agrifood chains). We also aspire to extend our framework and incorporate the impact of inter-firm collaboration considering that efficient information flows are documented as essential for revealing long-term sustainability opportunities [48]. Finally, identifying further assessment areas that specifically capture time-sensitive information about perishable commodities could ensure sustainability efficiency and unveil additional research areas regarding standardization of digital information systems and data sharing among network stakeholders [49].
Author Contributions
F.A. and J.S.S. conceived the general idea of the paper; N.T. designed the research methodology; N.T. and F.A. designed the framework; F.A. conducted the interviews; All authors analysed and discussed the results; N.T. and F.A. wrote the paper.
Funding
This research was funded by the EPSRC under Reference No. EP/K02888X/1, Project Title: “Engineering Driven Sustainable Supply Networks—A UK/India Collaborative Study”, and the BBSRC under Reference No. BB/P027970/1, Project Title: “Transforming India’s Green Revolution by Research and Empowerment for Sustainable food Supplies”.
Conflicts of Interest
The authors declare no conflict of interest.
References
- Esfahbodi, A.; Zhang, Y.; Watson, G.; Zhang, T. Governance pressures and performance outcomes of sustainable supply chain management—An empirical analysis of UK manufacturing industry. J. Clean. Prod. 2017, 155, 66–78. [Google Scholar] [CrossRef]
- Food and Agriculture Organization of the United Nations (FAO). How to Feed the World in 2050; FAO: Rome, Italy, 2009. [Google Scholar]
- Govindan, K. Sustainable consumption and production in the food supply chain: A conceptual framework. Int. J. Prod. Econ. 2018, 195, 419–431. [Google Scholar] [CrossRef]
- Tsolakis, N.K.; Keramydas, C.A.; Toka, A.K.; Aidonis, D.A.; Iakovou, E.T. Agrifood supply chain management: A comprehensive hierarchical decision-making framework and a critical taxonomy. Biosyst. Eng. 2014, 120, 47–64. [Google Scholar] [CrossRef]
- Schmitt, E.; Galli, F.; Menozzi, D.; Maye, D.; Touzard, J.-M.; Marescotti, A.; Six, J.; Brunori, G. Comparing the sustainability of local and global food products in Europe. J. Clean. Prod. 2017, 165, 346–359. [Google Scholar] [CrossRef]
- Trott, P.; Simms, C. An examination of product innovation in low- and medium-technology industries: Cases from the UK packaged food sector. Res. Policy 2017, 46, 605–623. [Google Scholar] [CrossRef]
- Government Office for Science. Foresight (Program). Global Food and Farming Futures Project: Synthesis Report C12, Meeting the Challenges of a Low-Emissions World. URN 11/632; Government Office for Science: London, UK, 2011.
- The Waste and Resources Action Programme (WRAP). Estimates of Food Surplus and Waste Arisings in the UK; WRAP: Banbury, UK, 2017. [Google Scholar]
- Tsolakis, N.K.; Srai, J.S. A System Dynamics approach to food security through smallholder farming in the UK. Chem. Eng. Trans. 2017, 57, 2023–2028. [Google Scholar] [CrossRef]
- Brandenburg, M.; Govindan, K.; Sarkis, J.; Seuring, S. Quantitative models for sustainable supply chain management: Developments and directions. Eur. J. Oper. Res. 2014, 233, 299–312. [Google Scholar] [CrossRef]
- Liedtke, C.; Baedeker, C.; Kolberg, S.; Lettenmeier, M. Resource intensity in global food chains: The Hot Spot Analysis. Br. Food J. 2010, 112, 1138–1159. [Google Scholar] [CrossRef]
- Hassini, E.; Surti, C.; Searcy, C. A literature review and a case study of sustainable supply chains with a focus on metrics. Int. J. Prod. Econ. 2012, 140, 69–82. [Google Scholar] [CrossRef]
- Lawrence, F.; Wasley, A.; Ciorniciuc, R. Revealed: The Dirty Secret of the UK’s Poultry Industry. The Guardian, 2014. Available online: https://www.theguardian.com/world/2014/jul/23/-sp-revealed-dirty-secret-uk-poultry-industry-chicken-campylobacter (accessed on 18 July 2018).
- BBC. Eggs Scandal: 700,000 Sent to UK but Risk Is ‘Unlikely’; British Broadcasting Corporation: London, UK, 2017; Available online: http://www.bbc.co.uk/news/world-europe-40889414 (accessed on 18 July 2018).
- Li, D.; Wang, X.; Chan, H.K.; Manzini, R. Sustainable food supply chain management. Int. J. Prod. Econ. 2014, 152, 1–8. [Google Scholar] [CrossRef]
- Kirwan, J.; Maye, D.; Brunori, G. Acknowledging complexity in food supply chains when assessing their performance and sustainability. J. Rural Stud. 2017, 52, 21–32. [Google Scholar] [CrossRef]
- Gerbens-Leenes, P.W.; Moll, H.C.; Schoot Uiterkamp, A.J.M. Design and development of a measuring method for environmental sustainability in food production systems. Ecol. Econ. 2003, 46, 231–248. [Google Scholar] [CrossRef]
- Bourlakis, M.; Maglaras, G.; Aktas, E.; Gallear, D.; Fotopoulos, C. Firm size and sustainable performance in food supply chains: Insights from Greek SMEs. Int. J. Prod. Econ. 2014, 152, 112–130. [Google Scholar] [CrossRef]
- Egilmez, G.; Kucukvar, M.; Tatari, O.; Bhutta, M.K.S. Supply chain sustainability assessment of the U.S. Food manufacturing sectors: A life cycle-based frontier approach. Resour. Conserv. Recycl. 2014, 82, 8–20. [Google Scholar] [CrossRef]
- Martindale, W. Using consumer surveys to determine food sustainability. Br. Food J. 2014, 116, 1194–1204. [Google Scholar] [CrossRef]
- Beske, P.; Land, A.; Seuring, S. Sustainable supply chain management practices and dynamic capabilities in the food industry: A critical analysis of the literature. Int. J. Prod. Econ. 2014, 152, 131–143. [Google Scholar] [CrossRef]
- Van der Goot, A.J.; Pelgrom, P.J.M.; Berghout, J.A.M.; Geerts, M.E.J.; Jankowiak, L.; Hardt, N.A.; Keijer, J.; Schutyser, M.A.I.; Nikiforidis, C.V.; Boom, R.M. Concepts for further sustainable production of foods. J. Food Eng. 2016, 168, 42–51. [Google Scholar] [CrossRef]
- Manning, L.; Soon, J.M. Development of sustainability indicator scoring (SIS) for the food supply chain. Brit. Food J. 2016, 118, 2097–2125. [Google Scholar] [CrossRef] [Green Version]
- Marimon, F.; del Mar Alonso-Almeida, M.; del Pilar Rodríguez, M.; Cortez Alejandro, K.A. The worldwide diffusion of the global reporting initiative: What is the point? J. Clean. Prod. 2012, 33, 132–144. [Google Scholar] [CrossRef]
- Gasso, V.; Oudshoorn, F.W.; de Olde, E.; Sørensen, C.A.G. Generic sustainability assessment themes and the role of context: The case of Danish maize for German biogas. Ecol. Indic. 2015, 49, 143–153. [Google Scholar] [CrossRef]
- Martínez-Blanco, J.; Lehmann, A.; Muñoz, P.; Antón, A.; Traverso, M.; Rieradevall, J.; Finkbeiner, M. Application challenges for the social life cycle assessment of fertilizers within life cycle sustainability assessment. J. Clean. Prod. 2014, 69, 34–48. [Google Scholar] [CrossRef]
- Prado-Lorenzo, J.-M.; Gallego-Alvarez, I.; Garcia-Sanchez, I.M. Stakeholder engagement and corporate social responsibility reporting: The ownership structure effect. Corp. Soc. Responsib. Environ. Manag. 2009, 16, 94–107. [Google Scholar] [CrossRef]
- Schadewitz, H.; Niskala, M. Communication via responsibility reporting and its effect on firm value in Finland. Corp. Soc. Responsib. Environ. Manag. 2010, 17, 96–106. [Google Scholar] [CrossRef]
- Lozano, R.; Huisingh, D. Inter-linking issues and dimensions in sustainability reporting. J. Clean. Prod. 2011, 19, 99–107. [Google Scholar] [CrossRef]
- Food and Agriculture Organization of the United Nations (FAO). SAFA—Sustainability Assessment of Food and Agriculture Systems. Guidelines Version 3.0; FAO: Rome, Italy, 2013. [Google Scholar]
- De Olde, E.M.; Bokkers, E.A.M.; de Boer, I.J.M. The choice of the sustainability assessment tool matters: Differences in thematic scope and assessment results. Ecol. Econ. 2017, 136, 77–85. [Google Scholar] [CrossRef]
- Siebert, A.; Bezama, A.; O’Keeffe, S.; Thrän, D. Social life cycle assessment indices and indicators to monitor the social implications of wood-based products. J. Clean. Prod. 2018, 172, 4074–4084. [Google Scholar] [CrossRef]
- Sandelowski, M.; Voils, C.I.; Knafl, G. On Quantitizing. J. Mix. Method Res. 2009, 3. [Google Scholar] [CrossRef] [PubMed]
- Boyatzis, R.E. Transforming Qualitative Information: Thematic Analysis and Code Development; Sage Publications: Thousand Oaks, CA, USA, 1998; ISBN 9780761909613. [Google Scholar]
- Onwuegbuzie, A.J.; Teddlie, C. A framework for analyzing data in mixed methods research. In Handbook of Mixed Methods in Social & Behavioral Research; Tashakkori, A., Teddlie, C., Eds.; Sage Publications: Thousand Oaks, CA, USA, 2003; Chapter 13; pp. 351–383. ISBN 9780761920731. [Google Scholar]
- Tufte, E. Beautiful Evidence; Graphics Press: Cheshire, CT, USA, 2006; p. 129. ISBN 9780961392178. [Google Scholar]
- Mol, A.; Law, J. Complexities: An introduction. In Complexities: Social Studies of Knowledge Practices; Law, J., Mol, A., Eds.; Duke University Press: Durham, NC, USA, 2002; pp. 1–22. ISBN 9780822328469. [Google Scholar]
- Gubrium, J.F.; Holstein, J.A. The New Language of Qualitative Method; Oxford University Press: New York, NY, USA, 1997; ISBN 9780195099942. [Google Scholar]
- Valsiner, J. Data as representations: Contextualizing qualitative and quantitative research strategies. Soc. Sc. Inform. 2000, 39, 99–113. [Google Scholar] [CrossRef]
- Wolcott, H.F. Transforming Qualitative Data: Description, Analysis, and Interpretation; Sage Publications: Thousand Oaks, CA, USA, 1994; ISBN 9780803952812. [Google Scholar]
- British Standards Institution. BS 8001:2017—Framework for Implementing the Principles of the Circular Economy in Organizations. Guide; British Standards Institution: London, UK, 2017. [Google Scholar]
- Yakovleva, N. Measuring the sustainability of the food supply chain: A case study of the UK. J. Environ. Pol. Plan. 2007, 9, 75–100. [Google Scholar] [CrossRef]
- Rajeev, A.; Pati, R.K.; Padhi, S.S.; Govindan, K. Evolution of sustainability in supply chain management: A literature review. J. Clean. Prod. 2017, 162, 299–314. [Google Scholar] [CrossRef]
- Boström, M.; Jönsson, A.M.; Lockie, S.; Mol, A.P.J.; Oosterveer, P. Sustainable and responsible supply chain governance: Challenges and opportunities. J. Clean. Prod. 2015, 107, 1–7. [Google Scholar] [CrossRef]
- Tsolakis, N.; Srai, J.S.; Aivazidou, E. Blue water footprint management in a UK poultry supply chain under environmental regulatory constraints. Sustainability 2018, 10, 625. [Google Scholar] [CrossRef]
- Di Masso, M.; Gamboa, G.; Mingorría, S.; Giampietro, M. GLAMUR WP5 Integrated Assessment Report (Deliverable 5.1); Institute of Environmental Science and Technology—Autonomous University of Barcelona: Barcelona, Spain, 2016. [Google Scholar]
- Pal, A.; Kant, K. IoT-based sensing and communications infrastructure for the fresh food supply chain. Computer 2018, 51, 76–80. [Google Scholar] [CrossRef]
- Anastasiadis, F.; Poole, N. Emergent supply chains in the agrifood sector: Insights from a whole chain approach. Supply Chain Manag. 2015, 20, 353–368. [Google Scholar] [CrossRef]
- Kant, K.; Pal, A. Internet of perishable logistics. IEEE Internet Comput. 2017, 21, 22–31. [Google Scholar] [CrossRef]
Figure 1.
Flowchart of the research methodology.

Figure 2.
Framework for food supply chain sustainability assessment.
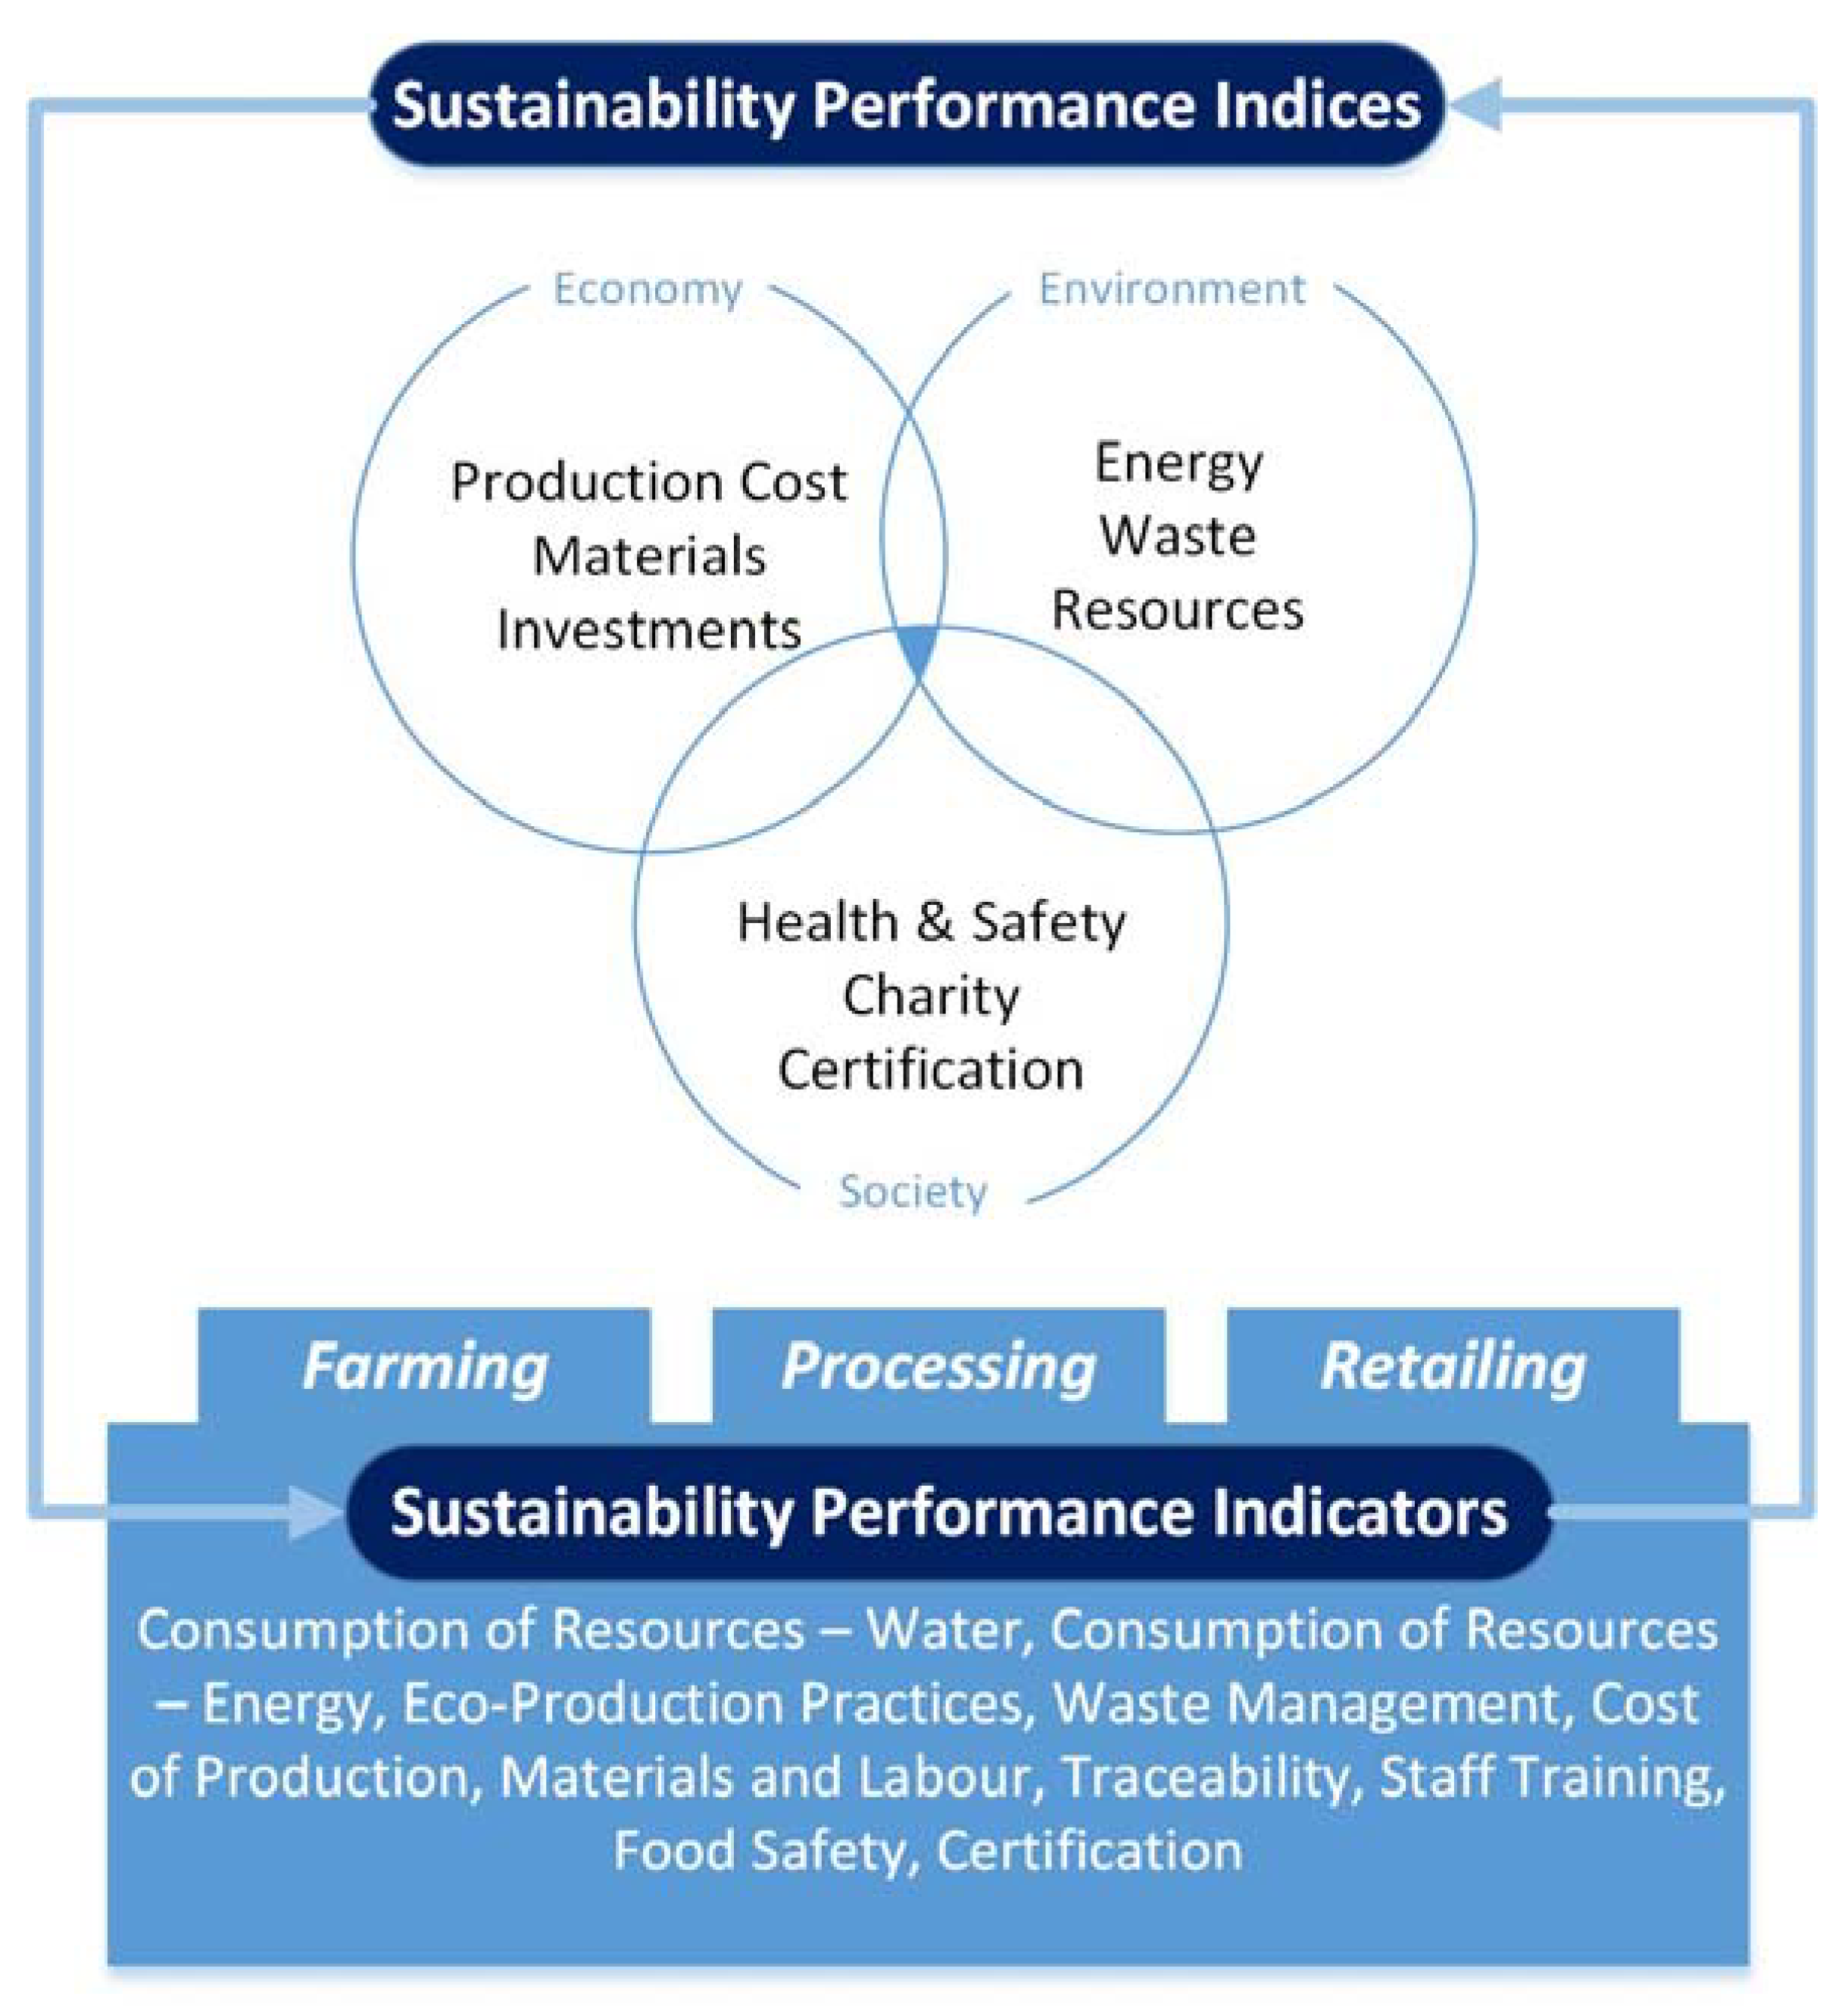
Figure 3.
Sustainability assessment of the “UK Poultry Industry”—Farming (production) echelon.

Figure 4.
Sustainability assessment of the “UK Poultry Industry”—Processing echelon.

Figure 5.
Sustainability assessment of the “UK Poultry Industry”—Retailing echelon.


Table 1.
Taxonomy of major sustainability performance evaluation indicators.
| Food Supply Chain Echelon | ||||
|---|---|---|---|---|
| Farming (Production) | Processing | Retailing | ||
| Sustainability Pillar | Environmental | Consumption of Resources—Water | Packaging (materials, quantity) | Inventory Cycles, Inventory Management |
| Consumption of Resources—Energy | Consumption of Resources—Water | Defective Orders, Waste Management | ||
| Eco-Production Practices | Consumption of Resources—Energy | Consumption of Resources—Energy | ||
| Waste Management | Waste Management | Satisfaction Level (backorders, delays) | ||
| Economic | Farm Income | Cost of Production, Materials and Labor | Utilization Order, Administration Cost | |
| Investments | Traceability | Sales | ||
| Social | Certification | Staff Training | Food Safety Charity | |
| Farmers’ Training | Food Safety | Traceability | ||
| Exclusive Suppliers | Certification | Ethical Trading | ||
© 2018 by the authors. Licensee MDPI, Basel, Switzerland. This article is an open access article distributed under the terms and conditions of the Creative Commons Attribution (CC BY) license (http://creativecommons.org/licenses/by/4.0/).
Share and Cite
MDPI and ACS Style
Tsolakis, N.; Anastasiadis, F.; Srai, J.S. Sustainability Performance in Food Supply Networks: Insights from the UK Industry. Sustainability 2018, 10, 3148. https://doi.org/10.3390/su10093148
AMA Style
Tsolakis N, Anastasiadis F, Srai JS. Sustainability Performance in Food Supply Networks: Insights from the UK Industry. Sustainability. 2018; 10(9):3148. https://doi.org/10.3390/su10093148
Chicago/Turabian StyleTsolakis, Naoum, Foivos Anastasiadis, and Jagjit Singh Srai. 2018. "Sustainability Performance in Food Supply Networks: Insights from the UK Industry" Sustainability 10, no. 9: 3148. https://doi.org/10.3390/su10093148
Note that from the first issue of 2016, this journal uses article numbers instead of page numbers. See further details here.