Article

Railway Freight Transport and Logistics: Methods for Relief, Algorithms for Verification and Proposals for the Adjustment of Tunnel Inner Surfaces

1
Department of Civil, Construction and Environmental Engineering, Sapienza University of Rome, 00184 Rome, Italy
2
ETS (Engineering Through Science) Ingegneria, Via Appia Nuova, 59 00183 Roma, Italy
*
Author to whom correspondence should be addressed.
Sustainability 2018, 10(9), 3145; https://doi.org/10.3390/su10093145
Submission received: 10 July 2018 / Revised: 24 August 2018 / Accepted: 31 August 2018 / Published: 3 September 2018
(This article belongs to the Section Sustainable Transportation)

Abstract

:
In Europe, the attention to efficiency and safety of international railway freight transport has grown in recent years and this has drawn attention to the importance of verifying the clearance between vehicle and lining, mostly when different and variable rolling stock types are expected. This work consists of defining an innovative methodology, with the objective of surveying the tunnel structures, verifying the clearance conditions, and designing a retrofitting work if necessary. The method provides for the use of laser scanner, thermocameras, and ground penetrating radar to survey the geometrical and structural conditions of the tunnel; an algorithm written by the authors permits to verify the clearances. Two different types of works are possible if the inner tunnel surfaces interfere with the profile of the rolling stock passing through: modification of the railroad track or modification of the tunnel intrados by mean milling of its lining. The presented case study demonstrates that the proposed methodology is useful for verifying compatibility between the design vehicle gauge and the existing tunnel intrados, and to investigate the chance to admit rolling stocks from different states. Consequently, the results give the railway management body a chance to perform appropriate measurements in those cases where the minimum clearance requirements are not achieved.

1. Introduction

Rail transport involves a guided system dictated by the track structure. The rail track is a layered system composed of the permanent way and the formation [1]. Mechanical and physical characteristics of materials affect the design of the railway track structure [2], but many variables should be considered for designing and managing a railway tunnel. Indeed, several constraints, arising from both the presence of the train system and the morphology of the surrounding environment, should be analyzed [3]. Many issues should be considered to verify the operation of the scheduled transport system and ensure the performance in complete safety. The loading gauge with the sum of the clearance (structure gauge) shall be verified against the existing tunnel inner surfaces. The verification of the clearance between train and tunnel profiles which ensures safe movements underneath the structure. The amount of clearance between the loading gauge and the structure gauge depends on the speed of the train.
This issue is strictly current as a consequence of the liberalization of the European railway sector so the size of the rolling stock can increase to allow the best performances of the freight trains. Indeed, the full opening of the rail freight and passenger transport to any operator requires proper and extensive investigation along the route respect to geometrical, functional and economic issues [4]. As regard as the geometrical issue, the loading gauge has been defined for each national line at its design phase. Therefore, the interconnection of passenger and freight lines requires the definition and verification of standards necessary for circulating [5]. Particularly, the European Regulation EU 913/2000 established nine international market-oriented European corridors to enhance and facilitate rail freight transport [6]. Their implementation remains unsatisfactory [7,8], but on the other hand it cannot be built without verification of existing infrastructures, as confirmed by the European Standard EN 15273-3 [9], which refers to structure gauges. Indeed, the running together of high speed, high traffic intensity, combined passengers and dangerous goods freight transportation, even within long tunnels, could lead to unacceptable levels of risk. Therefore, the rail system should be verified respect to the defined safety target [10] and general improvement in rail freight should be achieved. To ascertain this, it is necessary to collect detailed technical information to achieve the best and fastest results with the lowest possible time and costs [11]. As is the case for construction phase [12], the whole tunnel intrados should be investigated to know the inner geometry of its surfaces: the laser scanner (LS) technology permits to investigate both the roof and the profile of the wall using automated systems [13,14,15], while the ground penetrating radar (GPR) technology permits to monitor the railway platform profile [16].
Technical benefits of LS relief respect to the total station are [17,18]:
  • LS allows downstream upgrading of points of interest;
  • the acquisition process is automatic and not subjected to error by the operator;
  • data capture times are considerably lower and therefore also the on-site downtime of operators is reduced, ensuring human health and economic savings;
  • Global Positioning System (GPS), inclinometer and compass are integrated in the LS and give information about its position;
  • LS provides a complete three-dimensional model and extraction of metric and constructive details [19].
In addition to the exposed technical advantages, the use of LS positively affects logistics (it is light and manageable, it reduces or even eliminates costs for site return), operating mode (stand-alone solution, simplicity, and direct control of instrument) and timing of relief (rapid acquisition, up to 2.5 km/h, and wide angle of view). On the other hands, LS requires an incidence angle not less than 20° to obtain reliable results, therefore it can measure only up to 20 m in length of the tunnel from a station, while a total station can measure up to 100 m in length from the same station; positioning of a LS is more constrained than that of a total station; points clouds from different reliefs cannot be compared or connected.
The GPR technique enables non-destructive and non-invasive detection and location of buried objects using the phenomenon of electromagnetic wave reflection [20,21]: it allows the railway platform investigation. The soil introspection is based on the ability of the instrument to emit radiofrequency signals and to record echoes re-radiated by objects present in the subsoil, characterized by sufficient size and electromagnetic properties different from the surrounding environment.
The results from reliefs superimposed to the expected loading gauge highlight any gaps in clearance. If the inner surfaces of a railway tunnel interfere with the profile of the rolling stock passing through, two different works are possible:
  • the change of the tunnel intrados locally by mean milling of its lining;
  • the variation of the track geometry, in particular the gradient, to increase the inner tunnel surface.
Whichever the measures of clearance defect and of lining thickness are, one or the other method is adopted. The first alternative is possible only when the defect of clearance is at most half of the lining thickness, otherwise, the structure would be excessively weakened. Overall, the Italian experience to date has shown that it is possible to erase not more than half lining thickness locally without compromising the lining stability.
The second alternative is doable when the tunnel is almost in straight track or in the presence of only one curve with a large radius.
The paper presents a methodology to survey the tunnel lining using LS and GPR, to prove compatibility of loading gauges with existing tunnels, and, if necessary, to adapt the tunnel intrados to the selected vehicle gauge. The methodology proposed in this study has been applied to an Italian railway tunnel. The obtained results have shown the need for intervention, designed taking into account the longitudinal distribution of gaps in clearance and the characters of the existing lining. The method allows the rail infrastructure managers to implement appropriate strategies to achieve requirements laid by the Union Internationale des Chemins de fer balancing often conflicting safety and liberalization objectives (especially considering also different national standards) [22].

2. Methods

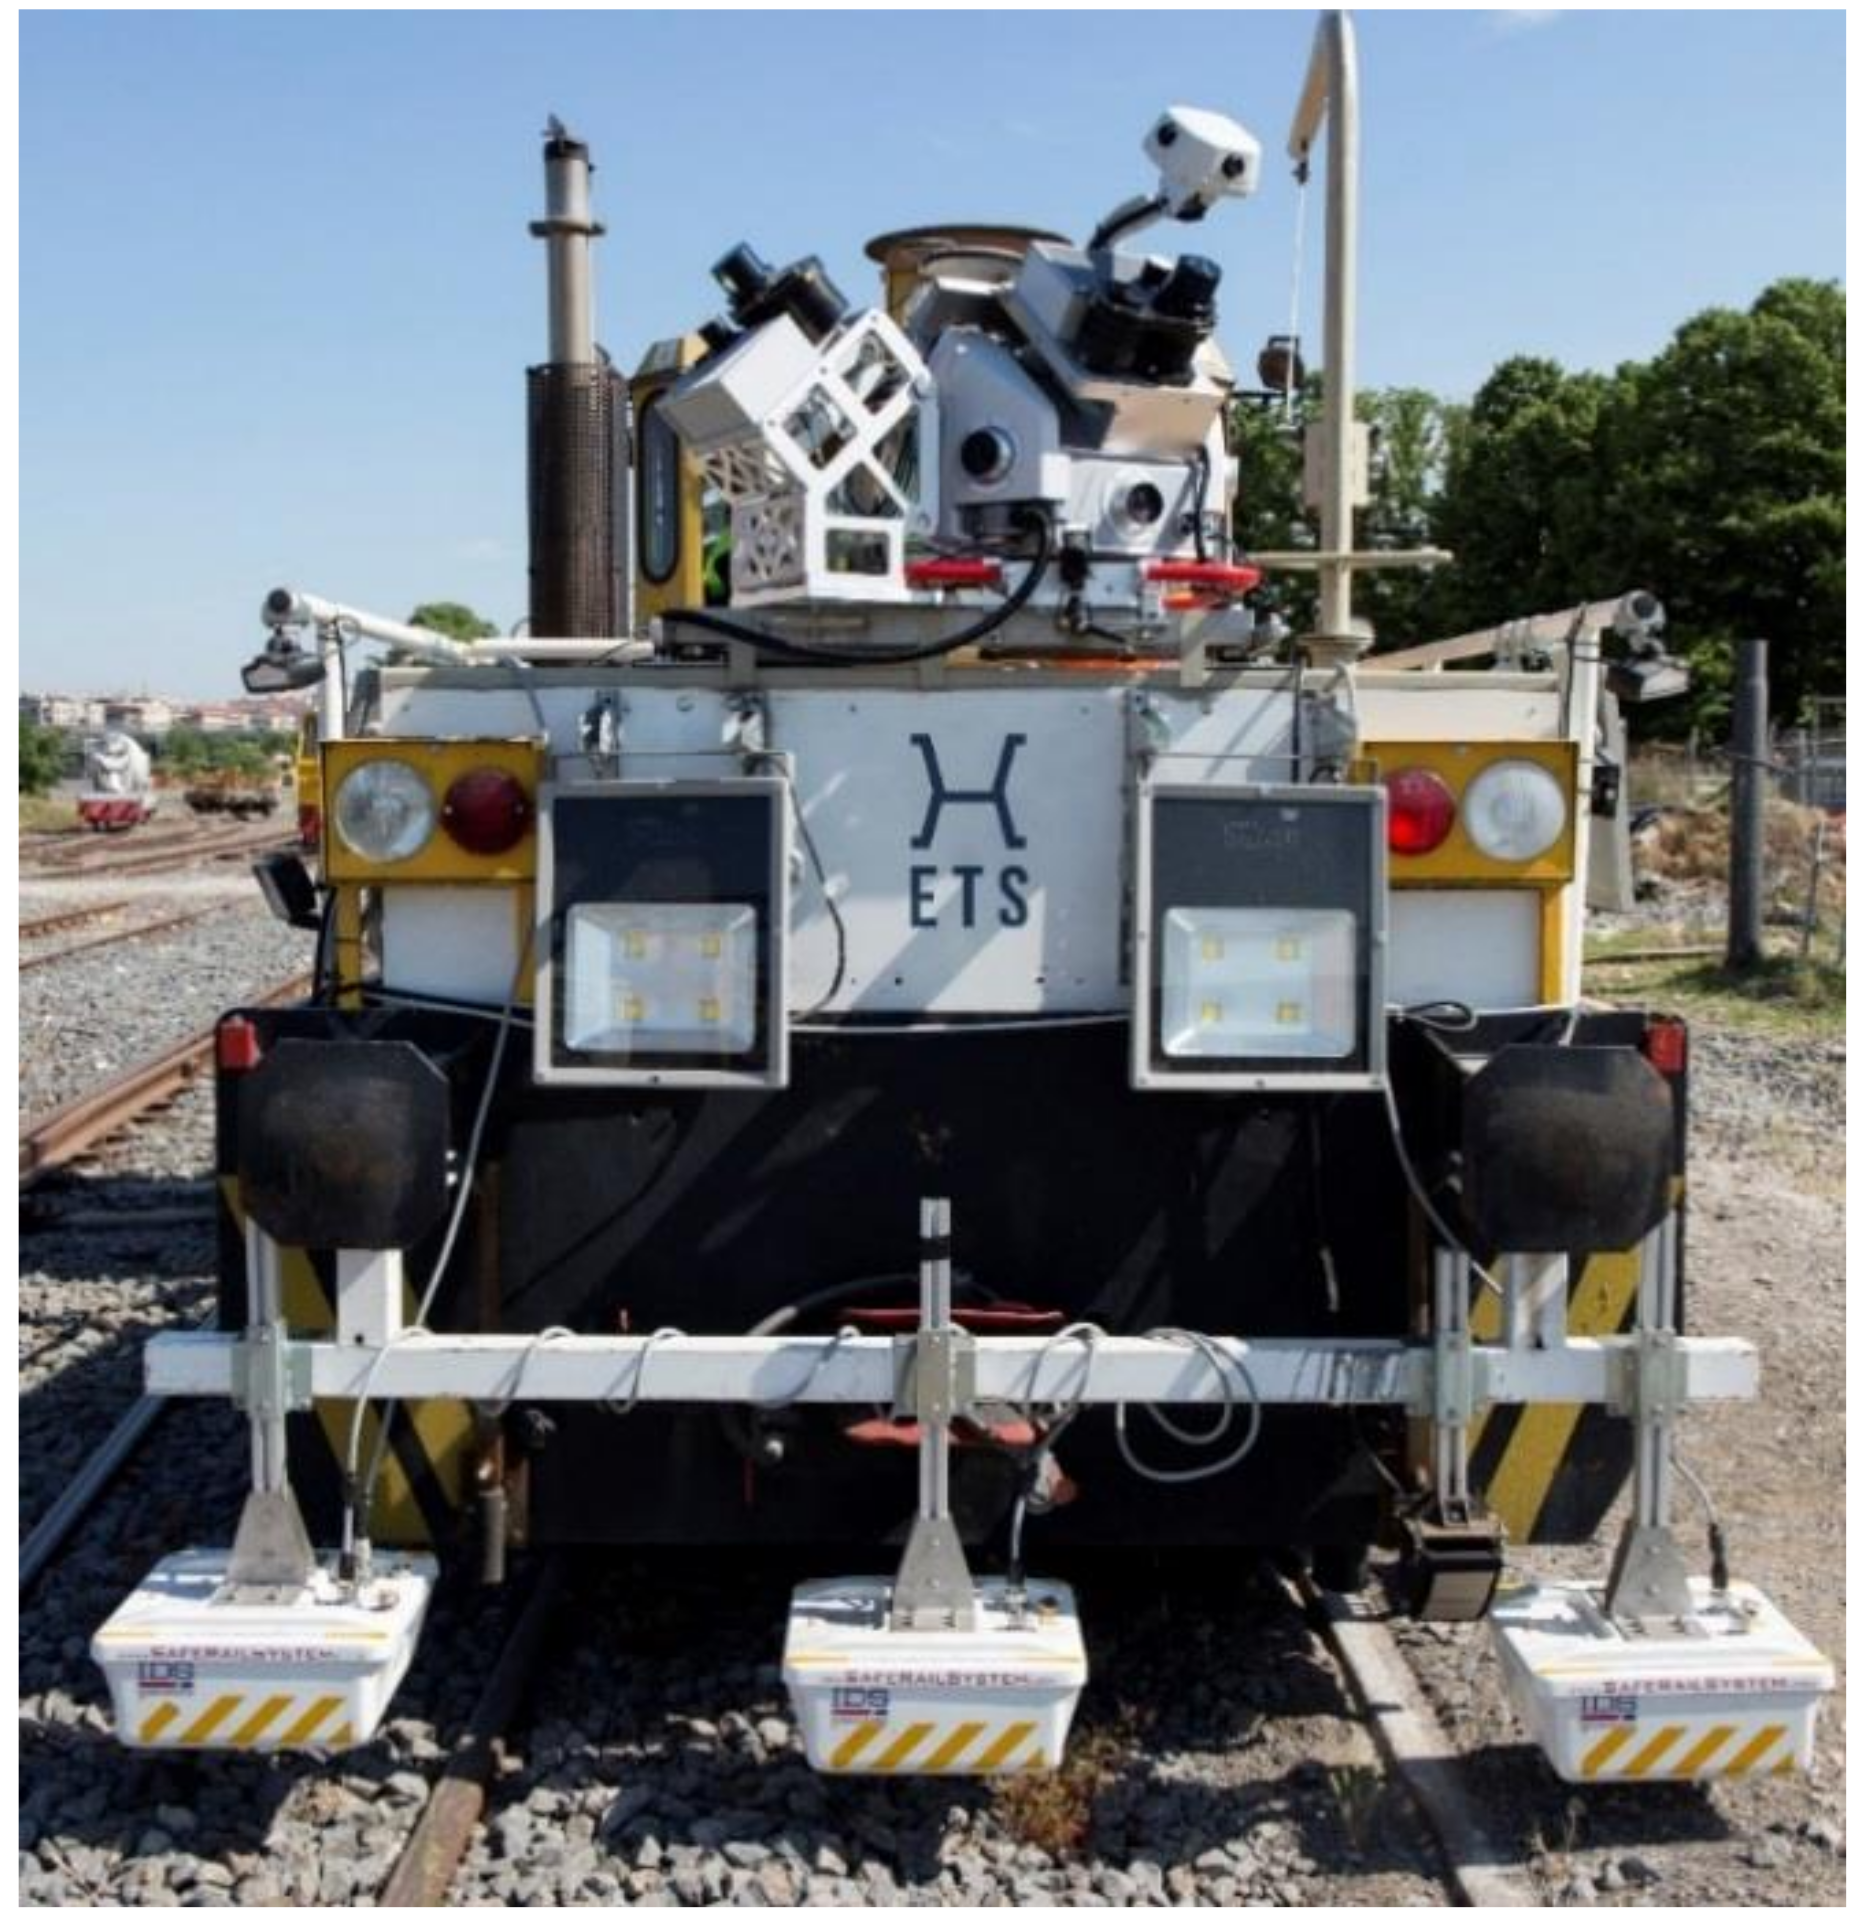
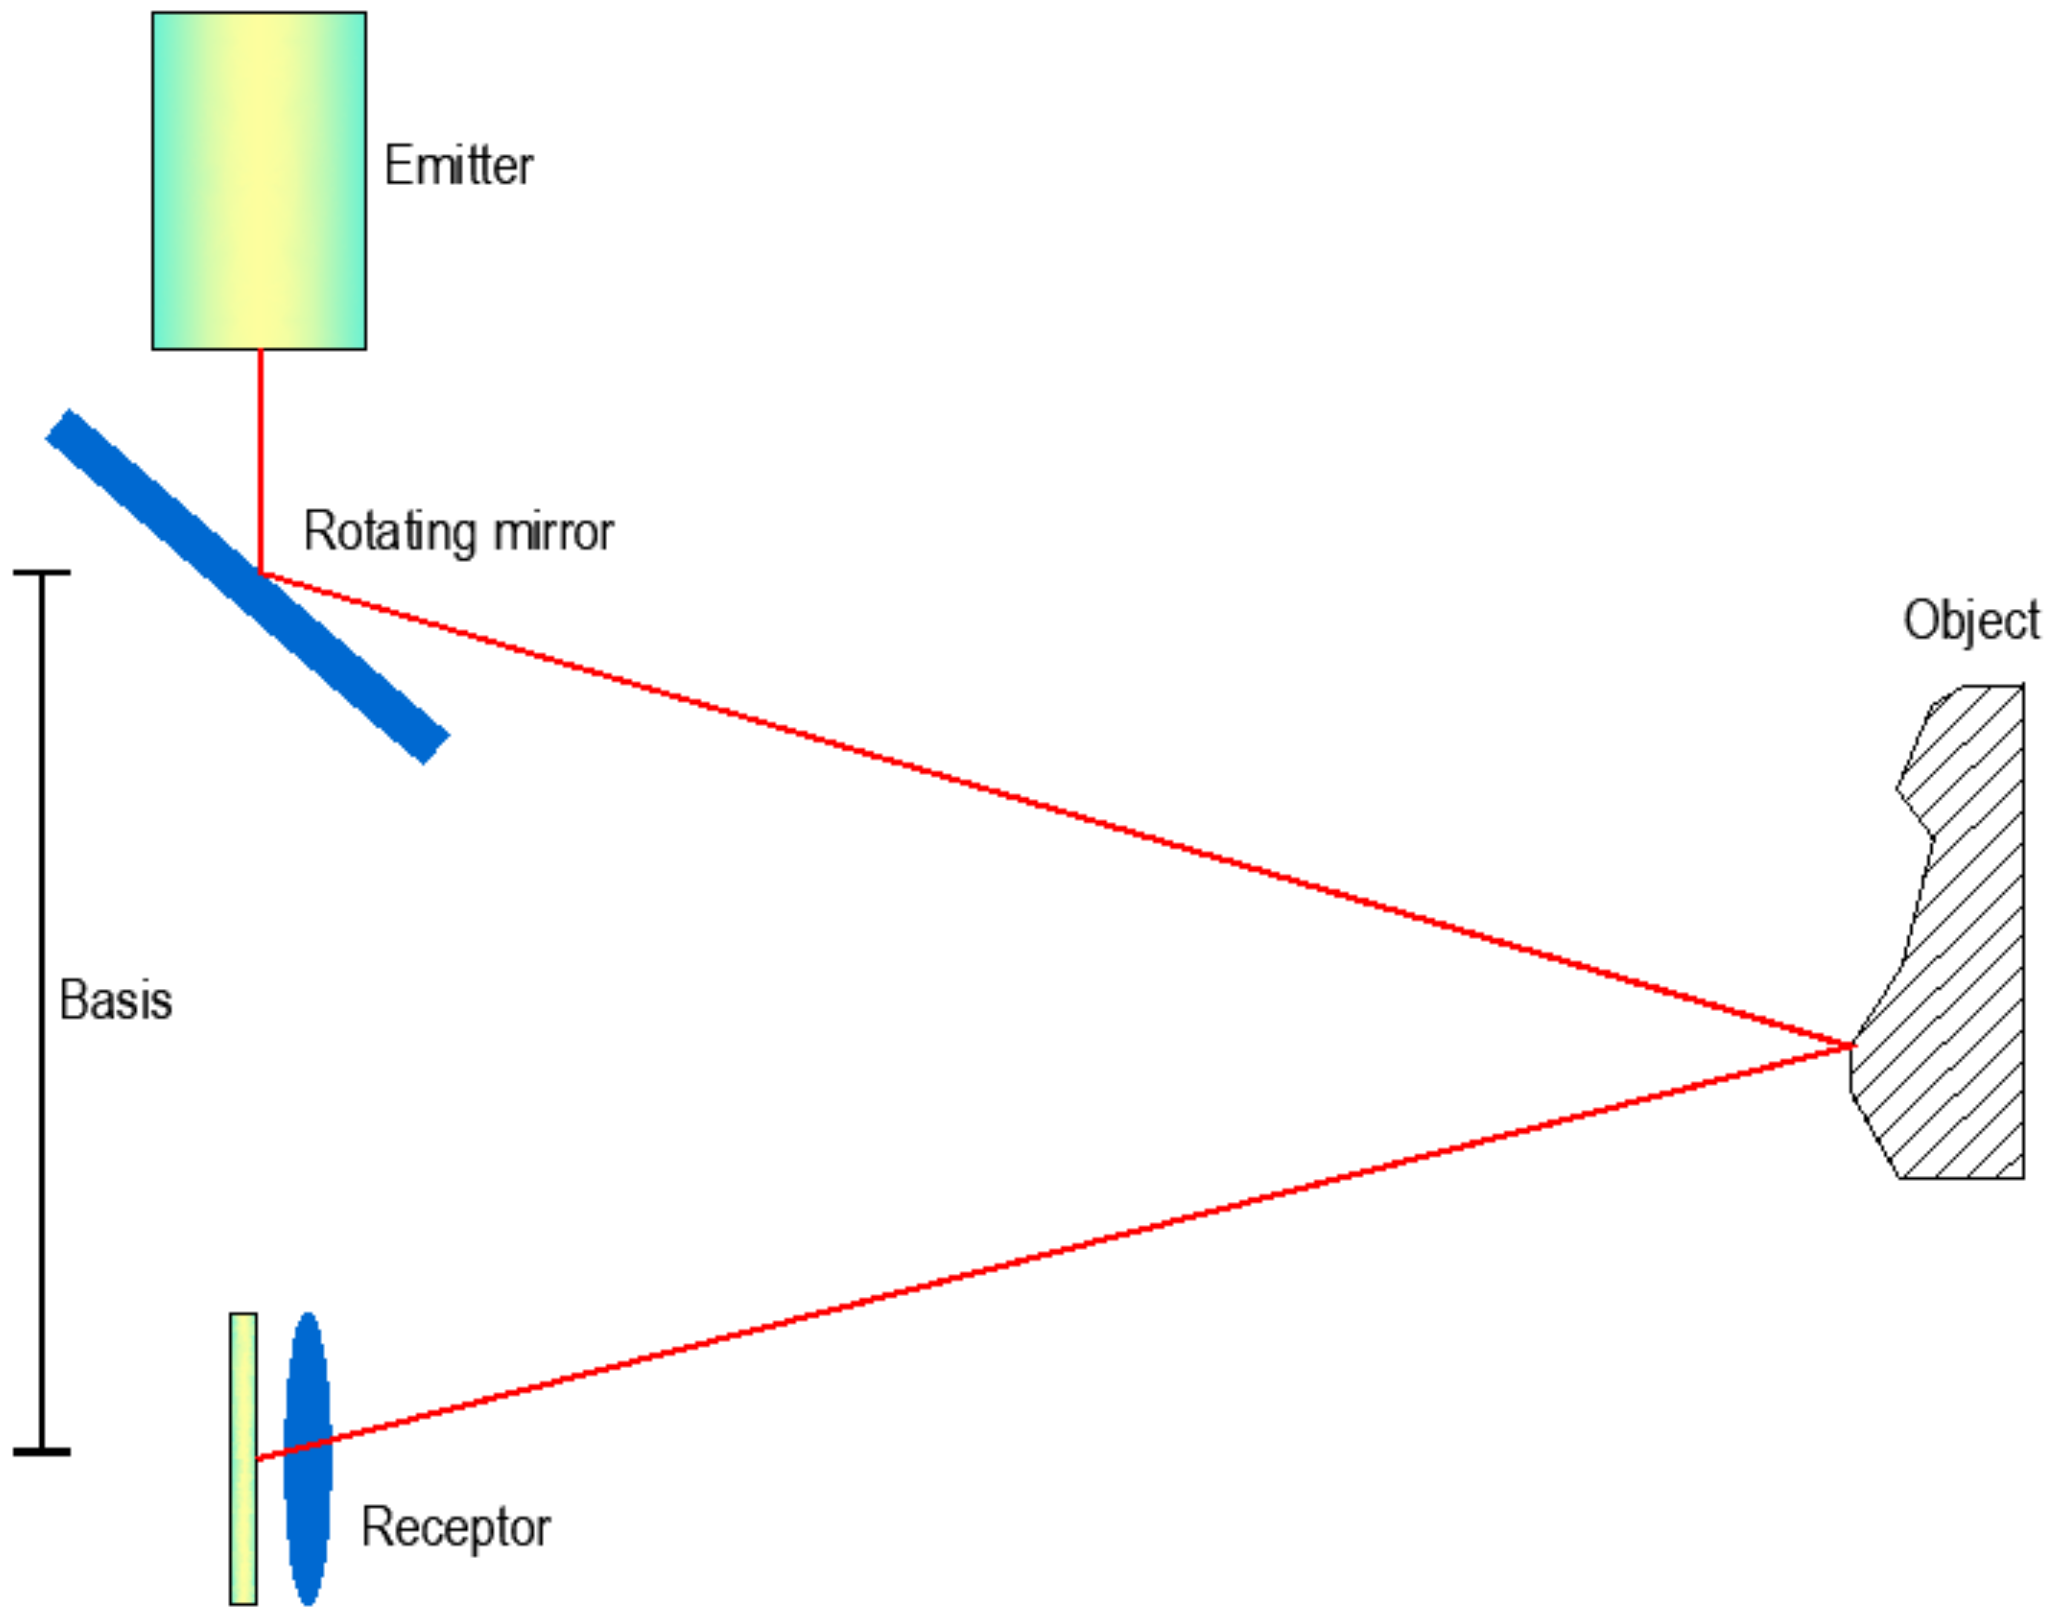
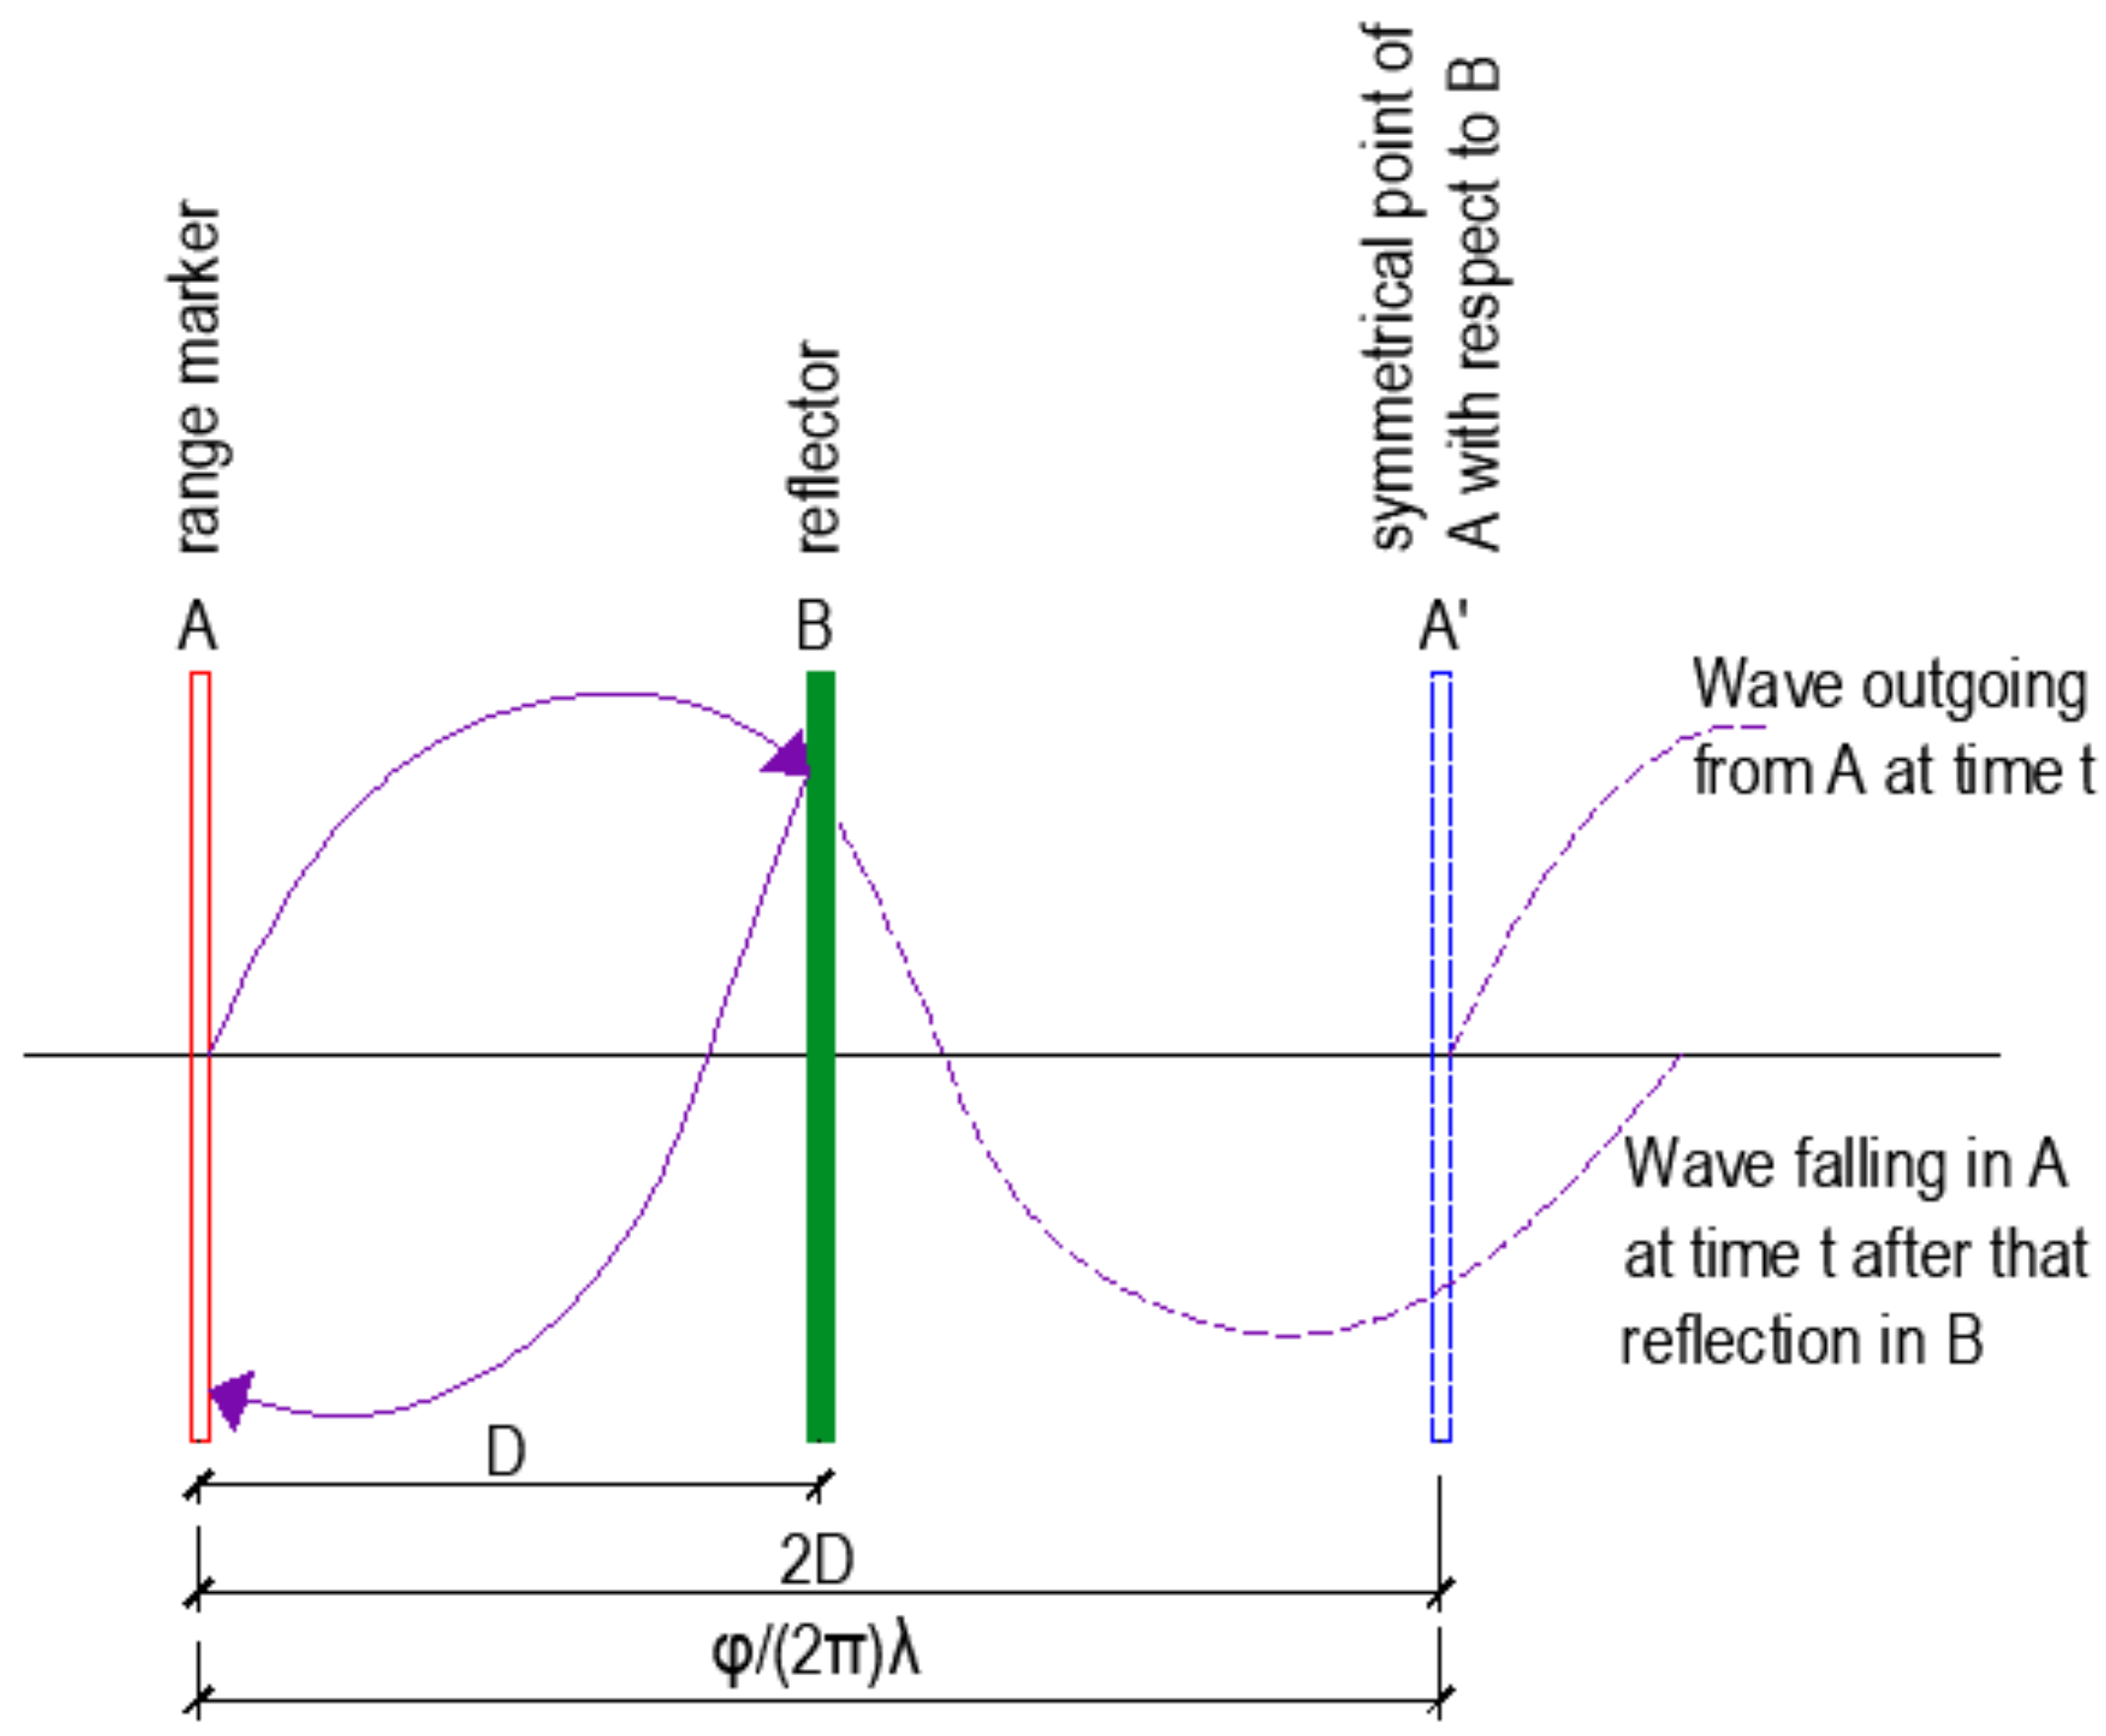
2.1. Surveying Methods

The LS technology represents an important evolution of surveying methods: it can be more accurate than the traditional total station and guarantees many advantages over topographic methods [23]. Laser scanners permit to produce quickly high-density point clouds [24,25], which represent the external surfaces of the measured object (Figure 1).
There are several technologies for digitally acquiring the shape of an object [26]. The main classification divides LS into two categories: contact and non-contact ones. For civil engineering purpose, the non-contact scanners are used because they do not probe the surface through physical touch. They emit laser light and detect its reflection or radiation to probe the object. Three types of non-contact LS are available: time-of-flight (TOF), triangulation, and difference of phase-based instruments.
TOF devices find the distance of a surface by timing the round-trip time of a pulse of light. A laser emits a pulse of light and a detector measures the time before the reflected light comes back. Since the speed of light is known, the round-trip time determines the travel distance of the light. The accuracy of TOF measures depends on the level of accuracy of time measures. Typical TOFs can capture data at a rate of 1000~10,000 points per second. TOF devices can provide useful data from as close in as a meter, out to 5 km.
Triangulation-based devices consist of an infrared emitter, which shines a laser on a rotating mirror which reflects the light to the object, and a Charge Coupled Device (CCD) camera receptor. The distance between the emitter and the receptor (i.e., the basis in Figure 2) is known a priori. The trigonometric solution of the triangle composed of the emitted infrared light, the object, and the receptor permits to calculate the position of the object surface (Figure 2).
This type of devices allows the relief of grey areas not scannable with TOF instruments; it is useful to scan small objects not very far from the emitter.
Phase shift LSs allow the calculation of distances by mean the phase shift of emitted and received waves, which is proportional to the distance between the scanner and the object (Figure 3); this method requires reconstruction algorithms to obtain geometric information.
This device can capture hundreds of thousands of points per second; the density of the grid of points detected is up to 0.6 mm at 10 m.
The longer-range scanning of TOF is the key benefit to use it for outside scanning, as done in this research. During the experimental phase, optical/mechanical rotating systems sent the laser ray to the tunnel intrados, varying the azimuth and zenith angles in discrete steps. Figure 4 shows a typical image obtained from LS relief.
In Figure 4, black areas (near the red arrows) reveal the presence of moisture and require deepen evaluation of the lining status. For this purpose, the integration between LS point cloud and tunnel inspection allows for identifying cracks, damages and defects on the observed surfaces [27,28]. In thermographic images, different colors represent different temperatures: they aid to understanding the surface temperature gradients during the relief (Figure 5).
LS and thermocameras used together give information about characteristics of tunnel surfaces, while the analysis of its structure requires also the investigation of the structure under the rail plane [29]. For this purpose, wide brand GPR antennas give radargrams: objects under the ground result in hyperbolic anomalies on records due to their electric characteristics different from those of the surrounding materials (Figure 6).
Penetration of electromagnetic waves is closely related to attenuation: both variables heavily depend on the soil conductivity; low-conductivity and homogeneous soils (e.g., compact rock, ice, dry sand, etc.) allow deep penetration (up to tens of meters). In clayey, sandy and gravelly soils, water and dissolved salts limit the penetration to a few meters. The choice of the transmission frequency affects resolution and penetration of the GPR survey: high penetration is desirable, but it implies low frequencies at the expense of the resolution and can imply operating limits in the antenna size. In practice, the trade-off between penetration, resolution and size of the system consists in: frequencies of 400–600 MHz for 150 cm deep surveys, while frequencies of 100–300 MHz for 300 cm deep surveys. For the examined railway track, the antennas had the central frequency equal to 400 MHz. At the end of the relief, data processing software allowed the elaboration and interpretation of survey data, which are all geo-referenced having GPS both on LS and on GPR instruments. The GPS was integrated with a precision odometer and with an Inertial Navigation System (INS).

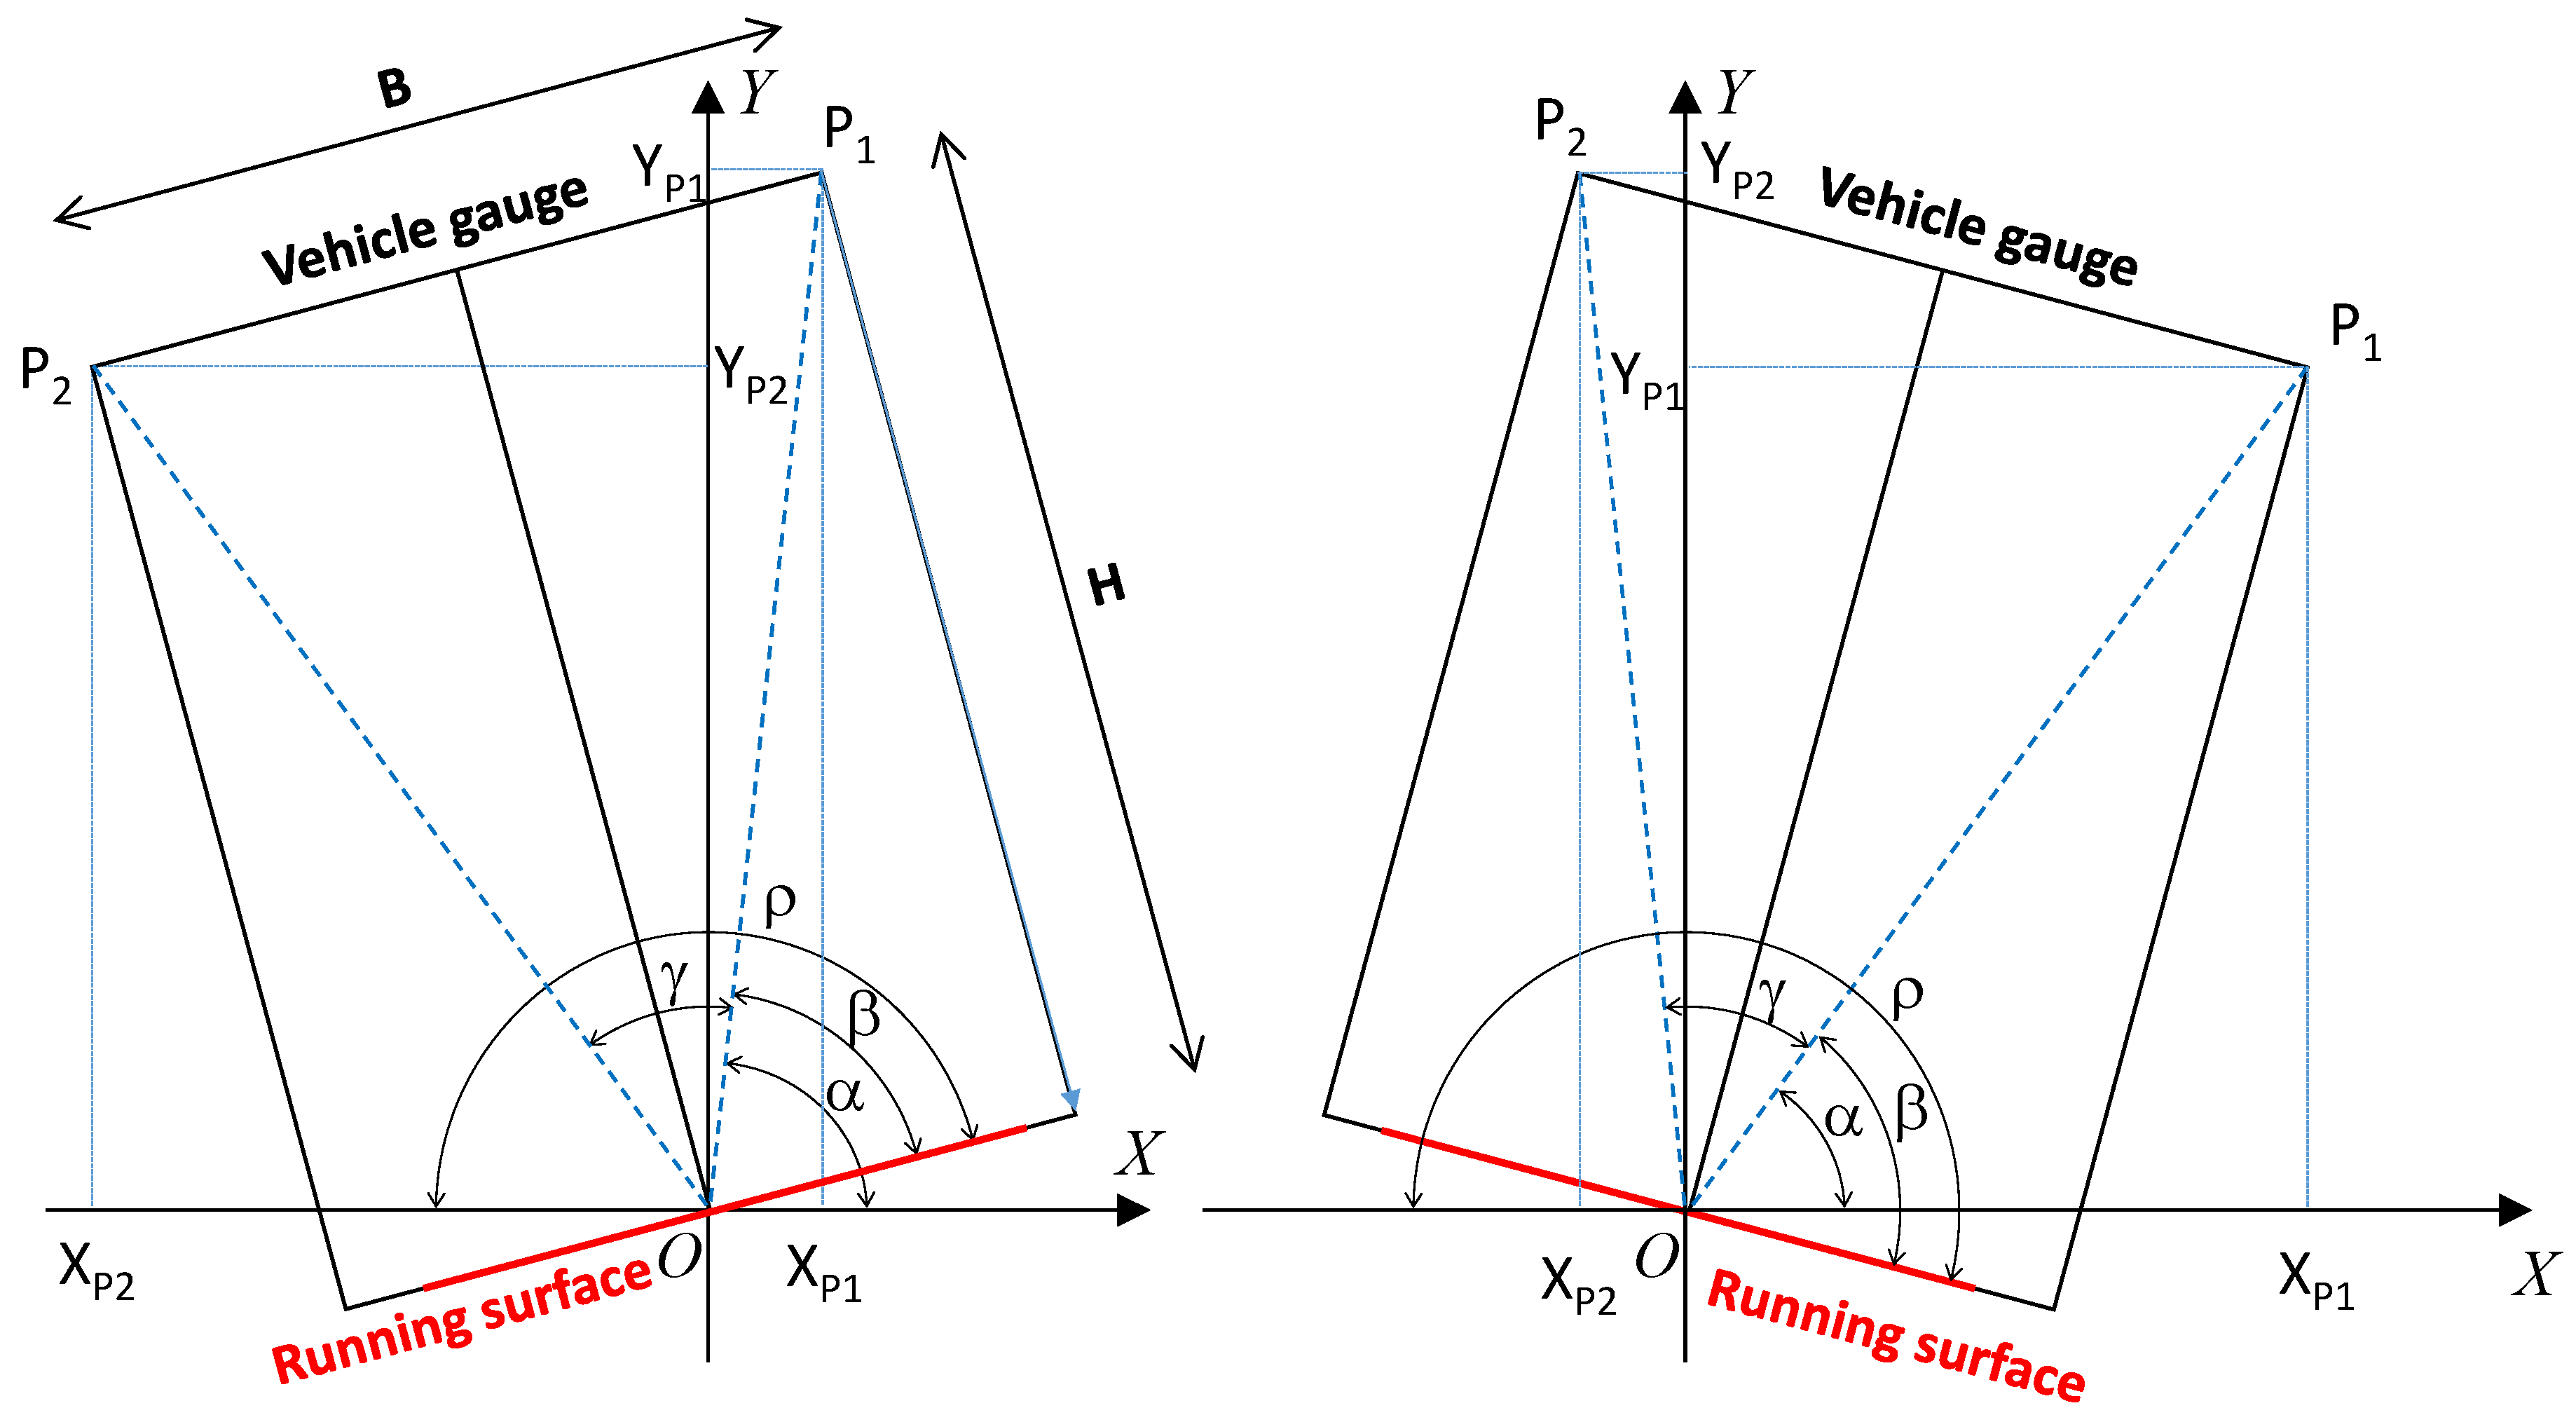
2.2. Elaboration and Interpretation of Survey Data

The final results of LS and GPR reliefs have been modelled by means of the programming language Visual Basic for Applications (VBA) [30]. The authors wrote an algorithm which takes into account the design loading gauge and the tunnel inner surfaces for a given railway alignment (Figure 7).
First verification of post-processing and data analysis showed a good reliability: the percentage error in track gauge measurement is lower than 0.3%. The calculation code considers the position of rail level and the cant, if it exists; the verification involves both upper vertices of the rectangular loading gauge (points P1 and P2 in Figure 8).
The geometrical analysis of the rail track refers to a Cartesian system whose origin O coincides with the reference point of the running surface. Three acute angles describe the considered vehicle gauge:
  • α (P1OXP1): the angle between the segment P1O and the axis x;
  • β: the angle between the segment P1O and the running surface (the top surface of the two rails at any point of railroad track);
  • γ (P2OP1): the angle between the segments P1O and P2O: it depends on the vehicle gauge;
  • ρ: the angle between the running surface and the axis x: it depends on the examined cross section and it is always positive.
γ and β can be respectively derived from Equations (1) and (2):
γ = 2 · arctan (B/2H)
β = arctan (2H/B)
where h and B are respectively the height and the width of the vehicle gauge.
Equations (3) and (4) present the mathematical relationships between ρ, α, and β:
α = β − (ρ − π)
α = β − (π − ρ)
where Equation (3) is valid when ρ ≤ π, and Equation 4 when ρ > π.
Finally, it is possible to obtain the coordinates (XP1; YP1) and (XP2; YP2) of the upper vertices, respectively P1 and P2, of the vehicle gauge (Equations (5)–(8)) according to the defined reference system:
XP1 = D · cos α
YP1 = D · sin α
XP2 = D · cos (α + γ)
YP2 = D · sin (α + γ)
where D = ( B / 2 ) 2 + H 2 .
An iterative procedure verifies if P1 and P2 are underneath a polyline (red line in Figure 9) which represents the linearized intrados and it is deducted from the LS relief.
The algorithm is composed of two-step verification which involves all consecutive pairs of points of the polyline of the linearized intrados (e.g., A:(XA; YA), B:(XB; YB)), and each upper vertex of the geometrical gauge (e.g., P:(XP; YP)):
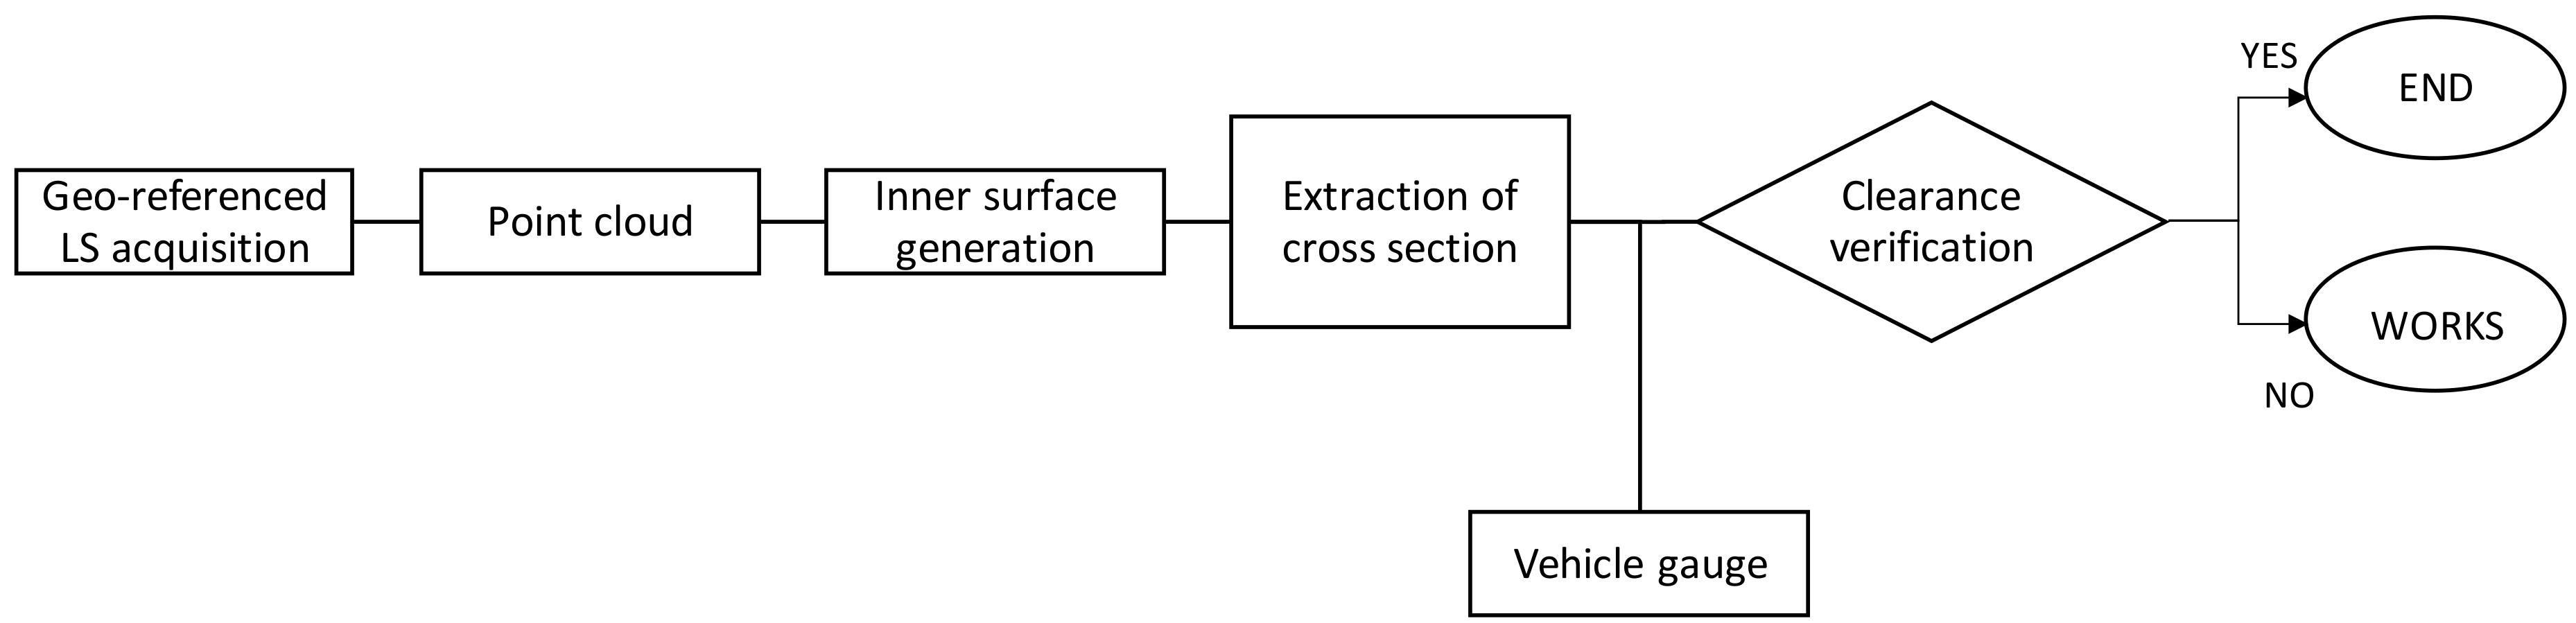
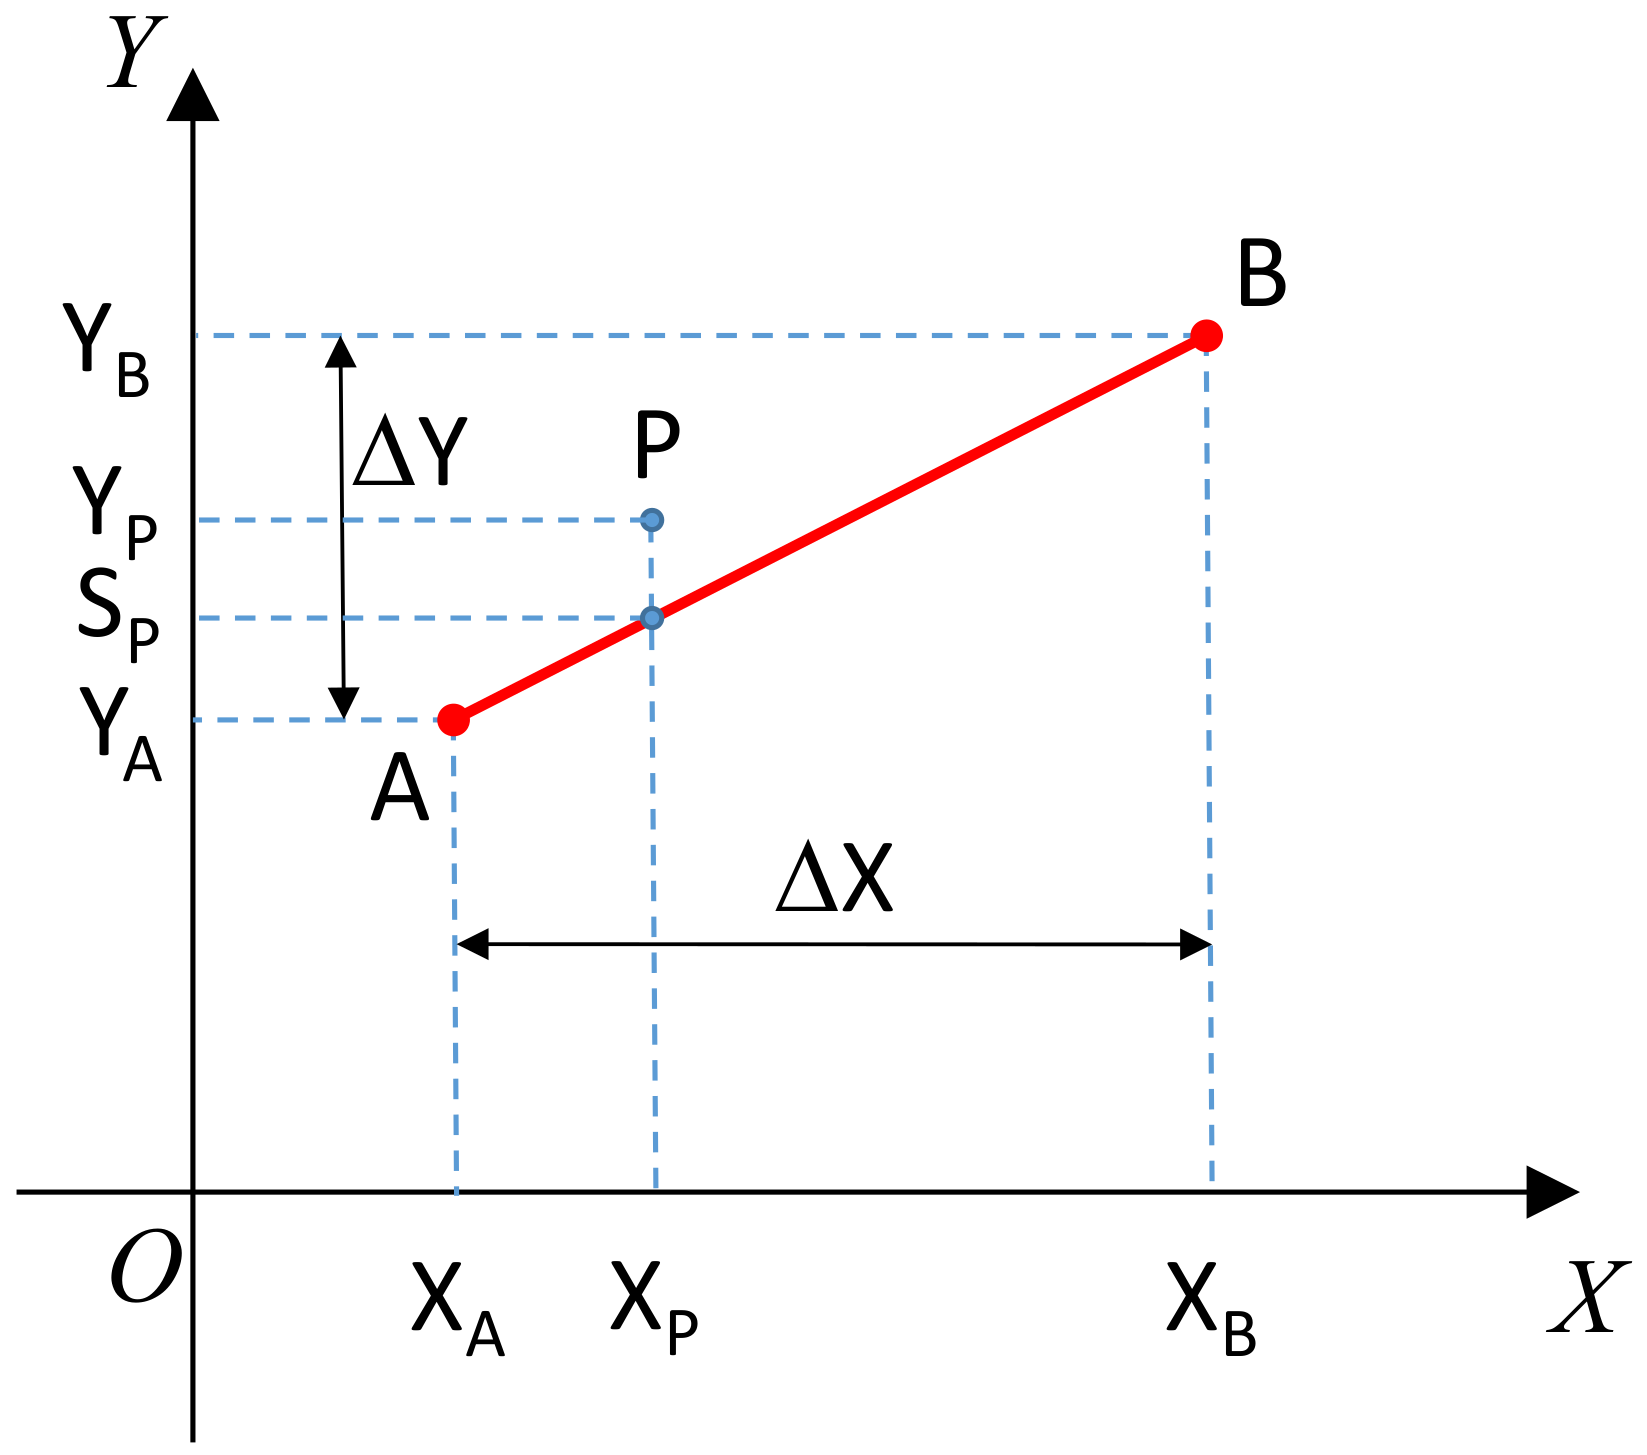
  • the procedure verifies if the coordinates of P satisfy Equations (9) and (10):
    min (XA; XB) ≤ XP ≤ max (XA; XB)
    min (YA; YB) ≤ YP ≤ max (YA; YB)
    If both conditions are verified,
  • the procedure verifies if the co-ordinates of P satisfy the condition (Equation (11));
    Y P S P = X P X A X B X A · ( Y B Y A ) + Y A
    When Equation (11) is not satisfied, two alternatives are possible to solve the problem of interference between the inner profile of the railway tunnel and the vehicle gauge:
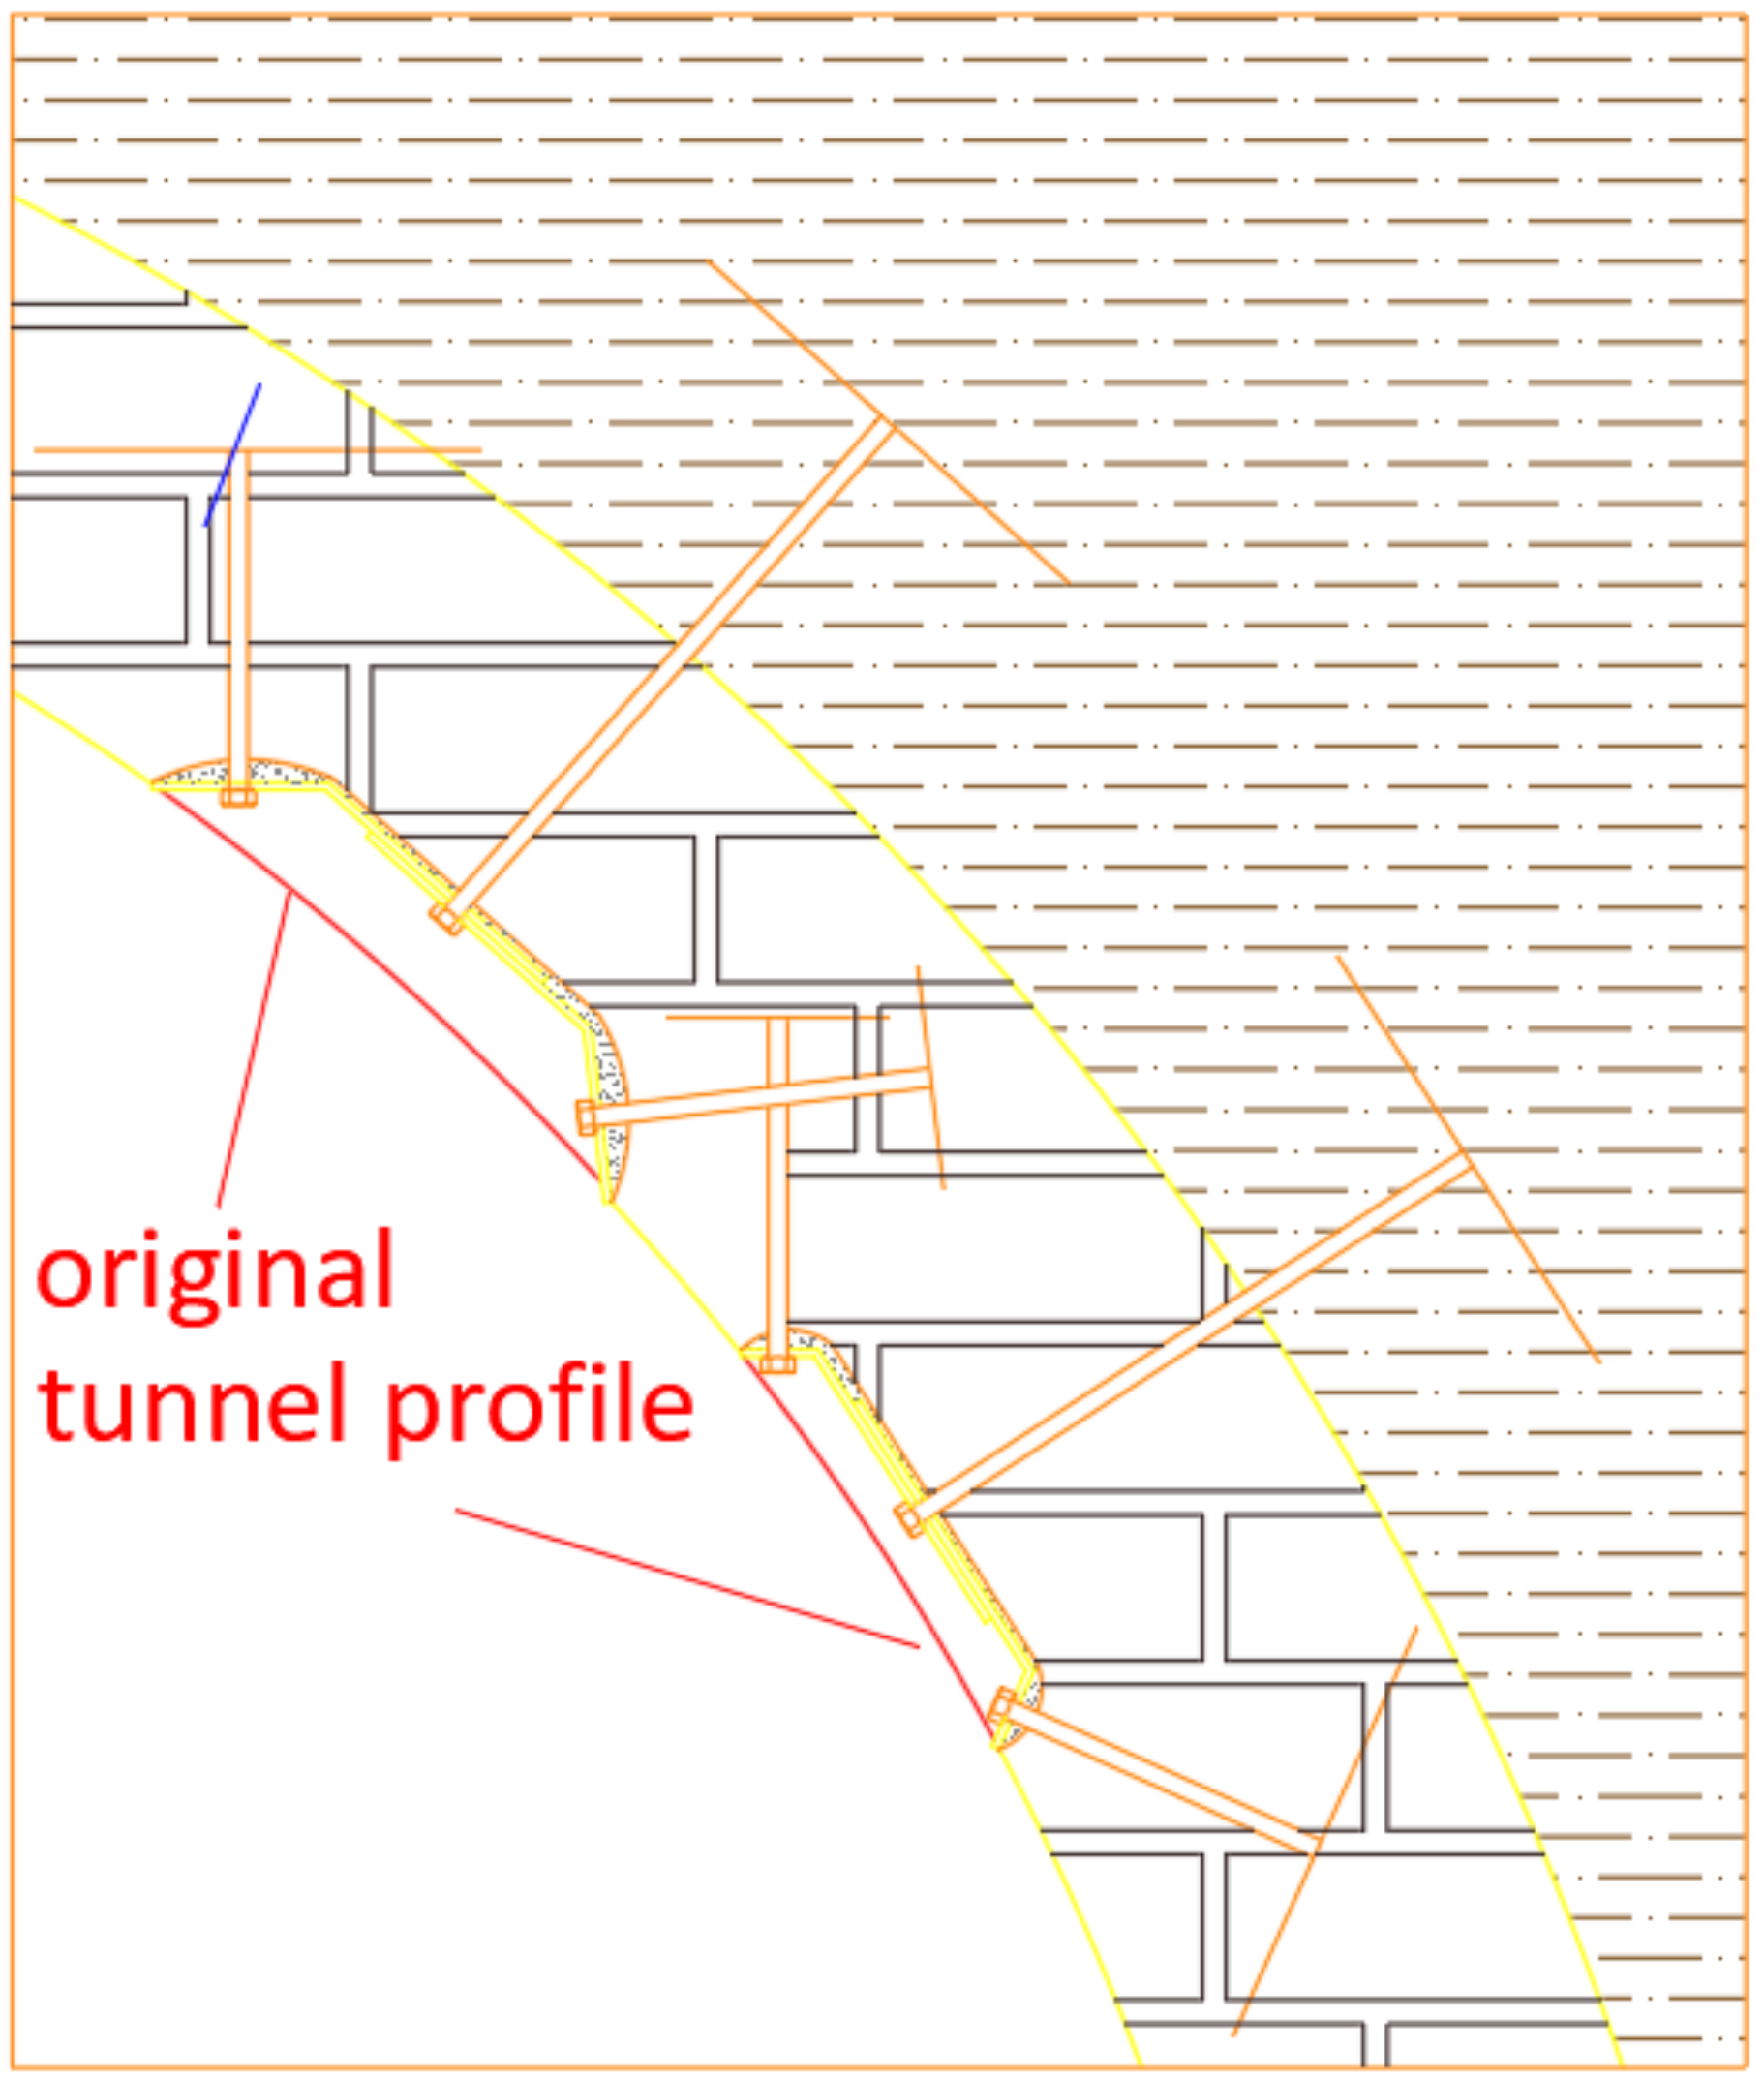
  • Alternative 1: consolidation and milling of the existing intrados coating, punctually in the sections where Equation (11) is not satisfied without thereby altering the rail track geometry;
  • Alternative 2: modification of the geometry of rail track, in the sections where Equation (11) is not satisfied particularly considering the redesign of the gradient. It is important to note that the re-design of the track profile entails change new vertical curves between the grade lines, but it is forced by planimetric characteristics of the alignment: vertical curves should not be placed on the transitional curves. Moreover, this works imply new excavations to enlarge the lower portion of the tunnel and move the concrete invert slab downwards. For this purpose, geological and geotechnical tests should investigate typology and strength of tunnel lining and surrounding soils.
The two alternatives imply important economic differences, which cannot be overlooked when this type of works is planned. Indeed, the milling cost per linear meter can be up to 10 times more than that of modification of the track (without moving the overall tunnel) (3700 €/m vs. 340 €/m) [31]. However, as aforementioned, the alternative 2 is possible only when the planimetric geometry of the tunnel allows modifying the track profile without problems. In general, alternative 1 is always possible because it consists in many single works of limited extension (from 1 m to 5 m). This method permits to detect the sections where the vehicle gauge is not satisfied respect to tunnel intrados; in the next case study, the authors propose a work process to adapt the tunnel intrados to the selected vehicle gauge using alternative 1.

3. Case Study

The exposed relief and analysis procedures have been applied for the analysis of an Italian railway tunnel dug in a pyroclastic material typical of the Central Italy [32]. The structure is a 953 m-long twin-tube tunnel, and it serves passenger and freight routes.
A railway wagon with GPS, one LS, three GPR antennas, and four thermocameras allowed the relief (Figure 10).
The topographical survey of the railway track highlighted the presence of planimetric curves, whose radii range between 905 m and 1020 m, which require cant up to 8 cm.
Figure 11 represents the considered loading gauge (i.e., P/C 80) [33]. The gauge P/C80 (also known Gabarit C) is the reference one to be adopted on the Trans European Network [5].
For the examined gauge, D is 4.76 m, γ is 0.62981 rad, and β is 1.24803.
The obtained results show that in several tunnel sections the verifies performed for the upper vertices of loading gauge show that there are not any clearance available and in some sections, the loading gauges even intersect upon the intrados. Figure 12 shows such conditions detected in a curve section.
Due to the planimetric characteristics of the rail track under the tunnel, the modification of the longitudinal profile is unsuitable: the vertical curves would be superimposed on planimetric curves, and this is not admitted by the track alignment design parameters. On the other hand, the results from GPR allowed for the possibility of reducing the lining thickness of the tunnel, the most expensive solution between the two available ones. Indeed, the maximum interference thickness did not exceed half of the lining thickness: the prerequisite for designing an intrados reprofiling was satisfied.
Hereafter the authors present the work process performed to adapt the tunnel intrados to the selected vehicle gauge (Figure 13, Figure 14, Figure 15, Figure 16, Figure 17, Figure 18 and Figure 19): in these figures, the lines in red represent the described works. The paper does not detail the technical and mechanical characters of the intervention, which differ according to the local conditions.
  • Cleaning of the intrados with high-pressure (400–500 bar) sand washers: this activity bared the masonry surface, eliminated falling masonry parts, and pointed out further problems not found during the inspections because hidden under the dirt (Figure 13)
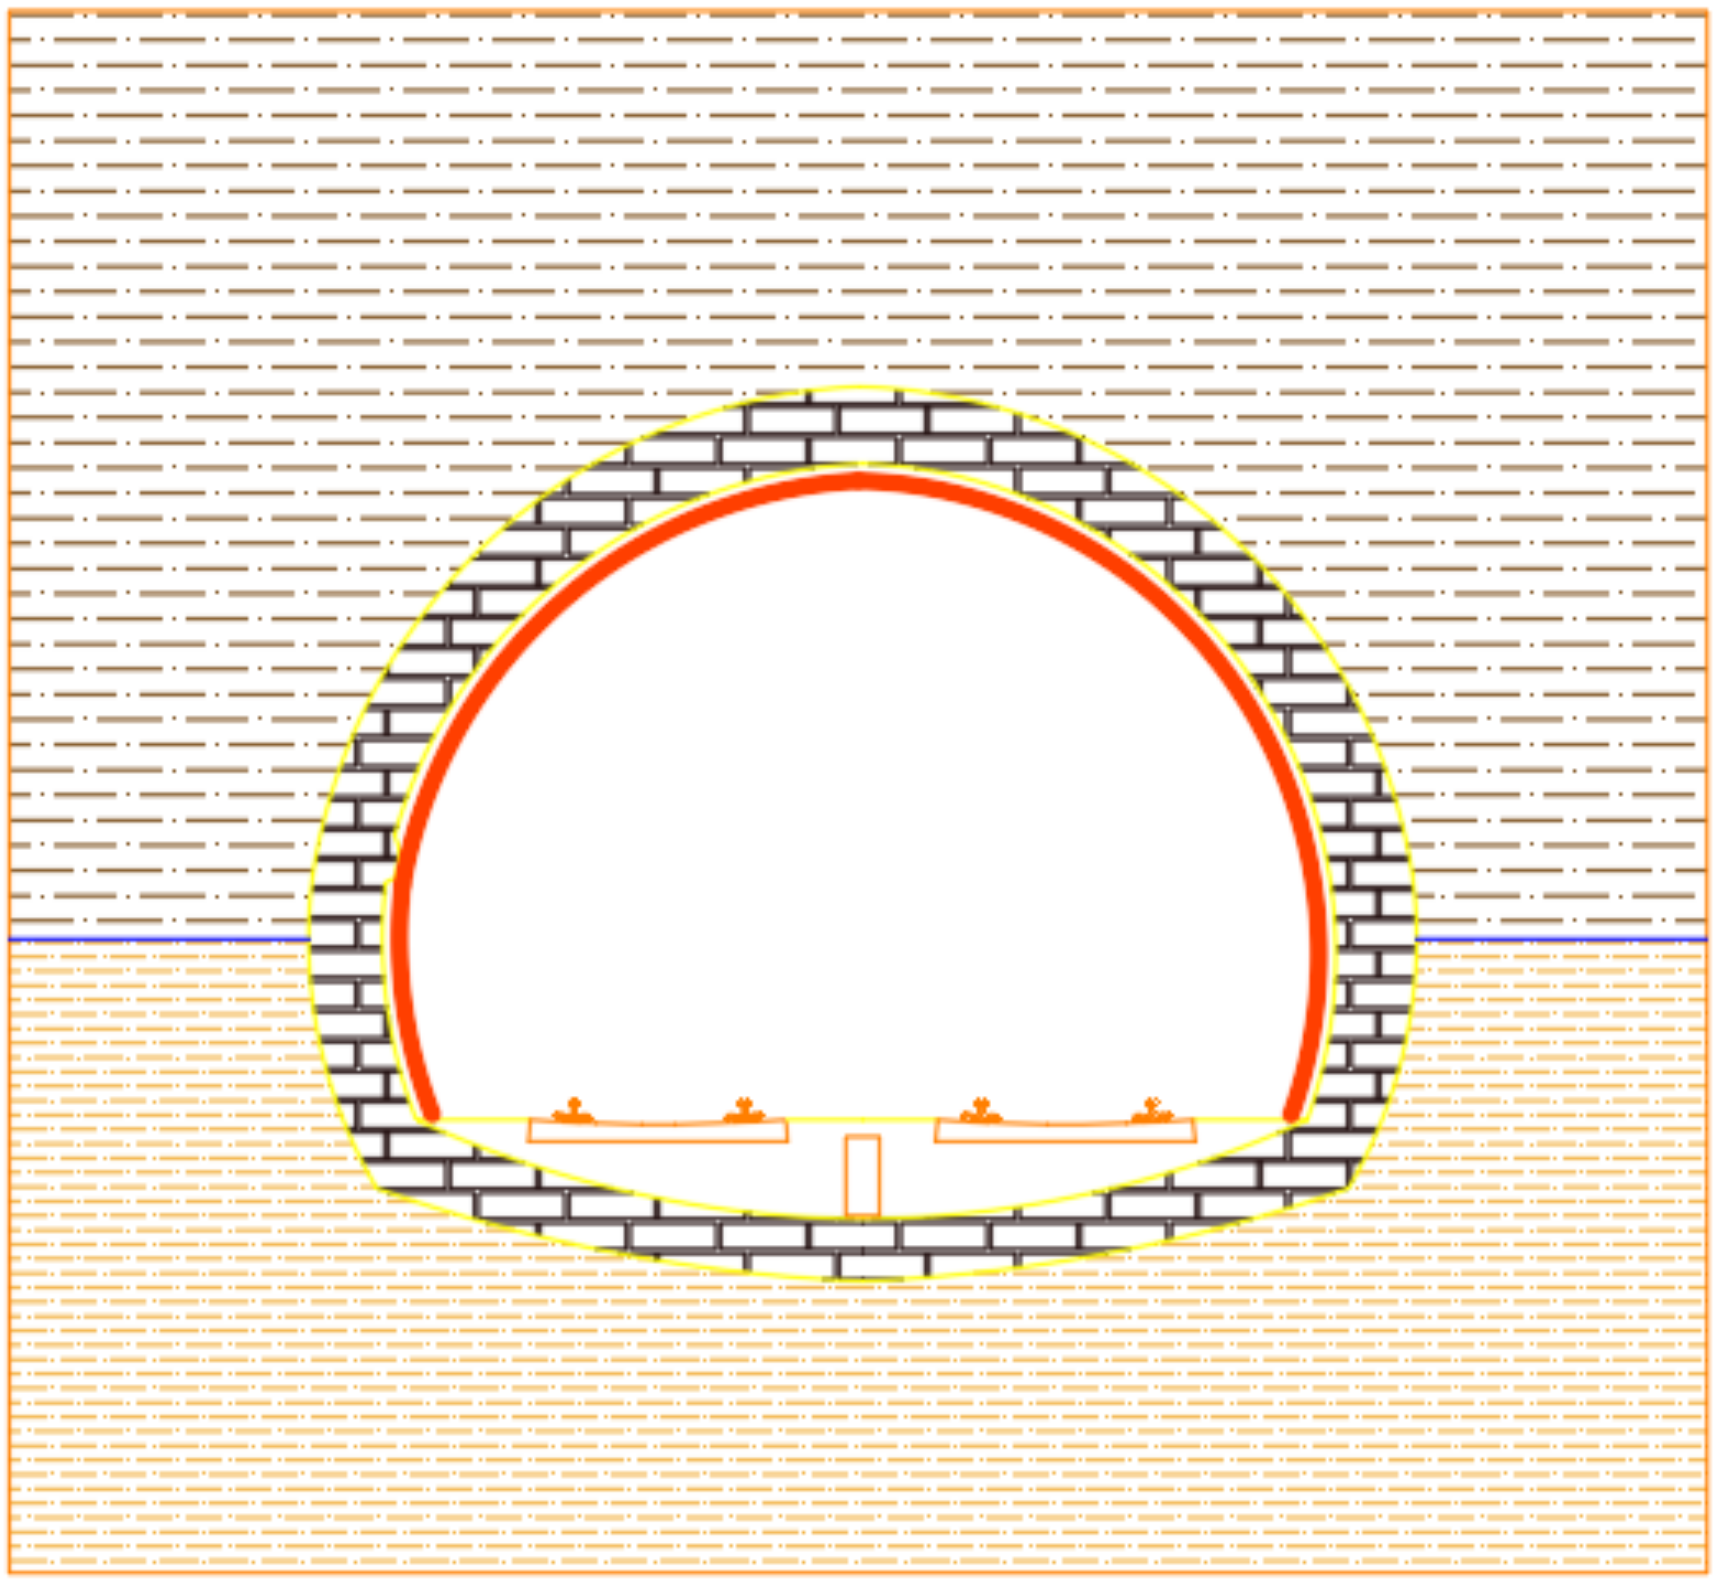
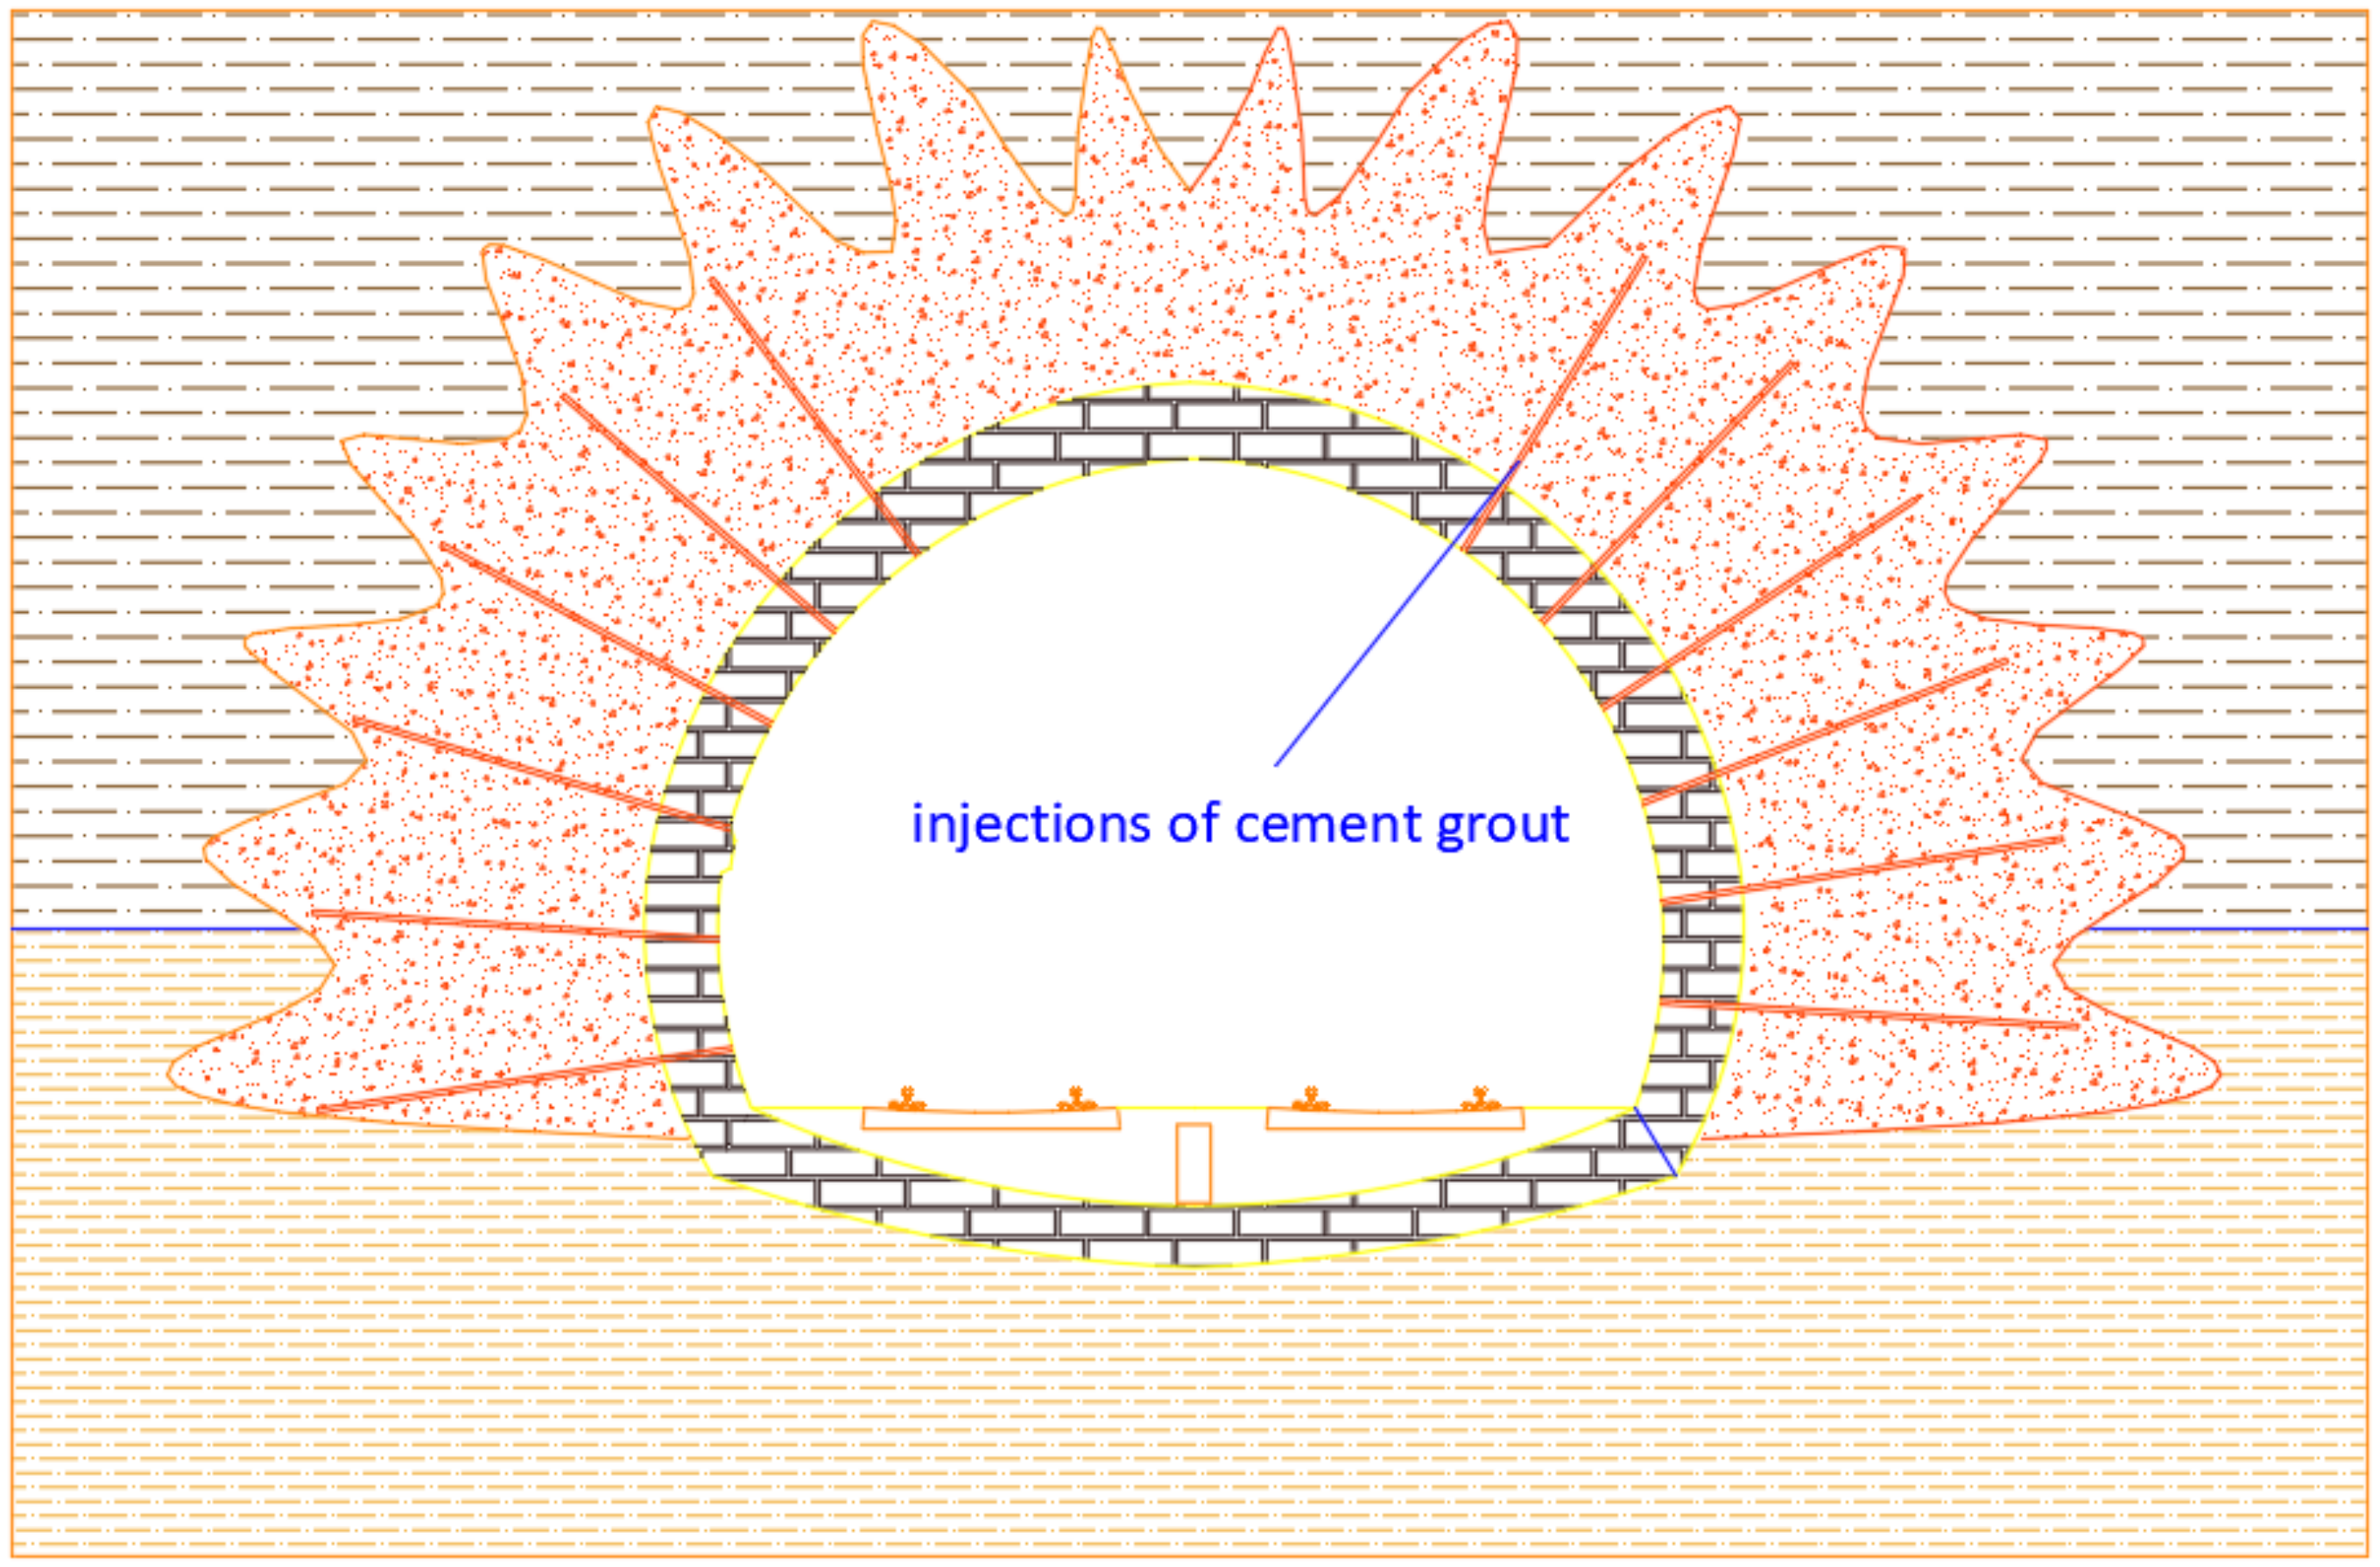
  • Diffused injections of cement grout mixed with acrylic resins for the consolidation of the excavated surface; such intervention filled the void between soil and lining, which could cause asymmetric loads in the lining arc (Figure 14). The grout holes were 2500–3000 mm deep into the soil;
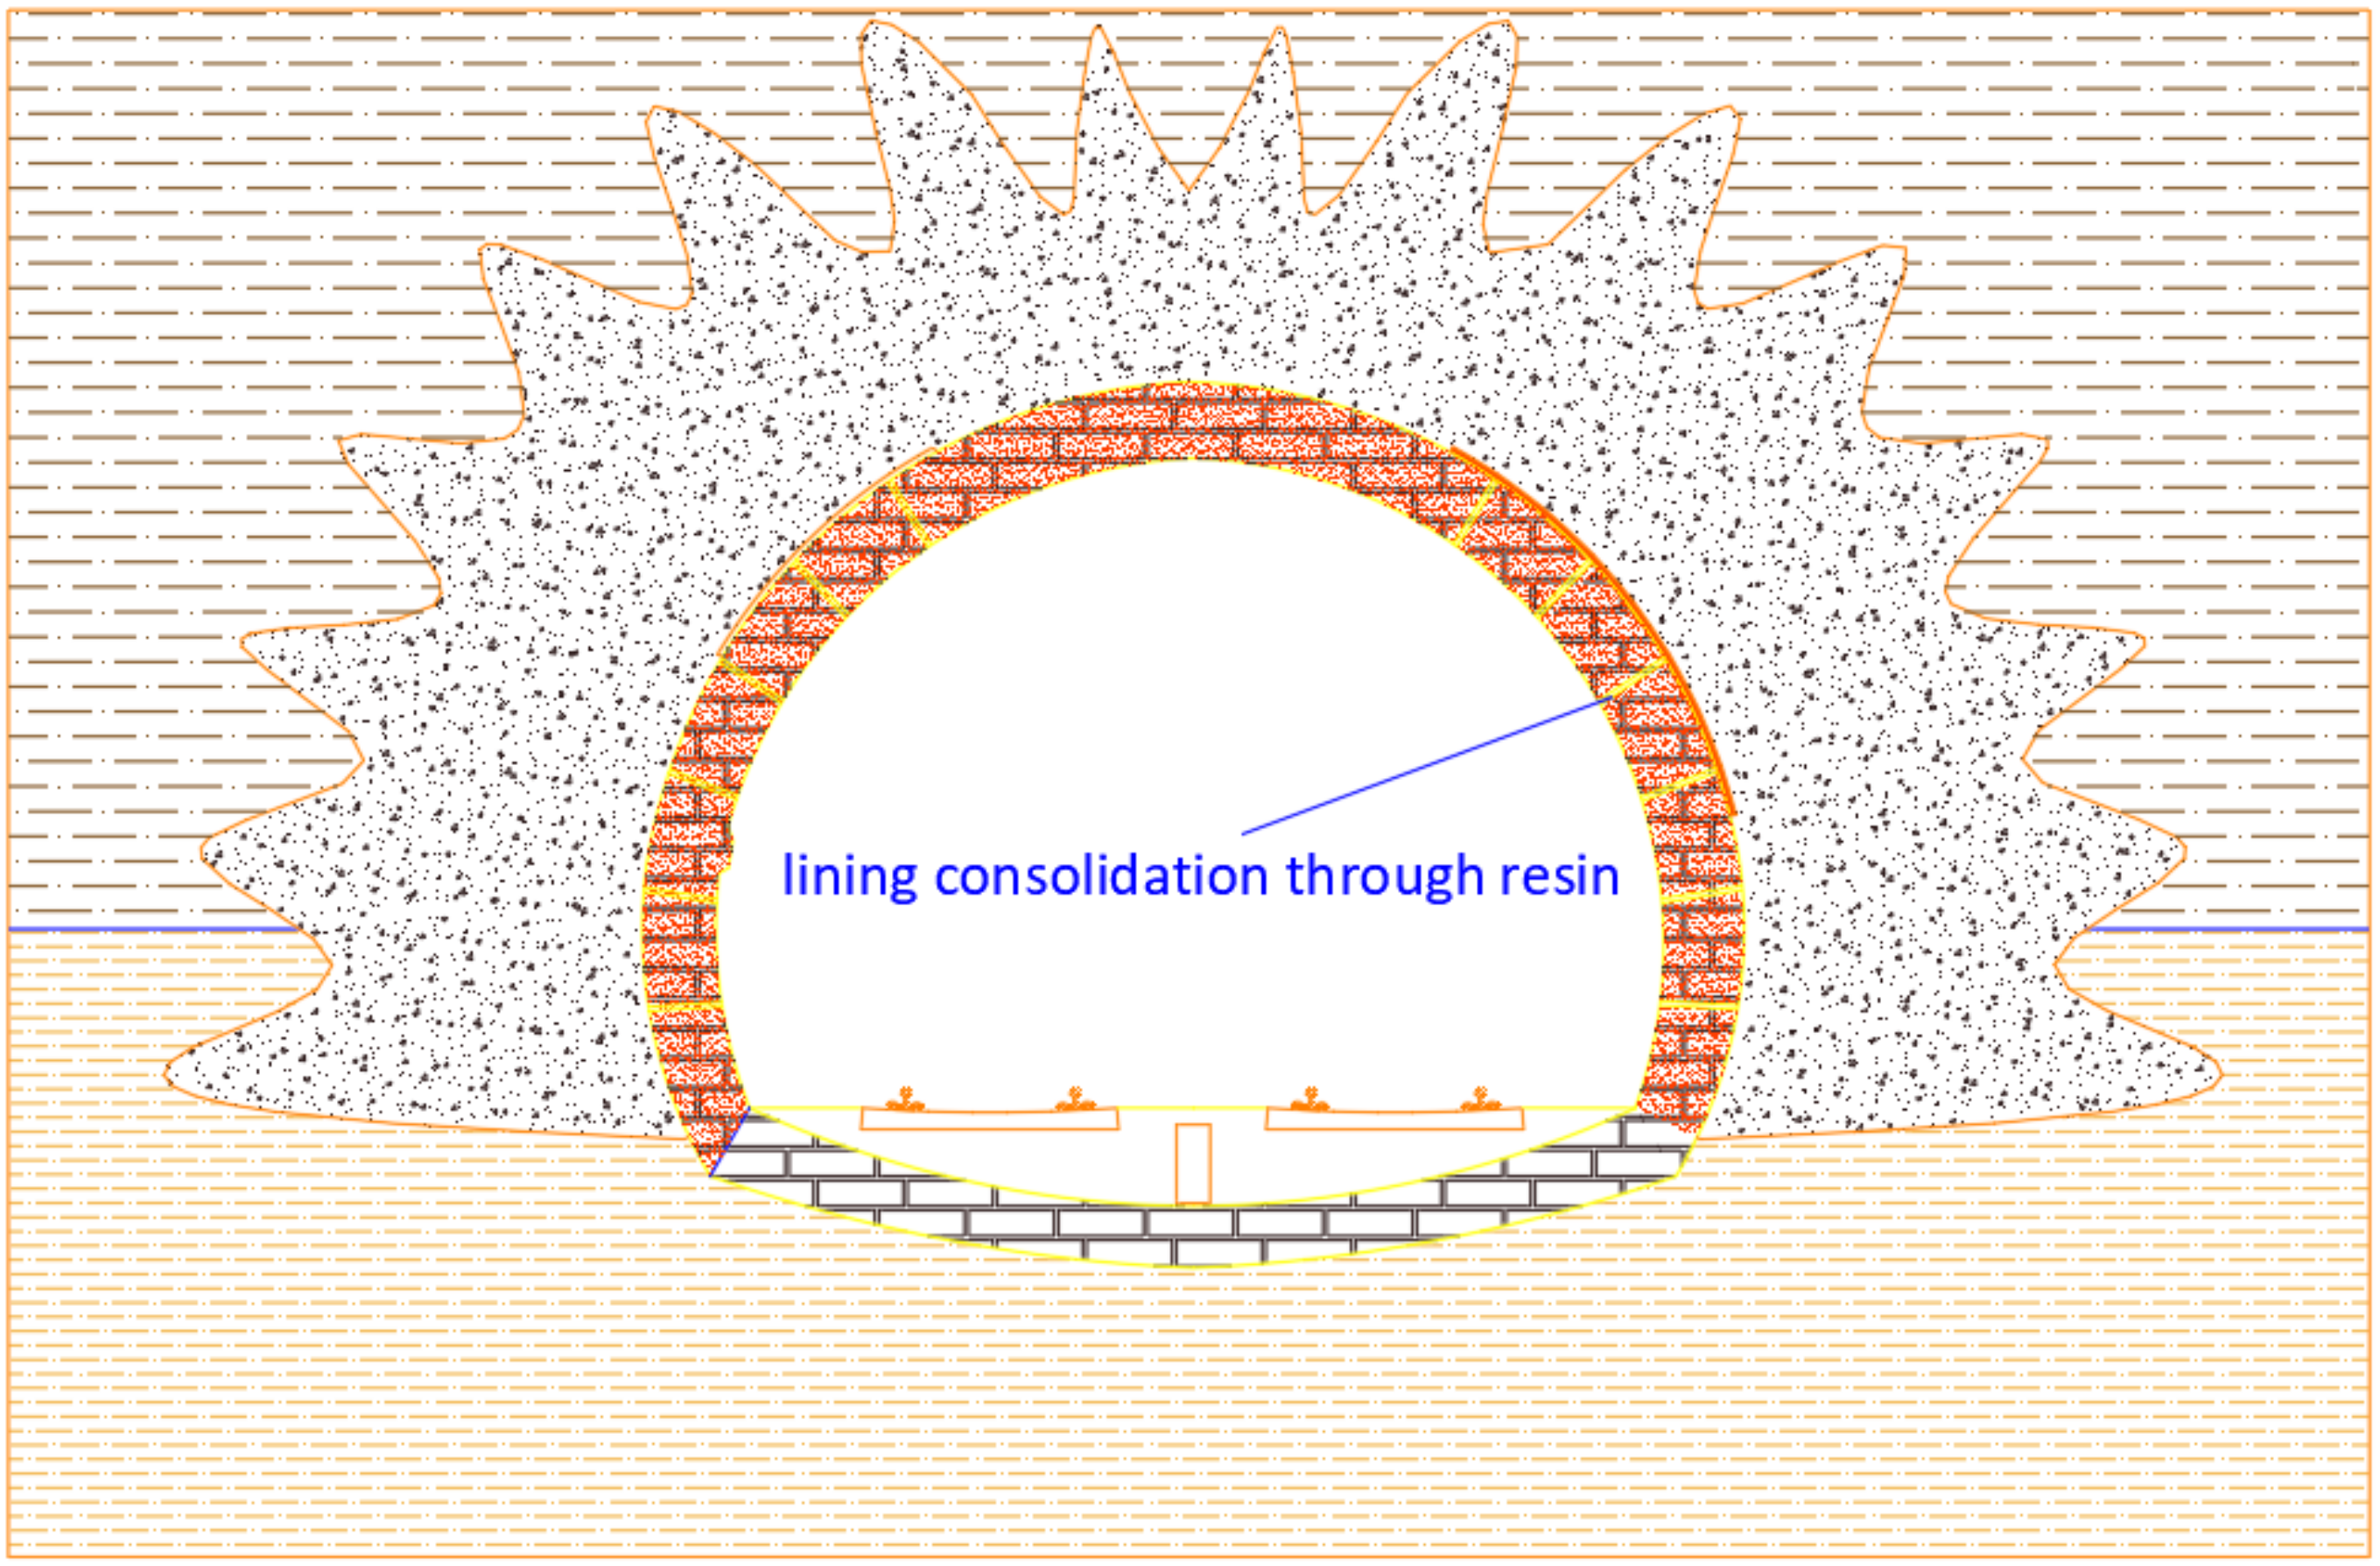
  • Lining consolidation through resin and realization of a resistant 5 cm-thick layer between the extrados and the soil (Figure 15) in the zone where the problems appear;
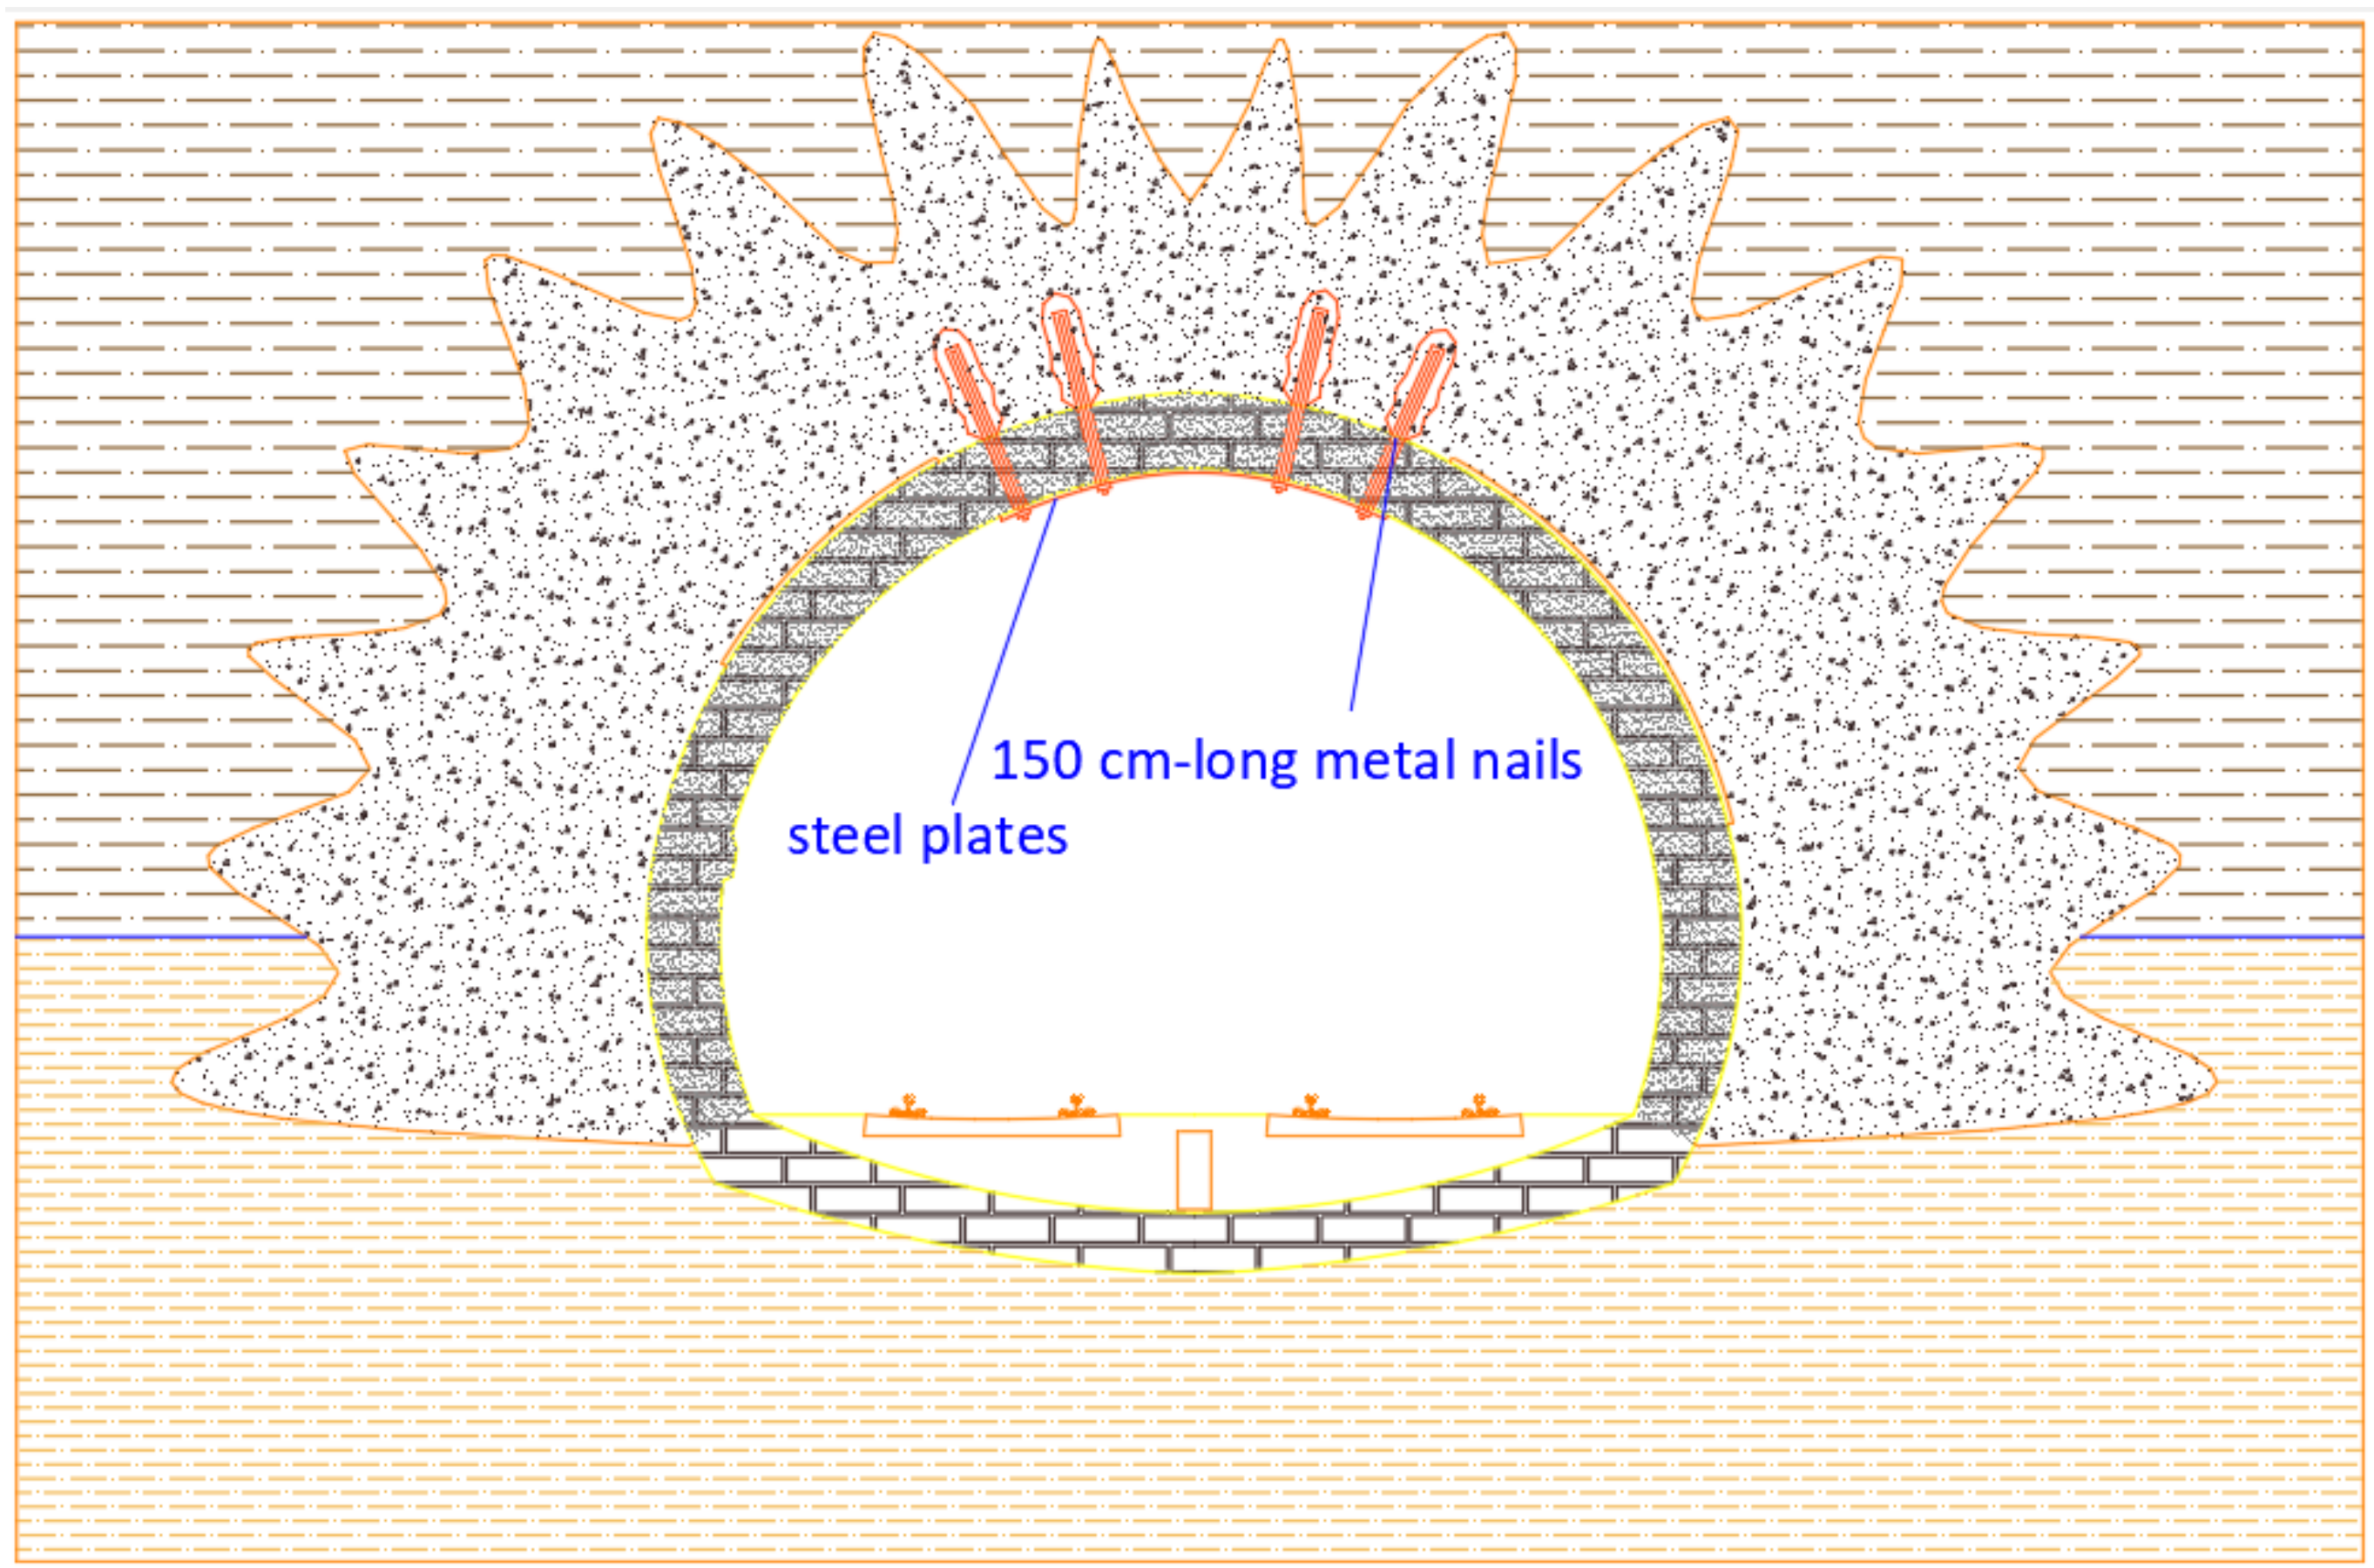
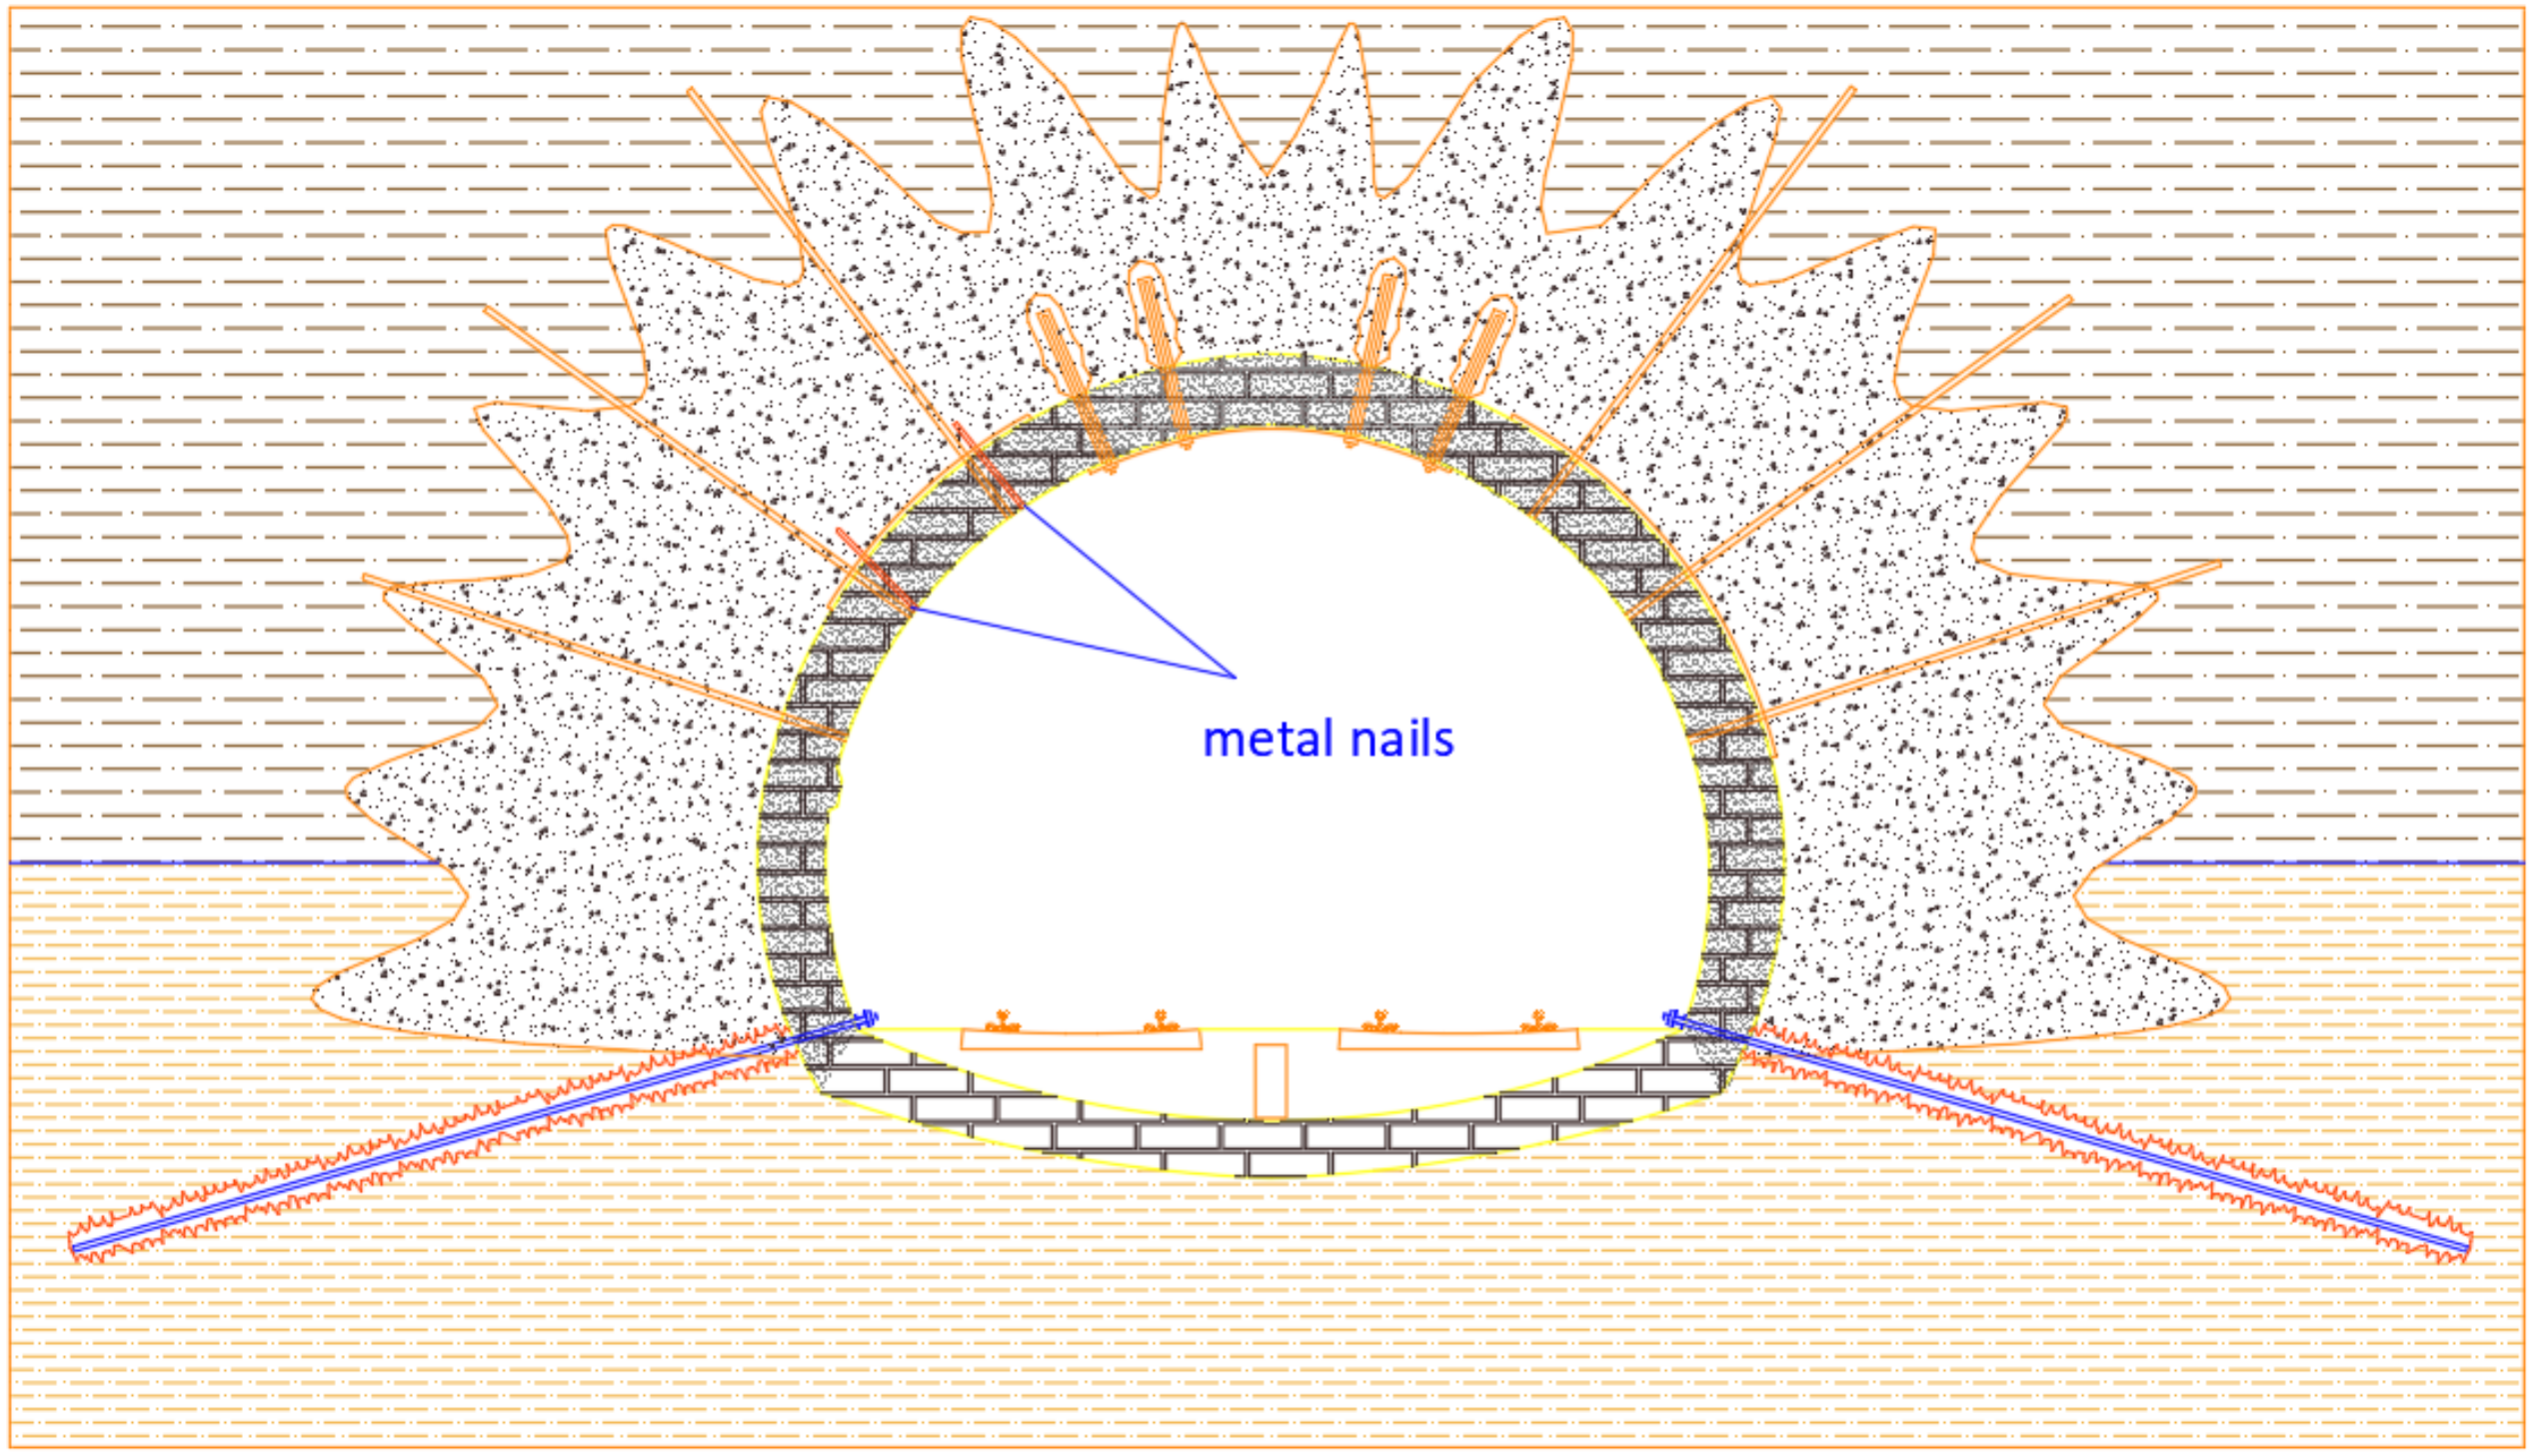
  • anchorage of the tunnel crown with 150 cm-long metal nails to limit radial loads where the axial force of the lining was usually low, thus preventing failure for excessive flexural moments (Figure 16);
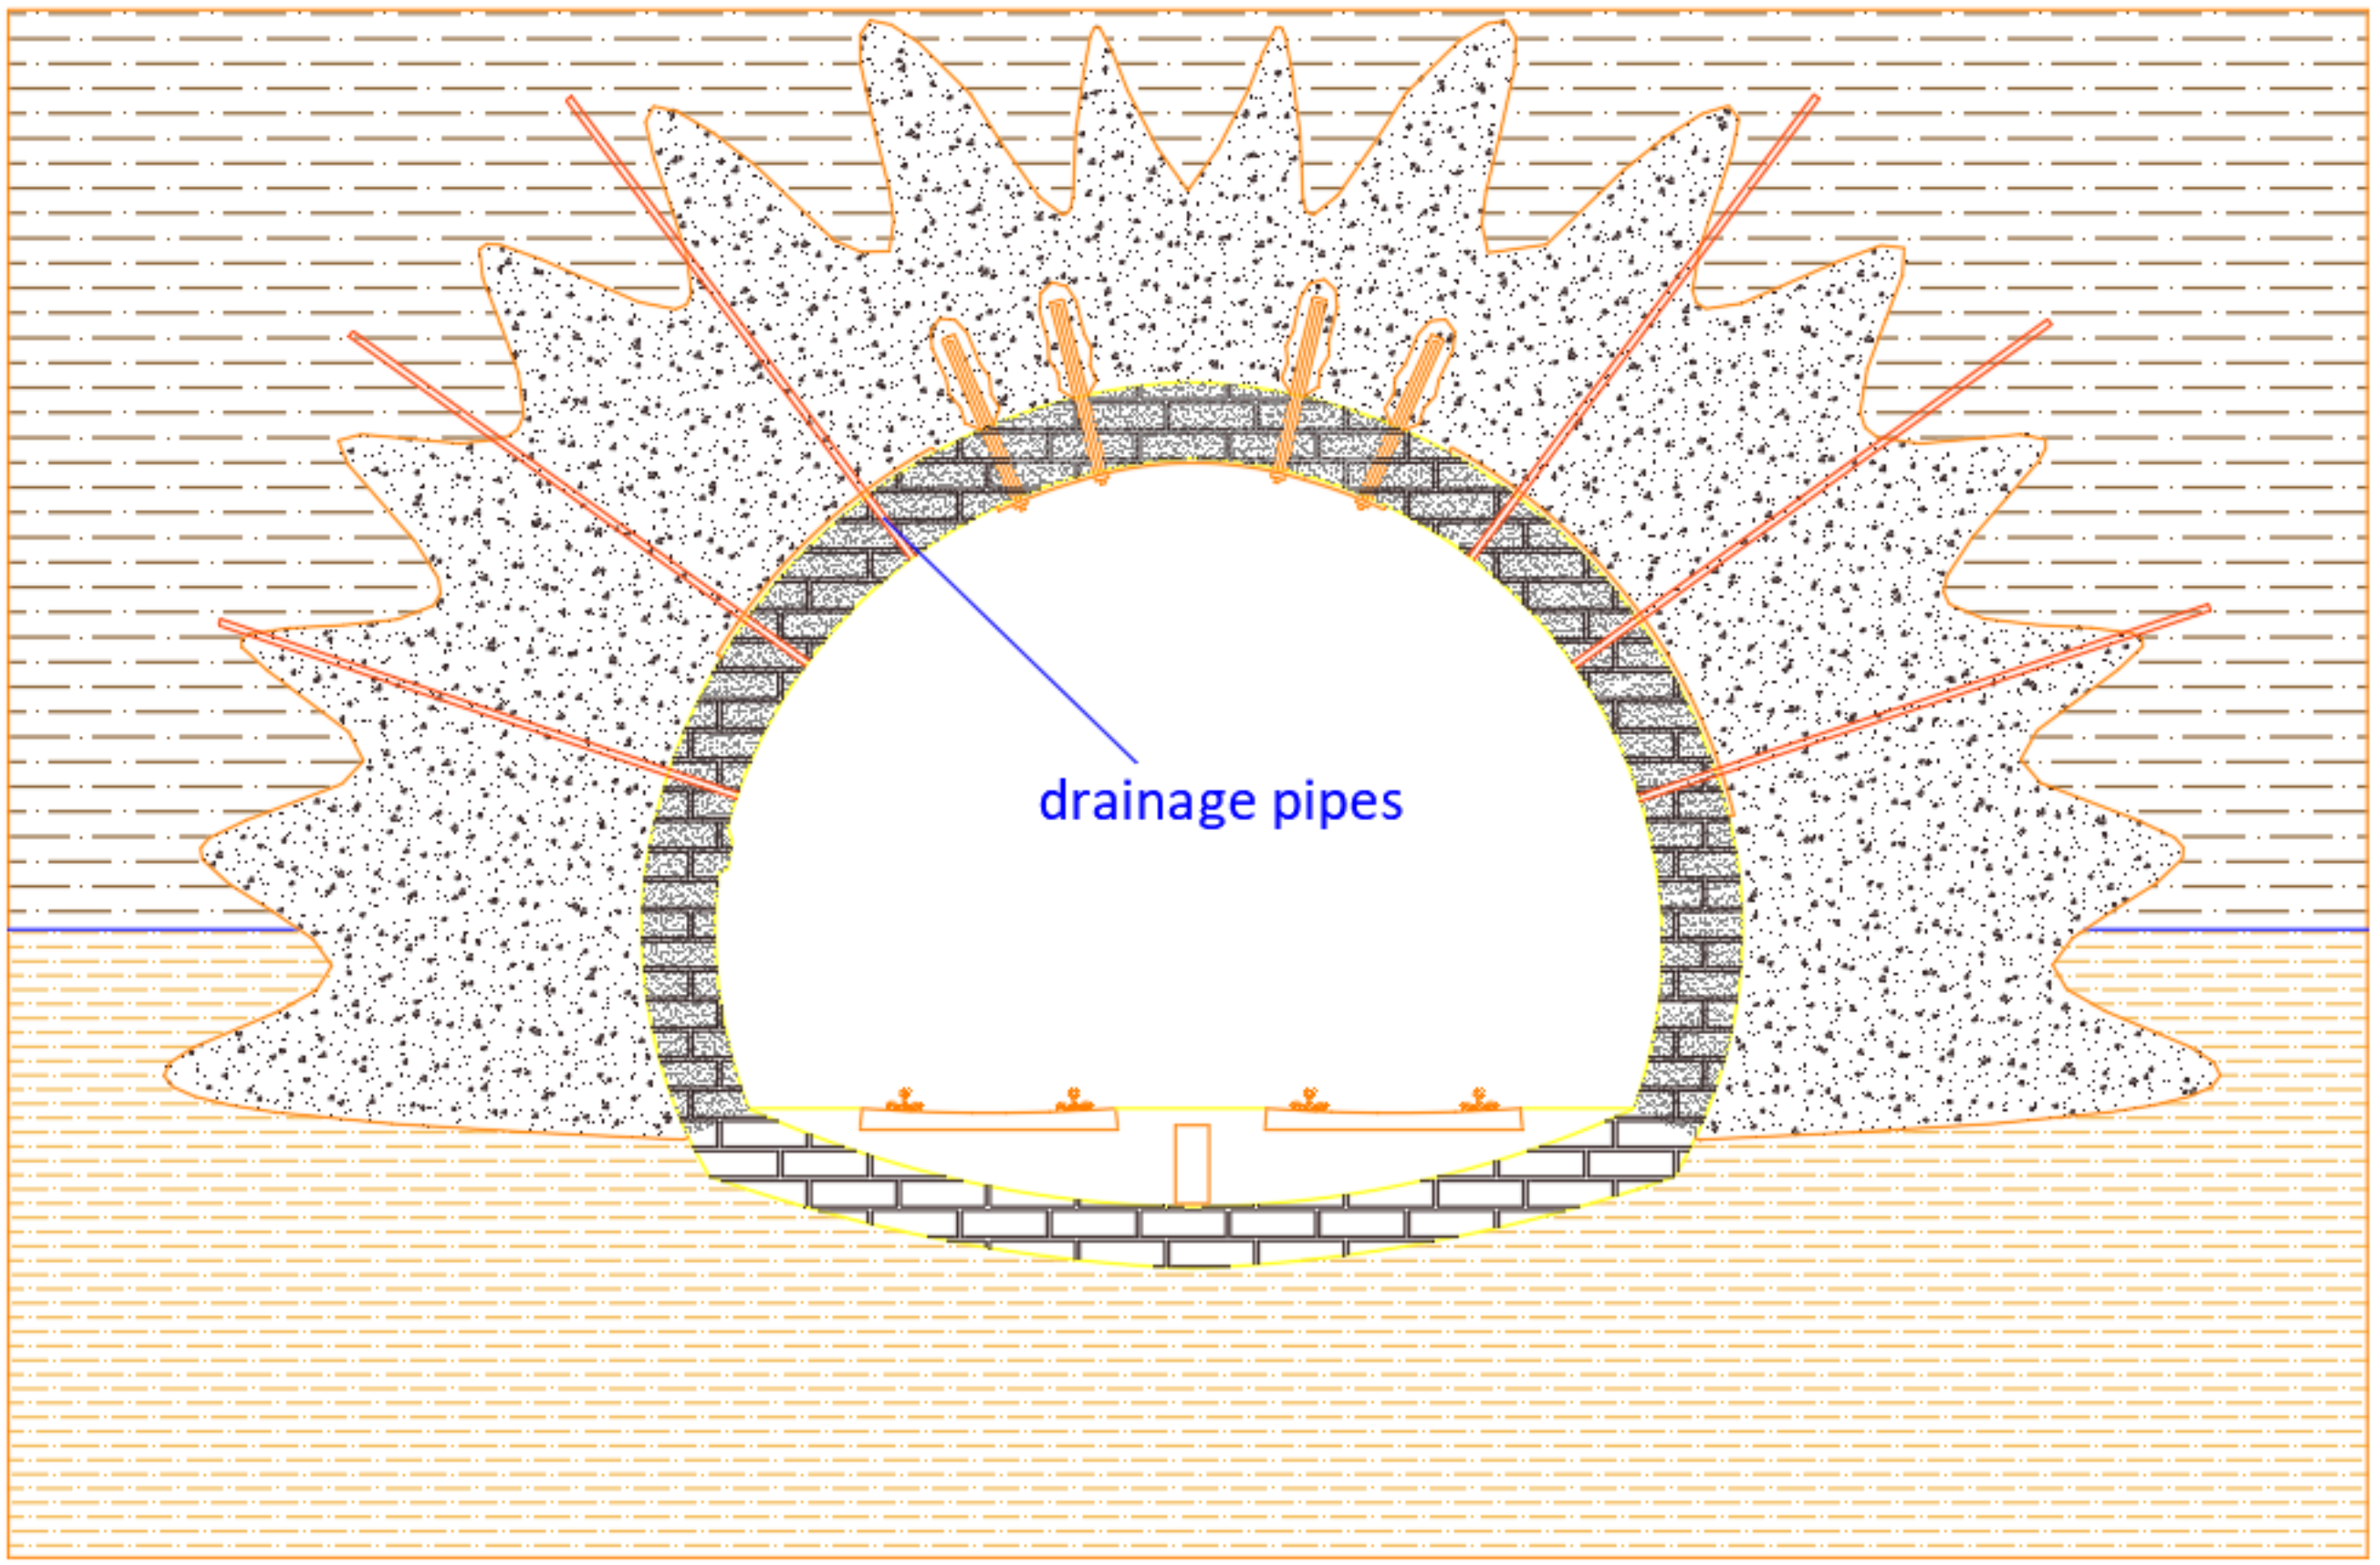
  • Realization of drainage system to collect groundwater: micro-slotted 3 m-long PVC pipes with 2.5 cm diameter have been inserted. Water captured from the drainage pipes shall be collected by a series of transversal ducts along arch and piers, and conveyed in the central duct beneath the tracks. Finally, the ducts were covered by a plastic waterproof layer, properly anchored to the lining (Figure 17)
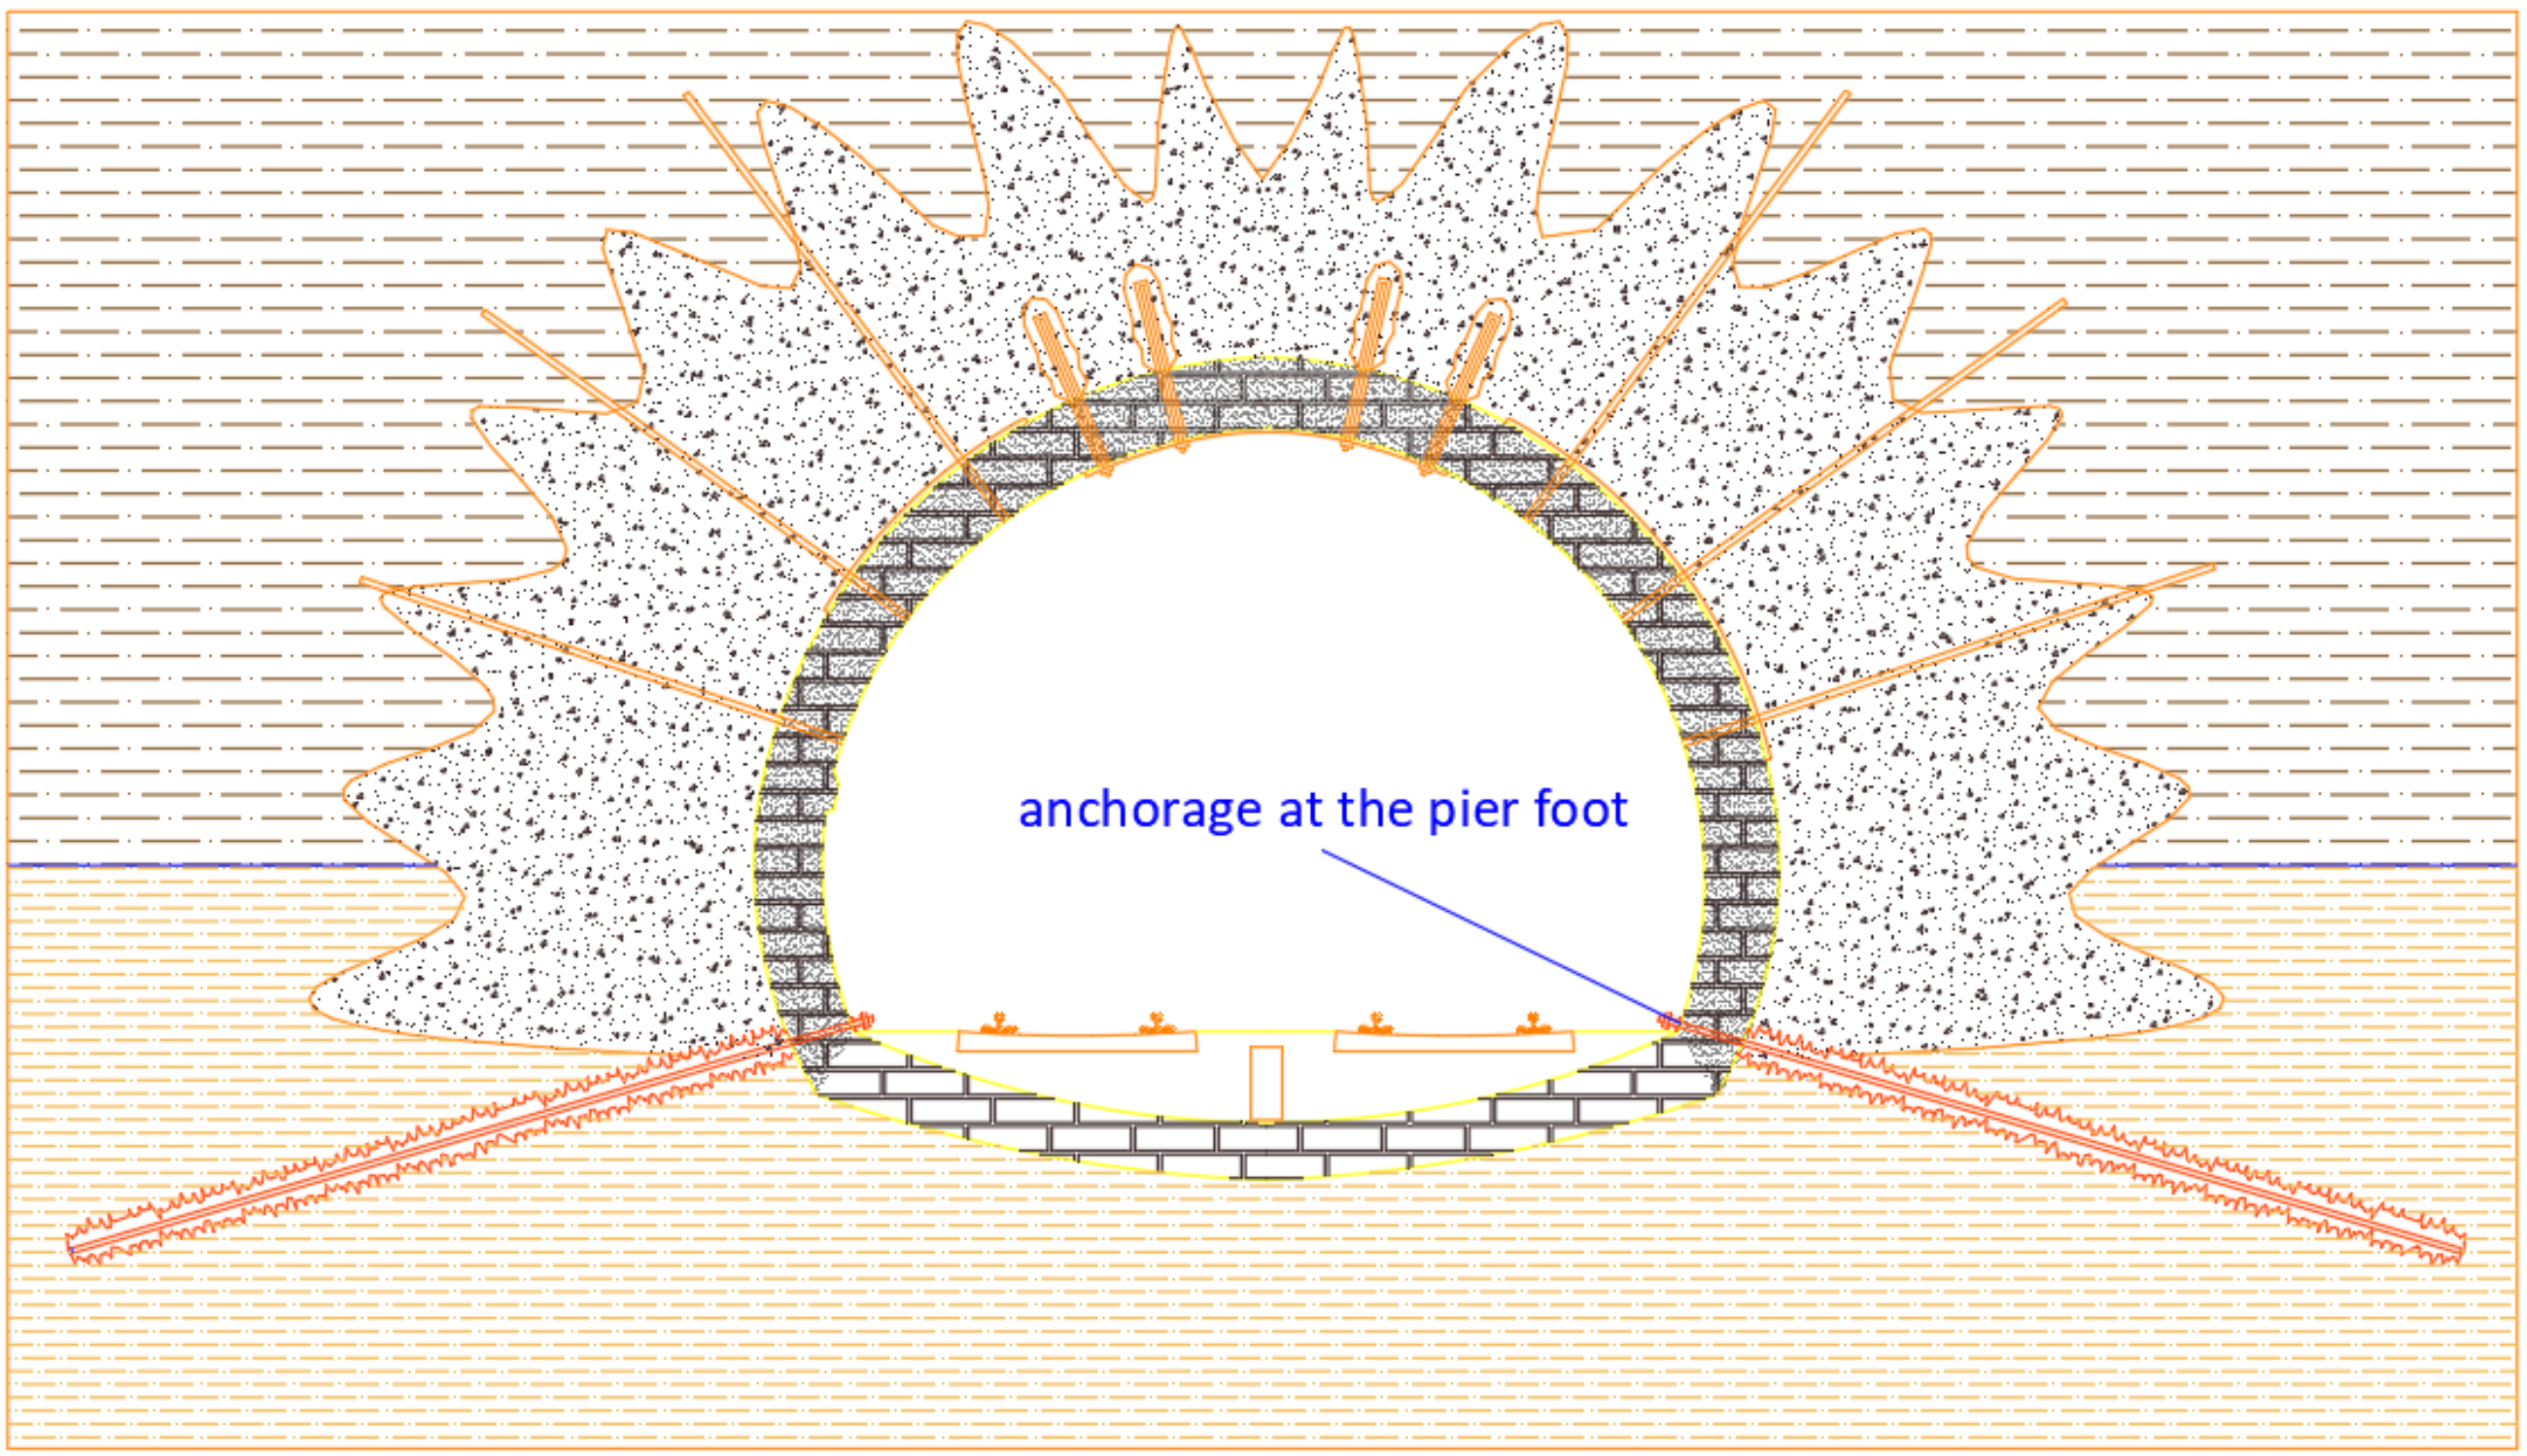
  • Realization of anchorages at the elevation of the running surface through passive bars: this work ensured a constraint at the pier foot, in the event that the tunnel concrete invert materials were not fully effective due to its degradation. This intervention constituted a prerequisite for modifying the stress conditions through the subsequent works (Figure 18)
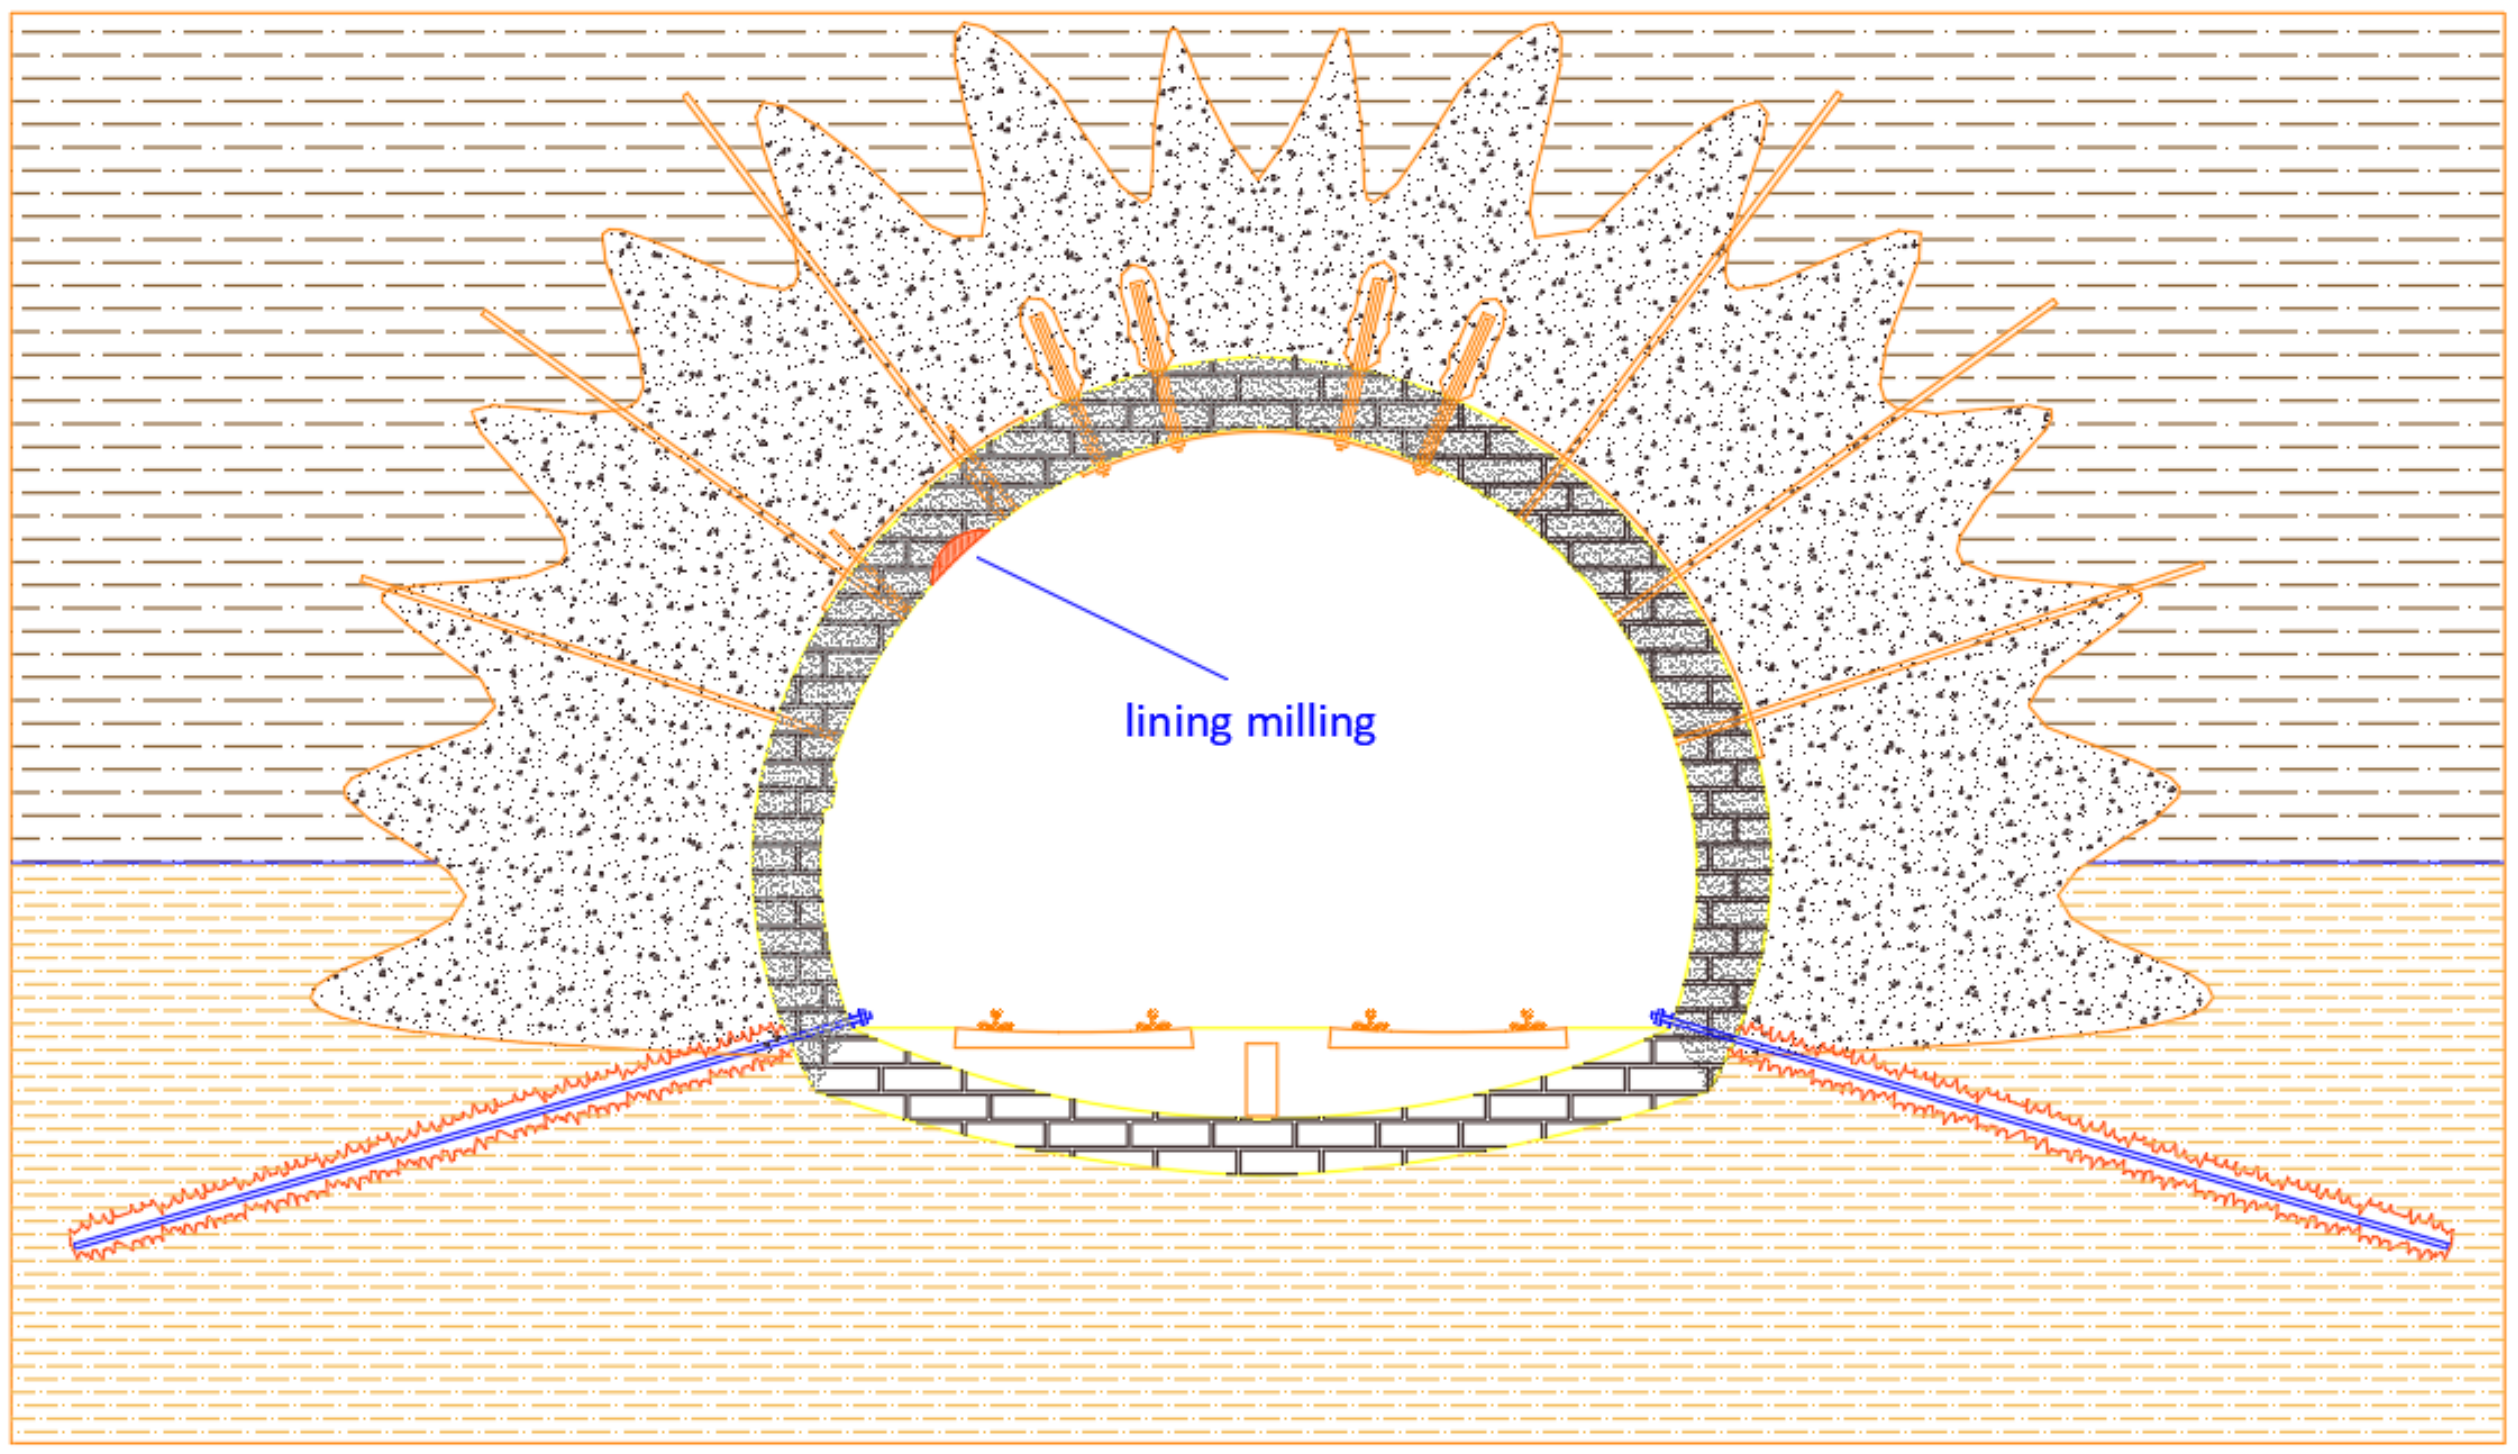
  • Installation of additional 100 cm-long metal nails to improve lining strength at the edges of the areas involved by the designed milling works (Figure 19)
At the end of the seven activities above presented, the tunnel lining was point to point milled to solve the interference verified in the first part of the study (Figure 20).
Local reinforcement has been applied where the lining was milled to restore the strength of the involved cross-section. Steel plates anchored with bolts (Figure 21) have been installed [34].
Finally, the inner surface of the masonry lining has been covered with 5–8 cm-thick layer of shotcrete reinforced with welded 10 × 10 cm, Φ 5 mm, steel mesh.
The described intervention does not concern the position and the size of the outer profile of the tunnel, which could require lining demolition (especially the tunnel invert), further excavation, waterproofing and consolidation work. Indeed, the preliminary milling operations involve only the waterproofing of the ground-lining interface, as well as the consolidation of the existing structures which constitute the tunnel. These processes are also put in place to solve problems related to groundwater infiltration from existing lining. Moreover, the track downhill operation leads to a complete interruption of the railway line, resulting in significant repercussions on users. On the contrary, nighttime train traffic interruptions (usually 4 h/night) are enough to perform milling works. Therefore, these activities do not affect the circulation of rolling stock and the line has no unfavorable repercussions.
On the other hand, the milling strategy is only profitable for spot interference sections: the track downhill operation is most necessary when interferences are evenly distributed over very long sections of the tunnel.
The experimental data obtained in the study can contribute to define a probabilistic approach for prediction of tunnel size, and clearance, along other railway lines. Indeed, the method of expansion by Hermite chaos polynomials of the measurements data set is currently under investigation in order to predict different physical characteristics (e.g., flutter speed of pedestrian bridges and aeroelastic coefficients of bridge decks) [35,36,37]. This approach could lead to a risk assessment, whose results can highlight the most hazardous conditions, and address the railway management body to appropriate measures.

4. Conclusions

Although in Europe the interest for liberalizing the railway sector has grown fast over the years, and corridors have been established to enhance rail transport, there is still a need to apply a common standardization of vehicle and structure gauge. Therefore, geometrical evaluations should be carried out to verify if the greater freedom of access to the infrastructure and the full opening of the rail freight and passenger transport are possible through the existing tunnels.
This paper presents an on-site and analytical method defined by the authors to describe the inner tunnel surfaces and the vehicle gauge. LS, thermocamera, GPS and GPR are technologies used to survey the geometrical conditions of the tunnel lining. An algorithm written by the authors allow the interpretation of the geo-referenced results, in particular for the inner profile with respect to the selected vehicle gauge.
The results permit to verify if cross sections comply with the standards. When the tunnel lining interferes with the geometrical gauge, two alternatives of interventions are possible: consolidation and milling of the intrados coating, or geometric modification of the railway track. The former is convenient when the point to point cross sections are not verified; the latter when continuative and long stretches are not verified.
In the examined railway tunnel, the authors designed consolidation and milling of the existing lining. Seven preliminary works were necessary before milling: they involved the existing masonry lining, water drainage and all structural elements that would have been suffered from stress accommodation as consequence of the lining milling.
The adopted procedure is simpler than the modification of a rail track: it does not concern the position of the tunnel in the soil, which would require further waterproofing and consolidation works, moreover it does not require the complete interruption of the railway line because often nighttime train traffic interruptions are enough to perform these works. On the other hand, this type of work has a cost per linear meter up to 10 times more than that of modification of the track.
This study points out technical solutions for railway tunnel adjustment as consequence of the policy of liberalization of the passenger service and the promotion for the freight transport. The verification processes herein presented could be used by railway agencies to support decision-making processes during strategic feasibility analyses. Moreover, the methodology could be applied also for road tunnels.

Author Contributions

Conceptualization, G.L. and R.F.; Data curation, T.P.; Formal analysis, L.M.; Investigation, G.L.; Methodology, G.L.; Software, T.P.; Supervision, G.L.; Validation, G.L., T.P. and R.F.; Visualization, R.F.; Writing—original draft, G.L. and L.M.; Writing—review & editing, G.L., L.M., T.P. and R.F.

Funding

This research received no external funding.

Acknowledgments

Part of the experimental measurements used in this study was conducted in collaboration to the Companies ETS Ingegneria and Micos SpA. The authors thank Ferrovie dello Stato Italiane SpA for having made available the tunnels during surveys.

Conflicts of Interest

The authors declare no conflict of interest.

References

  1. Di Mascio, P.; Loprencipe, G.; Moretti, L. Competition in rail transport: Methodology to evaluate economic impact of new trains on track. In ICTI2014—Sustainability, Eco-Efficiency and Conservation in Transportation Infrastructure Asset Management; Losa, M., Papagiannakis, T., Eds.; Taylor & Francis Group: Abingdon, UK, 2014; pp. 669–675. [Google Scholar]
  2. Lichtberger, B. Track Compendium: Formation, Permanent Way, Maintenance, Economics; Eurailpress: Hamburg, Germany, 2005; ISBN 3777103209, 9783777103204. [Google Scholar]
  3. Zhan, D.; Yu, L.; Xiao, J.; Chen, T. Multi-camera and structured-light vision system (MSVS) for dynamic high-accuracy 3D measurements of railway tunnels. Sensors 2015, 15, 8664–8684. [Google Scholar] [CrossRef] [PubMed]
  4. Di Mascio, P.; Loprencipe, G.; Maggioni, F. Visco-Elastic Modeling for Railway Track Structure Layers. Ing. Ferrov. 2014, 69, 207–222. [Google Scholar]
  5. Commission Regulation (EU) No 1299/2014 of 18 November 2014 on the Technical Specifications for Interoperability Relating to the ‘Infrastructure’ Subsystem of the Rail System in the European Union Text with EEA Relevance. Available online: https://eur-lex.europa.eu/legal-content/EN/TXT/PDF/?uri=CELEX:32014R1299 (accessed on 10 July 2018).
  6. Regulation (EU) No 913/2010 of the European Parliament and of the Council of 22 September 2010 Concerning a European Rail Network for Competitive Freight Text with EEA Relevance. Available online: https://eur-lex.europa.eu/LexUriServ/LexUriServ.do?uri=OJ:L:2010:276:0022:0032:EN:PDF (accessed on 10 July 2018).
  7. Special Report No. 08 of the European Court of Auditors. Rail Freight Transport in the EU: Still Not on the Right Track. Available online: https://www.eca.europa.eu/Lists/ECADocuments/SR16_08/SR_RAIL_FREIGHT_EN.pdf (accessed on 10 July 2018).
  8. Crozet, Y. Rail freight development in Europe: How to deal with a doubly-imperfect competition? Transp. Res. Procedia 2017, 25, 425–442. [Google Scholar] [CrossRef]
  9. EN (European Committee for Standardization). ILNAS EN 15273-3+A1:2016. Railway Applications-Gauges-Part 3: Structure Gauges; European Committee for Standardization: Brussel, Belgium, 2016. [Google Scholar]
  10. Diamantidis, D.; Zuccarelli, F.; Westhäuser, A. Safety of long railway tunnels. Reliab. Eng. Syst. Saf. 2000, 67, 135–145. [Google Scholar] [CrossRef]
  11. Wang, T.T.; Jaw, J.J.; Hsu, C.H.; Jeng, F.S. Profile-image method for measuring tunnel profile—Improvements and procedures. Tunn. Undergr. Space Technol. 2010, 25, 78–90. [Google Scholar] [CrossRef]
  12. Klopčič, J.; Ambrožič, T.; Marjetič, A.; Bogatin, S.; Pulko, B.; Logar, J. Use of Automatic Target Recognition System for the Displacement Measurements in a Small Diameter Tunnel Ahead of the Face of the Motorway Tunnel During Excavation. Sensors 2008, 8, 8139–8155. [Google Scholar] [CrossRef] [PubMed] [Green Version]
  13. Arastounia, M. Automated As-Built Model Generation of Subway Tunnels from Mobile LiDAR Data. Sensors 2016, 16, 1486. [Google Scholar] [CrossRef] [PubMed]
  14. Chang, C.T.; Sun, C.W.; Duann, S.W.; Hwang, R.N. Response of a Taipei Rapid Transit System (TRTS) tunnel to adjacent excavation. Tunn. Undergr. Space Technol. 2001, 16, 151–158. [Google Scholar] [CrossRef] [Green Version]
  15. Zhou, Y.; Wang, S.; Mei, X.; Yin, W.; Lin, C.; Hu, Q.; Mao, Q. Railway Tunnel Clearance Inspection Method Based on 3D Point Cloud from Mobile Laser Scanning. Sensors 2017, 17, 2055. [Google Scholar] [CrossRef] [PubMed]
  16. Hugenschmidt, J. Railway track inspection using GPR. J. Appl. Geophys. 2000, 43, 147–155. [Google Scholar] [CrossRef]
  17. Wang, W.; Zhao, W.; Huang, L.; Vimarlund, V.; Wang, Z. Applications of terrestrial laser scanning for tunnels: A review. J. Traffic Transp. Eng. 2014, 1, 325–337. [Google Scholar] [CrossRef]
  18. Chmelina, K.; Jansa, J.; Hesina, G.; Traxler, C. A 3-D laser scanning system and scan data processing method for the monitoring of tunnel deformations. J. Appl. Geod. 2012, 6, 177–185. [Google Scholar] [CrossRef]
  19. Kwon, K.W.; Lee, J.D. 3D Tunnel Shape Fitting by Means of Laser Scanned Point Cloud. J. Korean Soc. Civ. Eng. 2009, 29, 555–561. [Google Scholar]
  20. Xi, Z.F.C. The Application of the Ground Radar in the Quality Inspection of the Railway Tunnel Lining. Railw. Investig. Surv. 2006, 1, 11. [Google Scholar]
  21. Jun-Feng, L.M.J. Application of geo-radar technique in test of tunnel quality. Qual. Civ. Eng. Constr. 2007, 3, 7. [Google Scholar]
  22. Kleinová, E. Does liberalization of the railway industry lead to higher technical effectiveness? J. Rail Transp. Plan. Manag. 2016, 6, 67–76. [Google Scholar] [CrossRef]
  23. Fekete, S.; Diederichs, M.; Lato, M. Geotechnical and operational applications for 3-dimensional laser scanning in drill and blast tunnels. Tunn. Undergr. Space Technol. 2010, 25, 614–628. [Google Scholar] [CrossRef]
  24. Han, J.Y.; Guo, J.; Jiang, Y.S. Monitoring tunnel profile by means of multi-epoch dispersed 3-D LiDAR point clouds. Tunn. Undergr. Space Technol. 2013, 33, 186–192. [Google Scholar] [CrossRef]
  25. Cheng, Y.J.; Qiu, W.; Lei, J. Automatic Extraction of Tunnel Lining Cross-Sections from Terrestrial Laser Scanning Point Clouds. Sensors 2016, 16, 1648. [Google Scholar] [CrossRef] [PubMed]
  26. Gikas, V. Three-dimensional laser scanning for geometry documentation and construction management of highway tunnels during excavation. Sensors 2012, 12, 11249–11270. [Google Scholar] [CrossRef] [PubMed]
  27. Zhang, W.; Zhang, Z.; Qi, D.; Liu, Y. Automatic crack detection and classification method for subway tunnel safety monitoring. Sensors 2014, 14, 19307–19328. [Google Scholar] [CrossRef] [PubMed]
  28. Medina, R.; Llamas, J.; Gómez-García-Bermejo, J.; Zalama, E.; Segarra, M. Crack detection in concrete tunnels using a gabor filter invariant to rotation. Sensors 2017, 17, 1670. [Google Scholar] [CrossRef] [PubMed]
  29. Göbel, C.; Hellmann, R.; Petzold, H. Georadar-model and in-situ investigations for inspection of railway tracks. In Proceedings of the 5th International Conference on Ground Penetrating Radar, Kitchener, ON, Canada, 12–16 June 1994; pp. 1101–1106. [Google Scholar]
  30. Walkenbach, J. Excel 2010 Power Programming with VBA (Vol. 6); John Wiley & Sons: Hoboken, NJ, USA, 2010. [Google Scholar]
  31. Pestillo, T. Geometria del Profilo Delle Gallerie Ferroviarie: Metodi di Misura, Algoritmi di Verifica e Proposte di Adeguamento. Master’s Thesis, Sapienza University of Rome, Rome, Italy, 2017. [Google Scholar]
  32. Tommasi, P.; Verrucci, L.; Rotonda, T. Mechanical properties of a weak pyroclastic rock and their relationship with microstructure. Can. Geotech. J. 2014, 52, 211–233. [Google Scholar] [CrossRef]
  33. UIC Code 506. Rules Governing Application of the Enlarged GA, GB and GC Gauges, 1st ed.; Union Internationale des Chemins de fer: Paris, France, 1987. [Google Scholar]
  34. Song, G.; Li, W.; Wang, B.; Ho, S.C.M. A review of rock bolt monitoring using smart sensors. Sensors 2017, 17, 776. [Google Scholar] [CrossRef] [PubMed]
  35. Rizzo, F.; Caracoglia, L.; Montelpare, S. Predicting the flutter speed of a pedestrian suspension bridge through examination of laboratory experimental errors. Eng. Struct. 2018, 172, 589–613. [Google Scholar] [CrossRef]
  36. Rizzo, F.; Caracoglia, L. Examination of experimental errors in Scanlan derivatives of a closed-box bridge deck. Wind Struct. 2018, 26, 231–251. [Google Scholar]
  37. Brito Pina, R.; Caracoglia, L. Extraction of Flutter Derivatives from Small-Scale Wind Tunnel Experiments. In Proceedings of the 11th Americas Conference on Wind Engineering, San Juan, Puerto Rico, 22–26 June 2009. [Google Scholar]
Figure 1. Image of a railway tunnel obtained through laser scanning technique.
Sustainability 10 03145 g001
Figure 2. Basic setup for triangulation-based laser scanner.
Sustainability 10 03145 g002
Figure 3. Phase comparison method of measuring distance.
Sustainability 10 03145 g003
Figure 4. Image of a railway tunnel obtained through laser scanning technique.
Sustainability 10 03145 g004
Figure 5. Comparison of LS and thermocameras images.
Sustainability 10 03145 g005
Figure 6. Example of a radargram.
Sustainability 10 03145 g006
Figure 7. Flow chart of geometrical verification.
Sustainability 10 03145 g007
Figure 8. Variables of the loading gauge (for ρ > π and for ρ ≤ π).
Sustainability 10 03145 g008
Figure 9. Method to verify the point position of vehicle gauge relatively to inner geometry of tunnel.
Sustainability 10 03145 g009
Figure 10. Railway wagon used in the study.
Sustainability 10 03145 g010
Figure 11. Loading gauge P/C80 (unit in m). Red lines represent the loading gauge along curve track, green lines represent the loading gauge along straight track.
Sustainability 10 03145 g011
Figure 12. Section of tunnel (unit in mm) where loading gauges intersect upon the intrados.
Sustainability 10 03145 g012
Figure 13. Cleaning of the intrados with high-pressure sand washers.
Sustainability 10 03145 g013
Figure 14. Injections for the consolidation of the excavated surface.
Sustainability 10 03145 g014
Figure 15. Lining consolidation with resin.
Sustainability 10 03145 g015
Figure 16. Reinforcement of the crown.
Sustainability 10 03145 g016
Figure 17. Realization of drainage system.
Sustainability 10 03145 g017
Figure 18. Realization of passive-type bars at the piers foot.
Sustainability 10 03145 g018
Figure 19. Installation of metal nails in the areas involved in the designed milling works.
Sustainability 10 03145 g019
Figure 20. Point to point lining milling.
Sustainability 10 03145 g020
Figure 21. Point to point lining reinforcement.
Sustainability 10 03145 g021

