Article

A Systematic Initial Study of Civic Scientific Literacy in China: Cross-National Comparable Results from Scientific Cognition to Sustainable Literacy

1
School of Mathematical Sciences, Faculty of Science, Zhejiang University, 4/F, Teaching Bldg. 1138 Zheda Road, Hangzhou 310027, Zhejiang, China
2
Department of Civil Engineering, College of Engineering, National Kaohsiung University of Science and Technology, 5/F, Civil Engr. Bldg. 1415 Jiangong Road, Sanmin Dist., Kaohsiung 80778, Taiwan
3
Laboratorio de Pesquisa do Centro de Processamento de Dados, Faculty of Science and Technology, Universidade de Macau, G001, Bldg. N21, Avenida da Vitoria, Ilha da Montanha, Macau SAR, China
*
Author to whom correspondence should be addressed.
Sustainability 2018, 10(9), 3129; https://doi.org/10.3390/su10093129
Submission received: 3 July 2018 / Revised: 18 August 2018 / Accepted: 20 August 2018 / Published: 2 September 2018

Abstract

:
Civic scientific literacy (CSL) is an important factor for the development of any country, and this is especially true for a country which is under development and at the same time pursues sustainability. In this article, we conduct the firstly systematic study of CSL in China based on survey data in 2013. Under the multi-dimension CSL framework and by using item response theory, we assess the CSL level in China, which can be fairly compared with that in U.S. and Europe (US-EU). The comparable survey results provided a number of implicational findings: for example, the status of CSL of China in 2013 would have ranked as middling and poor compared to the CSL results for the various US-EU countries in 1995 and 2005, respectively. Some group-based analyses were also conducted to show how people’s attitudes to the environment and socio-environmental behaviours correlate with the CSL-qualified rate in China. The empirical results provided by this study not only can serve as references for improving CSL in China or other emerging countries that also address the sustainability issues during development, but could also serve as indicators for future studies (e.g., in causational modelling).

1. Introduction

1.1. Background

The measures of civic scientific literacy (CSL) are plentiful and varied. An adopted measure usually connotes a different interpretation of and a divergent view of CSL than those connoted by other measures, and such distinctions may greatly affect the process of undertaking CSL surveys, as well as the degree to which the results of different surveys can be clearly understood and compared.
The discussion and study of scientific literacy is a central concern in many areas of the social sciences, and scholars’ understanding of scientific literacy is continually being updated. In a pair of recent works from 2007, for example, Roberts presented two visions offering somewhat different definitions of scientific literacy: Vision I is rooted in the products and processes of science, while Vision II involves the character of situations with a scientific component, including situations that students are likely to encounter as citizens [1,2]. Meanwhile, the OECD PISA (Programme for International Student Assessment, The Organisation for Economic Cooperation and Development) framework defines scientific literacy as ‘the ability to engage with science-related issues, and with the ideas of science, as a reflective citizen’ [3]. It should be noted, furthermore, that there are numerous topics related to scientific literacy, including the role of citizenry participation [4], fundamental sense [5,6], scientific discourse, and socio scientific issues and argumentation [7,8].
In particular, the influence of sustainability literacy education on CSL (as a key factor to form and determine citizens’ CSL) is seen in many existing studies [9,10,11,12]. In this article, however, we focus specifically on the measures of civic scientific literacy and its social-environment impact.

1.2. Review of Related Literature

In North America, the study of CSL can be traced back to the 1950s. In 1957, the National Association of Science Writers (NASW) investigated the understanding and attitude of the public toward scientific technologies in the U.S. In later decades, the National Science Foundation (NSF) supported a number of CSL investigations chaired by Miller [13,14,15,16]. These studies not only revealed the relevant facts of CSL in the U.S., but also drove the development of a ‘3D measure’. The multiple dimensions involved can be identified from the design of Miller’s questionnaires, which usually contained five question modules focusing on the following topics: the subject’s personal information and attributes; the subject’s lifestyle and degree of interest in scientific matters; the subject’s recognition of basic scientific concepts; the subject’s degree of understanding of scientific inquiry; and the subject’s thoughts regarding the importance of science and technology). A close examination of the said questionnaire design indicates the following three dimensions:
  • The concept dimension: a vocabulary of basic scientific constructs sufficient to read and debate various views;
  • The inquiry dimension: an understanding of the process or nature of scientific inquiry (or ‘true research’);
  • The social-impact dimension: an understanding of the impact of science and technology on human individuals or society.
In essence, the first two dimensions relate to the scientific cognition of the public. Hence, these are the main objectives of a ‘measurement’ for CSL. In contrast, the social-impact dimension would be more like the consequence of the CSL level of the public, which might affect the public’s attitude and behaviour to a country’s development in terms of society, economy, or environment. Of most importance is that people’s CSL levels that are polled along these dimensions will strongly affect their sustainable literacy [9,10,11].
In Europe, meanwhile, in 1989, Durant, Evans, and Thomas [17] suggested that CSL should be investigated in terms of the following four dimensions: (1) scientific knowledge; (2) interest in science; (3) overall attitude toward science; and (4) attitude toward various scientific debates (e.g., transgenosis). Accordingly, in 1995, Evans and Durant [18] analysed the relationship between the ‘attitude’ and ‘knowledge’ dimensions. In another study, by using data measured in these two dimensions, Bauer, Durant, and Evans [19] demonstrated the gaps in the levels of CSL among the peoples of different European countries and identified the relationship between a country’s standard of industrialization and its CSL level. As can be seen, although the focus of the studies by Evans and Durant and Bauer et al. differed, they both essentially looked at CSL in terms of the four dimensions suggested by Durant et al. However, in spite of that similarity, those researchers did not reach a consensus regarding the measurement of each dimension, nor were the dimensions being woven together into a systematic measurement framework.
Nonetheless, these earlier works inspired a number of initial CSL surveys in other countries, e.g., Japan, Brazil, India, and China [20], during the 1990s. Most of these questionnaires followed either the 3D measure of the studies led by Miller or the four-dimensional design suggested by Durant et al. This was also true for subsequent CSL studies conducted in the year 2000 or after [21,22,23,24], although in fact, different questions were typically asked by the various studies (depending upon the subjects involved and the specific purpose of the given study).
The above works also encompassed an important methodological improvement: the utilization of quantitative methods. For the first time, Miller [25] introduced two data-analysis methods: confirmatory factor analysis (CFA) and item response theory (IRT) [22,26]. The former was used to identify the number of factors in a dimension, while the latter was used to compose a ‘summary measure’ for the dimension. These methods were then applied to analyse/compare the data sourced from different regions at different time periods (e.g., the CSL survey data collected in 1995 and the Euro-barometer data surveyed in 1992). Eventually, the two summary measures for both the ‘concept’ and ‘inquiry’ dimensions were suggested as the basis for a ‘quantitative CSL measurement’, while the one for the ‘social-impact’ dimension was not included because of between-country variance. Since then, quantitative measurement has strongly affected subsequent CSL studies (e.g., [24,27,28,29,30]) because it ensures the establishment of a scalable measure, enabling a more grounded analysis based on the results.
Given the fruitful surveys conducted around the world and mature quantitative measuring, the cross-cultural issue of CSL should be an interesting topic which is worthy of study, since it has been addressed in many fields, e.g., public policy, public health, public attitude, and so on [31,32,33]. King et al. [34] noted that “comparability of measurement in the cross-cultural (or cross-national) survey context is a hot issue still in discussion”, while it is observed that the ‘anchoring vignettes method’ has been widely applied in areas of health survey, political analysis, empirical economics [35,36,37], etc.

1.3. Research Purposes

In the overall field of CSL studies, only a few studies (e.g., [14]) have made cross-national comparisons. However, as in other fields of study focused on the general public in different countries, a clear understanding of cross-cultural matters essentially requires that more cross-national comparisons be made. To that end, this study sought to compare CSL results from China with those from the U.S. and Europe (US-EU). It was expected that such a comparison would provide meaningful insights because of the large cultural gap between the regions.
The other major objective of this study focused, meanwhile, on the stage before the said comparison: specifically, we endeavoured to ensure that the survey conducted in this study was designed in a manner such that the analytical results from China could be compared ‘fairly’ with those from the US-EU. In turn, according to the authors’ knowledge, a number of CSL surveys have been conducted in China in the past, but none of those surveys provided results suitable for a cross-national comparison. Such incomparability is mainly due to the flawed methods used by those earlier CSL studies conducted in China. In order to avoid this, this study used the aforementioned 3D measure to investigate CSL in China, in addition to using IRT to assess both CSL levels and the question parameters. Because the 3D measure is not merely provisional [25,38,39] and because IRT has been verified for a long time (e.g., by Miller based on data collected over several decades [16]), the results of the present study could, therefore, be compared fairly and smoothly with those from the US-EU.
The remainder of this article is presented in five sections. The second section begins with a historical review of the previous China-based CSL studies, followed by an analysis of their critical flaws. The survey (and the questionnaire design) of this study is also introduced. The third section establishes the IRT model, estimates the parameters for the various survey items, and provides an assessment of the CSL level for each respondent. In addition, a cross-country comparison of the survey questions that overlapped with those of the US-EU survey used for the comparison is provided, while the overall distribution of CSL levels in China is also shown. In the fourth section, frequency analyses are made for the stratified sample groups (i.e., in-country comparisons are made). In the fifth section, we discuss the overall CSL-qualified rates of the different countries and compare them. The possible contributions and the implication for policy and practice of our study are also summarized in the sixth section. The seventh section concludes the article and the eighth section gives some suggestions for future research.

2. Civic Scientific Literacy (CSL) Studies in China

2.1. The History of CSL Studies in China

2.1.1. Initial Government Surveys and Academic Studies

The first CSL survey conducted in China began in 1990, sometime after the first such studies were conducted in Europe, the U.S., and Japan (see the official document entitled “Action Plans Outline for Nation’s Science Literacy” (translated) [40]). Since then, 10 government surveys have been successfully conducted by China’s Ministry of Science and Technology and China Association of Science and Technology (CAST). These surveys covered 32 provinces, and the number of respondents in the survey samples increased each time. For example, the 2010 survey included a total effective sample of 69,360 respondents.
Other than government surveys/reports, the first academic work to give scientific explanations regarding the survey data collected in China was perhaps the 1993 study by Zhang and Zhang [41]. That study revealed the major ‘channels’ and ‘understandings’ of the citizens (in particular, the degree to which the people surveyed understood various scientific concepts, e.g., ‘DNA’, ‘computer software’, etc.), as well as their ‘attitude’ toward science, based on the survey data from 1990.

2.1.2. Research Framework for the Present Studies

Subsequently, the Division of Scientific Literacy Research (a division of the China Research Institute for Science Popularization) undertook the responsibility of processing/analysing the data from the surveys. Every two years, scholars are invited to join a ‘round’ of statistical works. After each round, a press conference is held to publicize a digest report announcing the main outcomes. The detailed report (entitled ‘The Report of Chinese CSL’, translated) is not published, but is kept for inter-departmental access [42,43,44]. Some important points about these ‘rounds’ are discussed below.
Firstly, during each ‘round’, the rule used to determine whether or not a respondent possesses CSL consists of seeing if a predefined number of ‘understanding’ questions are answered correctly and if a sufficient number of answers given to the ‘interests’ and ‘channels’ question blocks (refer to point 3) is counted. A respondent’s answers to all questions in a dimension are examined and counted with an equal weight, and a ‘correct-answering rate’ (CAR) score is obtained. For each dimension, a pro-rata-based ‘correct answering rate threshold’ (CART) is set as the criteria to filter the CARs, so as to judge whether a respondent does or does not possess CSL.
Next, the design of the first questionnaire block ensures sample stratification by some characteristics (e.g., job). This serves a statistical purpose from the beginning: the proportion of people possessing CSL in each sample group can be analysed based on the results of the individuals. Note that this study also follows such a method, but the analytical target will be the latent CSL levels, instead of the straightforward CARs.
Finally, as each round had produced result data, an analysis over a specific time span was performed. For example, Lei, Feng, and Xiaoyan compared the CARs to some questions and found the observable changes [45].

2.1.3. Questionnaires

Roughly speaking, a questionnaire used in China was usually organized by following the dimensions used in the US-EU. It usually contained four question blocks aimed, respectively, at investigating the following topics:
  • The personal information and attributes of the surveyed subject (‘background’ hereinafter);
  • The subject’s degree of interest in scientific matters and the usual channels from which scientific information is received (‘interest and channel’);
  • The level of science understanding, including the recognition of basic scientific concepts and the understanding of scientific inquiry (‘understanding’);
  • The subject’s attitude toward science and technologies (‘attitude’).
As can be also observed in the questionnaire samples, most of the questions were asked repeatedly. For clarity, these are defined as a ‘usual question set in China’ (C-UQS).

2.2. The Observable Drawbacks

2.2.1. Excessively Assertive CSL Judgments

As discussed, the previously conducted surveys of China have used a CART to threshold the CAR scores, so as to determine whether or a respondent possesses CSL. However, such a process is lacking due consideration because in any CSL survey, each question item should have a different priority of importance and discrimination, and thus a different degree of contribution to the overall level of CSL being assessed. Moreover, for these surveys, the value of the CART was often subjectively (arbitrarily) chosen. In other words, this monotonous process lacks not only a proper prioritization of the individual questions, but also a grounded thresholding mechanism.

2.2.2. The Incomparable Results Problem

Due to the use of a CART to determine which respondents do/do not possess CSL, the outcomes of these surveys cannot be compared with those from other countries because of result heterogeneity, even if the questionnaire was organized in a similar manner or the questions were identical. In fact, given the fruitful and retrospective survey data from China, few experiments have ever realized a real sense of ‘multi-dimensional CSL measurement’, to say nothing of considering the variety and priority of the questions by estimating the item parameters. As a consequence, it has not been possible to compare the results of those surveys from China with those from other countries, such that any claims made regarding their findings are lacking a firm foundation.

2.2.3. Unidentified Effectiveness of Each Question

As discussed in (1), the CSL studies previously conducted in China failed to identify the discrimination of each question and its individual contribution to the assessed CAR score. Moreover, in addition to the priority issues and varieties of the questions, the effectiveness issue (which is about whether or not a question should even be included and asked) is also important. This is also exactly the reason for drawback (4).

2.2.4. Using Repeated Questions, Some of Which Are Perhaps Outdated

In surveys conducted all over the world, the question sets have been altered over time. However, in China, since the CSL studies did not examine the effectiveness of each question (3), the C-UQS was not frequently updated, i.e., the various C-UQS of relatively recent surveys were largely identical to those of older surveys.
In summary, the above drawbacks might deter the dissemination of CSL results from China and their comparison with results from other countries. As such, these drawbacks could result in a waste of the data’s potential to make contributions to the social sciences. The present study sought to remedy these flaws.
Methodologically, this study developed an effective measurement framework by reference to the 3D measure and through the use of IRT, as a ‘slope’ is a widely accepted concept of IRT that has been used to represent a question’s discrimination (and thus its contribution to the measured dimension) in many other CSL studies. Given a CSL survey/study in China conducted by strictly following these approaches from the beginning, with the exception of the CSL level being assessed latently for each respondent, the parameters for each question can be estimated. As such, not only can drawbacks (1)–(3) discussed above be mitigated, the survey results can also be compared cross-nationally, in a fair and meaningful way, such that plausible implications can be expected. As for drawback (4), this study did not aim to resolve it completely, but to alleviate it. With the original purpose of providing guidance for updates to questionnaires for future surveys conducted in China, this study sought to identify the outdated parts of the existing C-UQS. Fortunately, with IRT modelling, those unsuitable questions could easily be identified.

2.3. Survey/Analysis Works of This Study

The survey used in this study was conducted province-wide in Zhejiang, China. The reasons, in addition to budget limitations, for the selection of this investigation area are summarized in Appendix A. The main reasons were to ensure that the survey sample had relatively high representativeness and that the analytical results had relatively high comparability.
The survey was conducted in 2013 by the Zhejiang Science and Technology Association, which funded the ‘2013 Zhejiang Civic Literacy Sampling and Surveying’ work. This survey covered 10 of the 11 ‘first-tier cities’ of Zhejiang, while one was excluded because of long sailing. Among all the respondents, a total of 11,818 surveys were shown to be effective.
While an important purpose of this study was to identify any outdated questions, the questionnaire included most of the questions in the C-UQS and followed the ‘four-blocks-design’ structure (see II.A.3 Questionnaires). The questions polled for the understanding of scientific inquiry (i.e., the ‘inquiry’ questionnaire block) are detailed in Appendix B as a supplementary material. While another important purpose of this study was to make cross-country comparisons of not only the assessed CSL levels but also the estimated question parameters (see II.B The Observable Drawbacks), an intersection between the questionnaire used in China and the question sets used in the US-EU was also ensured (see III.C Comparing the Question Parameters Cross-nationally).
The first and second ‘background’ and ‘channel’ blocks of the questionnaire served as the basis for stratifying the overall sample, which in turn allowed for the relevant frequency analyses (see II.A.2 Research framework for the present studies). In other words, this stratification enabled the in-country comparisons. The third ‘understanding’ block contained 27 questions designed for the two ‘reasonably comparable’ dimensions, that is, the ‘concept’ and ‘inquiry’ dimensions [13,14]. The ‘concept’ dimension included 22 true-false or multiple-choice objective questions. The ‘inquiry’ dimension involved 5 questions and, among those, 3 were multiple-choice objective questions and 2 were multiple-choice subjective questions. Finally, since the last ‘social-impact’ dimension of the 3D measure is still in dispute, relevant analysis based on the fourth ‘attitude’ block was not performed.
By applying IRT, answers to the 22 ‘concept’ questions were used to estimate the item response parameters for each question and to assess the ‘CSL latent variable’ value associated with each respondent. A respondent whose variable value was larger than 67 was viewed as ‘understanding the scientific concepts involved’ and thus was treated as ‘possessing CSL’ in this dimension [14,15]. As for the ‘inquiry’ dimension, given a limited number of questions, this study followed the approach used in the 1998 study conducted by Miller. Specifically, a respondent who had correctly answered 2 (of the 3) objective questions and had neither religious beliefs (according to one investigation [46], 47% of people in China are atheists because China is an atheist country, which is a salient contrast to the rest of the world (i.e., only 13% of the people in the rest of the world are atheists), and therefore, using a respondent’s religious beliefs as a supplement to judgment should be reasonable in China) nor astrological interests (as polled by the 2 subjective questions) was treated as ‘possessing CSL’ in this dimension, because he/she ‘has understood the nature of scientific inquiry’.
For clarity, the body of the research framework of this study, in terms of methodology, is summarized in Figure 1 overall. This also guides the progress of this study.

3. Methodology: Analysing the CSL Level in China by Item Response Theory

This section first introduces the constructed IRT model, then provides the estimations of the item parameters based on the survey data. Item parameters obtained for the questions identical to those asked in the US-EU are then compared cross-nationally. Since the latent CSL variable values of the investigated citizens were also assessed with the above process, the results from an overall distribution analysis of those values are also shown.

3.1. Item Response Modelling

This study adopted tri-parameter logistic regression for IRT modelling. IRT is a theory that is widely applied in educational research and psychology fields. It involves a way to measure the ‘potential ability’ of a respondent by asking a set of test questions, each of which is termed an ‘item’. The approach uses a quantized latent variable to connote one’s potential ability, e.g., intelligence level, knowledge level, among others. For its definitions, please refer to [47,48,49].
The model has been usually constructed as follows:
T ( θ j ; Ψ i ) = c i + 1 c i   1 + e a i ( θ j b i )
where Ψ i = { a i , b i , c i } is a parameter set for the i-th test question item, in which ai is the discrimination (slope parameter) of the question, bi is the difficulty (threshold parameter) of the question, and ci is the lower asymptotic parameter (guessing parameter); θ j is the latent variable connoting the j-th respondent’s CSL level. (With the model, the parameter set Ψ i = { a i , b i , c i } for a question, when solved as: Ψ i * = {   a i * , b i * , c i * } , is used to check the effectiveness (i.e., the validity and efficacy) of the question for any given i. Among these parameters, ci is the lower asymptotic parameter for the basic probability that a respondent can guess and give a correct answer without any scientific knowledge about the i-th question. Parameter bi, which implies the difficulty of the i-th question, is the potential ability required for a respondent to have half of a chance to answer that question correctly. Parameter ai, which represents the discrimination of the i-th question, is defined by the square of the maximal tangent slope of the curve.)

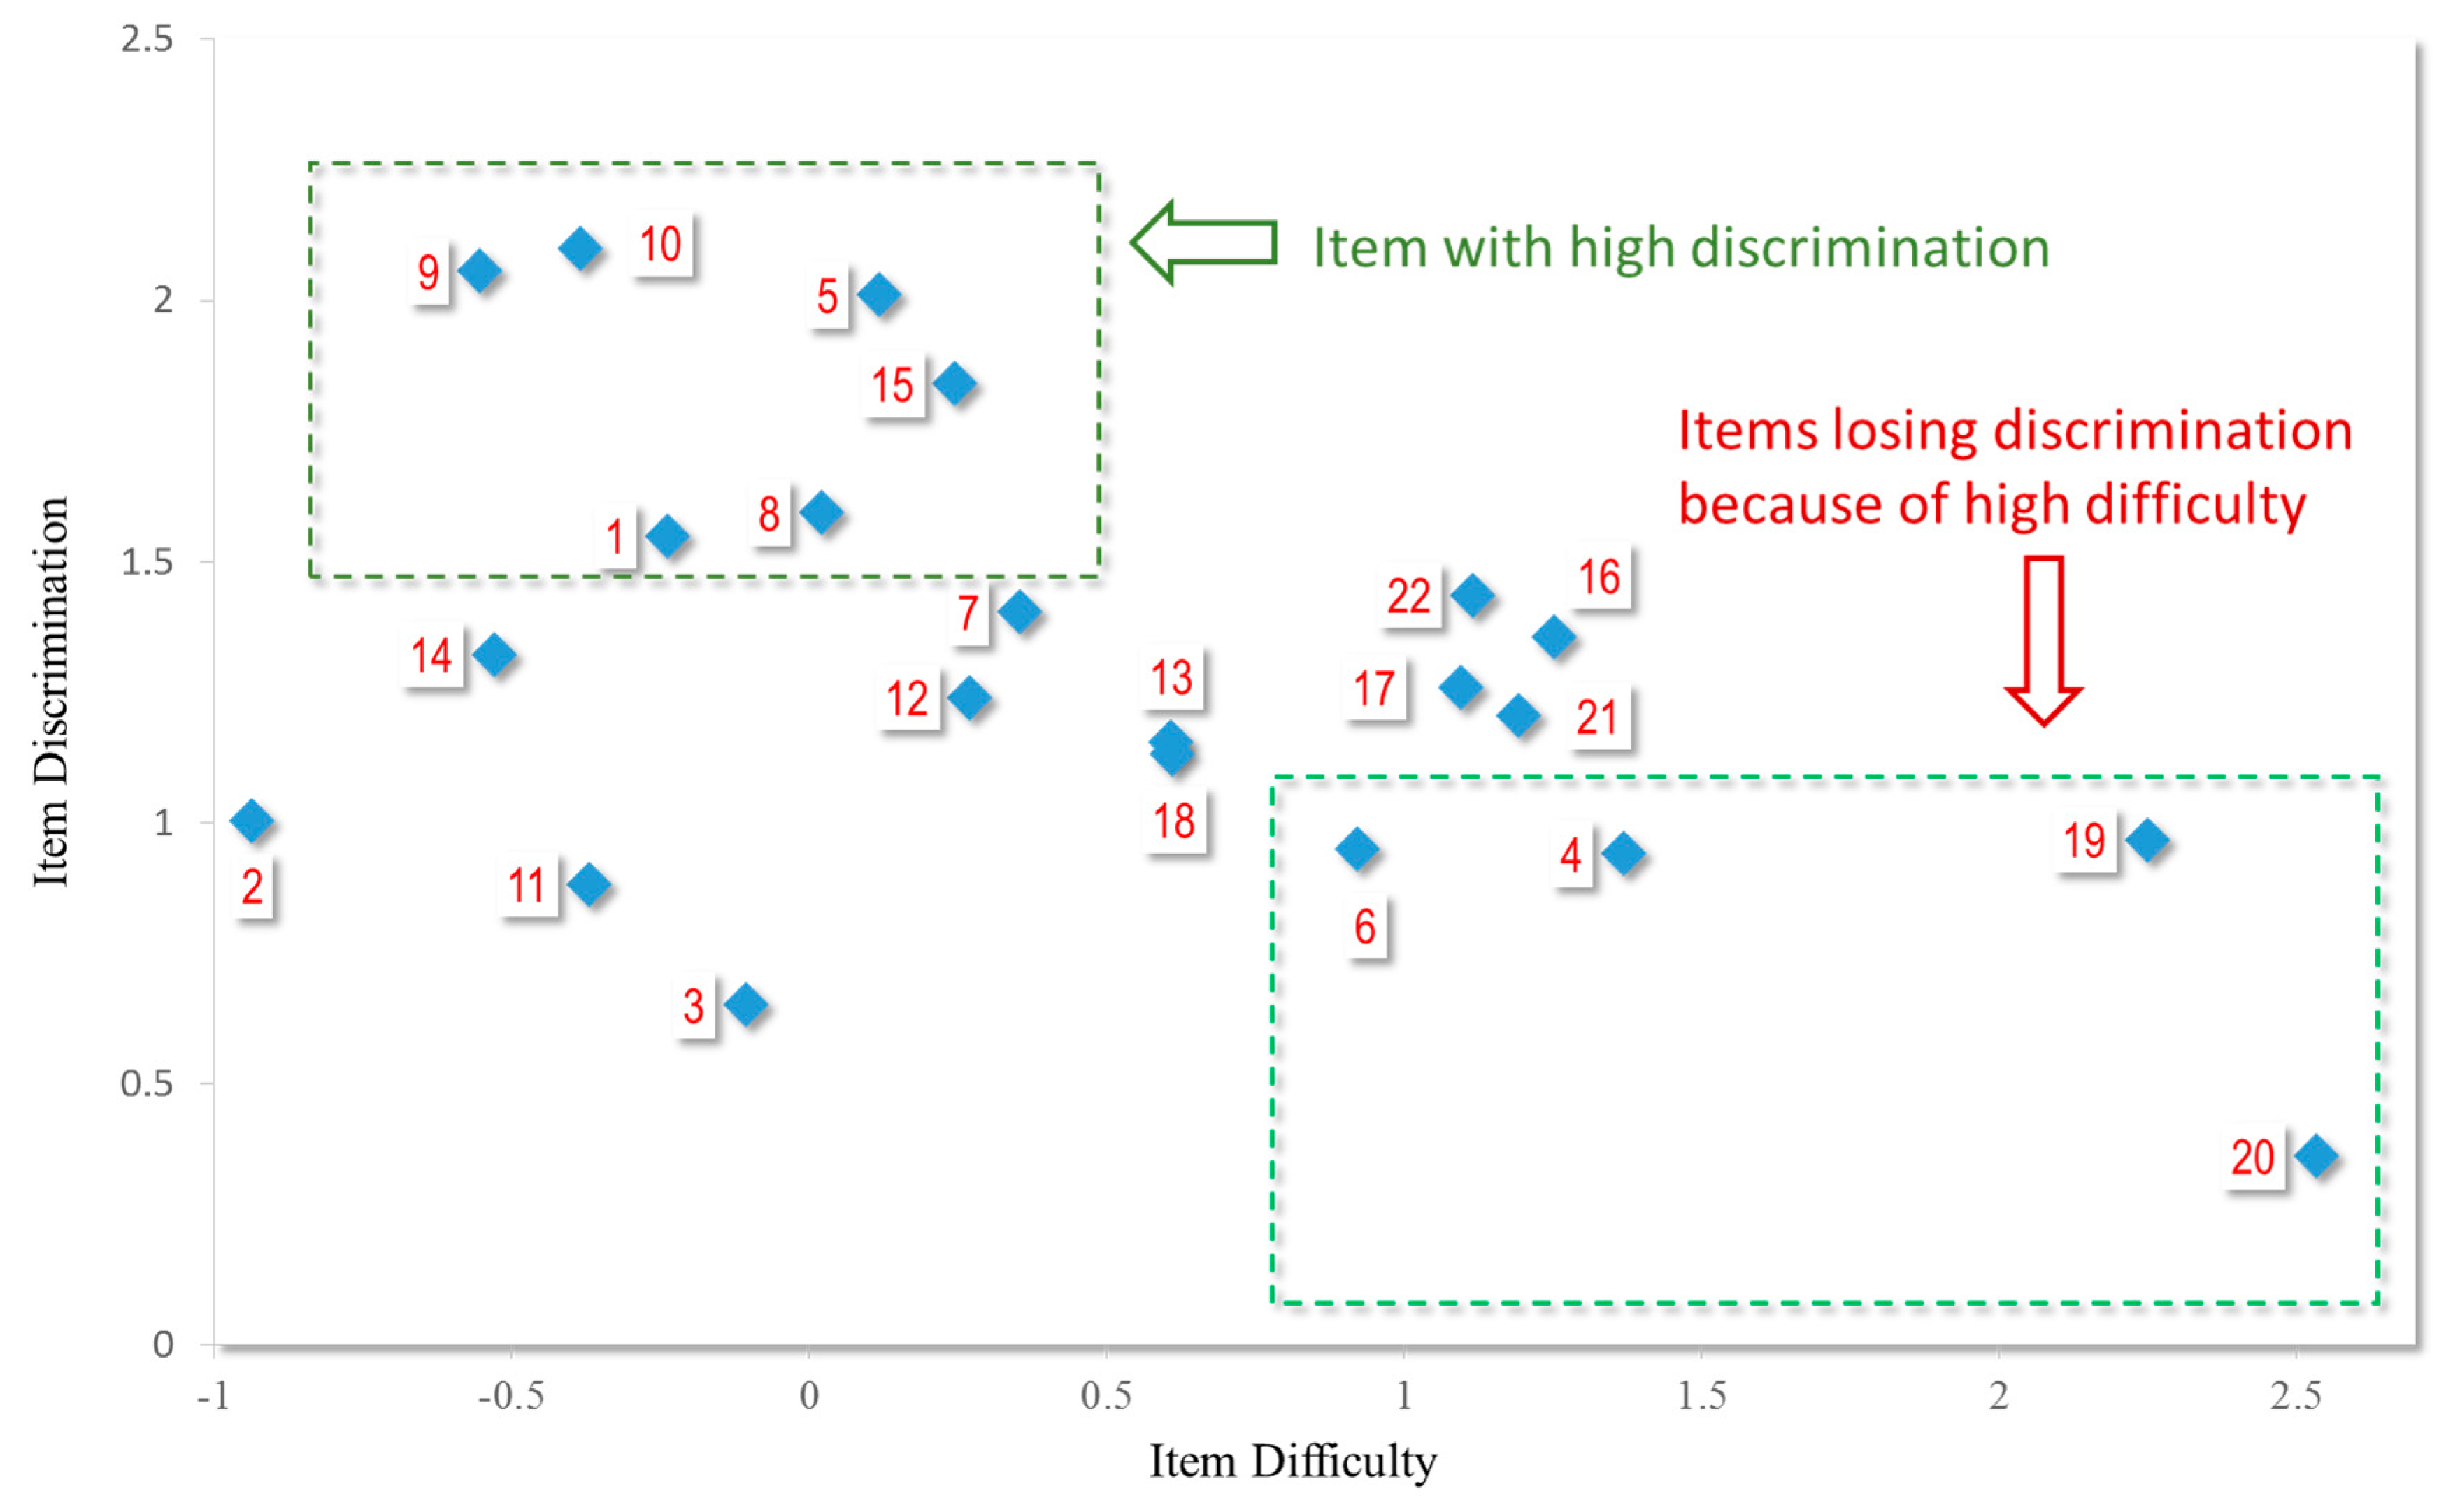
3.2. The Estimation of Item Parameters: Results and Analysis

Based on the survey data, by using the ‘ltm’ toolkit included in the R software utilities [50], an MMLE estimation (marginal maximum likelihood estimation) taking the EM-algorithm (expectation-maximisation) was performed. The estimated item response parameters associated with the 22 objective questions for the ‘concept’ dimension were obtained and their spatial distribution is illustrated in Figure 2. The three columns in Table 1 are the estimated question parameters, i.e., the difficulty, discrimination, and lower asymptotic parameters, respectively.
Table 1 also shows the difficulty and discrimination parameters (bi and ai) of the individual test items of the concept dimension. As can be seen, the interval of bi was (–1.0, 2.5), while its average was 0.494. The interval of ai was (0.3, 2.1), while its average was 1.290. A further analysis of ai was conducted for this study because the discrimination parameter is precisely the index to check in order to determine the suitability of a question, that is, to see whether it should be excluded or not in future investigations.
The first significant observation worth noting regarding Figure 2 is that almost half of the questions in the ‘concept’ dimension (10 of 22) had a discrimination number which fell within the (1.0, 1.5) interval. As this interval should be the median, these 10 questions, although ‘not that discriminative’, can be considered to be effective ones for differentiating the respondents to future surveys conducted in China.
Next, it should be noted that 4 questions (of the 6 less discriminant ones having an ai value of less than 1.0) also exhibited relatively significant difficulties (i.e., questions Q6, Q4, Q19, and Q20), with the difficulty level of Q20 being as high as bi = 2.536. This means that only a few respondents, specifically, those whose CSL levels surpassed those of 99.4% of all the respondents had a 50% chance of providing the correct answer to Q20. In other words, Q20 is too hard to be effective, and such a fact is directly reflected by its extremely low ai value (=0.361). In any case, these 6 less-discriminative questions (ai < 1.0) in the C-UQS, while factual in nature, were unable to differentiate among the respondents in the investigated sample. Therefore, they should be considered as the alternatives to be excluded from upcoming CSL surveys in China. However, for these questions, extra expert judgements should be performed, as to evaluate whether each individual question should remain included because of the importance and/or necessity of which. For these works, the results from the IRT estimation provide valuable information of those questions that are worthy of further evaluation. As for those discriminative questions with higher ai values (>1.5, i.e., Q1, Q5, Q8, Q9, Q10, Q15), most of their difficulty indices (bi) were around 0. This means that people who have an average CSL level would have approximately a 50% chance of correctly answering them. Therefore, these questions are not only effective ones for upcoming surveys, they are also the best questions to use as references when designing new questionnaires for use in China.
Another key and notable outcome is focused on the positions of those questions which are directly related to (the relations between) society and environment, including Q2, Q5, Q8, Q11 and Q15. It is seen that these questions have a shared property, which is mid-low difficulty. Such a finding entails that the relation between society and environment is a basic essential component of CSL, which is further a fundamental portion of public cognition. However, as most of these questions have a significant ability for discrimination, especially for Q5, Q8 and Q15, all these questions are able to be used to discriminate the literacy about sustainability for the respondents in China.
In general, it can be seen that if a question is too difficult or too easy, it will lose its discriminatory power. One may reasonably doubt, moreover, whether such a situation is specific to China. This becomes an interesting question to be examined in the next subsection. At the very least, in any case, when attempting to determine the most effective question set, it should be helpful to conduct a small-scale pre-survey before conducting a large-scale one, and after the said pre-survey has been conducted, those questions which are not sufficiently discriminative can be replaced. The questionnaire can be updated referring to the new questions that are currently used in other countries, without losing the inclusion (combination) of the domains that are to be tested. This should be especially true for some knowledge domains. From the results, this study undoubtedly revealed that for people in China the questions tested for physics and geology are the most discriminative ones because of their low difficulty (in contrast to those losing discriminative power because of high difficulty). These are the good references for re-evaluating, updating and replacing the unsuitable questions in other domains for C-UQS in the future. This is perhaps a step that should not have been overlooked for the CSL survey previously conducted in China, especially in light of the large sample sizes and costs of surveys in China.

3.3. Comparing the Question Parameters Cross-Nationally

To examine the problem of questions with insufficient discriminatory power (which is discussed in III.B. The Estimation of Item Parameters: Results and Analysis), Table 2 compares the parameters estimated for the questions used in this survey to those estimated in for the 1995 US-EU survey. Apart from the comparisons shown, this constitutes the first time that an IRT-based model has been applied to survey data from China, and this approach also enabled a fair comparison because of the identical measurement styles used.
However, in addition to the use of identical measurement styles, such a comparison also requires an ‘identical set of questions’. Fortunately, many of the questionnaires used in China were designed by referencing the questionnaires used in the US-EU (see II.C Survey/Analysis Works of This Study). So in fact, the C-UQS has typically included many questions asked previously in the US-EU. Thus, the problem here becomes one of ‘selecting the appropriate previously used US-EU question set’. As the aim here was to compare the parameters for as many questions as possible, the issue of ‘how previous’ should not be the major concern. Instead, the previously used US-EU question set that has as the largest degree of overlap with the C-UQS would be preferred. Therefore, the question set used in the survey held jointly by US-EU in 1995 was chosen [14], because in terms of the ‘concept’ dimension, the C-UQS overlapped with it on 10 out of 22 questions.
The results are fascinating. Consider Q20 again, for example: for the survey in China, its difficulty index was bi = 2.536, and it hardly discriminated the respondents because its ai = 0.361. So, it is a totally unsuitable question to ask in China (see III.B). In contrast, when exactly the same question was asked of people in the US-EU, its difficulty and discrimination indices were 1.191 and 1.710, respectively. In other words, although Q20 was also more difficult than other questions for people in the US-EU (as can be seen from Table 2), it did successfully discriminate those respondents.
Furthermore, Q20 is only one example of the unsuitable question problem: it was a very effective question for the residents in the industrialized US-EU countries more than 20 years ago, but is not suitable for people living in the developing nation of China even now. This implies that when conducting CSL surveys, a question that can suitably be asked of people in one nation may not be suitable for those in another. In addition, some topics that were suitable in one decade may no longer be suitable in the next, i.e., they become either a matter of common sense or a dated memory. Moreover, some questions that are currently unsuitable (i.e., because they are just too difficult now) may yet become suitable at some point in the future (e.g., Q20).
This discussion can be extended still further. The case of Q20 (i.e., it is unsuitable for use in China not because it is too easy, but because it is too difficult) implies that being outdated is not the only reason that a question may be unsuitable. Rather, the problem of ‘Not the right time yet’ is another possible reason. This is an unexpected finding that the researchers would not have thought possible before conducting the present study. However, it should be reaffirmed that the modelling result using IRT just provides quantitative clues for including and excluding the identified unsuitable questions, but the real decision should be subject to expert judgment.
In any event, the observed problem underscores the need to always perform a pre-survey and then update the question set before a real survey begins (see III.B), especially when the fundamental question set is ‘borrowed’ from other countries but lacks an update. This is a very significant implication for future CSL studies in not only China, but also in other, similar developing countries.
Another observation that can be made is in regard to the overall difficulty of the questions. After nearly two decades, every overlapping question still offered a greater challenge to the respondents in China in 2013 than to those living in the US-EU in 1995. This fact, while possibly attributable to educational and socio-environmental factors, may highlight the need to improve CSL and the quality of science education in China.

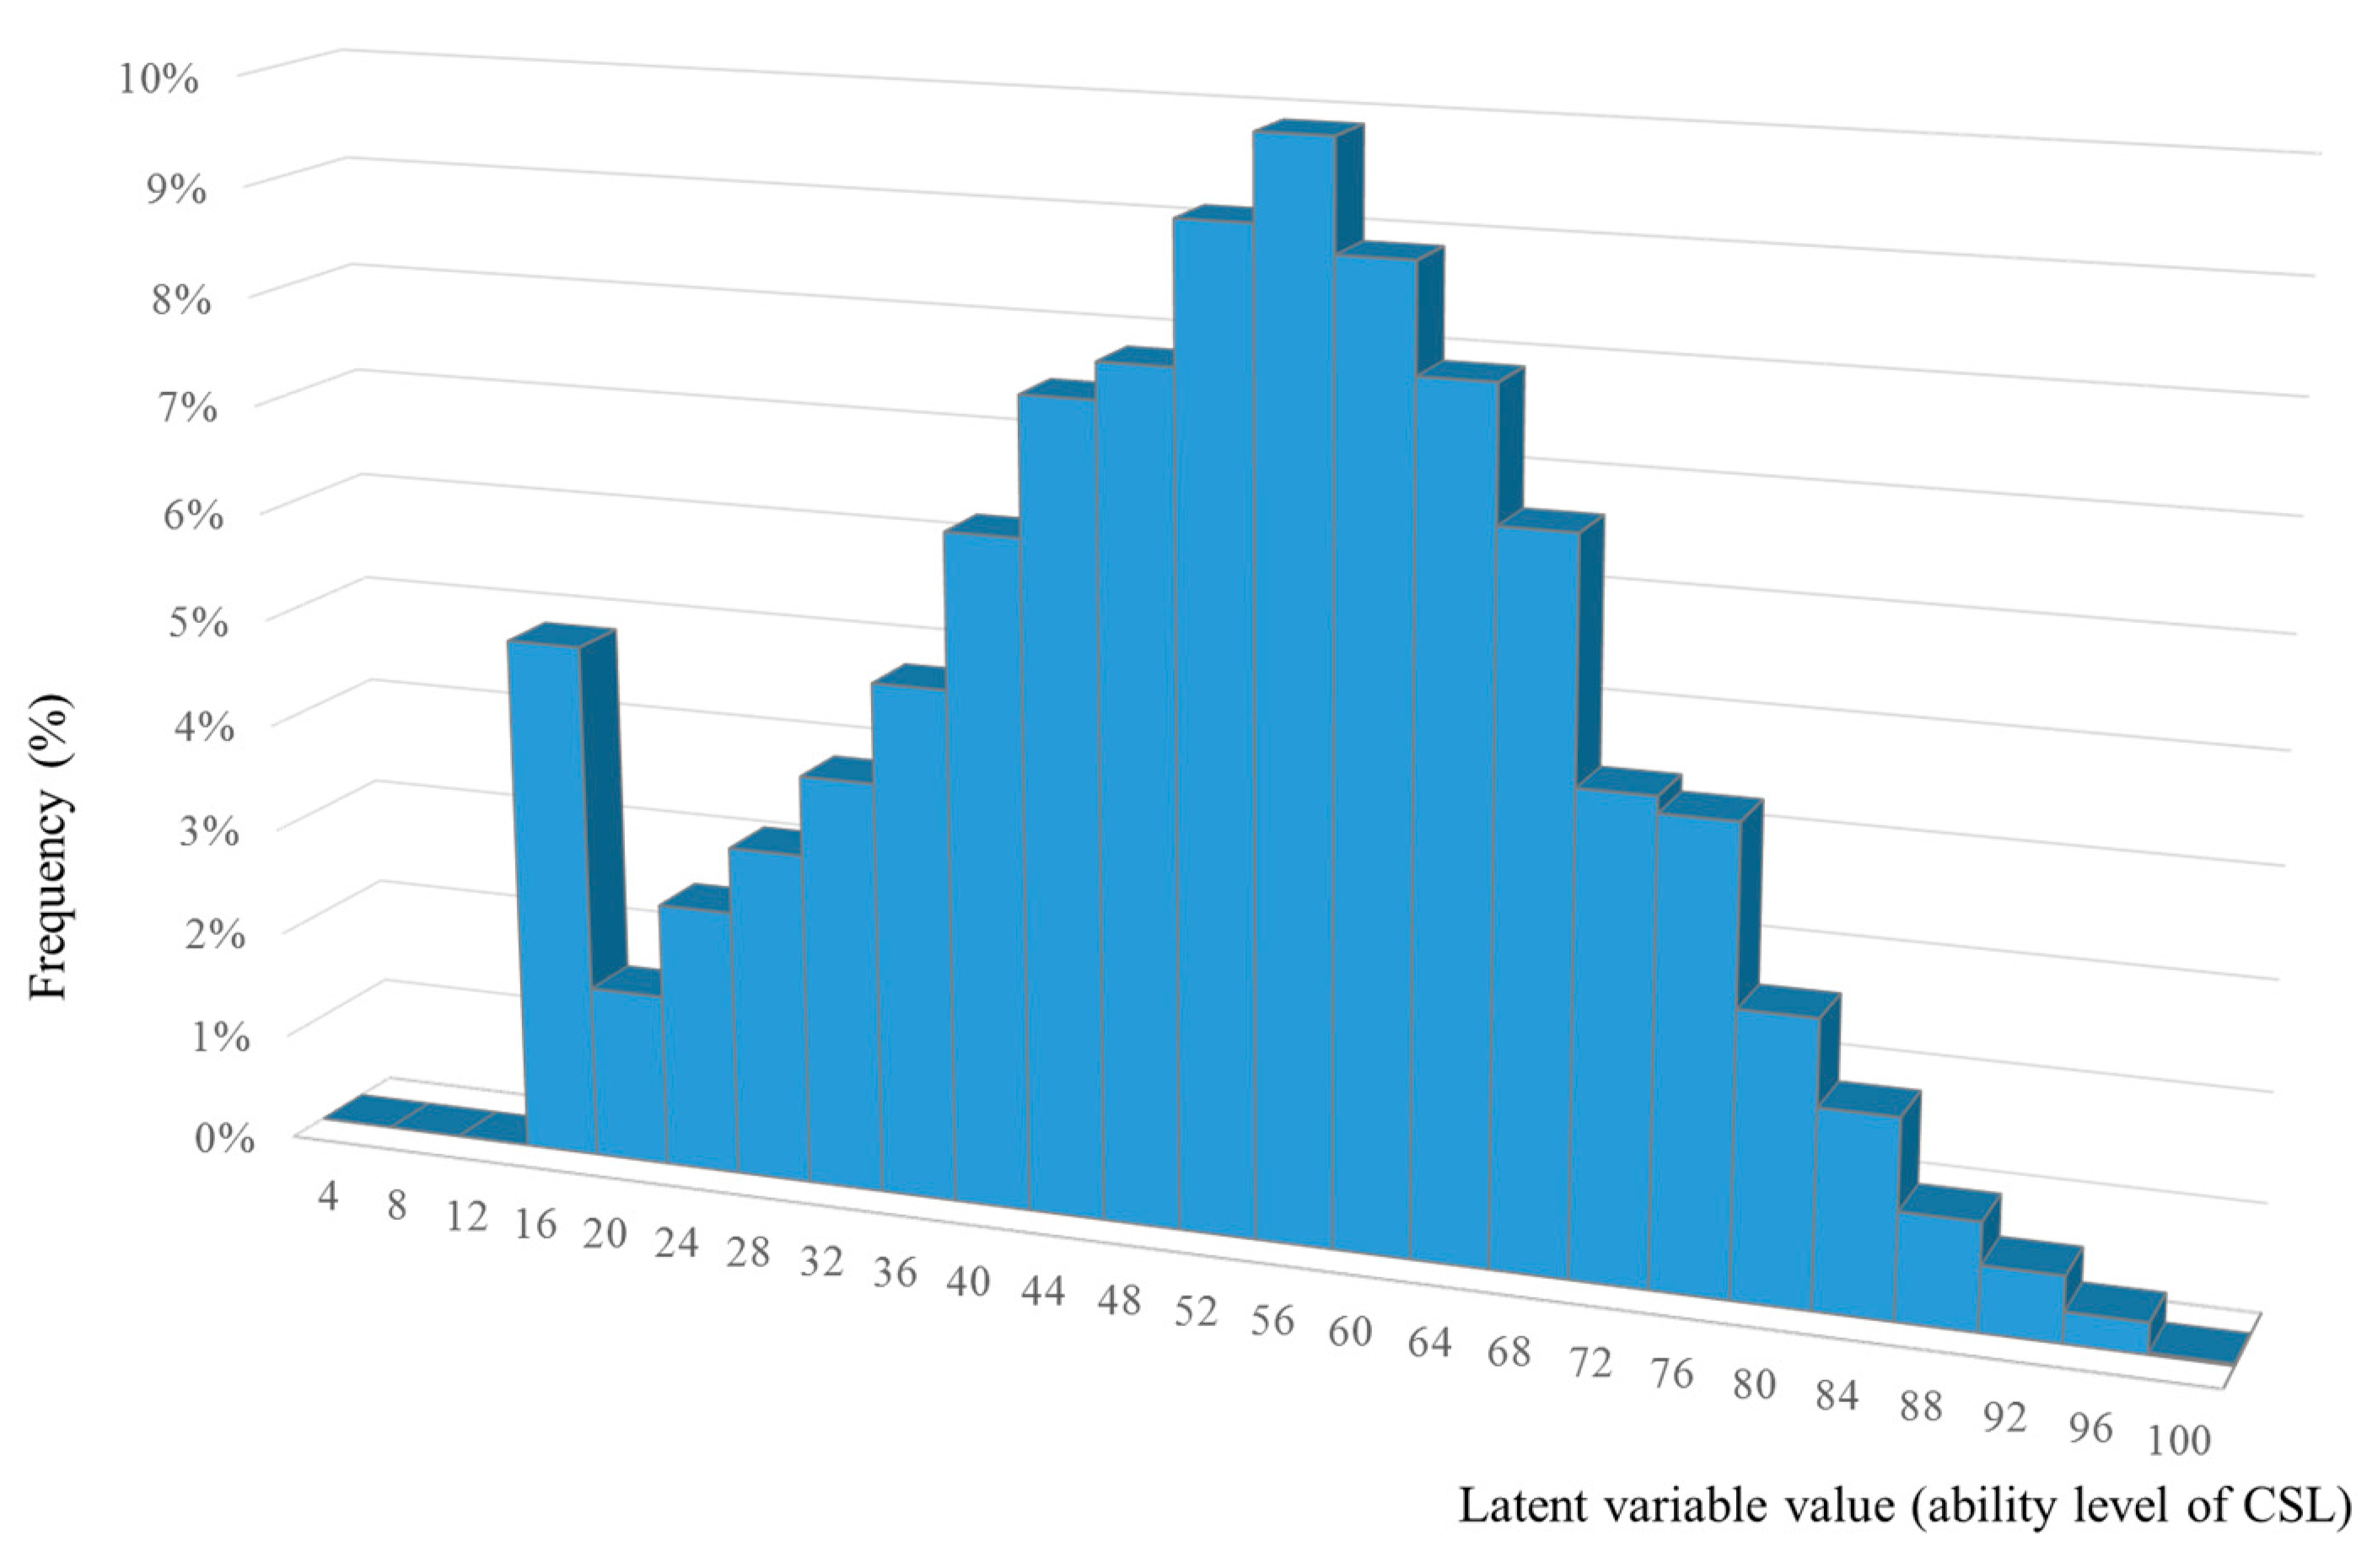
3.4. Assessment of Respondents’ Latent CSL Variable Values and Their Overall Distribution

With Equation (1), the maximal likelihood of the CSL latent variable of each j-th respondent, θ j , is assessed. For the sake of further analysis and comparison, this study normalized the latent variable values obtained as numbers in the (0, 100) closed interval discretely [14]. Then, based on the normalization results, the distribution of the CSL levels of all the respondents is illustrated in Figure 3.
It can first be noted that, roughly speaking, most parts of the figure follow a normal distribution, with the exception of the left-most tail (i.e., people with an extremely low level of CSL).
By truncating the left-most tail and testing the normality of the CSL latent variable values with the Kolmogorov-Smirnov test (i.e., D = 0.0151 and p = 4.950 × 10⁻⁶) and Anderson-Darling test (i.e., A = 5.7348 and p = 4.054 × 10⁻¹⁴), it is confirmed that the normalized CSL level of the studied sample, θ , is consistent with a left-truncated normal distribution, which can be written as follows:
F ( Θ )   = { 0 ,   θ < θ 0 p 0 ,   θ = θ 0 p 0 + ( 1 p 0 ) Φ ( θ μ σ ) , θ > θ 0
For testing, the left-truncated value, θ 0 , was fixed as 15 by observation of the results. After calculation, the left-truncated probability, p 0 , was found to be 4.72%, which roughly equals the ‘illiteracy rate’ of the investigated region in 2013, 5.62% [51]. From this perspective, the distribution of θ shown in Figure 3 might reflect some characteristics of the public education structure in China. More importantly, this observation should provide greater confidence for further analyses.

4. Results: Overview of CSL Level in China and the Group Analyses

When judging whether or not a group of people possesses CSL, a well-accepted guideline has typically been applied: if one possesses CSL in both the ‘concept’ and ‘inquiry’ dimensions, then he/she ‘possesses full CSL’; and if one is exclusively qualified in only either dimension, then he/she ‘possesses partial CSL’ [14]. As such, the situation for a given group can be expressed in terms of certain ‘qualified rates’ (that is, the rates of individuals in the group possessing full CSL, partial CSL, and no CSL). (Survey/Analysis Works of This Study (II.C) introduced the rules for determining if an individual possesses/does not possess CSL, and for all the respondents polled, their statuses in terms of possessing//not possessing CSL (in both dimensions) were determined by applying the rules in II.C to the latent CSL latent variable values obtained in Assessment of Respondents’ Latent CSL Variable Values and Their Overall Distribution (III.D). In other words, it was possible to determine whether or not a respondent possessed CSL in each of the two dimensions.) While many existing studies have previously applied this guideline to group-based CSL determinations [23,27,44], this study also followed it.

4.1. Analysis of the Entire Sample

Since the sample size of the survey was not small, it should be population-representative. The various qualified rates of the entire sample (i.e., all the respondents as a group) were calculated as follows (see also in Figure 4):
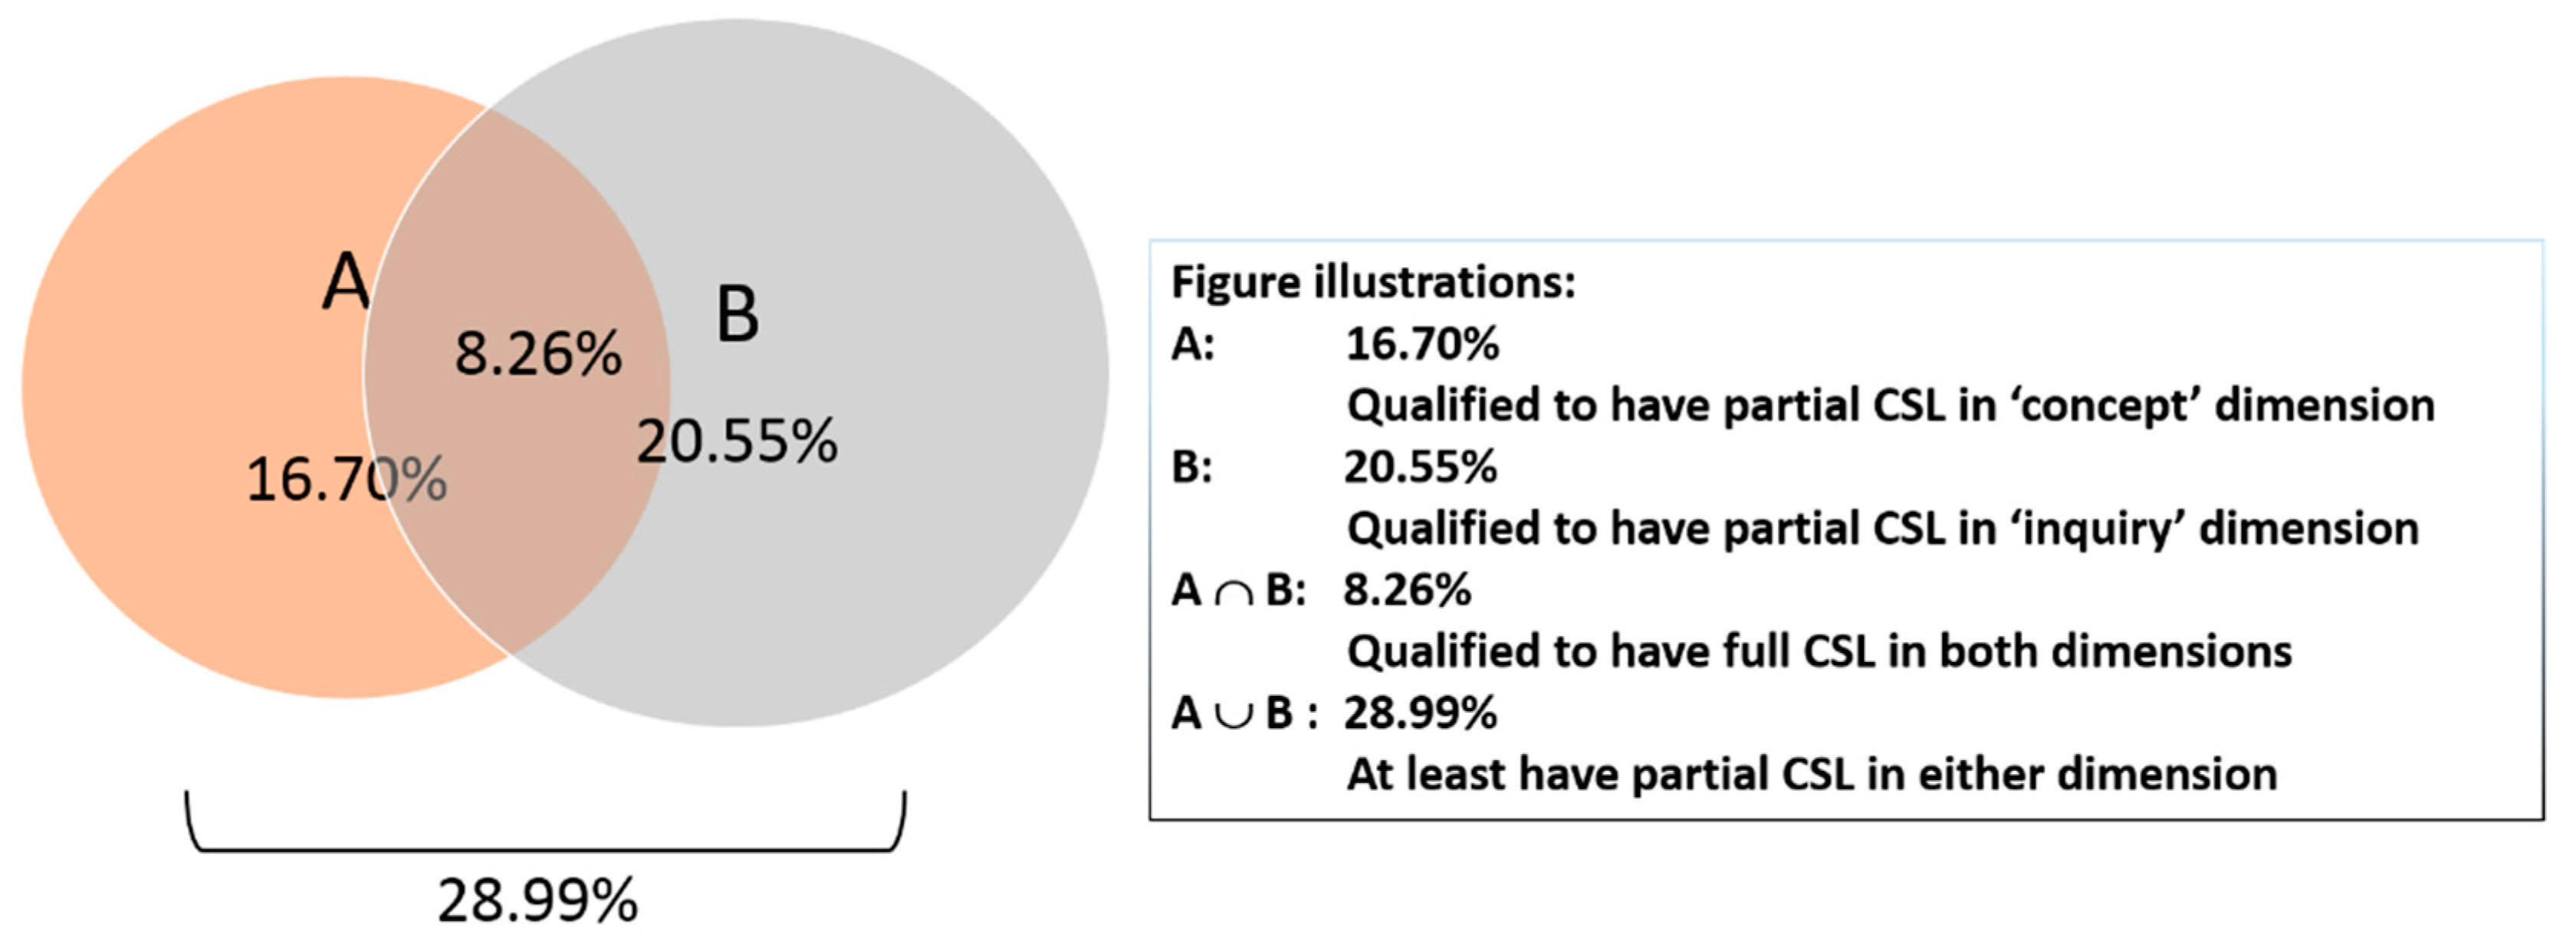
  • Overall, 16.70% of the respondents qualified as possessing CSL in the ‘concept’ dimension (denoted by set A) and 20.55% were qualified in the ‘inquiry’ dimension (denoted by set B);
  • When measured in either dimension (in a strictly exclusive manner), 28.99% were qualified (the union of sets A and B), and these were the people who at least ‘possessed partial CSL’;
  • However, when measured in both dimensions together, only 8.26% were qualified (the intersection of sets A and B), and these were the people who truly ‘possessed full CSL’.
These are perhaps the most important outcomes of this study, and the last observation will be compared cross-nationally later in the Discussion section.

4.2. Group Analyses in Terms of ‘Background’ Characteristics

Table 3 summarizes and accumulates the qualified rates of the differently stratified sample groups. The entire sample is ‘stratified differently’ into groups according to the respondent answers made to the ‘pro-file’ and ‘channel’ questions (i.e., the characteristics). This table also expounds the correlations between the group-based qualified rates and each (possible) influencing factor (characteristic). To determine those correlations, the contingency table approach and the χ-square test were applied to verify the influence of the different characteristics on the qualified rates. The results of these tests are shown as their associated p-values, as listed in the last column. In terms of the ‘background’ characteristics, some observations can be made in this subsection.
From the perspective of gender, 2% more of the male respondents than the female respondents were found to qualify as ‘possessing full CSL’, while 2.6% more and 3.8% more were found to qualify as ‘possessing partial CSL’ in the two dimensions. This imbalance in the qualified rates is likely due to the feudal ideologies of traditional Chinese culture, which might decrease the willingness of women to pursue science educations and to learn scientific matters in their daily lives. This gap can be also re-examined in the future.
From the perspective of age, the 18–27 group was the most qualified (with 17.46% possessing full CSL), and with an increase in age, the qualified rate falls considerably. This may be attributable to China’s current education-level distribution, in which the highest degree of people typically decreases as age increases.
From the perspective of education level, it is evident that with increases in respondent education levels, the qualified rate increases, too. Accordingly, the ‘university or above’ had a much higher qualified rate than the non-well-educated.
The fact that the education level variable dominated the qualified rate is an interesting but common pattern in East Asian countries. This not only supports the previous two observations, but also underscores the need for institutions of higher education in China. As for the improvement of scientific education quality, that should be another issue (see III.C and III.D: Comparing the Question Parameters Cross-nationally and Assessment of Respondents’ Latent CSL Variable Values and Their Overall Distribution).
From the perspective of specific occupations (i.e., jobs), the respondents in group 1 (the top management people), 2 (the professionals), 3 (people whose work involves foreign contacts), and 7 (students) had relatively high qualified rates (around or over 18%). On the contrary, just a few people (2.69%) in group 4 (people in agriculture, forestry, animal husbandry, fishery, or water conservancy industries) are qualified, and people in group 6 (production or transportation tool/vehicle operators) also possess a CSL level that is below the average (that is, 7.71%). This finding is a significant warning sign, in view of sustainability, in that agricultural and the manufacturing industry are usually regarded as the industries now facing challenges of transformation for a country that is in search of sustainable development [52,53,54]. The weakness in the CSL level for people who serve these two types of occupations might create a barrier for such sustainable transformation in China. Therefore, the government should put special emphasis on these two groups of people if it wishes to improve the overall CSL level. (Note that such categorization of people’s occupations follows the design of most social science questionnaires in China, which have been in use for a long time and have been proven to be effective (for the respondents). That said, this approach conflicts somewhat with the usual occupation categorization style adopted by the Western countries or Japan.)
Finally, from the perspective of morphology, the qualified rate of urban people far surpassed that of rural people, exceeding it by more than 6.5%. This was perhaps due to fewer educational resources being allocated in rural areas (which should be an observable fact) and the lack of emphasis on scientific matters on the ‘country roads’. The huge gap between country and urban is also a potential issue for future sustainable development. Considering the unsustainable form of development in the country [55,56], the CSL level of rural people should become a factor that might offset the development of China. Therefore, for the government, raising the CSL level of people in the countryside would also perhaps be another effective way of raising the nation’s overall CSL level.

4.3. Group Analyses in Terms of ‘Channel’ Characteristics

For those characteristics polled by the ‘channel’ questionnaire block, let us begin with people’s interest in science. In real life, everyone shows a different degree of interest in scientific matters. In the survey, this was polled by the ‘degree of interest in science’ question indicated in Table 3, for which a Likert-scale 5-point measure was adopted.
As can be seen, with an increase in the degree of interest, the qualified rate increases greatly. The qualified rate of the ‘normal interest’ group almost triples that of ‘not that interested’ group; the rate of the ‘interested’ group more than quadruples that of the ‘normal interest’ group; and the rate of ‘very interested’ group more than doubles that of the ‘interested’ group. Such a relation is trivial by observation and need not involve any statistical tests.
In considering the results further, it is surprising that only 1.77% of the people in China who have a ‘normal interest’ in science were found to be qualified. It can also be observed that only the rate of the ‘very interested’ group was above the average (15.91% > 8.26%). One potential reason for this finding is that, when answering this question, respondents in China may over-report their interest in science. Another possible explanation is based on a finding of the Rose Project [57]: people in developing countries express more overall interest in science. Hence, in China, even the respondents with below-average CSL show a high level of interest in science.
Another key point is that in China, people who are ‘totally not interested’ in science are totally unqualified in terms of ‘possessing full CSL’. This finding should be factual because the sample size for the survey was large enough, but what explains it? A plausible inference is that an individual lacking CSL tends to have no interest at all in science. Should this be the reason, it would be another problem of the scientific education system in China worth studying. (This can be observed from several informal pedagogy cases from universities in China. If one did not learn science well at school, he/she would be frustrated by the scientific learning activities and would have less interest in learning science. This would depress his/her desire to engage with any scientific topics after graduation and no CSL level enhancement could therefore be expected.) As interest in science strongly correlates to CSL in China, their causal relationship is clearly a topic worthy of exploration.
Next, the results can be observed in terms of the scientific information channel variable [58]. As shown in Table 3, the majority of people in China (57.7%) are used to acquiring scientific information from TV. But among those for whom TV is the main channel, only 4.30% are qualified, a rate far below the overall average. In other words, this channel has greatly lowered the average among those for whom it is the main channel. In contrast, the two groups within which more people were found to be qualified were the ‘PC-based Internet access’ (21.35%) group and the ‘smart phones’ (10.83%) group. This implies that in China, high-tech channels (essentially, those involving Internet technology) would be the better ‘first choice’ for people to get correct scientific information, instead of TV.
The relation between the level of participation in science activities and the qualified rate can also be examined. As can be observed, even in the investigated region, wherein people have relatively high socioeconomic and education levels (see Appendix A), over 60% of the people (7215/11,818) surveyed reported not participating in any science-oriented activity at all. Overall, less than 14% of the people (i.e., 720 + 409 + 485, a low number among the overall sample of 11,818) reported taking part in such activities at medium or higher frequencies. Overall, the qualified rate increases with increases in science activity involvement, and more importantly, the qualified rate was above the average (10.29%) even among those with a low level of involvement (rather than none). Launching more science activities and attracting more participants to them would, therefore, perhaps, be an effective way to improve overall CSL in China.
Finally, how does the frequency of science facility access relate to the qualified rate of CSL? As can be seen, it was also found to be positively related to the qualified rate. Moreover, the general situation is not that bad because over 40% of the respondents (i.e., 3006 + 1325 + 373 out of 11,818) reported accessing public science facilities at medium frequency at least. Therefore, in China, improving the frequency of such visits might also improve the overall CSL level, but this would perhaps not be as effective as improving involvement in science-related activities, spurring greater levels of scientific interest, or changing the information channel preferences of people.
In short, according to the epistemological framework, the ‘facts’, ‘data’, and ‘information’ relevant to CSL in China have been revealed so far, but further exploration is still required in order to obtain greater ‘knowledge’ regarding CSL in China. In this respect, the correlations shown in this section serve as the Pharos; future research can be conducted in order to identify the causal relationships based on the observations discussed herein.

5. Comparison: Comparing the Overall Qualified Rate of CSL in China to Those in US-EU Countries

This section compares the overall CSL status of China with those of US-EU countries, as shown in Table 4. For the sake of clearer presentation, the ‘qualified rates’ of the US-EU countries are summarized here; for details, please see the previous studies by Bauer [20] and Miller [15]. It should be noted, again, that such a comparison has not been conducted by any of the previous studies of CSL in China.
As shown in Table 4, the CSL-qualified rate of China in 2013 would have ranked just around the middle of the list of qualified rates for the US-EU countries in 1995. More critically, if the 2013 rate for China were to be included in the 2005 US-EU rankings, it would rank below the rates for almost all of those countries, with the exceptions of Greece and Portugal, even though the investigated province is currently a relatively ‘rich’ province of China (i.e., rich in both wealth and knowledge). As discussed, we have intentionally selected Zhejiang as the sampling area (see section Survey/Analysis Works of This Study), not only because it has the highest disposal income per-capita among all the provinces in China but also because it has a large enough population for unbiased sampling [59]. As many other studies involving the citizens of China have revealed (although those studies took an incomparable approach), the scientific knowledge level in Zhejiang is relatively high in comparison to other regions of China. These observations are both very interesting. Since the 2013–2015 data from the US-EU is not available to us at present, it can be postulated that the observed gap in CSL between China and the US-EU likely remains salient in 2015. Moreover, since a general increase in CSL was shown in the US-EU from 1995 to 2005, the question of how China can improve its CSL status from 2013 to 2023 is a topic worthy of consideration.
In summary, the outcomes of this comparison call for the improvement of the overall level of CSL in China. However, knowing how to improve a nation’s CSL is more important than knowing that there is a need to do so. In fact, the acknowledgement of this reality was exactly what motivated the analyses detailed in Section IV.

6. Discussion: Implication for Policy and Practice

This section reviews the main findings and the possible contributions of this study, as well as the implications that can be drawn from it. With the survey and modelling/analysis works having been completed, the possible contributions of this study can be summarized by discussing several ‘first times’.
Firstly, this study applied a more systematic research framework to study CSL in China for the first time. As discussed above, the previous studies of CSL in China usually set up a CART to threshold the CAR scores. By doing so, the evaluations provided by these studies were rendered subjective, while the thresholding in question was rendered arbitrary. This approach also failed to assess the contribution/priority of each question to/in a ‘dimension’. And, although the questions were classified into various ‘categories’ according to the dimensions previously defined by US-EU researchers, a truly ‘multi-dimensional measure’ had never actually been applied. In contrast, this study surveyed, measured, and analysed its CSL data in a more systematic manner, and its measurement framework was theoretically grounded. Rather than using CART thresholding, this study constructed an IRT model to assess the latent CSL variable values for each respondent in each dimension, and also estimated the question parameters. Relatedly, it should be noted that the measures included in both the ‘concept’ and ‘inquiry’ dimensions have been well-defined in the literature. In this study, moreover, the results in these two dimensions were also considered at the same time when performing the group-based CSL qualification analysis. In other words, this study realized a truly ‘multi-dimensional’ research framework, rather than analysing the variables individually. Since China is a very populous country, these improvements may contribute to the field by introducing a systematic, well-organized, and multi-dimensional measurement framework.
Secondly, this work identified the unsuitable but usually used questions in China for the first time. This study scrutinized the suitability/unsuitability of each question in the C-UQS, and fortunately, IRT modelling offers a solid basis for doing so. The estimated question parameters indicated that some questions in the C-UQS used ‘as is’ by CSL researchers in China are no longer suitable or have not yet become suitable.
Thirdly, this study compared the question parameters estimated in China with those estimated in other countries for the first time. This study successfully estimated the parameters of each question in the C-UQS and compared the results to those from the US-EU. This enabled, in turn, a meaningful and fruitful cross-country comparison (Table 2), which has never previously been done with CSL data from China. An overall observation resulting from this comparison, as noted in Section III.C, was that the overlapping questions were more difficult for the residents in China in 2013 than they were for those living in the US-EU in 1995. Another key observation was about Q20: it is too hard, rather than too easy, for the citizens in China, limiting its ability to effectively discriminate among them (Figure 2).
Fourthly, this study compared the overall CSL level assessed in China with the overall CSL levels of other countries for the first time because the data from China was rendered truly comparable. As discussed above, the results from previous CSL studies of China could not be fairly compared with the CSL results from other nations because of the monotonous measuring style used in those studies. However, because this study applied IRT as the modelling basis and used a truly multi-dimensional measure, the results of the 2013 survey conducted in China were rendered comparable to the results from other countries (see Section 5). So finally, and most importantly, on the basis of this fair comparison, this study conducted the first cross-national CSL comparison including China. Furthermore, the results of this comparison were shown to implicate a number of cross-cultural matters.
Due to limited space, in addition to the ‘first times’ discussed above, only the most critical findings from Section 3 and Section 4 are reviewed here as the supplementary outcomes of this study.
The first such finding was that in China, the distribution of the assessed CSL levels was found to follow a left-truncated normal distribution, wherein the height of the left-most tail was largely consistent with the illiteracy rate in the investigated area (see III.D Assessment of Respondents’ Latent CSL Variable Values and Their Overall Distribution). Furthermore, although a fair number of the survey respondents (28.99%) were found to possess at least ‘partial CSL’, only 8.26% were found to ‘possess full CSL’, a percentage that would have ranked only at the middle level of the US-EU countries two decades before (see Section 5). Such an outcome is alarming for China, and even for the whole world, because it is now the second largest economy in the world and is a main member of BRICS (Brazil, Russia, India, China and South Africa), which accounts for 42% of the world population and 26% of the land on Earth. As most of these leading developing countries are moving to the sustainable development mode, the result from the CSL study in China should be a focus.
However, as observed in terms of the literacy, the relatively low overall CSL level that was assessed might not support such a transformation. In group analysis, we indicate that the agriculture and production practitioners and rural people have a relatively poor CSL level. That is a vital challenge in the sustainable transformation of China. This initial finding is indeed an important finding because of the aforementioned reasons. However, of most importance is that it calls for the need to improve the CSL level in China in order to gain sustainable development, and that this should also hold for other developing countries all over the world, not limited to BRICS.
The second finding was that being ‘outdated’ (too easy to discriminate) is not the only possible reason for question unsuitability. Rather, ‘Not yet the right time’ (too difficult to discriminate) was found to be another cause of question unsuitability (see III.C Comparing the Question Parameters Cross-nationally). This has uncovered an important dynamic of CSL surveys: a question that is suitable for one country may not be suitable for another, and a question that is suitable (unsuitable) for a given sampling period may not be (may be) suitable for another sampling period. Therefore, the question set to be used cannot simply be ‘borrowed’ from past surveys; rather, an update to it is always required. This can be accomplished by conducting a pre-survey with a smaller sample (see III.B The Estimation of Item Parameters: Results and Analysis and Comparing the Question Parameters Cross-Nationally), a point which is perhaps instructive to any other CSL survey that are to be conducted in similar developing countries to China.
As for any possible questionnaire update, it should be done with discretion. In our study, the quantitative IRT model did help us to identify some questions that are probably unsuitable, but excluding these questions according to the identified subset of questions arbitrarily and directly is inappropriate. Because the result from IRT may provide clues for ‘which question (or subset of the original questions) is probably unsuitable’, such information is helpful for the questionnaire designers to further evaluate the real unsuitability of each such question and to make a question inclusion/exclusion decision based on which, as to roll out a new questionnaire that is truly suitable for the next investigation. This suggestion is indeed reflexive to the recent advance of data-driven decision-making (i.e., taking both human (insight) data and computer data to make a decision) [60,61,62,63,64] and the recent development of which for sustainability [65], as whether to continue including a question is also a decision.
The third finding was in regards to the in-country comparisons made and the correlations identified (between the respondent characteristics and the CSL qualified rates of the various groups) in group analyses in terms of ‘Background’ characteristics (IV.B) and group analyses in terms of ‘Channel’ characteristics (IV.C). In China, almost all the personal attributes and behaviours (i.e., characteristics), as polled by the ‘Background’ and the ‘Channel’ questionnaire blocks, were shown to be related to the qualified rate, as examined by using a contingency table approach with χ-square tests. From this point of view, questions in these two questionnaire blocks are effective for stratifying the sample of a CSL investigation conducted in China. However, as the results of this study also showed that different characteristics might correlate to different extents with the qualified rate, further research about their real causal relationships should be conducted in the future.
In addition, the in-country comparisons yielded two significant implications for improving CSL in China. The first was that improving people’s overall education levels might be one of the ultimate solutions, although perhaps this would only be effective in China (i.e., in other countries, education levels do not necessary correlate with CSL levels). The second was that changing people’s scientific behaviours might be the other effective means of improving CSL in China. It was observed that ‘science-activity participation’ had the strongest correlation with the CSL qualified rate, and that the most-frequently-accessed scientific information channel is TV. However, given that it could be difficult to change people’s behaviour, perhaps improving the content in TV programming would be a more efficient means of quickly improving CSL in China.
Finally, the study is of great value in management and educational training. The survey and the corresponding analysis illustrate the differences of CSL level between China and US-EU countries, involving the general performance, strength and weakness in scientific cognition and group characters. These differences have implications for the human resource management (HRM) of multicultural companies, and hence it is meaningful for these companies to hold training courses for staff in different countries. This part is important for the study from theory to practice and from research to market value, as in other sustainability studies, e.g., wind power studies [66,67].
For the HR issues for the multi-cultural companies, such as recruitment or project team organisation, the results from the comparison works of this study are key to forming a ‘best professional team’ by employing the ‘player staff’ who are suitable across multiple nations. Although such a problem is a ‘combinatorial optimisation’ problem de facto, mathematical programming (MP), e.g., the meta goal-programing approach [67,68], can be used to solve the problem by taking the different scientific-expertise data profiles of the people in different countries as the model parameters and by establishing the required expertise standards in the fields as the objective function.
Secondly, the result is also favourable to educational training: an international company should consider the condition of every country when holding training courses for its branches. This topic is reflexive to the studies of multi-cultural counselling training [69,70], whilst no single training course design fits all. Therefore, the result of this study not only offers empirical evidence to the studied inter-cultural facts about the training, but also supports the sense to design different training courses (even slightly varying the teaching material) for the staffs in different countries which are adapting to their different backgrounds of scientific knowledge. This is analogous to the reasons for designing a novel education system (e.g., for English evaluation) [71] or for the redesign of the educational training framework for the same decision problem (e.g., budget planning) in a different industry (e.g., next generation fighting aircraft design) [65].

7. Conclusions and Recommendations

The study of CSL is a form of socio-scientific work that has continuously been conducted around the world over decades [72,73,74,75,76,77,78,79,80], and the results of CSL studies from China, the country with the largest population, should also be highlighted and compared. However, several observable drawbacks of the studies of CSL previously conducted in China have prevented the results of those studies from being (fairly) compared with results from other countries. This study removed these obstacles.
In this study, the survey data were systematically studied by using a truly multi-dimensional measure and the widely accepted IRT modelling approach. This has made the results (i.e., the latent CSL variable values possible to assess and the question item parameters estimated) comparable to those from other countries, and such comparisons are meaningful because of their cross-national, cross-cultural properties (see III.C Comparing the Question Parameters Cross-nationally and V.A Comparing the Overall Qualified Rate of CSL in China to Those in US–EU Countries). Meanwhile, the overall distribution scenario of CSL in China was shown in this study (see III.D Assessment of Respondents’ Latent CSL Variable Values and Their Overall Distribution), and the unsuitable questions in the C-UQS question set were identified (see III.B The Estimation of Item Parameters: Results and Analysis).
The IRT modelling used in this study also provided a solid basis for the group-based in-country analyses conducted in the study, allowing the researcher to determine the ‘qualified rates’ of different groups of respondents. An overall analysis (i.e., of the entire sample as a group) was made (see Analysis of the Entire Sample), and by using the different respondent ‘characteristics’ to stratify the sample, several individual analyses were also made (see IV.B Group Analyses in Terms of ‘Background’ Characteristics and IV.C Group Analyses in Terms of ‘Channel’ Characteristics). The resulting possible contributions (i.e., the several ‘first times’) and main findings of this study are reviewed and summarized above (see Section 6).
This study also paves a way for future works. As can be observed from Table 4, in the US-EU, the increases in the CSL qualified rates from 1995 to 2005 were obvious, although the degree of those increases varied from country to country. As the present CSL level in China is approximately at the overall level for the US-EU in 1995, and as the government of China is seeking to improve China’s CSL (according to the white paper mentioned in The History of CSL Studies in China), the degree to which China manages to improve its CSL level by 2025 should be a very interesting topic, and the ‘increase’, in addition to the future CSL level itself, should be a key issue that will be worthy of study.
Next, since the authors of this study will launch similar investigations in the same area every several years, the questions parameters will be re-estimated. Again, the ‘change’, in addition to the values of the question parameters, should be another target of study. In other words, the parametric tendencies of the ‘surviving questions’ should be a focus.
Finally, another interesting topic is the comparison of the item response patterns between the provinces in China. Although China is a country, as with the inter-country differences among the member countries of the EU, the intra-country differences within China are essential to understanding its overall CSL structure. As such, while this study has only revealed the cross-national differences between China and the US-EU nations in a ‘coarse’ manner due to its limited budget, the inter-province differences within China should be determined with greater precision. This goal requires that more IRT-based CSL studies be conducted in China on a country-wide basis. In this respect, the methodological approach that underlies this work, as a whole, may be of benefit to future relevant CSL studies.

Author Contributions

Conceptualization, methodology, investigation, validation and writing (original draft and preparation), S.W.; Funding acquisition, investigation and supervision, Y.Z.; Validation, visualization, project administration, writing (original draft and preparation), writing (review and editing), Z.-Y.Z.

Funding

MOE Project of Humanities and Social Sciences, China (No. 13YJA910005); Ministry of Science and Technology, Taiwan (ROC) (MOST-106-2410-H-038-001; MOST-107-2410-H-992-046); Zhejiang Provincial Natural Science Foundation, Zhejiang, China (No: LY13A010001; No. LY18A010005); Taipei Medical University and National Taiwan University of Science and Technology (TMU-NTUST) Joint Research Fund, Taiwan (ROC) (No. TMU-NTUST-107-09); TMU Research Project, Taipei Medical University, Taiwan (ROC) (No. TMU105-AE1-B46); UM (Universidade de Macau) Research Fund, Macau (No. CPG2015-00017-FST). This research is also partly supported by the following funds: Fundamental Research Funds for the Central Universities; ZJU-Stanford Collaboration Fund, Zhejiang University Education Foundation.

Conflicts of Interest

The authors declare no conflict of interest.

Appendix A

First, it should be noted that Zhejiang province is not only one of the economic engines of China. Rather, the average education level and socioeconomic level of the province’s citizens are above the averages for China as a whole. In addition, the past CSL surveys conducted by the government (i.e., the 10 surveys discussed in Section II.A) always included this province, which implies that there is a good data source basis for our study. Secondly, in 2013, the disposable income per capita of this province was CNY 37,851, which was above the national average at that time of CNY 18,311. This number ranked first among all the provinces in China, just behind the numbers for the two main municipalities of the country, Shanghai and Beijing [59]. As an investigation area, therefore, this province was more suitable than other areas in China not merely because it has an income level closer to those of the developed countries with which its results were to be compared, but also because it has a population larger than any of China’s municipalities, according to the 2013 data by National Bureau of Statistic of China. Thirdly, Zhejiang is a province where development and welfare are both more homogeneous (i.e., than in other administrative provinces). This was shown by the ‘Relative Affluence Report of 2013’, which revealed that 5 of the top 10 most relatively ‘affluent’ cities of China are in Zhejiang. Moreover, Zhejiang, in overall terms, received a top-ranked relative affluence score, as measured by the ‘county prosperous index’. This is another fact that makes Zhejiang more similar than other provinces in China to the developed countries with which it was to be compared. In summary, the aforementioned points have not only addressed the ‘representativeness’ of the survey sample from Zhejiang, but also indicate the ‘comparability’ of any results from Zhejiang that were subsequently analysed.

Appendix B

Questions in the ’inquiry’ questionnaire block are the following:
(1)
What is your understanding of the term ’scientific research’?
(2)
What is the best approach to learn, for example, whether a new medicine is effective in treating hypertension?
(3)
A doctor told a couple that for their children the probability that they will suffer from a genetic disease is 1/4. How do you recognize the doctor’s statement?

References

  1. Roberts, D.A. Linne Scientific Literacy Symposium Opening Remarks. In Promoting Scientific Literacy: Science Education Research in Transaction, Proceedings of the Linnaeus Tercentenary Symposium, Uppsala, Sweden, 23–25 May 2007; Geotryckeriet Press: Uppsala, Sweden, 2007. [Google Scholar]
  2. Roberts, D. Scientific literacy/science literacy. In Handbook of Re-search on Science Education; Abell, S.K., Lederman, N.G., Eds.; Lawrence Erlbaum: Mahwah, NJ, USA, 2007; pp. 729–780. [Google Scholar]
  3. PISA 2015 Results in Focus (Electronic Version). OECD (The Organization for Economic Cooperation and Development). Available online: https://www.oecd.org/pisa/pisa-2015-results-in-focus.pdf (accessed on 6 April 2016).
  4. Roth, W.M.; Barton, A.C. Rethinking Scientific Literacy; Routledge: New York, NY, USA, 2004. [Google Scholar]
  5. Norris, S.P.; Phillips, L.M. How literacy in its fundamental sense is central to scientific literacy. Sci. Educ. 2003, 87, 224–240. [Google Scholar] [CrossRef]
  6. Yore, L.D.; Treagust, D.F. Current realities and future possibilities: Language and science literacy—Empowering research and informing instruction. Int. J. Sci. Educ. 2006, 28, 291–314. [Google Scholar] [CrossRef]
  7. Kelly, G.J. Scientific literacy, discourse, and epistemic practices. In Exploring the Landscape of Scientific Literacy; Linder, C., Ostman, L., Roberts, D., Wickman, P., Erickson, G., MacKinnon, A., Eds.; Routledge: London, UK, 2011; pp. 61–73. [Google Scholar]
  8. Osborne, J.; Simon, S.; Collins, S. Attitudes towards science: A review of the literature and its implications. Int. J. Sci. Educ. 2003, 25, 1049–1079. [Google Scholar] [CrossRef] [Green Version]
  9. Bäckstrand, K. Civic science for sustainability: Reframing the role of experts, policy-makers and citizens in environmental governance. Glob. Environ. Polit. 2003, 3, 24–41. [Google Scholar] [CrossRef]
  10. Clark, F.; Illman, D.L. Dimensions of Civic Science: Introductory Essay, Introductory Essay. Sci. Commun. 2001, 23, 5–27. [Google Scholar] [CrossRef]
  11. Colucci-Gray, L.; Camino, E.; Barbiero, G.; Gray, D. From scientific literacy to sustainability literacy: An ecological framework for education. Sci. Educ. 2006, 90, 227–252. [Google Scholar] [CrossRef]
  12. Correia, P.R.M.; Xavier do Valle, B.; Dazzani, M.; Infante-Malachias, M.E. The importance of scientific literacy in fostering education for sustainability: Theoretical considerations and preliminary findings from a Bra-zilian experience. J. Clean. Prod. 2010, 18, 678–685. [Google Scholar] [CrossRef]
  13. Miller, J.D. Scientific literacy: A conceptual and empirical review. Daedalus 1983, 11, 29–48. [Google Scholar]
  14. Miller, J.D. The measurement of civic scientific literacy. Public Underst. Sci. 1998, 7, 203–223. [Google Scholar] [CrossRef]
  15. Miller, J.D. The development of civic scientific literacy in the United States. In Science, Technology, and Society: A Sourcebook on Research and Practice; Kumar, D.D., Chubin, D.E., Eds.; Plenum Press: New York, NY, USA, 2000; pp. 21–47. [Google Scholar]
  16. Miller, J.D. Public understanding of, and attitudes toward, scientific research: What we know and what we need to know. Public Underst. Sci. 2004, 13, 273–294. [Google Scholar] [CrossRef]
  17. Durant, J.R.; Evans, G.A.; Thomas, G.P. The public understanding of science. Nature 1989, 340, 11–14. [Google Scholar] [CrossRef] [PubMed]
  18. Evans, G.; Durant, J. The relationship between knowledge and attitudes in the public understanding of science in Britain. Public Underst. Sci. 1995, 4, 57–74. [Google Scholar] [CrossRef] [Green Version]
  19. Bauer, M.; Durant, J.; Evans, G. European public perceptions of science. Int. J. Public Opin. Res. 1994, 6, 163–186. [Google Scholar] [CrossRef]
  20. Bauer, M.W. Survey research and the public understanding of science. In Handbook of Public Communication of Science & Technology; Bucchi, M., Trench, B., Eds.; Routledge: New York, NY, USA, 2008; pp. 111–130. [Google Scholar]
  21. Bauer, M.W.; Petkova, K.; Boyadjieva, P. Public knowledge of and attitudes to science: Alternative measures that may end the “science war”. Sci. Technol. Hum. Values 2000, 25, 30–51. [Google Scholar] [CrossRef]
  22. Mejlgaard, N.; Stares, S. Participation and competence as joint components in a cross-national analysis of scientific citizenship. Public Underst. Sci. 2010, 19, 545–561. [Google Scholar] [CrossRef]
  23. Miller, J.D.; Pardo, R. Civic scientific literacy and attitude to science and technology: A comparative analysis of the European Union, the United States, Japan, and Canada. In Between Understanding and Trust: The Public, Science, and Technology; Dierkes, M., von Grote, C., Eds.; Harwood Academic Publishers: Amsterdam, The Netherlands, 2000; pp. 81–129. [Google Scholar]
  24. Roos, J.M. Measuring science or religion? A measurement analysis of the national science foundation sponsored science literacy scale 2006–2010. Public Underst. Sci. 2014, 23, 797–813. [Google Scholar] [CrossRef] [PubMed]
  25. Laugksch, R.C.; Spargo, P.E. Development of a pool of scientific literacy test-items based on selected AAAS literacy goals. Sci. Educ. 1996, 80, 121–143. [Google Scholar] [CrossRef]
  26. Stocum, D.L. Reflections on Scientific Literacy, Worldviews, and Education. J. Civ. Lit. 2015, 2, 4–23. [Google Scholar]
  27. Cajas, F. Public understanding of science: Using technology to enhance school science in everyday life. Int. J. Sci. Educ. 1999, 21, 765–773. [Google Scholar] [CrossRef]
  28. Kawamoto, S.; Nakayama, M.; Saijo, M. A survey of scientific literacy to provide a foundation for de-signing science communication in japan. Public Underst. Sci. 2013, 22, 674–690. [Google Scholar] [CrossRef] [PubMed]
  29. Miller, J.D. Civic Scientific Literacy in the United States in 2016; International Center for the Advancement of Scientific Literacy: Ann Arbor, MI, USA, 2016. [Google Scholar]
  30. Miller, S. Public understanding of science at the crossroads. Public Underst. Sci. 2001, 10, 115. [Google Scholar] [CrossRef]
  31. Guillemin, F. Cross-cultural adaptation and validation of health status measures. Scand. J. Rheumatol. 1995, 24, 61–63. [Google Scholar] [CrossRef] [PubMed]
  32. Johnson, T.P. Approaches to equivalence in cross-cultural and cross-national survey research. Zuma Nachr. Spez. 1998, 3, 1–40. [Google Scholar]
  33. Van de Vijver, F.J.; Tanzer, N.K. Bias and equivalence in cross-cultural assessment: An overview. Eur. Rev. Appl. Psychol. 1997, 47, 263–279. [Google Scholar] [CrossRef]
  34. King, G.; Murray, C.J.L.; Salomon, J.A.; Tandon, A. Enhancing the validity and cross-cultural comparability of measurement in survey research. Am. Polit. Sci. Rev. 2003, 98, 567–583. [Google Scholar] [CrossRef]
  35. King, G.; Wand, J. Comparing incomparable survey responses: Evaluating and selecting anchoring vignettes. Soc. Sci. Electron. Publ. 2007, 15, 46–66. [Google Scholar] [CrossRef]
  36. Kristensen, N.; Johansson, E. New evidence on cross-country differences in job satisfaction using anchoring vignettes. Labour Econ. 2008, 15, 96–117. [Google Scholar] [CrossRef] [Green Version]
  37. Salomon, J.A.; Tandon, A.; Murray, C.J.L. Comparability of self-rated health: Cross sectional multi-country survey using anchoring vignettes. BMJ 2004, 328, 258. [Google Scholar] [CrossRef] [PubMed] [Green Version]
  38. Einsiedel, E.F. Mental maps of science: Knowledge and attitudes among Canadian adults. Int. J. Public Opin. Res. 1994, 6, 35–44. [Google Scholar] [CrossRef]
  39. Solomon, J.A. The classroom discussion of science-based social issues presented on television: Knowledge, attitudes and values. Int. J. Sci. Educ. 1992, 14, 431–444. [Google Scholar] [CrossRef]
  40. China State Council. Outline of the Action Plan for the Nation’s Science Literacy (2006–2010–2020). Chin. West. Sci. Technol. 2006, 6, 5–8. [Google Scholar]
  41. Zhang, Z.; Zhang, J. A survey of public scientific literacy in China. Public Underst. Sci. 1993, 2, 21–38. [Google Scholar] [CrossRef]
  42. Chen, F.; Shi, Y.; Xu, F. An analysis of the public scientific literacy study in China. Public Underst. Sci. 2009, 18, 607–616. [Google Scholar] [CrossRef]
  43. Ren, L.; Zhang, C.; Huang, Y.; He, W. On the new trend of the evaluation of civic scientific literacy in China. Stud. Sci. Pop. 2017, 12, 41–46. [Google Scholar]
  44. Wei, H.; Lei, R.; Chao, Z. Civic Scientific Literacy Survey in China. J. Sci. Temper 2014, 2, 169–182. [Google Scholar]
  45. Lei, R.; Feng, Z.; Xiaoyan, G. Construction and analysis of the index of the construction capacity of civic science literacy in China. J. Sci. Temper 2014, 2, 183–192. [Google Scholar]
  46. Johnson, I. A Problem of ‘Religion,’ and Polling, in China. Available online: http://cn.nytimes.com/china/20150702/c02sino-religion/en-us/ (accessed on 5 November 2015).
  47. Bock, R.D.; Lieberman, M. Fitting a response model for n dichotomously scored items. Psychometrika 1970, 35, 179–197. [Google Scholar] [CrossRef]
  48. Lord, F.M. Applications of Item Response Theory to Practical Testing Problems; Routledge: London, UK, 2012. [Google Scholar]
  49. Van der Linden, W.J.; Hambleton, R.K. Handbook of Modern Item Response Theory; Springer Science & Business Media: New York, NY, USA, 2013. [Google Scholar]
  50. Rizopoulos, D. Ltm: An R package for latent variable modeling and item response analysis. J. Stat. Softw. 2006, 17, 1–25. [Google Scholar] [CrossRef]
  51. China Statistical Yearbook 2013. National Bureau of Statistics of China. Available online: http://www.stats.gov.cn/tjsj/ndsj/2013/indexce.htm (accessed on 21 August 2018).
  52. Sanders, R. A market road to sustainable agriculture? Ecological agriculture, green food and organic agriculture in China. Dev. Chang. 2006, 37, 201–226. [Google Scholar] [CrossRef]
  53. Shiyi, C. Energy Consumption, CO2 emission and sustainable development in Chinese industry. Econ. Res. J. 2009, 4, 1–5. [Google Scholar]
  54. Tilman, D.; Cassman, K.G.; Matson, P.A.; Naylor, R.; Polasky, S. Agricultural sustainability and intensive production practices. Nature 2002, 418, 671. [Google Scholar] [CrossRef] [PubMed]
  55. Huang, Q.; Li, M.; Chen, Z.; Li, F. Land consolidation: An approach for sustainable development in rural China. Ambio 2011, 40, 93–95. [Google Scholar] [CrossRef] [PubMed]
  56. Long, H.; Liu, Y.; Li, X.; Chen, Y. Building new countryside in China: A geographical perspective. Land Use Policy 2010, 27, 457–470. [Google Scholar] [CrossRef]
  57. Sjøberg, S.; Schreiner, C. The ROSE Project: An Overview and Key Findings; University of Oslo Press: Oslo, Norway, 2010. [Google Scholar]
  58. Miller, J.D. Civic scientific literacy: The role of the media in the electronic era. Sci. Media 2010, 40, 44–63. [Google Scholar]
  59. Disposable Income per Capita in China in 2013, by Region (in yuan). Available online: http://www.statista.com/statistics/278854/available-income-per-household-in-china-by-region/ (accessed on 6 June 2014).
  60. Marr, B. Big Data in Practice; Wiley: Hoboken, NJ, USA, 2016; ISBN 978-1-119-23138-7. [Google Scholar]
  61. McAfee, A.; Brynjolfsson, E.; Davenport, T.H.; Patil, D.J.; Barton, D. Big data: The management revolution. Harv. Bus. Rev. 2012, 90, 61–67. [Google Scholar]
  62. Ramanathan, R.; Mathirajan, M.; Ravindran, A.R. Big Data Analytics Using Multiple Criteria Decision-Making Models; CRC Press: Boca Raton, FL, USA, 2017. [Google Scholar]
  63. Zhuang, Z.Y.; Chiang, I.J.; Su, C.R.; Chen, C.Y. Modelling the decision of paper shredder selection using analytic hierarchy process and graph theory and matrix approach. Adv. Mech. Eng. 2017, 9, 1–11. [Google Scholar] [CrossRef]
  64. Zhuang, Z.Y.; Yang, L.W.; Lee, M.H.; Wang, C.Y. ‘MEAN+R’: Implementing a web-based, multi-participant decision support system using the prevalent MEAN architecture with R based on a revised intuitionistic-fuzzy multiple attribute decision-making model. Microsyst. Technol. 2018, 24, 1–19. [Google Scholar] [CrossRef]
  65. Chi, L.P.; Zhuang, Z.Y.; Fu, C.H.; Huang, J.H. A Knowledge Discovery Education Framework Targeting the Effective Budget Use and Opinion Explorations in Designing Specific High Cost Product. Sustainability 2018, 10, 2742. [Google Scholar] [CrossRef]
  66. Hsu, M.H.; Tan, P.J.B.; Chao, C.C. Condition monitoring and fault detection of wind turbines generator. In Proceedings of the 2018 IEEE International Conference on Applied System Invention (ICASI), Chiba, Japan, 13–17 April 2018; IEEE: Piscataway, NJ, USA, 2018; pp. 1218–1221. [Google Scholar]
  67. Zhuang, Z.-Y.; Hocine, A. Meta goal programing approach for solving multi-criteria de Novo programing problem. Eur. J. Oper. Res. 2018, 265, 228–238. [Google Scholar] [CrossRef]
  68. Uría, M.V.R.; Caballero, R.; Ruiz, F.; Romero, C. Meta-goal programming. Eur. J. Oper. Res. 2002, 136, 422–429. [Google Scholar] [CrossRef]
  69. Sue, D.W.; Arredondo, P.; McDavis, R.J. Multicultural counseling competencies and standards: A call to the profession. J. Couns. Dev. 1992, 70, 477–486. [Google Scholar] [CrossRef]
  70. Tervalon, M.; Murray-Garcia, J. Cultural humility versus cultural competence: A critical distinction in defining physician training outcomes in multicultural education. J. Health Care Poor Underserved 1998, 9, 117–125. [Google Scholar] [CrossRef] [PubMed]
  71. Tan, P.J.B.; Hsu, M.H. Designing a System for English Evaluation and Teaching Devices: A PZB and TAM Model Analysis. Eurasia J. Math. Sci. Technol. Educ. 2018, 14, 2107–2119. [Google Scholar] [CrossRef] [Green Version]
  72. Bauer, M.W. The evolution of public understanding of science-discourse and comparative evidence. Sci. Technol. Soc. Int. J. 2009, 14, 221–240. [Google Scholar] [CrossRef] [Green Version]
  73. Bauer, M.W.; Allum, N.; Miller, S. What can we learn from 25 years of PUS survey research? Liberating and expanding the agenda. Public Underst. Sci. 2007, 16, 79–95. [Google Scholar] [CrossRef] [Green Version]
  74. Bauer, M.; Schoon, I. Mapping variety in public understanding of science. Public Underst. Sci. 1993, 2, 141–155. [Google Scholar] [CrossRef]
  75. Durant, J.; Evans, G.; Thomas, G. Public understanding of science in Britain: The role of medicine in the popular representation of science. Public Underst. Sci. 1992, 1, 161–182. [Google Scholar] [CrossRef]
  76. Okamoto, S.; Niwa, F.; Shimizu, K.; Sugiman, T. The 2001 Survey of Public Attitudes toward and Understanding of Science & Technology in Japan; NISTEP Report No.72; National Institute of Science and Technology Policy: Tokyo, Japan, 2002.
  77. Resnick, D.P.; Resnick, L.B. The nature of literacy: An historical exploration. Harv. Educ. Rev. 1977, 47, 370–385. [Google Scholar] [CrossRef]
  78. Shen, B.S.P. Views: Science literacy: Public understanding of science is becoming vitally needed in de-veloping and industrialized countries alike. Am. Sci. 1975, 63, 265–268. [Google Scholar]
  79. Withey, S.B. Public opinion about science and scientists. Public Opin. Q. 1959, 23, 382–388. [Google Scholar] [CrossRef]
  80. Ziman, J. Public understanding of science. Sci. Technol. Hum. Values 1991, 16, 99–105. [Google Scholar] [CrossRef]
Figure 1. The overall research framework of this study.
Sustainability 10 03129 g001
Figure 2. Spatial location of the difficulty and the discrimination of each question.
Sustainability 10 03129 g002
Figure 3. The assessed civic scientific literacy (CSL) latent variable values: the overall distribution.
Sustainability 10 03129 g003
Figure 4. Frequency of the respondent CSL levels (the real distribution of the estimated latent variable values).
Sustainability 10 03129 g004
Table 1. The estimated item response parameters for the concept-dimensional questions.
Testing Question (Item ID. Question)Difficulty
(bi)
Discrimination
(ai)
Lower Asymptotic
(ci)
1. The temperature in the core of the Earth is very high−0.2381.5481.15 × 10−6
2. The oxygen we breath comes from plants−0.9371.0046.13 × 10−16
3. The gender of the child is determined by father’s gene−0.1060.6502.27 × 10−9
4. Antibiotics kills viruses1.3700.9391.41 × 10−6
5. Over millions of years, the land we are living drifted gradually, and it will drift continuously0.1192.0091.36 × 10−11
6. Vaccination can heal one from many diseases0.9240.9501.53 × 10−6
7. The earliest ancestors of human beings lived in the same era with dinosaurs0.3561.4024.29 × 10−10
8. Milk containing radioactive substances is safe to drink after boiling0.0211.5928.15 × 10−11
9. Light travels faster than sound−0.5522.0541.60 × 10−15
10. The movement of the Earth’s plates leads to earthquakes−0.3832.0978.04 × 10−21
11. The viruses of Hepatitis B will not spread through the air−0.3690.8813.88 × 10−12
12. The color of a flower is determined by genes0.2721.2393.79 × 10−11
13. Sounds only propagate in the air0.6091.1541.35 × 10−8
14. To our best knowledge, humans are evolved from earlier animal species −0.5281.3216.69 × 10−14
15. All radiations are caused by human or produced artificially0.2471.8391.22 × 10−11
16. A laser is generated by gathering many sound waves1.2531.3546.71 × 10−7
17. An electron is smaller than an atom1.0961.2587.64 × 10−10
18. One day is required for Earth to revolve round the Sun 0.6131.1309.59 × 10−5
19. Select the best description of the term ‘particle’2.2510.9677.84 × 10−8
20. Select the best description of the term ‘DNA’2.5360.3612.66 × 10−7
21. Select the best description of the term ‘Internet’1.1951.2032.50 × 10−8
22. Select the best definition of ‘nano’1.1171.4351.65 × 10−7
Average0.4941.290
Table 2. Comparison of the question item parameters for the identical questions used in both the China and 1995 US-EU surveys.
The Identical QuestionsIDDifficulty
(in China)
Discrimination (in China)Difficulty (in US-EU)Discrimination (in US-EU) *
Select the best description of the term ‘DNA’Q202.5360.3611.1911.710
Light travels faster than soundQ9−0.5522.054−0.8721.318
A laser is generated by gathering many sound wavesQ161.2531.3540.4351.518
All forms of radiation are caused by humans or are produced artificiallyQ150.2471.839−0.1851.775
An electron is smaller than an atomQ171.0961.2580.3120.910
The earliest ancestors of human beings lived in the same era as dinosaursQ70.3561.402−0.0740.911
Over millions of years, the land we are living on has drifted gradually, and it will continue to driftQ50.1192.009−1.6361.275
Milk containing radioactive substances is safe to drink after boilingQ80.0211.592−0.4991.450
The temperature in the core of the Earth is very highQ1−0.2381.548−1.8871.467
Antibiotics kill virusesQ41.3700.9391.1580.908
(* Table Note: The parameters for US-EU were sourced directly from [14]. These listed discrimination parameters have multiplied Miller’s results by 1.7, so that they can be compared fairly with the results from this study in the same measurement scale.)
Table 3. Qualified rates of the differently stratified sample groups.
CharacteristicGroup-of Respondents in
Sample
Possessing Partial CSL at Least in the Concept Dimension Possessing Partial CSL at Least in the Inquiry Dimension Possessing Full CSLIs This Characteristic Effective (Does It Affect the Qualified Rate)? (p-Value)
GenderMale615217.95%22.14%9.22%Yes (0.00009)
Female566615.36%18.32%7.22%
Age18–27119733.75%33.42%17.46%Yes (<0.00001)
28–39223324.05%27.86%12.23%
40–54484414.35%20.07%7.18%
55–6935449.54%12.27%4.12%
EducationPrimary school31993.44%9.97%1.06%Yes (<0.00001)
Junior high414910.77%17.52%5.09%
Senior high school or post-secondary vocational362426.32%30.38%13.08%
University or above84654.73%43.97%30.38%
Occupation*J134037.65%37.65%20.29%Yes (<0.00001)
J264033.44%33.91%17.97%
J3114034.12%34.65%18.07%
J416894.68%11.25%2.25%
J5178320.58%23.33%9.76%
J694715.84%21.75%7.71%
J727534.91%32.73%19.27%
J824714.98%22.27%6.48%
J9130815.98%19.42%6.88%
J1027166.37%10.71%2.69%
J1172718.02%25.59%9.49%
MorphologyCountry (rural)734611.54%17.23%5.76%Yes (<0.00001)
Urban (including suburbs)447225.18%26.01%12.37%
InterestTotally not interested1581.27%3.16%0.00%Yes (<0.00001)
Not that interested4422.71%6.33%0.68%
Normal18634.51%8.32%1.77%
Interested674116.51%21.21%7.77%
Very interested264129.19%31.03%15.91%
Scientific knowledge channelNewspapers144516.89%22.28%7.82%Yes (<0.00001)
Book7119.72%22.54%9.86%
Periodicals8220.73%19.51%8.54%
TV68219.41%14.43%4.30%
Radio15313.73%15.69%7.19%
Internet (PC)209839.42%38.03%21.35%
Smartphone51721.08%30.56%10.83%
Social network13112.98%10.68%3.82%
Level of science activity involvementNo involvement at all721510.05%15.79%4.71%Yes (<0.00001)
Low involvement176922.10%23.18%10.29%
Medium-low involvement122027.30%26.39%12.54%
Medium involvement72030.28%31.39%15.42%
Medium-high involvement40934.47%33.50%18.83%
High involvement48534.23%40.21%23.20%
Frequency of scientific facility accessVery low37926.30%12.66%2.90%Yes (<0.00001)
Med-low332214.15%17.97%6.92%
Medium300622.39%25.88%10.88%
Med-high132532.45%32.83%16.53%
Very High37343.43%37.27%24.13%
(* Table Note: J1 = ‘Responsible persons or top management for enterprises, institutions, government department, and the party’; J2 = ‘Workers with professional skills’; J3 = ‘Foreign affair staffs, external con-tact staffs of institutions, and relevant personnel’; J4 = ‘Owners or employees of agriculture, forestry, animal husbandry, fishery, or water conservancy sectors’; J5 = ‘Business administration or service staffs’; J6 = ‘Production or transportation tool/vehicle operators’; J7 = ‘Students and people with further education pending’; J8 = ‘Unemployed or laid-off workers’; J9 = ‘Retirees’; J10 = ‘Households’; J11 = ‘Other unclassified’).
Table 4. Comparing the CSL-qualified ratios across countries.
CountryCSL-Qualified Ratio, 1995 (%)CSL-Qualified Ratio, 2005 (%)10-Years Increase
E.U.-Denmark82214
E.U.-England10144
E.U.-France41713
E.U.-Germany41814
E.U.-Greece176
E.U.-Ireland396
E.U.-Italy5127
E.U.-Netherlands82416
E.U.-Portugal165
E.U.-Spain396
U.S.A.122816
This survey-China8.26 (2013)? (2023)

