Article

Carbon Footprint Analyses and Potential Carbon Emission Reduction in China’s Major Peach Orchards

1
College of Resources and Environment, Southwest University, Chongqing 400716, China
2
Academy of Agricultural Sciences, Southwest University, Chongqing 400716, China
3
National Monitoring Station of Soil Fertility and Fertilizer Efficiency on Purple Soils, Southwest University, Chongqing 400716, China
*
Author to whom correspondence should be addressed.
Sustainability 2018, 10(8), 2908; https://doi.org/10.3390/su10082908
Submission received: 5 July 2018 / Revised: 13 August 2018 / Accepted: 14 August 2018 / Published: 16 August 2018
(This article belongs to the Special Issue Sustainable Crop Production Systems)

Abstract

:
An excess of material input in fruit orchards has brought serious environmental problems, particularly in China. However, studies on the estimation of greenhouse gas (GHG) emissions in peach orchards are limited. In this study, based on questionnaire surveys in major peach-producing regions, including the North China Plain (n = 214), as well as northwest (n = 22) and southwest (n = 33) China, the carbon footprints (CFs) of these orchards were calculated by the life cycle assessment. The potential emission reduction in each region was estimated by combining the GHG emissions and CFs with plantation areas and fruit yields. The results showed that the average GHG emissions in the North China Plain, northwest, and southwest regions were 15,668 kg CO2-eq ha−1, 10,386 kg CO2-eq ha−1, and 5580 kg CO2-eq ha−1, with corresponding CFs of 0.48 kg CO2-eq ha−1, 0.27 kg CO2-eq ha−1, and 0.20 kg CO2-eq kg−1, respectively. The main contribution source of GHG emissions in these three regions was fertilizer (77–95%), followed by electricity, pesticides, and diesel. By adopting advanced farming practices with high yield and a high partial factor productivity of fertilizer, the GHG emissions could be reduced by ~13–35%, with the highest potential reduction in the North China Plain. In conclusion, the GHG emissions and their CFs were impressively high in China’s major peach-producing regions, but these GHG emissions could be substantially decreased by optimizing nutrients and irrigation management, including the rational selection of fertilizer rates and types with water-saving irrigation systems or practices (e.g., mulching) for increasing fertilizer and water use efficiency, and maintaining a sustainable peach production in China or similar countries.

1. Introduction

The rapidly increasing fruit industry over the past 20 years in China has played a positive role in promoting the development of agricultural structure and rural economic growth. The planted orchard areas and yields from 1997 to 2016 in China had been increased by 1.5 and 5.6 times, respectively, and the increase of orchard yield was closely related to increasing fertilizer input [1]. According to annual statistics in China, the amount of fertilizer used in apple and citrus orchards was averagely as high as 932 kg ha−1 in 2014, which was substantially higher than in other commercial crops such as vegetables (603 kg ha−1) and cotton (546 kg ha−1) [2]. Previous study also showed that the averaged amounts of nitrogen (N), phosphorus (P2O5), and potassium (K2O) fertilizer in main peach-producing regions were as high as 734 kg ha−1, 492 kg ha−1, and 491 kg ha−1, respectively [3]. Such high fertilizer inputs in China’s orchards have caused serious environmental problems such as soil acidification [4] and nutrient excess [5], and limited the sustainability of the fruit industry. However, as the population increases with the change in consumption habits, the demand for fruits will be further increased by 1.1% annually in China [6]. By facing new challenges, including limited cropland, the need of agriculture for bioenergy production, and sustainable environment, agriculture improvements will therefore have to come from sustainable intensification that makes effective use of land, water, mineral, and other resources, while not causing them harm [7]. Thus, the ecological and environmental impact of fruit orchard plantations should be addressed.
At present, global warming has become a hot topic all over the world, and the relevant “emission reduction” has become a common challenge. Fertilization and other agricultural activities have been important factors of greenhouse gas (GHG) emissions, accounting for about 24% of the total global emissions [8]. Numerous countries and organizations have begun to use the “carbon footprint (CF)” to measure GHG emissions [9,10]. The CF refers to the emission of GHGs directly or indirectly from a product or activity through a complete life cycle, and uses the equivalent mass of carbon dioxide (CO2) as the unit of measurement [11]. Studies have gradually begun to quantify the agricultural carbon footprint after the emitted amount of CO2 from each link in both a crop and vegetable production system in China has been measured [12,13,14,15].
However, compared with other countries [16,17,18], results from a few studies on fruit productions in China indicated that carbon emissions in China’s orchards were substantially high [14,15]. As a method test of CF studies on orchards in China, the CF in orchards of apple from Shaanxi province, banana from Fujian province, citrus from Hubei province, peach from Shanghai province, and pear from Hebei province was 0.24 kg CO2-eq kg−1, 0.27 kg CO2-eq kg−1, 0.14 kg CO2-eq kg−1, 0.37 kg CO2-eq kg−1, and 0.18 kg CO2-eq kg−1, respectively [14]. Meanwhile, Liu et al. estimated GHG emissions in pear orchards and showed that the carbon footprint of pear orchard production links in Beijing and Liaoning province ranged from 0.06 kg CO2-eq kg−1 to 0.38 kg CO2-eq kg−1 [15]. These values were higher than those in apple orchards in New Zealand (0.04–0.1 kg CO2-eq kg−1) [18]. Furthermore, the exiting studies on estimating the carbon footprint of orchards only focused on a farm scale or certain region, while ignoring the sample size and the sufficiency of the representatives [14,15]. It was known that the environmental impacts were different even for the same crop in the same region, which derived from differences between management practices [19]. As a result, a reliable assessment on carbon footprint has to take account into the differences within and among the regions.
China is the origin of peach, and has the largest peach fruit plantation in the world, with 34% and 37% of the global planting areas and yields, respectively [20]. The peach plantation in China is geographically divided into six major regions, namely the northeast region (NE), North China Plain (NC), northwest arid region (NW), southwest region (SW), humid Yangtze River Basin (YZ), and south China tropics (SC) [21]. Among them, NC, NW, and SW are the main production areas in China, where the total planting area and total yield in 2015 accounted for 66% and 73% of the whole of China’s production areas, respectively [1]. However, the conditions of peach production, including climate, soil types, cultivars, and farmers’ management practices is different among these regions in China [21]. Until now, the quantification of a carbon footprint on peach orchards at the regional scale and their comparison among different regions is rare, which limits the estimation of regional potential emission reduction and the establishment of an emission reduction method.
Based on survey data from these three major peach plantation areas in China (NC, NW, and SW), this study firstly analyzed the composition and regional differences in their carbon footprint, and then the potential of reducing the carbon emissions in each region. The current carbon footprint status of peach orchards in these three regions was then evaluated to provide better understanding of the rational distribution of the peach industry and the reduction of carbon emissions in peach orchards.

2. Materials and Methods

2.1. Study Area and Regional Characteristics

The study areas included the NC, NW, and SW in China, which are the major peach-producing regions, but with different production conditions (Table 1). The North China Plain is the predominant peach-producing area in China with fertile loam soil, suitable temperature, and sufficient sunshine, rainfall, and irrigation. It alone produces 55% of the total peach production in China in 2015 (Table 1). While the peach orchards in NW generally feature sandy soils and a sunny and dried climate, the orchards in SW are sited with clay soils on sloping land, and rainy sparse sunlight (Table 1).

2.2. Data Sources and Processing

Hebei and Shandong, Shaanxi and Gansu, and Sichuan and Chongqing (municipality) provinces were selected as the representative surveying locations in the NC, NW, and SW regions, respectively, because these provinces are the top two provinces of peach production in each region in China [1]. According to the method of farmer survey [22], ~2–3 representative prefecture-level cities were selected from each province. Two counties or villages were randomly selected from each city or county. Ten farmers from each village were randomly selected for on-the-spot investigation. Based on the planted areas, a total of ~80–120 peach plantations or orchards were randomly surveyed from each above-mentioned province. The survey questionnaire was as follows: (1) area, variety, planting year, density, basic phenology, and yield of the last cropping season; (2) application of fertilizer and pesticide, including type, time, and amount; (3) labor costs and mechanical energy consumption for soil ploughing; and (4) electricity consumption for irrigation. In July and August of both 2016 and 2017, a total of 269 valid questionnaires were collected, including 214 from NC, 22 from NW, and 33 from SW, respectively. The collected data were saved in Excel 2010 sheets for further calculation and analysis.
A brief information from these questionnaire showed that chemical fertilizers including urea, monoammonium phosphate, potassium sulfate, and compound fertilizer (N-P2O5-K2O, 15-15-15, 17-5-22, 18-9-18, and so on) were often used, while the fermented and dried manure of sheep (N-P2O5-K2O, 2.01-0.49-1.32 in average) and cattle (N-P2O5-K2O, 1.67-0.43-0.95 in average) were generally used as organic fertilizer in these regions. The electricity was mainly used for irrigation by pumping the groundwater in NC and NW, and the frequency of irrigation was ~3–5 times per year, with total amounts of 300~500 m3 ha−1. Meanwhile, in SW, the electricity was used for irrigation by pumping the rainwater from the impounding reservoir for overcoming seasonal drought. At present, there is almost no mulch usage for retaining soil moisture in peach orchards in these three regions. Diesel for soil plough is zero in SW due to the hardness of ploughing in clay soil on sloping land.

2.3. Data Calculation

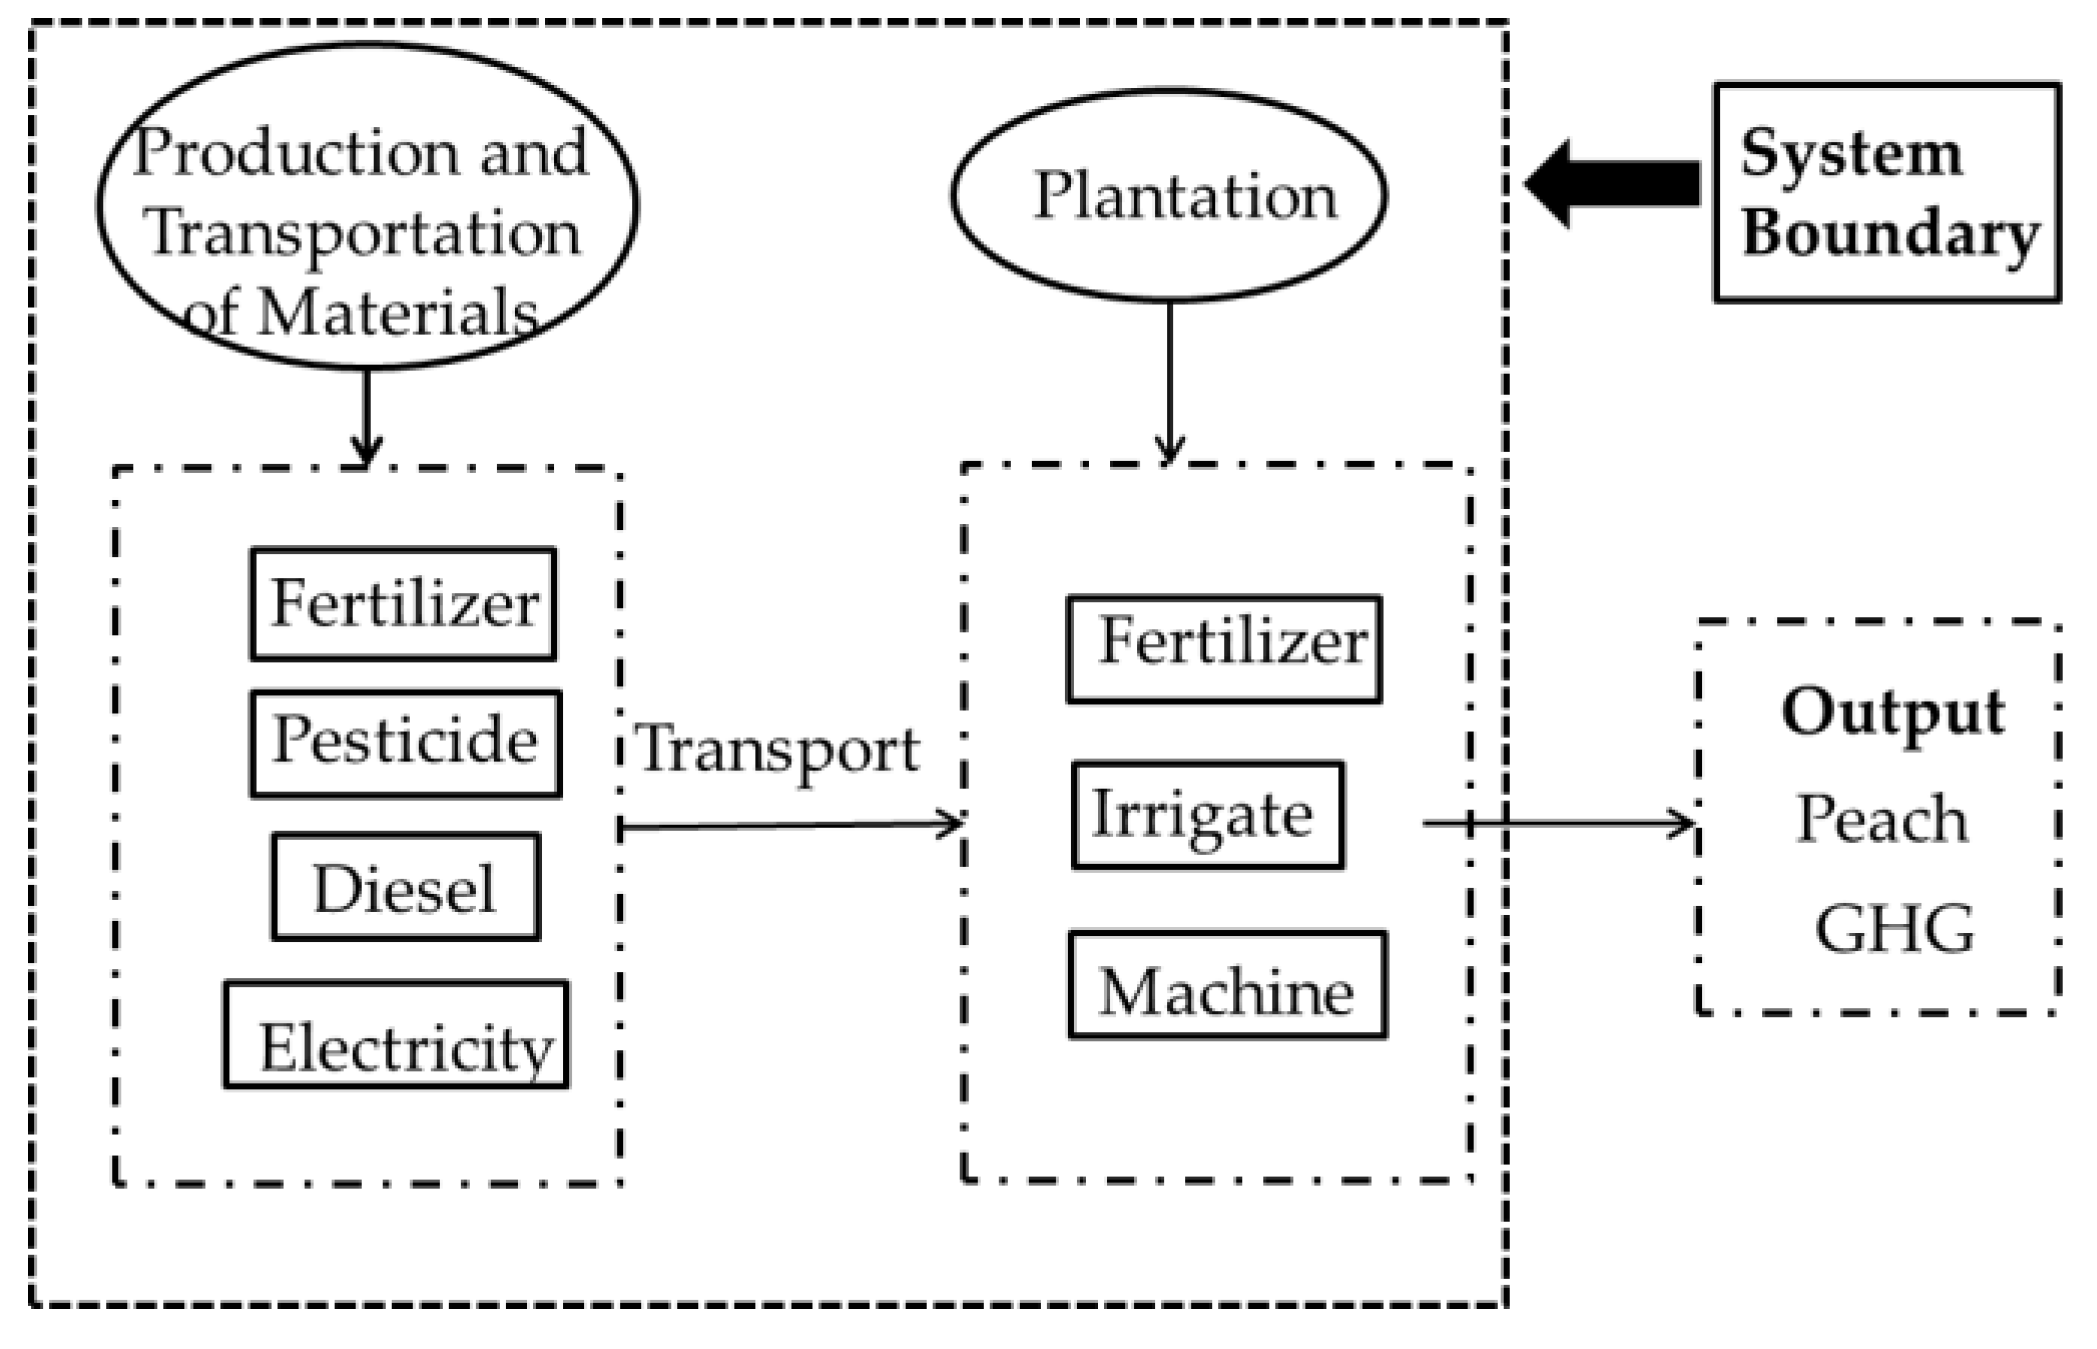
2.3.1. The Determination of the Boundary and Functional Units

According to the evaluation range of the life cycle assessment method “from the cradle to the grave”, the carbon emissions in this study were divided into two stages, namely, the agricultural materials stage and arable farming stage (Figure 1). The agricultural materials stage mainly included the production and transportation of fertilizers, pesticides, and diesel, and the production and transmission of electricity; meanwhile, the arable farming stage included the application of fertilizer and pesticides, the fuel consumption of mechanized management, the consumption of electricity, and so on. The functional units of this study were greenhouse gas emissions per kilogram of fresh peach fruit (carbon footprint) and per hectare.

2.3.2. Estimation of Carbon Footprint

The formulas for the estimation of carbon footprint are as follows:
CEt = CEAFS + CEAMS
CF = CEt/M
where CEt represents the total emissions of GHG (kg CO2-eq) generated by various agricultural inputs in the peach orchard; CEAFS is the emissions of N2O (kg CO2-eq) in arable farming stages of nitrogen (N, inorganic and organic) fertilizer (kg CO2-eq), including N2O emissions direct from soil, and after ammonia volatilization or soil nitrogen leaching; CEAMS means the GHG emissions (kg CO2-eq) in the stages of production, transportation, and investment of agricultural materials (chemical, pesticide, diesel, electricity). In addition, the GHG emissions per unit area and per unit yield are expressed as CFa (kg CO2-eq ha−1) and CFy (kg CO2-eq kg−1), respectively; meanwhile, M indicates the peach orchard planted area (ha) or yield (kg ha−1):
CEAMS = ∑(AIi × EFi)
CEAFS = AIN × 0.01 × 44/28 × 298 + AIM × EFM
where AIi represents the amount of agricultural input in item i (fertilizer and pesticide use unit is kg, electricity is kWh, diesel is L); and EFi is the amount of greenhouse gas emissions per unit or volume of agricultural material input in item i (kg CO2-eq kg−1, kg CO2-eq L−1, kg CO2-eq kWh−1) (Table 2); AIN is the amount of chemical N fertilizer input (kg); 0.01 is the N2O emissions that is caused by chemical N fertilizer in arable farming stages (kg N2O kg N−1) [23]; 44/28 is the conversion coefficient of N2O–N to N2O; 298 is the global warming potential of N2O under the 100-year scale; AIM is the amount of organic fertilizer in forms of dry weight (kg), and EFM is the N2O emissions that is caused by organic fertilizer input, whose value is 0.223 kg CO2-eq kg−1 organic fertilizer (dry weight) according to Zhang’s study [24].

2.4. Relevant Definition

2.4.1. Partial Factor Productivity (PFP)

Partial factor productivity (PFP) is the amount of applied fertilizer per unit fruit yield, and thus, PFP-N indicates the PFP of N fertilizer [28].

2.4.2. Potential Emission Reduction

According to previous study [12], if the corresponding yields and PFP-N of a peach orchard are higher than the averaged values (mean) in the same region, it is defined as a high yield and high efficiency peach orchard (HH). The reduction potential of GHG emissions per unit area or per unit yield, namely CF, is the difference between a HH orchard and the average GHG emissions or CF. Under the current plantation area, the regional potential emission reduction of GHG is the potential GHG emissions per area multiplied by the plantation area. The regional potential reduction of CF under the current yield level is the potential CF reduction of the region multiplied by regional total production. Among them, the plantation area and regional total production are listed in Table 1. Furthermore, a maximum potential of GHG emission reduction through optimizing fertilizer input is also projected under the condition of unchanged agricultural material input except the optimal fertilizer input, according to expert recommendation [29].

2.5. Data Analysis and Statistics

For the items of input and output of the three major peach plantation regions (Table 3) and their GHG emissions and CF (Figure 2), due to the abnormal distribution of some parameters in SW and NW, non-parametric tests of independent samples were used to compare the significant difference of medians across groups by the Kruskal–Wallis one-way ANOVA in SPSS (20.0 version). The Pearson chi-square test in SPSS software was conducted to compare the significant difference in distribution of individual input to the total GHG emissions in these three regions (Figure 3). Independent student’s tests in SPSS software were performed to compare the significant difference of parameters within each region (Table 4 and Table 5). The White test in Stata software (14.1 version) was used to test the heteroscedasticity of linear models between the total nitrogen input and carbon footprint of the studied regions (Figure 3), and all of the data without filtering any point were used, because all of them fitted in the range of mean ± 3 × SD (standard deviation).

3. Results

3.1. Input and Output in Peach Production in Major Regions

Analyses of the surveyed questionnaire data showed that there were significant differences in agriculture material input among the three regions according to the median test of these datasets (Table 3). The total amount of applied nitrogen (N), phosphorus (P2O5), and potassium (K2O) fertilizer was highest in NC, and only 40%, 43%, and 40% of these NC’s inputs were respectively seen in SW. However, the respective proportion of organic N, P, and K was highest in SW (20%, 20%, and 21%), higher in NC (16%, 15%, and 14%) and lowest in NW (7%, 9%, and 7%). The inputs of pesticides were highest in NC (37.2 kg ha−1), and 36% and 29% of these NC’s inputs were observed in NW and SW, respectively; the consumption of electricity for irrigation was highest in NW (1827 kWh ha−1), higher in NC (1219 kWh ha−1), and lowest in SW (<100 kWh ha−1); and the diesel consumption in NC and NW was similar (19.6 L ha−1 and 14.7 L ha−1), while there was no diesel consumption in SW. The yield output was highest in NW (37.8 t ha−1), higher in NC (35.7 t ha−1), and lowest in SW (31.4 t ha−1).

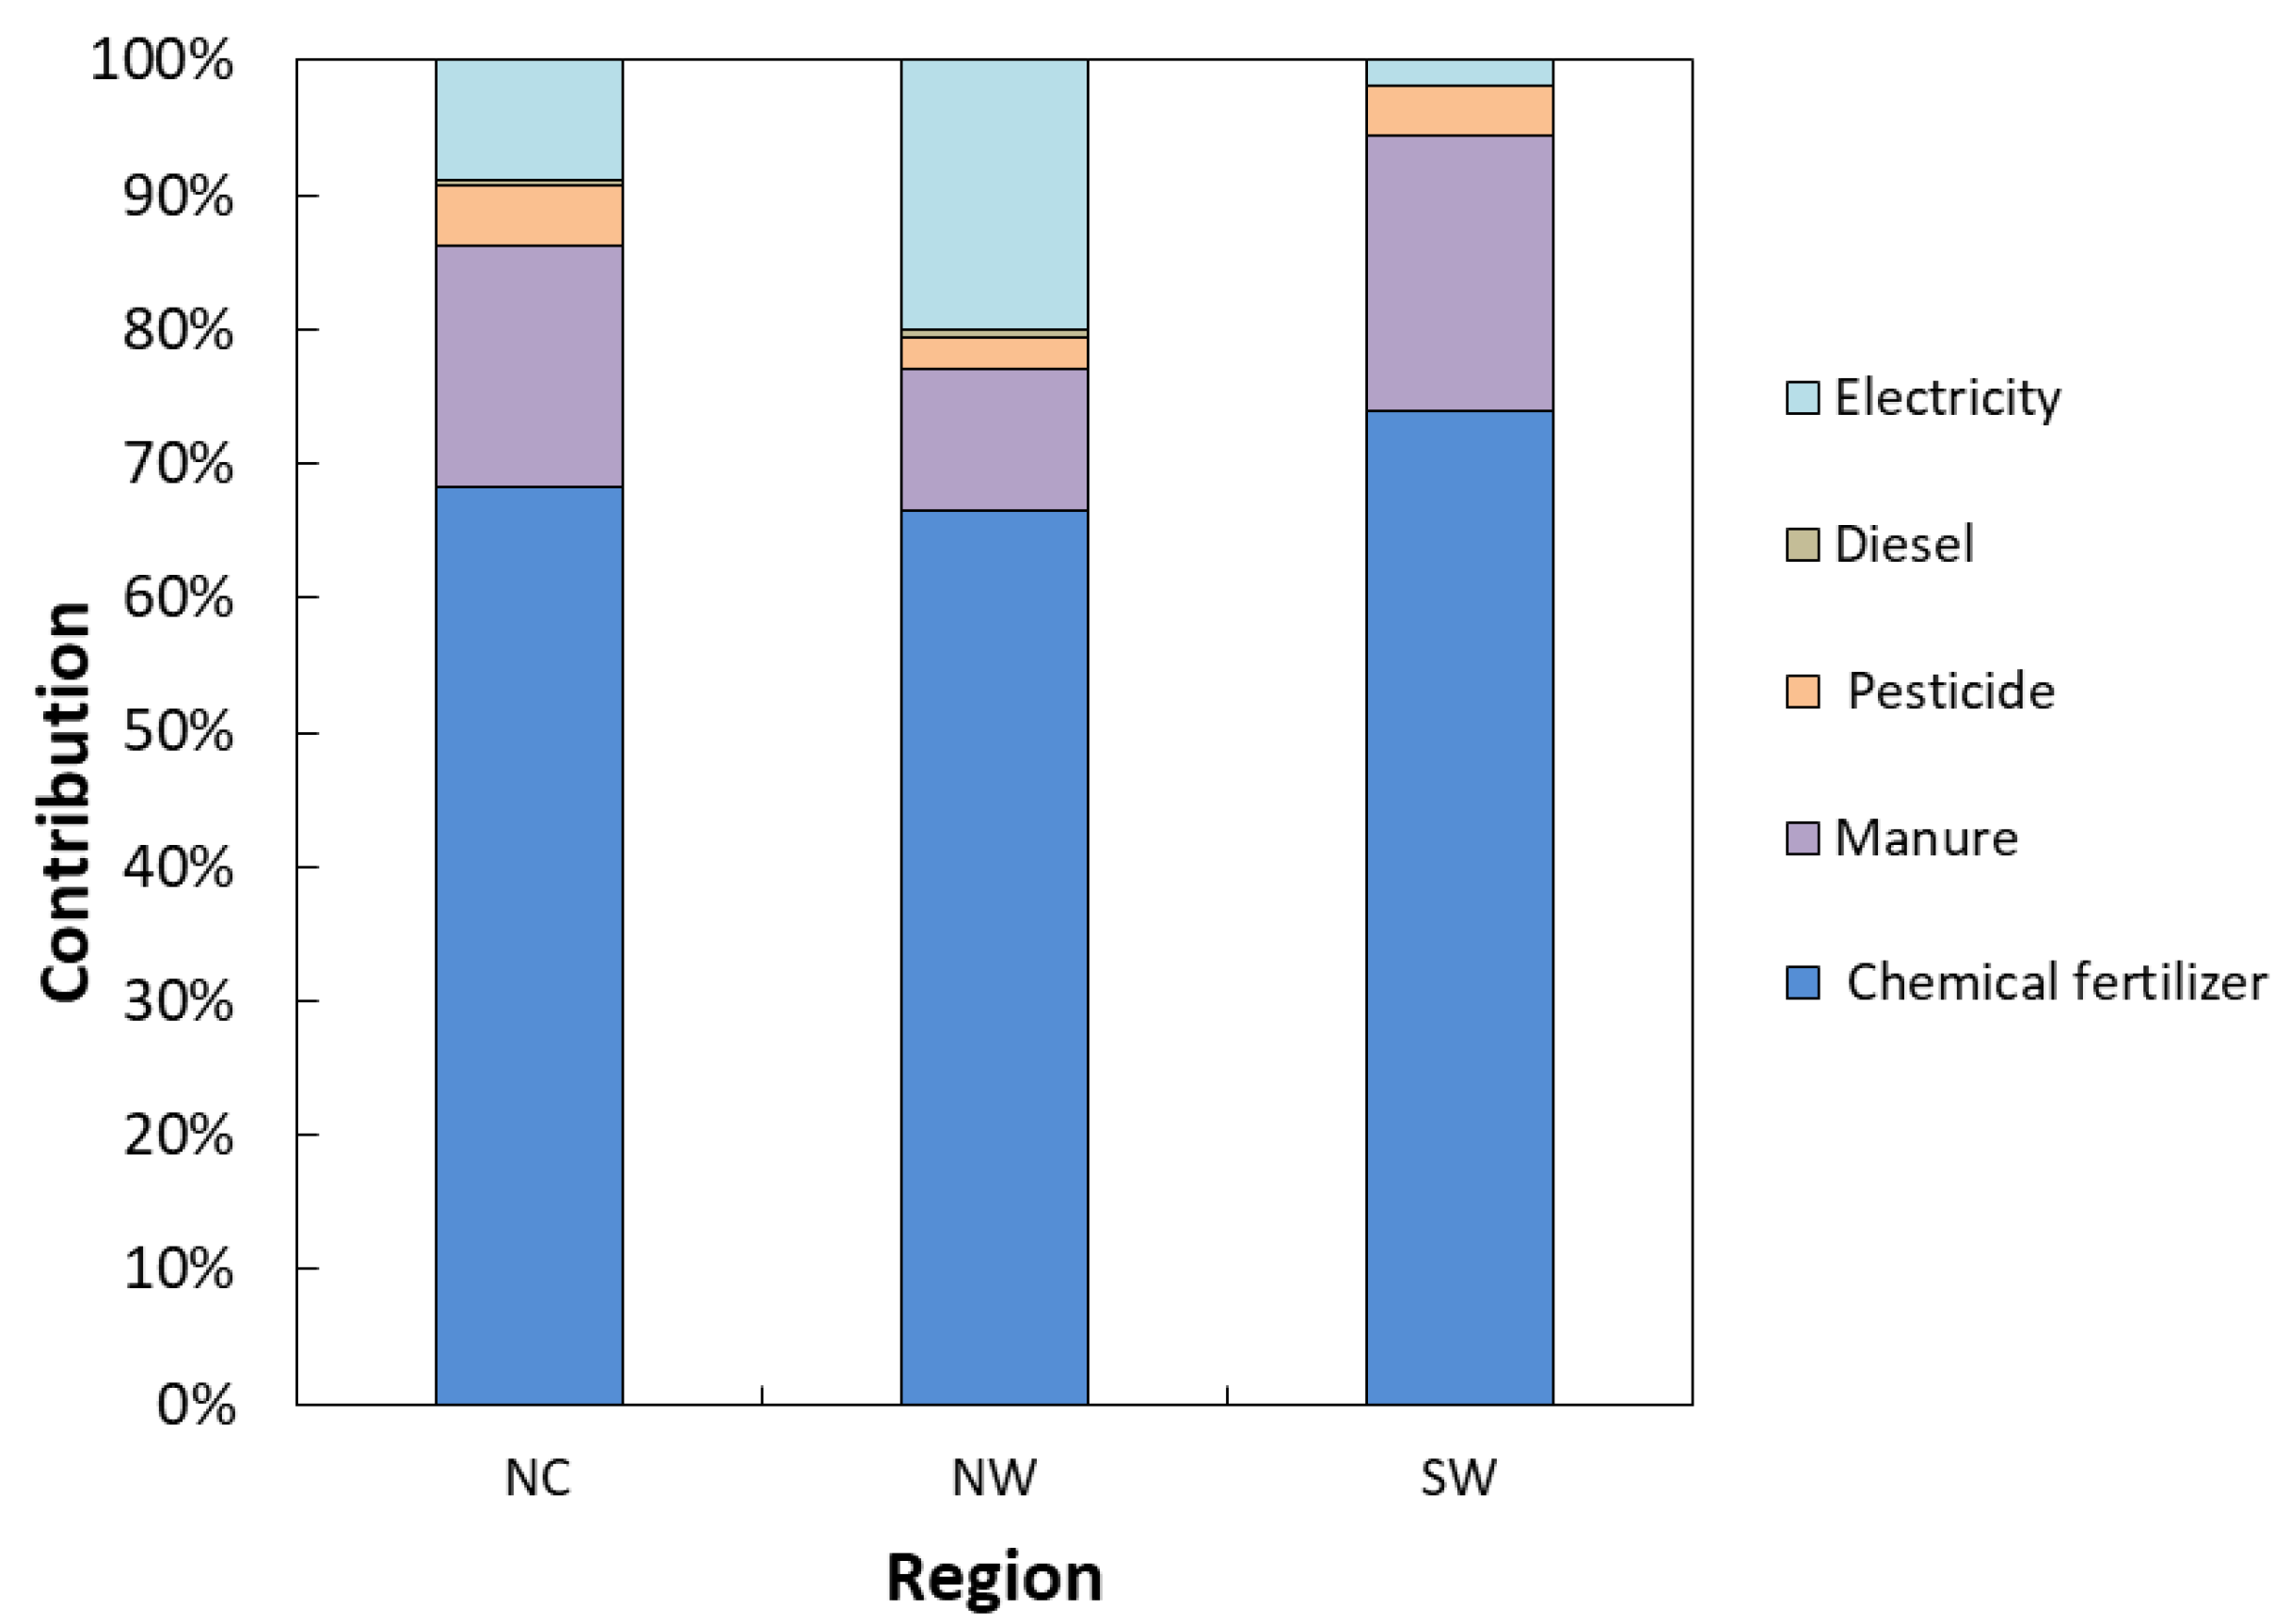
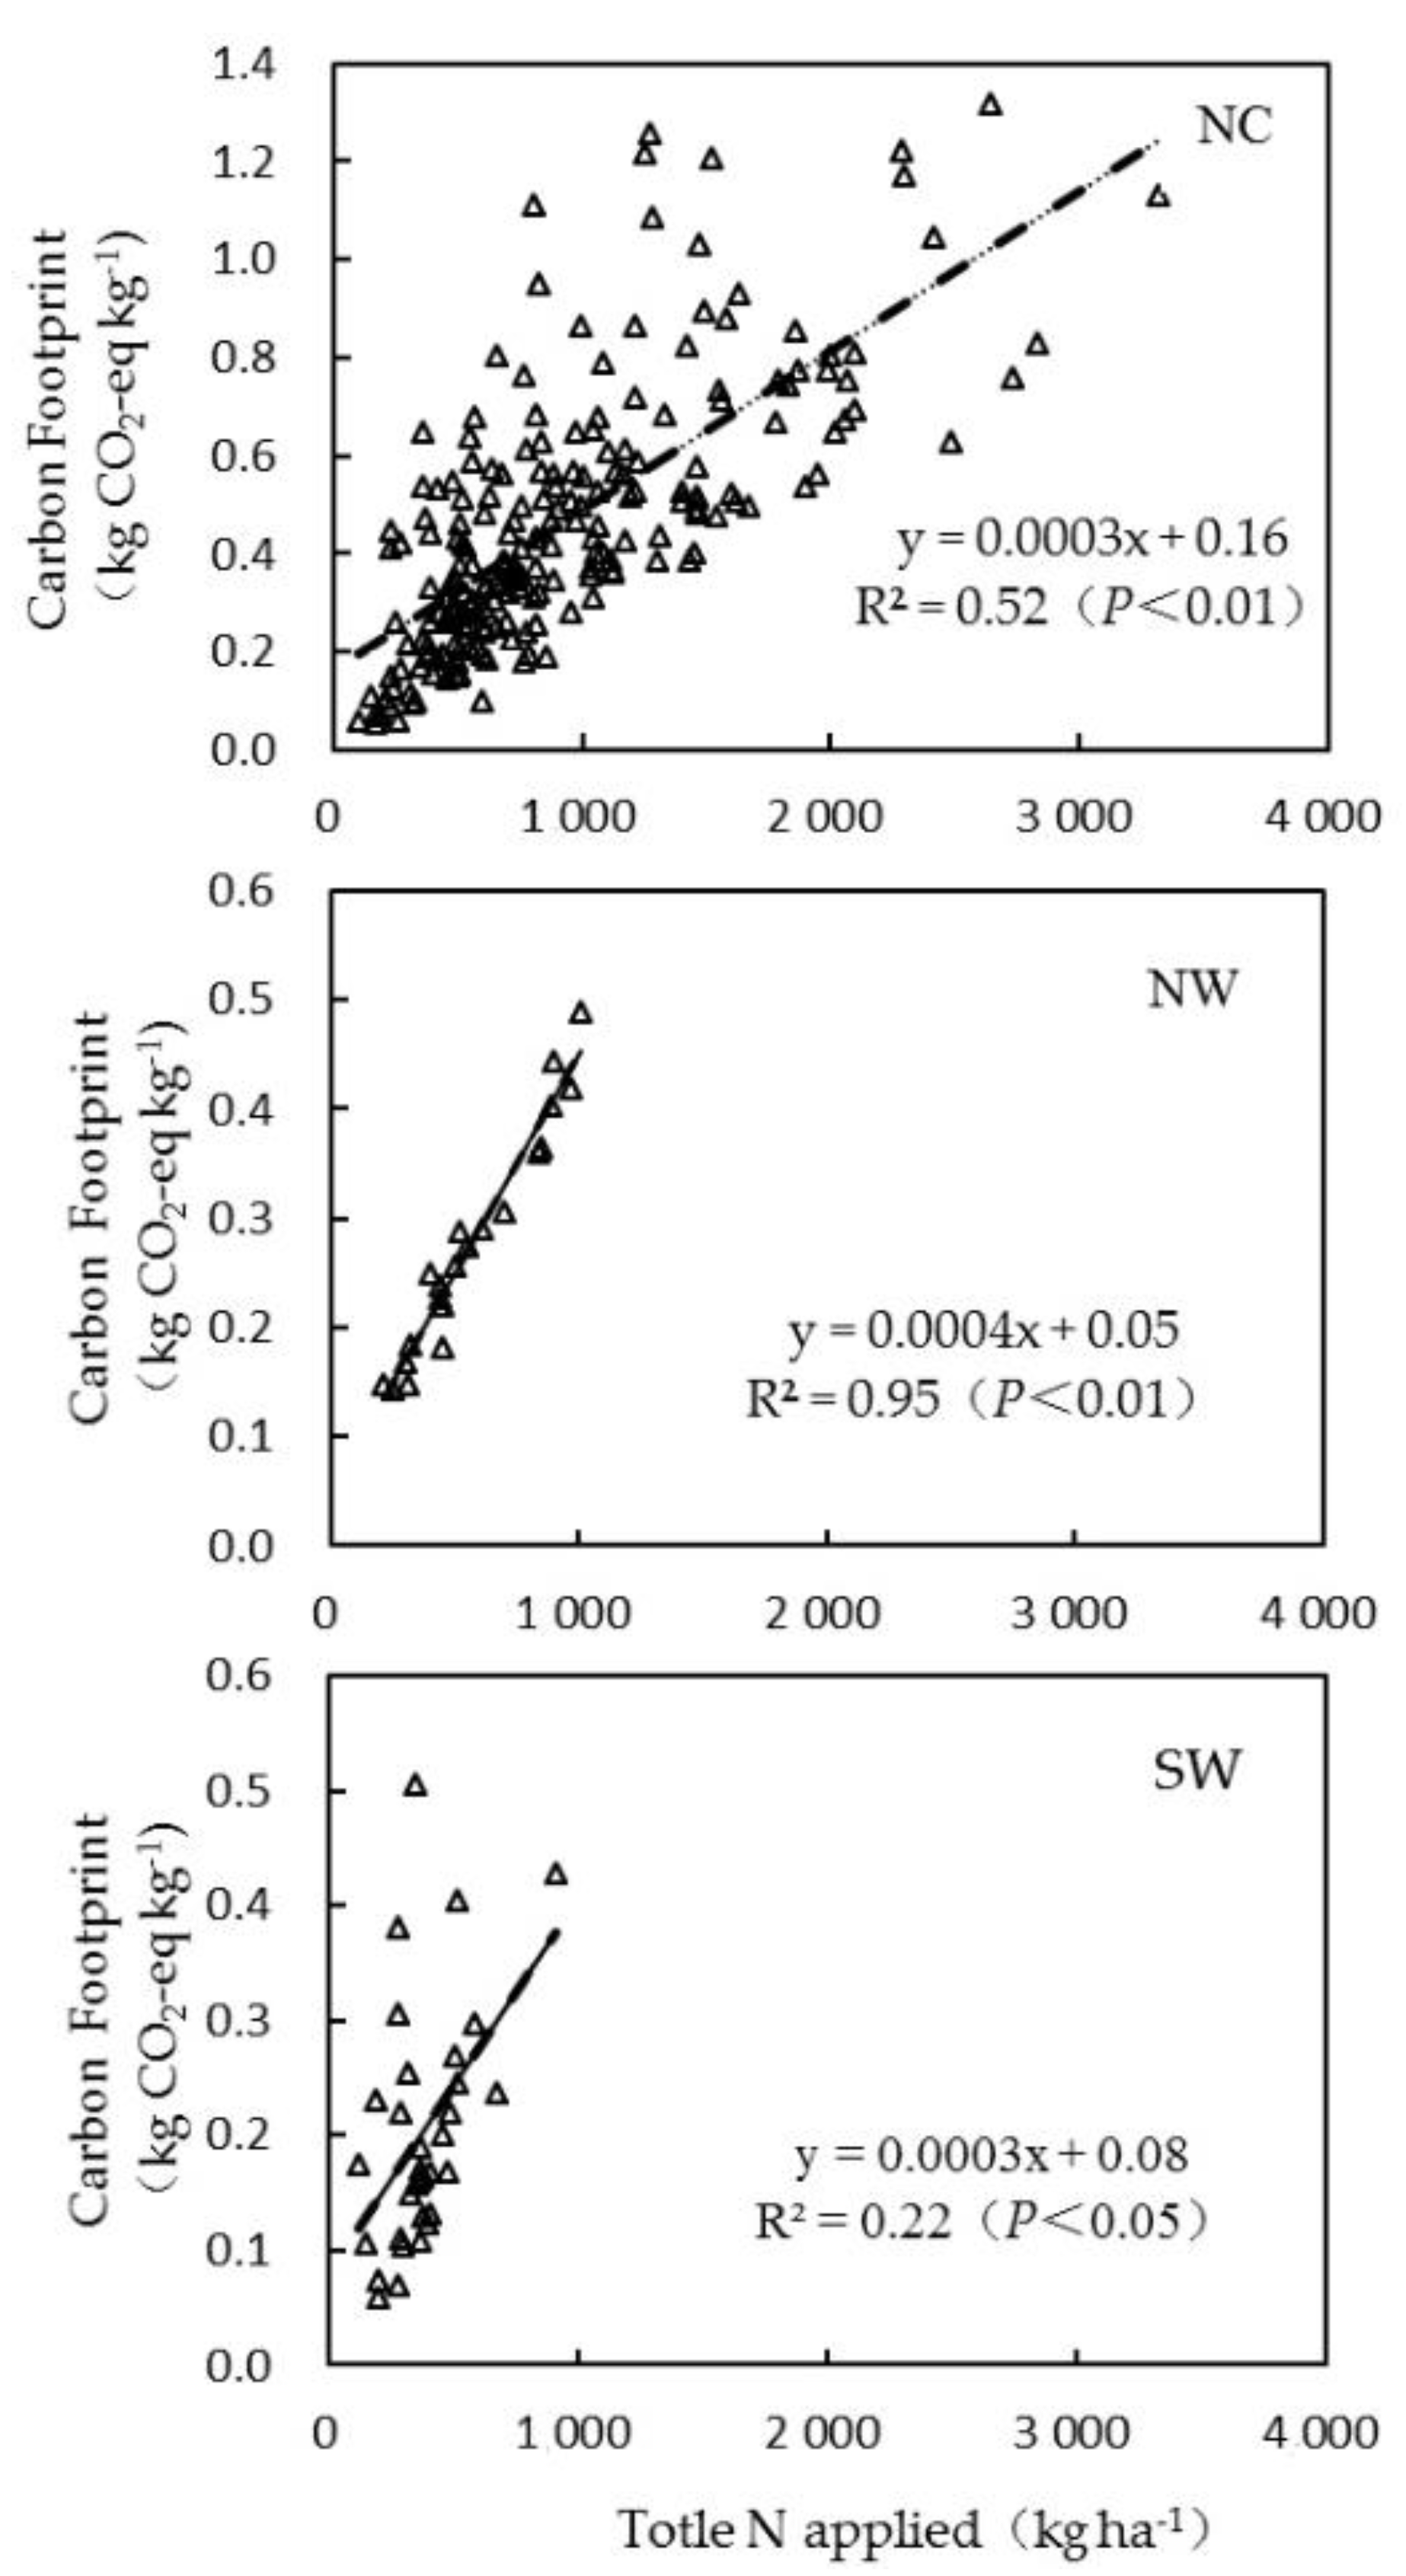
3.2. Contributions of Individual Input to GHG Emissions

Among the three regions, the averaged GHG emissions and corresponding CF were highest in NC (15,668 kg CO2-eq ha−1and 0.48 kg CO2-eq kg−1), higher in NW (10,386 kg CO2-eq ha−1 and 0.27 kg CO2-eq kg−1), and lowest in SW (580 kg CO2-eq ha−1 and 0.20 kg CO2-eq kg−1) (Figure 2). The median test also showed that GHG emissions in both NC and NW were significantly higher than that in SW, while there were no significant differences between NC and NW; the CF in both SW and NW was significantly lower than that in NC (Figure 2).
The contribution factor analysis showed that fertilizers were the primary emission factor for GHG emissions (Figure 3), and the N fertilizer contributed 66%, 68%, and 70% of these GHG emissions in NC, NW, and SW, respectively. Meanwhile, the electricity was the second largest contributor, which accounted for 20%, 9%, and 2% in NW, NC, and SW, respectively; meanwhile, both the pesticides and diesel contributed less than 5% in all these three regions, except there was no diesel contribution in SW. Results from the Pearson chi-square test showed that the contribution factors, including chemical fertilizer (p = 0.036), manure (p < 0.01), diesel (p < 0.01), and electricity (p < 0.01), were significant differences among the three regions. Furthermore, the input of N fertilizer was significantly and linearly correlated with CF in these three regions, particularly in NC and NW (Figure 4). In addition, the White test showed that the heteroscedasticity of the linear models in NC (p = 0.067), NW (p = 0.436), and SW (p = 0.783) was non-existent, indicating the other missing independent factors such as pesticide, diesel, and so on.

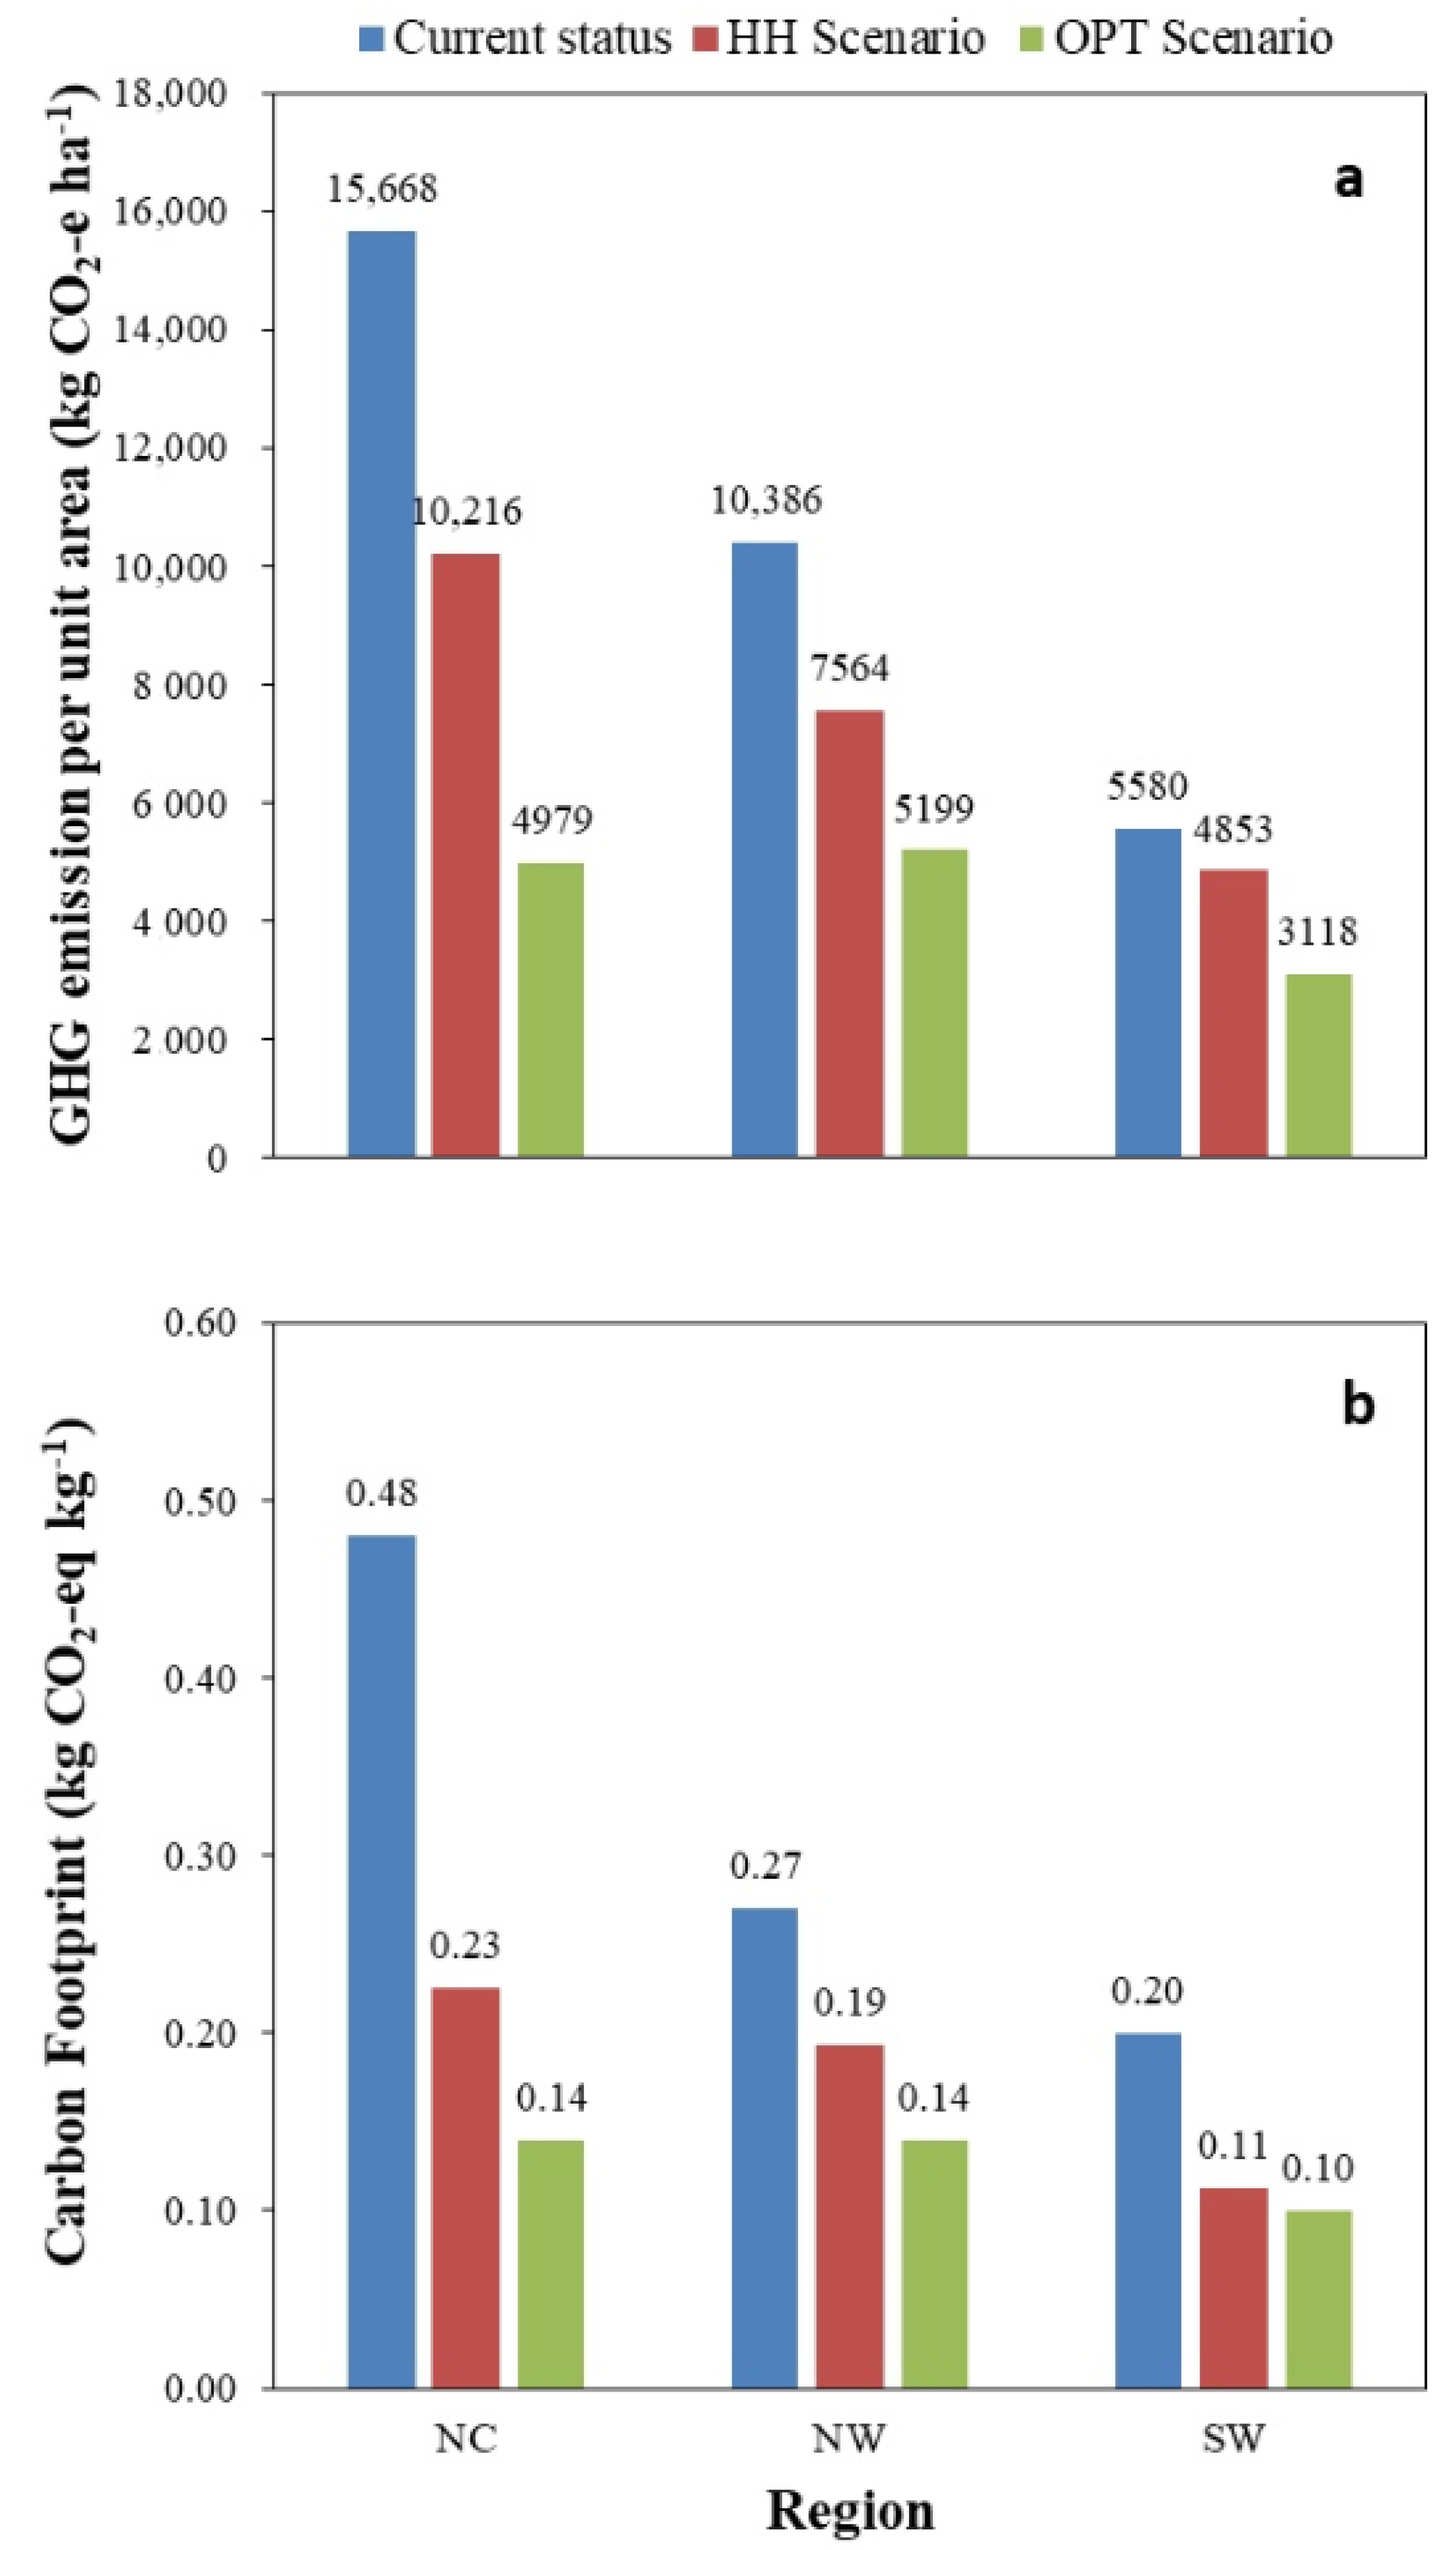
3.3. Potential in Carbon Emission Reduction in Typical Peach Orchards in China

In the three major peach plantation regions, HH (high yield and high PFP-N) peach orchards accounted for 27%, 41%, and 30% of all of the orchards in NC, NW, and SW, respectively (Table 4). Compared with regional values, the averaged GHG emissions of HH orchards in NC, NW, and SW were reduced by 35%, 27%, and 13%, and the mean CF were reduced by 53%, 30%, and 45%, respectively. The differences in the carbon emission intensity of fertilizers between a HH orchard and other orchards resulted in a substantial reduction of GHG emissions in the HH orchard, especially chemical N fertilizers, which had significant influence on the GHG emissions (Table 4). Combined with the total plantation areas of peach orchards in these three regions (Table 1), the total potential emission reduction was largest in NC (1936 × 103 t CO2-eq), higher in NW (184 × 103 t CO2-eq), and lowest in SW (102 × 103 t CO2-eq). If the total yields of these three regions remained unchanged, the total potential reduced emissions were also greatest in NC (1960 × 103 t CO2-eq), which was 19.3 times and 17.3 times that of those in NW (102 × 103 t CO2-eq) and SW (113 × 103 t CO2-eq), respectively (Figure 5).

4. Discussion

In this study, both the total GHG emissions and the differences in the structure of GHG emissions were larger among the regions (Figure 2). Fertilizer inputs were the main reason for the difference in GHG emissions (Table 3). For example, NC had a higher amount of fertilizer input, especially N fertilizer, which was 1.7 times and 2.5 times greater than that in NW and SW, respectively. The differences in producing CF were derived from the fertilizer inputs, planted variety, and yields [19]. Farmers usually apply fertilizers based on the growth stage of crop variety, which directly determines its achievable yield [21]. There is a large variation in climate and soil conditions in China (Table 1); thus, the dominant varieties of peach plantation in the three regions are also different. Therefore, the amount, times of fertilization, and yield are also different. For example, more than 80% of the peach orchards in NC are mainly middle and late ripened varieties, and ~3–4 times of fertilization are applied annually [3]. Inversely, the early ripened varieties are generally grown in SW, with ~2–3 times the amount of fertilizations annually [3]. This would be one reason that farmers in NC use a higher amount of fertilizer input. On the other hand, the peach industry in NC is at the forefront of the country, so the farmers are driven by economic incentives and invest fertilizers heavily to ensure high yield [3,21]. In SW, most of the peach orchards are located in sloping lands with small scales, where it is not convenient for mechanized management and fertilizer application. Thus, there is no diesel consumption for soil ploughing, and the fertilization rate is lowest (Table 3). In addition, the production modes are small farmers coexisting with the large-scale and intensive peach orchards in SW, with large difference in fertilizer use, especially regarding the proportion of organic nutrients (Table 3). Manure and chemical fertilizer also have huge differences in carbon footprint factors (Equation 4), all together leading to a weakened correlation between the total amount of nitrogen fertilizer and carbon footprint in SW (Figure 4). Compared with previous studies, the GHG emissions of peach orchards was higher in NC and NW (this study) than in Shanghai (5900 kg CO2-eq ha−1) [14]. This was mainly due to a larger amount of fertilizer applied in these two regions. For example, the N fertilization was 3.1 times and 1.8 times greater in NC and NW than in Shanghai’s peach orchards, respectively (Table 3). On average, the CFs in these three regions (0.05–1.79 kg CO2-eq kg−1) were similar to the peach orchard in Shanghai (0.37 kg CO2-eq kg−1) [14] and Spain (0.16–0.37 kg CO2-eq kg−1) [30], but were higher than that in China’s pears orchards (0.12–0.27 and 0.06–0.38 kg CO2-eq kg−1 [15,31]) and citrus orchards (0.14 kg CO2-eq kg−1) [14]. These results indicated that GHG emissions in the peach orchards were even higher than those in other types of orchards. The main reason for both the differences in GHG emissions and CFs in the same region was thus derived from the fertilization input and yield output [19]. For instance, N fertilizer inputs in the HH orchard were significantly lower compared to the averaged regional inputs (Table 5). Compared to the averaged regional level, the CF was lower in the HH peach orchard due to lower GHG emissions with a higher peach yield. As a result, a reduced emission of both the regional GHG and CF potential appeared highest in NC, followed by NW and SW, under the current regional total plantation area and yield level (Figure 5).
The future development of fruit industries will be gradually focused on the dominant plantation regions [32]. NC, as the traditional dominant fruit production area with its coordinated light, heat, geography, and transportation conditions, is still the most important peach-producing area in China (Table 1). Moreover, results from this study showed a substantial potential in GHG emission reduction in NC (Figure 5). With the proposal of the Chinese National Energy Conservation and Emission Reduction Strategy and the need of green agriculture development [19,33], it is imperative to optimize the plantation management and then cut down the GHG emissions in the peach orchards of NC. In this study, the averaged N fertilization in NC was 926 kg ha−1, which was close to previous studies [5,34,35], but greater than the rate of 150–200 kg ha−1 that was recommended by extension experts under the target yield of 40 t ha−1 on a medium fertility orchard [29]. Decreasing N fertilizer inputs could significantly reduce the corresponding GHG emissions and CF, since N fertilizer inputs are significantly positively correlated to CF (Figure 4, Table 5). For example, with a 33.5% reduction of N input in a peach orchard, the yield was even increased by 27.5%, suggesting that an external N supply with a synchronized absorption could be an effective way to increase peach yields [36] and reduce CF at the same time [33]. In this study, the average yield of 214 peach orchards in NC was only 35.7 t ha−1; however, the reported attainable yield in the same region was from 48 t ha−1 to 55 t ha−1 [36,37]. Thus, the peach orchards in NC could have considerable potential to increasing their productivity. Moreover, the application of highly efficient and environmentally friendly fertilizer types could also have an impact on GHG emissions reduction. Studies have shown that the application of urea, rather than ammonium nitrate calcium, increased soil N2O emissions in both peach and apple orchards [38]. This was also true for GHG emission decrease when controlled-release fertilizer was applied [39]. Thus, an optimal management such as the control of both amount and type of N-fertilizer could obtain high yields with less environmental costs concurrently in peach orchards or other cropping systems in China [19]. As a projection in the future, GHGs emission in NC could be further decreased from 15,668 kg CO2-eq ha−1 (current farmers’ status) to 10,216 kg CO2-eq ha−1 (farmer based HH orchards), and to 4979 kg CO2-eq ha−1 (optimal nutrient management by extension expert in China); similar trends are also shown for the CFs (Figure 6).
Under the scenario with an optimal nutrient management (Figure 6), the contribution of fertilizer, pesticide, electricity, and diesel to the CF is 56%, 14%, 28%, and 1.0% for NC, 53%, 5%, 39%, and 1% in NW, and 90%, 6%, 3%, and 0% in SW (data not shown), respectively. It is clearly shown that electricity is another noticeable contributor in the humid regions, and especially in the arid NW (Figure 3), and its contribution to GHG emissions becomes of importance when the farmers’ fertilization practice is becoming rationale [19]. In these regions, electricity consumption was mainly for irrigation by electricity-driven pumps, which had generated a great deal of CO2 emissions [40]. As a solution, it is of great significance to renovate irrigation systems and improve water and fertilizer use efficiency in the peach orchard, since the CF could be thus decreased by water-saving irrigation [40].

5. Conclusions

In these three typical peach plantation regions (NC, NW, and SW) in China, the emissions of GHG and corresponding CF were highest in NC, followed by NW and SW. On average, the GHG emissions or CFs were 1.5 times or 1.8 times and 2.8 times or 2.5 times greater in NC than in NW and SW, respectively. The CFs significantly and positively correlated to N inputs, and the contribution of N fertilizer as the first contributor in NC, NW, and SW was 66%, 68%, and 70% of the emissions of GHG, respectively. In addition, the electricity consumption for irrigation was the second contributor to the emissions of GHG, especially in NW, while the pesticide and diesel contributed the lowest (<5%) to the GHG emissions in these three peach plantation regions. The GHG emissions or CFs were decreased by 13–35% or 30–53% in the HH peach orchard when compared with the regional averaged levels. As a projection of the future scenario, GHG emissions could be further decreased by integrative nutrient and irrigation management, including the rational selection of fertilizer rates and types with water-saving irrigation system or practices (e.g., mulching), while increasing fertilizer and water use efficiency and maintaining a sustainable peach production.

Author Contributions

C.G. and Y.Z. designed the survey questionnaire with the assistance by Y.L. and J.W.; C.G. analyzed the survey data and wrote the manuscript with Y.Z. and X.H.; X.W. was the first author’s advisor, and was responsible for providing methodology of Life Cycle Assessment; W.Z. provided the emission factors and calculation formula template; X.H., X.S. and X.C. assisted in outlining and amending the manuscript.

Funding

This research was funded by the National Key Research and Development Project of China (2016YFD0800304), the National Key Technology Research and Development Program (2015BAD06B04), the Fundamental Research Funds for the Central Universities (2362015xk06, XDJK2013C065 and 20710922).

Conflicts of Interest

The authors declare no conflicts of interest.

References

  1. Ministry of Agriculture of the People’s Republic of China. China Agriculture Statistical Report 2016; China Agricultural Press: Beijing, China, 2017; pp. 65–68.
  2. Hou, M.Y.; Zhang, L.; Wang, Z.W.; Yang, D.L.; Wang, L.L.; Xiu, W.M.; Zhao, J.N. Estimation of fertilizer usage from main crops in China. J. Agric. Res. Environ. 2017, 34, 360–367. [Google Scholar]
  3. Yan, Z.J. Construction and Application of Nutrient Management System for Peach Orchard at Different Regional Levels (NMSP). Master’s Thesis, Chinese Agricultural University, Beijing, China, 2010. [Google Scholar]
  4. Bhattachayya, R.; Ghosh, B.N.; Mishra, P.K.; Mandal, B.; Rao, C.S.; Sarkar, D.; Das, K.; Anil, K.S.; Lalitha, M.; Hati, K.M.; et al. Soil degradation in India: Challenges and potential solutions. Sustainability 2015, 7, 3528–3570. [Google Scholar] [CrossRef]
  5. Lu, S.C.; Yan, Z.J.; Chen, Q.; Zhang, F.S. Evaluation of conventional nitrogen and phosphorus fertilization and potential environmental risk in intensive orchard of North China. J. Plant. Nutr. 2012, 10, 1509–1525. [Google Scholar] [CrossRef]
  6. Xu, S.W.; Li, G.Q.; Li, Z.M. China agricultural outlook for 2015–2024 based on China Agricultural Monitoring and Early-warning System (CAMES). J. Integr. Agric. 2015, 14, 1889–1902. [Google Scholar] [CrossRef]
  7. Popp, J.; Lakner, Z.; Harangi-Rákos, M.; Fári, M. The effect of bioenergy expansion: Food, energy and environment. Renew. Sustain. Energy Rev. 2014, 32, 559–578. [Google Scholar] [CrossRef]
  8. IPCC. Climate Change 2014: Mitigation of Climate Change; Contribution of Working Group III to the Fifth Assessment Report of the Intergovernmental Panel on Climate Change; IPCC: Geneva, Switzerland, 2014. [Google Scholar]
  9. Johnson, J.M.; Franzluebbers, A.J.; Weyers, S.L.; Reicosky, D.C. Agricultural opportunities to mitigate greenhouse gas emissions. Environ. Pollut. 2007, 150, 107–124. [Google Scholar] [CrossRef] [PubMed]
  10. Pérez-Neira, D.; Grollmus-Venegas, A. Life-cycle energy assessment and carbon footprint of peri-urban horticulture. A comparative case study of local food systems in Spain. Landsc. Urban Plan. 2018, 172, 60–68. [Google Scholar] [CrossRef]
  11. Strutt, J.; Wilson, S.; Shorney-Darby, H.; Shaw, A.; Byers, A. Assessing the carbon footprint of water production. J. Am. Water. Works Assoc. 2008, 100, 80–99. [Google Scholar] [CrossRef]
  12. Wang, Z.B.; Wang, M.; Chen, F. Carbon footprint analysis of crop production in North China Plain. Sci. Agric. Sin. 2015, 48, 83–92. [Google Scholar]
  13. Zhang, W.S.; He, X.M.; Zhang, Z.D.; Gong, S.; Zhang, Q.; Zhang, W.; Liu, D.Y.; Zou, C.Q.; Chen, X.P. Carbon footprint assessment for irrigated and rainfed maize (Zea mays L.) production on the Loess Plateau of China. Biosyst. Eng. 2018, 167, 75–86. [Google Scholar] [CrossRef]
  14. Yan, M.; Cheng, K.; Yue, Q.; Yan, Y.; Ress, R.M.; Pan, G.X. Farm and product carbon footprints of China’s fruit production—Life cycle inventory of representative orchards of five major fruits. Environ. Sci. Pollut. Res. 2015, 23, 4681–4691. [Google Scholar] [CrossRef] [PubMed]
  15. Liu, Y.; Langer, V.; Høgh-Jensen, H.; Egelyng, H. Life Cycle Assessment of fossil energy use and greenhouse gas emissions in Chinese pear production. J. Clean. Prod. 2010, 18, 1423–1430. [Google Scholar] [CrossRef]
  16. Soode-Schimonsky, E.; Richter, K.; Weber-Blaschke, G. Product environmental footprint of strawberries: Case studies in Estonia and Germany. J. Environ. Manag. 2017, 203, 564–577. [Google Scholar] [CrossRef] [PubMed]
  17. Stoessel, F.; Juraske, R.; Pfister, S.; Hellweg, S. Life cycle inventory and carbon and water footprint of fruits and vegetables: Application to a Swiss retailer. Environ. Sci. Technol. 2012, 46, 3253–3262. [Google Scholar] [CrossRef] [PubMed]
  18. Goossens, Y.; Geeraerd, A.; Keulemans, W.; Annaert, B.; Mathijs, E.; De Tavernier, J. Life cycle assessment (LCA) for apple orchard production systems including low and high productive years in conventional, integrated and organic farms. Agric. Syst. 2017, 153, 81–93. [Google Scholar] [CrossRef]
  19. Chen, X.P.; Cui, Z.L.; Fan, M.S.; Vitousek, P.; Zhao, M.; Ma, W.Q.; Wang, Z.L.; Zhang, W.J.; Yan, X.Y.; Yang, J.C.; et al. Producing more grain with lower environmental costs. Nature 2014, 514, 486–489. [Google Scholar] [CrossRef] [PubMed]
  20. Food and Agriculture Organization of the United Nations. FAOSTAT Database; Food and Agriculture Organization of the United Nations: Rome, Italy, 2016. [Google Scholar]
  21. Li, S.H. Peach; China Agriculture Press: Beijing, China, 2013. [Google Scholar]
  22. Wu, L.; Chen, X.; Cui, Z.; Zhang, W.F.; Zhang, F.S. Establishing a Regional Nitrogen Management Approach to Mitigate Greenhouse Gas Emission Intensity from Intensive Smallholder Maize Production. PLoS ONE 2014, 9, 98481. [Google Scholar] [CrossRef] [PubMed]
  23. IPCC. 2006 IPCC Guidelines for National Greenhouse Gas Inventories; Eggleston, H.S., Buendia, L., Miwa, K., Ngara, T., Tanabe, K., Eds.; National Greenhouse Gas Inventories Programme IGES: Tokyo, Japan, 2006; p. 664. [Google Scholar]
  24. Zhang, W.F.; Dou, Z.X.; He, P.; Ju, X.T.; Powlson, D.; Chadwick, D.; Norse, D.; Lu, Y.L.; Zhang, Y.; Wu, L.; et al. New technologies reduce greenhouse gas emissions from nitrogenous fertilizer in China. Proc. Natl. Acad. Sci. USA 2013, 110, 8375–8380. [Google Scholar] [CrossRef] [PubMed] [Green Version]
  25. Yuan, B.R.; Nie, Z.R.; Di, X.H.; Zuo, T.Y. Life cycle inventories of fossil 538 fuels in China (II): Final life cycle inventories. Mod. Chem. Ind. 2006, 26, 59–61. [Google Scholar]
  26. Brentrup, F.; Pallière, C. GHG Emission and Energy Efficiency in European Nitrogen Fertilizer Production and Use; IFA Proceedings No. 639; International Fertiliser Society: Colchester, UK, 2008. [Google Scholar]
  27. Williams, A.G.; Audsley, E.; Sandars, D.L. Determining the Environmental Burdens and Resource Use in the Production of Agricultural and Horticultural Commodities; Department for Environment, Food and Rural Affairs: London, UK, 2006. [Google Scholar]
  28. Ierna, A.; Pandino, G.; Lombardo, S.; Mauromicale, G. Tuber yield, water and fertilizer productivity in early potato as affected by a combination of irrigation and fertilization. Agric. Water Manag. 2011, 101, 35–41. [Google Scholar] [CrossRef]
  29. Zhang, F.S.; Chen, X.P.; Chen, Q. Guidelines for Major Crop Fertilization in China; China Agriculture Press: Beijing, China, 2009; pp. 88–91. [Google Scholar]
  30. Vinyes, E.; Gasol, M.C.; Asin, L.; Alegre, S.; Muñoz, P. Life Cycle Assessment of multiyear peach production. J. Clean. Prod. 2015, 104, 68–79. [Google Scholar] [CrossRef] [Green Version]
  31. Yang, Z.L.; Fu, J.L.; Gao, T.Y.; Chai, D.D.; Wu, Y.J.; Li, Z.X.; Wang, L.F. Research on carbon footprint for management activity of urban modern agriculture in Beijing: A case study of Pyrus ussuriensis Maxin. cv. Jingbaili orchards in Mentougou District. Chin. Agric. Sci. Bull. 2016, 32, 128–134. [Google Scholar]
  32. Yang, Z.F.; Cong, P.H.; Nie, J.Y.; Wang, X.D.; Li, H.F. Current situation, future development direction and suggestions of fruit industry in China. In Proceedings of the Seventh Youth Symposium of the Chinese Horticultural Society, Chengdu, China, 26–28 September 2006; pp. 701–704. [Google Scholar]
  33. Cheng, K.; Pan, G.X.; Smith, P.; Luo, T.; Li, L.Q.; Zhang, J.W.; Zhang, X.H.; Han, X.J.; Yan, M. Carbon footprint of China’s crop production-an estimation using agro statistics data over 1993–2007. Agric. Ecosyst. Environ. 2011, 142, 231–237. [Google Scholar] [CrossRef]
  34. Yuan, Y.B. Research of Nutrient Management in Peach Orchard in Pinggu Country Beijing City. Master’s Thesis, Huazhong Agricultural University, Wuhan, China, 2007. [Google Scholar]
  35. Kou, C.L.; Ju, X.T.; Zhang, F.S. Nitrogen balance and its effects on nitrate-N concentration of groundwater in three intensive cropping systems of North China. Chin. J. Appl. Ecol. 2005, 16, 660–667. [Google Scholar]
  36. Yan, Z.J.; Duan, Z.Q.; Lu, S.C.; Chen, Q. Construction and application of regional fertilization decision-making system based on Google Map and Web GIS for peach orchard. Trans. Chin. Soc. Agric. Eng. 2010, 26, 207–212. [Google Scholar]
  37. Li, F.G.; Meng, Y.H.; Jia, X.H.; Chen, Q.; Xu, X.F.; Han, Z.H. Effects of nitrogen applied rate on fruit yield, quality and leaf nutrient content of ‘Bayuecui’ peach. Plant Nutr. Fertil. Sci. 2006, 12, 918–921. [Google Scholar]
  38. Vinyes, E.; Asin, L.; Alegre, S.; Muñoz, P.; Boschmonart, J.; Gasol, C.M. Life Cycle Assessment of apple and peach production, distribution and consumption in Mediterranean fruit sector. J. Clean. Prod. 2017, 149, 313–320. [Google Scholar] [CrossRef]
  39. Zhang, S.S.; Peng, F.T.; Jiang, Y.M.; Li, D.D.; Zhu, C.F.; Peng, J. Effects of bag controlled-release fertilizer on nitrogen utilization rate, growth and fruiting of peach. Plant Nutr. Fertil. Sci. 2008, 14, 379–386. [Google Scholar]
  40. Xie, X.; Cai, W.J.; Jiang, Y.K.; Zeng, W.H. Carbon footprints and embodied carbon flows analysis for China’s eight regions: A new perspective for mitigation solutions. Sustainability 2015, 7, 10098–10114. [Google Scholar] [CrossRef]
Figure 1. A system boundary of peach production in China.
Sustainability 10 02908 g001
Figure 2. Greenhouse gas emissions (a) and carbon footprint (b) of three major peach plantation regions in China based on farmer survey questionnaires conducted in 2016 and 2017. The surveying numbers for the North China Plain (NC), northwest China (NW), and southwest China (SW) were 214, 22, and 33, respectively. The bar on each column indicated the standard deviation of the datasets. The triangle in each figure indicated the median of these datasets, where the red line showed significant difference between the two independent datasets at p < 0.05, and where the black lines showed no significant differences by the Kruskal–Wallis one-way ANOVA.
Sustainability 10 02908 g002
Figure 3. Contribution of individual input to the carbon footprint in three major peach plantation regions in China based on farmer survey questionnaires in 2016 and 2017. The surveying numbers for the North China Plain (NC), northwest China (NW), and southwest China (SW) were 214, 22, and 33, respectively.
Sustainability 10 02908 g003
Figure 4. Correlations between total nitrogen (N) application (including chemical fertilizers and manure) and carbon footprint in three major peach plantation regions in China. Data in the figure were all derived from the calculation and analysis of farmer questionnaires in 2016 and 2017. The surveying numbers for the North China Plain (NC), northwest China (NW), and southwest China (SW) were 214, 22, and 33, respectively.
Sustainability 10 02908 g004
Figure 5. Potential emission reductions in the studied three major peach plantation regions in China under the condition of unchanged plantation areas or yields. Data in the figure were all derived from the grouping, calculation, and analysis of farmer survey questionnaires in the North China Plain (NC), northwest China (NW), and southwest China (SW).
Sustainability 10 02908 g005
Figure 6. Scenarios analyses of greenhouse gas emissions (a) and carbon footprint (b) in the studied three major peach production regions in China. Data under current status and high yield and high PFP-N scenarios (HH scenario) are all derived from the calculation, grouping, and analysis of the farmer survey questionnaires in the North China Plain (NC), northwest China (NW), and southwest China (SW) in 2016 and 2017, which are also shown in Table 4. The scenario with optimal nutrient management (OPT scenario) is projected basing on the current input level of pesticide, electricity, and diesel (Table 1), but with the recommended upper rates of N (200 kg N ha−1), P (100 kg P2O5 ha−1), and K (300 kg K2O ha−1) fertilizer in China [29].
Sustainability 10 02908 g006
Table 1. The major soil type, climate characteristics, planting area and total yield in the studied three major peach plantation regions in China.
RegionMajor Soil Type 1Soil Texture 2MAS (h) 3MAT (°С) 4MAP (mm) 5Planting Area (103 ha−1) 6Yield (103 t) 7
201320142015201320142015
North China Plain (NC)Hapli-Udic Argosols Hapli-Ustic ArgosolsLoam1800–23008.0–13400–1000331332355550371427935
Northwest (NW)Loessi-Orthic PrimosolsSandy2400–28001.0–16200–40056.260.265.3110511571256
Southwest (SW)Typic Purpli-Udic CambosolsClay1000–14004.0–18800–1800118.212714198710771244
China ----76680085211,92412,87414,288
1,2,3,4,5 These data were derived from the book entitled “Peach” [21]. 3,4,5 MAS, MAT, and MAP represent mean annual sunshine, mean annual temperature, and mean annual precipitation, respectively.6,7 These data were derived from China Agriculture Statistical Report 2016 [1].
Table 2. Main index of greenhouse gas (GHG) emissions under different inputs. N: nitrogen (N), P: phosphorus (P2O5), K: potassium (K2O).
ItemEmission FactorUnitReferences
N Production and Transportation8.30kg CO2-eq kg−1[24,25]
P Production and Transportation0.79kg CO2-eq kg−1[24,25]
K Production and Transportation0.55kg CO2-eq kg−1[24,25]
Pesticides19.1kg CO2-eq kg−1[26]
Diesel3.75kg CO2-eq L−1[26]
Electricity1.14kg CO2-eq kWh−1[27]
Table 3. Input and output of the studied three major peach plantation regions in China based on farmer survey questionnaires in 2016 and 2017. The surveying numbers for the North China Plain (NC), northwest China (NW), and southwest China (SW) were 214, 22, and 33, respectively.
ItemSurveyed Regions of Major Peach Plantation in China
NCNWSW
Input
Total Fertilizer (kg ha−1)
N926 ± 625 (766a) 1559 ± 246 (476b)373 ± 156 (359b)
P2O5499 ± 297 (398a)355 ± 208 (412ab)215 ± 109 (189b)
K2O731 ± 449 (629a)712 ± 497 (492a)270 ± 91.8 (280b)
Manure (kg ha−1)
N132 ± 182 (37.4a)51.8 ± 151 (12.3a)73.5 ± 66.5 (69.3a)
P2O554.6 ± 67 (24.8a)37.0 ± 84.4 (12.0a)38.1 ± 32.9 (39.6a)
K2O92.2 ± 124 (30.0a)44.4 ± 113 (12.8a)55.2 ± 46.4 (59.4a)
Chemical Fertilizer (kg ha−1)
N794 ± 551 (630a)507 ± 229 (432b)300 ± 128 (291b)
P2O5444 ± 392 (336a)319 ± 176 (393ab)178 ± 107 (135b)
K2O640 ± 401 (550a)668 ± 506 (445a)216 ± 95.0 (293b)
Pesticide (kg ha−1)37.2 ± 43.6 (20.0a)13.4 ± 5.50 (11.6b)10.6 ± 11.6 (9.0b)
Electricity (kWh ha−1)1219 ± 976 (990b)1827 ± 527 (1600a)91.8 ± 18.7 (90.0c)
Diesel (L ha−1)19.6 ± 43.9 (15.0a)14.7 ± 3.20 (15.0b)0 2
Output
Yield (t ha−1)35.7 ± 12.7 (37.5a)37.8 ± 3.60 (37.5a)31.4 ± 11.2 (30.0a)
1 Data were represented by mean ± standard deviation with the median in parentheses. Different letters after the medians in each row indicated significant differences among the three regions tested by the method of Kruskal–Wallis one-way ANOVA at p < 0.05. 2 There was no diesel consumption in SW China according to the farmer survey.
Table 4. Comparison of the input source contribution between the high yield and high partial factor productivity of nitrogen (PFP-N) in peach orchards (HH) and the regional mean peach orchard (mean). The data in the table are all derived from the calculation, grouping, and analysis of farmer survey questionnaires in the North China Plain (NC), northwest China (NW), and southwest China (SW) in 2016 and 2017.
ItemGHG Emissions (kg CO2-eq ha−1)Carbon Footprint (kg CO2-eq kg−1)
NCNWSWNCNWSW
HH (27%) 1MeanHH (41%)MeanHH (30%)MeanHHMeanHHMeanHHMean
N Fertilizer6319b 210,303a4537b6585a3293a3893a0.138b0.309a0.116b0.176a0.075b0.139a
P Fertilizer219b348a171a261a149a178a0.005b0.011a0.004a0.007a0.003b0.007a
K Fertilizer32.6a39.0a34.5a52.2a51.3a52.2a0.0007b0.001a0.0009a0.001a0.001b0.002a
Manure1860a2806a461a1097a947a1150a0.041a0.088a0.012a0.030a0.024a0.050a
Pesticide550a711a292a255a306a202a0.013a0.025a0.008a0.010a0.007a0.007a
Electricity1164a1388a2010a2079a106a105a0.026b0.045a0.0510.060a0.002a0.004a
Diesel71.2a73.6a58.5a55.3a--0.002a0.002a0.001b0.002a--
Total10,216b15,668a7564b10,386a4853a5580a0.225b0.480a0.193b0.270a0.113b0.200a
Potential emission reduced545228227270.2550.0770.087
1 Values in parenthesis indicated the percentage of HH orchards in the total orchards. 2 Different letters within each region indicated significant differences (p < 0.05) in GHG emissions or carbon footprints (CF) between the regional mean input orchard and the HH orchard.
Table 5. Comparison of the total fertilizer (chemical and manure fertilizer) inputs and yield outputs between the high yield and high PFP-N (HH) peach orchard and the regional mean level peach orchard (mean). Data in the table are all derived from the calculation, grouping, and analysis of the farmer survey questionnaires in the North China Plain (NC), northwest China (NW), and southwest China (SW) in 2016 and 2017.
ItemNCNWSW
HHMeanHHMeanHHMean
Chemical Fertilizer: N (kg ha−1)481b 1794a350b508a254a300a
Chemical Fertilizer: P2O5 (kg ha−1)279b444a204a319a141a178a
Chemical Fertilizer: K2O (kg ha−1)524b640a366a668a201a216a
Manure: N (kg ha−1)73b132a26a52a52a74a
Manure: P2O5 (kg ha−1)36a55a25a37a27 a38a
Manure: K2O (kg ha−1)53b92a27a44a39a55a
Yield (t ha−1)46a36b39a38a44a32b
1 Different letters within each region indicate significant difference (p < 0.05) in compared items between the regional mean input orchard and the HH orchard.

