Development of a Program Definition Rating Index for the Performance Prediction of Construction Programs


1
Department of Architectural Engineering, University of Seoul, Seoul 02504, Korea
2
Research and Development Center, PMPgM Co., Ltd., Seoul 02504, Korea
*
Author to whom correspondence should be addressed.
Sustainability 2018, 10(8), 2747; https://doi.org/10.3390/su10082747
Submission received: 9 July 2018
/
Revised: 27 July 2018
/
Accepted: 27 July 2018
/
Published: 3 August 2018
Abstract
:Program management is the structured and strategic process of managing multiple projects at a high level to maximize benefits. The essentials of programs include high costs and long implementation periods, and thus, the negative impacts caused by the failure of program management are more significant and greater than that of a project. Therefore, to achieve high program performance, it is essential for program management to be well defined during the early stages. However, the existing research is mainly focused on the performance prediction methodologies for projects, while the research pertaining to programs has concentrated on identifying the qualitative critical success factors (CSFs). Thus, this study developed a methodology for predicting the program performance. Forty-five CSFs were identified herein from literature review and expert interviews, then grouped through factor analysis. In addition, the Program Definition Rating Index (PgDRI) was developed by calculating the weights of the proposed CSFs through structured equation modeling in order to evaluate the quantitative program performance. For validation, the PgDRI was applied to three in-progress cases, and the PgDRI scores were compared with the actual performance of each case. The PgDRI developed in this study can contribute to the body of knowledge pertaining to program management by quantifying the performance management of a program. In addition, the PgDRI can be utilized in the performance management of a program in terms of the cost and schedule by allowing practitioners to apply the PgDRI repeatedly to the major decision-making processes during the early stages of a program.
1. Introduction
A program can be defined as a group of related projects under integrated management. Moreover, program management is the structured and strategic process of performing multiple projects to achieve the strategic benefits of the overall program [1,2,3,4]. Compared to a project, a program has the characteristics of larger size, higher complexity, longer duration, and greater costs. Additionally, the negative impact caused by the failure of a program is greater than that of a project. In practice, construction programs that have been performed in both the public and private sectors have incurred significant increases in cost overrun and schedule delays when compared to the original plan [5,6,7]. Therefore, program management has become a necessary new method for achieving program success.
Meanwhile, successful projects require plans that are established in the early stages. According to the Project Management Institute (PMI, 2013), project plans that are well defined during the early stages can achieve greater effects when compared with the input costs. In this regard, many studies have been conducted pertaining to project planning in the early stages with the use of critical success factors (CSFs) from the perspective of project management [8,9,10,11,12,13,14,15]. The project definition rating index (PDRI), which was developed by Construction Industry Institute (CII), was applied to project performance management by assigning weights to the CSFs that were derived from the project viewpoint. The research results of CII demonstrated a causal relationship between the definition of a project during its early stages and the overall success of the project.
However, as previously mentioned, a program is more complex and larger in scale than a project. Therefore, the definition of a program during the early stages is more important than the early definition of a project, and the effects of successful management are greater in a program. In response, several studies have attempted to identify the CSFs from the perspective of a program [16,17,18,19,20,21,22,23,24]. Despite the significant achievements of such previous studies, there are limitations to the applications of the CSFs in the performance management of a program because the identified CSFs are qualitative. Even though CSFs are expressed as a qualitative statement, they have to be measurable to support decision making [25].
Therefore, this study aims to develop a methodology that defines a construction program and predicts the performance of the program based on quantitative evaluations. This study sought to identify the CSFs for programs based on analyses of previous studies and expert interviews, and to group CSFs through factor analysis. In addition, this study developed the Program Definition Rating Index (PgDRI) by weighting the proposed CSFs using structure equation modeling.
2. Literature Review
2.1. Program Management
Generally, the existing practical and theoretical research on project management has been performed with respect to a single project [26,27]. However, despite an increase in the number of highly complex, large-scale programs, the existing single project framework has been applied to cases of programs. This can lead to technical problems, such as cost overruns, schedule delays, claims, organization conflicts [5], and other general problems, which are caused by the lack of ability to effectively and efficiently control and manage a large organization [24]. Additionally, the management of individual projects may lead to the lack of benefits compared to managing the projects together as an overall program [27]. For these reasons, the concept of program management has emerged, which provides a means of achieving the benefits that were otherwise not attainable and resolves the problems that arise when a program is managed as individual projects [24,27,28].
Programs have been referred to under several different names, such as multi projects, portfolio projects, macro projects, large projects, and complex changes [27]. However, confusion exists in the industry due to the unclear definitions of the program and program management [23]. Therefore, several efforts have been made to define program management [24,26,27,29], distinguish it from project management, and disseminate it to the industry from practical and theoretical aspects [1,2,3,7,19,21,23,24,25,28,29,30,31,32,33,34,35,36].
Program management is designed to generate coordination and control at a program level in order to gain strategic benefits and to efficiently manage multiple projects with a purpose [1,2,3,24,25,27,33]. Program management includes not only an aggregation of the project management activities, but also a high level of guidance and assistance to manage various factors, such as risks and opportunities, that can occur during the execution of several projects [25,33].
Project management and program management have some similar characteristics, but they also have several differences. Projects and programs require the integrated management of budgets, estimates, schedules, procurement, supervision, and design and construction processes [30]. However, the concept of a program is greater in terms of the business scale, complexity, scope, management range, decision-making processes, and simultaneous progression of activities; additionally, the level of recognition for a program differs from that of a project [30]. Therefore, compared to project management, program management is a more advanced concept [24] that includes the overall project promotion and comprehensive management of multiple projects [2].
2.2. Performance Prediction with the CSFs
The success of a project is very closely related to accurate performance predictions [37]. Thus, many researchers have conducted research regarding performance prediction. Rubin and Seelig investigated the success and failure factors required to successfully accomplish a project [15], and Rockart first used CSFs from a project management perspective [10]. Since then, CSFs have been utilized as a means of predicting performance in various fields, such as information systems, industrial systems, process engineering, and business development [17].
In addition, many efforts have been undertaken to predict the performance of a project using CSFs in the construction industry. To achieve success for construction projects, Sanvido et al. identified 41 CSFs, classified them into nine categories, and applied them to 16 projects for validation [9]. Pheng and Chuan analyzed the success of a project according to environmental factors and the project manager’s work performance [37]. Shi et al. identified 29 CSFs for Public Private Partnership infrastructure projects. Then, they conducted a structure equation modeling (SEM) analysis through questionnaire surveys, classified the CSFs into five categories, and defined the relationships among the CSFs [38]. Hwang et al. identified a total of 30 CSFs through a literature review, and proposed a prioritization order after conducting interviews with 40 experts for the Singapore Green Business Parks project [8]. The PDRI that was developed by CII is one of the most demonstrative study achievements using CSFs [12,13,14,39]. While previous studies were limited to the assignment of priorities among the CSFs, the PDRI provides weights for each CSF and checks the levels of the definitions to predict the performance with a weighted score that ranges from 0 to 1000 points [12,13,14,39]. A lower point total indicates better project performance. The PDRI recommends that the performance score be less than 200 points [12,13,14,39].
Research has also been conducted regarding the use of CSFs for predicting the performance of programs in the construction sector. Toor and Ogunlana investigated the CSFs for large-scale construction projects. Through previous studies, 29 CSFs were generated, and based on the results of a survey, the CSF rankings were suggested [17]. Yu and Kwon analyzed the CSFs of South Korea urban regeneration projects. The Delphi technique was used to identify 10 factors. Then, the project was divided into four stages, and a t-test was applied to propose the priority items for each stage [18]. Ejaz et al. identified 26 CSFs that can be applied to a Pakistan mega construction project and derived the priority of the CSFs through the use of a frequency analysis [11].
Although these studies have greatly contributed to the performance prediction of construction programs, a lack of consideration remains regarding the quantitative assessment of the CSFs. The PDRI that was developed by CII proposed a performance prediction method that quantitatively evaluates CSFs; however, because the PDRI targets a project, the application of the PDRI to a program poses limitations. Therefore, it is necessary to develop an index that can identify the CSFs for construction programs and quantitatively and accurately evaluate them.
3. Research Framework
This study assumed that the performance of a program can be predicted by the scores from measurable CSFs. This chapter describes the framework of the PgDRI for the performance prediction of a construction program, as shown in Figure 1. The development of the PgDRI was divided into two stages. The first stage involved identifying and grouping CSFs for the construction programs. To identify CSFs, previous studies in terms of construction programs were analyzed, and the CSFs were modified and supplemented through expert interviews. To group the derived CSFs, an evaluation based on a five-point Likert scale was conducted through questionnaires. Factor analysis was then applied to group the CSFs. The second stage developed a rating method for the CSFs. As the CSFs developed in the previous stage were qualitative, a quantitative evaluation was performed by assigning weights to each CSF. SEM was the applied weighting method, as it considers the correlations between factors. The developed PgDRI was then applied to three ongoing construction programs for validation.
4. Development of CSFs for the Construction Programs
4.1. Identification of the Program CSFs
The purpose of this study was to enable the definition of a program and the prediction of its performance. In previous studies, the CSFs were developed to predict the performance of a project, and thus, they could have limitations when used to define a larger-scale program. Therefore, there is a need to identify the CSFs for a program.
Studies that used keyword terms with a similar meaning to “program” (i.e., megaprojects, large scale projects, complexity projects, etc.) were analyzed to identify the program CSFs. A total of 43 CSFs were identified after excluding the overlapping items. Next, three experts who have previously participated in construction programs were interviewed to complement the identified CSFs and increase their reliability. One owner and two program managers were selected as the experts. The owner had participated in more than three programs within 25 years, and the two program managers had more than 20 years of experience and program management professional certifications. The expert interviews were conducted individually, where each CSF was explained in detail and then modified and complemented during the process. The existing 43 CSFs were examined. The terms for nine CSFs were revised by reflecting the expert opinions, and two CSFs were added to the list. Table 1 shows the 45 proposed CSFs based on the literature review and expert interviews.
4.2. Grouping the CSFs Using Factor Analysis
The CSFs identified in this study could be applied from the beginning to the end of a program. In addition, the PgDRI developed herein was created to ensure its continuous application during the course of the program, and thus, the PgDRI is capable of predicting the performance of the entire program. Therefore, the CSFs were grouped based on the life cycle of programs. Several studies have defined different program life cycles, which vary across the different studies (see Table 2).
In this study, the life cycle of a program was defined and divided into three sections based on the existing body of research. The first section is to plan the program, which includes the detailed tasks of the philosophical perspective on the program execution and the program plan. The second section is to execute the benefits of the program, and this section includes planning for benefits, program execution, and program monitoring and control. The third section includes the program closure and program satisfaction.
Forty-five CSFs were previously identified, which is a relatively large number of CSFs for consideration. Therefore, to manage them, CSFs were grouped in accordance with their relevance using factor analysis. The factor analysis can find the relationships among mutually related variables, understand these variables easily, and group them into common factors [41,42,43].
There are two different types of factor analysis: exploratory and confirmatory. Exploratory factor analysis is a method used for finding the optimal combinations from unknown variables and is used when the relationships between the variables are not precisely known [42,44]. However, depending on the data, there are some cases in which similar factors are not grouped together [42]. On the other hand, confirmatory factor analysis is a method designed to classify the relationships between variables in advance, based on theoretical knowledge or experience, and to statistically verify the relationship [38,42,45,46]. In this study, CSFs were separated into three sections of program life cycle (see Table 2) with three experts who were introduced in Section 4.1. Thus, confirmatory factor analysis was used to ensure that all similar factors would be grouped together.
To apply the factor analysis, the 45 CSFs were divided into three sections of the program life cycle to generate a questionnaire survey regarding the importance of each CSF, and the survey was then conducted. The subjects of the questionnaire survey included owners, project managers, and program managers who had experience participating in construction programs. The survey was a Google Web-based questionnaire with no time and place restrictions, and there were 38 respondents. The 38 respondents were composed of owners (18.4%), program managers (44.7%), researchers (21.1%), and general contractors (15.8%). In addition, working experience was 44.7% in 1–10 years, 47.4% in 11–20 years, and 7.9% in 20 years more. The evaluation method examined the importance of the CSFs based on a five-point Likert scale; a score of five meant “very important,” and a score of one meant “not important at all.”
Based on the results of the survey, factor analysis was performed using the principle component method. This is the most widely-used method for extracting factors and has superior stability and reusability [42,46]. In addition, due to the large number of variables, difficulties arise when reducing the number of variables to several possible factors. At this point, rotating the factor axis clearly grouped the variables, and thus, varimax rotation, the most commonly used orthogonal method, was selected for the factor rotation [42]. In the factor analysis, the Kaiser-Mayer-Olkin (KMO) test and Bartlett test of sphericity were performed to determine whether significant correlations existed among the variables. The KMO test is a method of determining whether certain variables and sample sizes are appropriate for the factor analysis. If the value is 0.6 or higher, the variable or sample size can be considered acceptable [44]. In this study, the KMO value was 0.766. In addition, the Bartlett test of sphericity determines if the correlation coefficient matrix of the variables used in the factor analysis is a diagonal matrix [42,46]. If the variables are not a diagonal matrix, it means that the variables are unsuitable for the factor analysis [42]. In this study, the results were all significant at the 95% confidence level. The results of the KMO test and Bartlett test of sphericity demonstrated that there were no problems with using the factor analysis that was performed in this study. Table 3 shows a result of factor analysis for Section I. In the same way, factor analysis was conducted for Sections II and III.
Based on the results of the factor analysis, 45 program CSFs were divided and grouped into three sections and eight categories (see Table 4). The three sections included Program Planning, Program Benefits Execution, and Program Turnover and Closure, based on the program life cycle.
5. Development of the PgDRI
5.1. Weighting the Program CSFs Using SEM
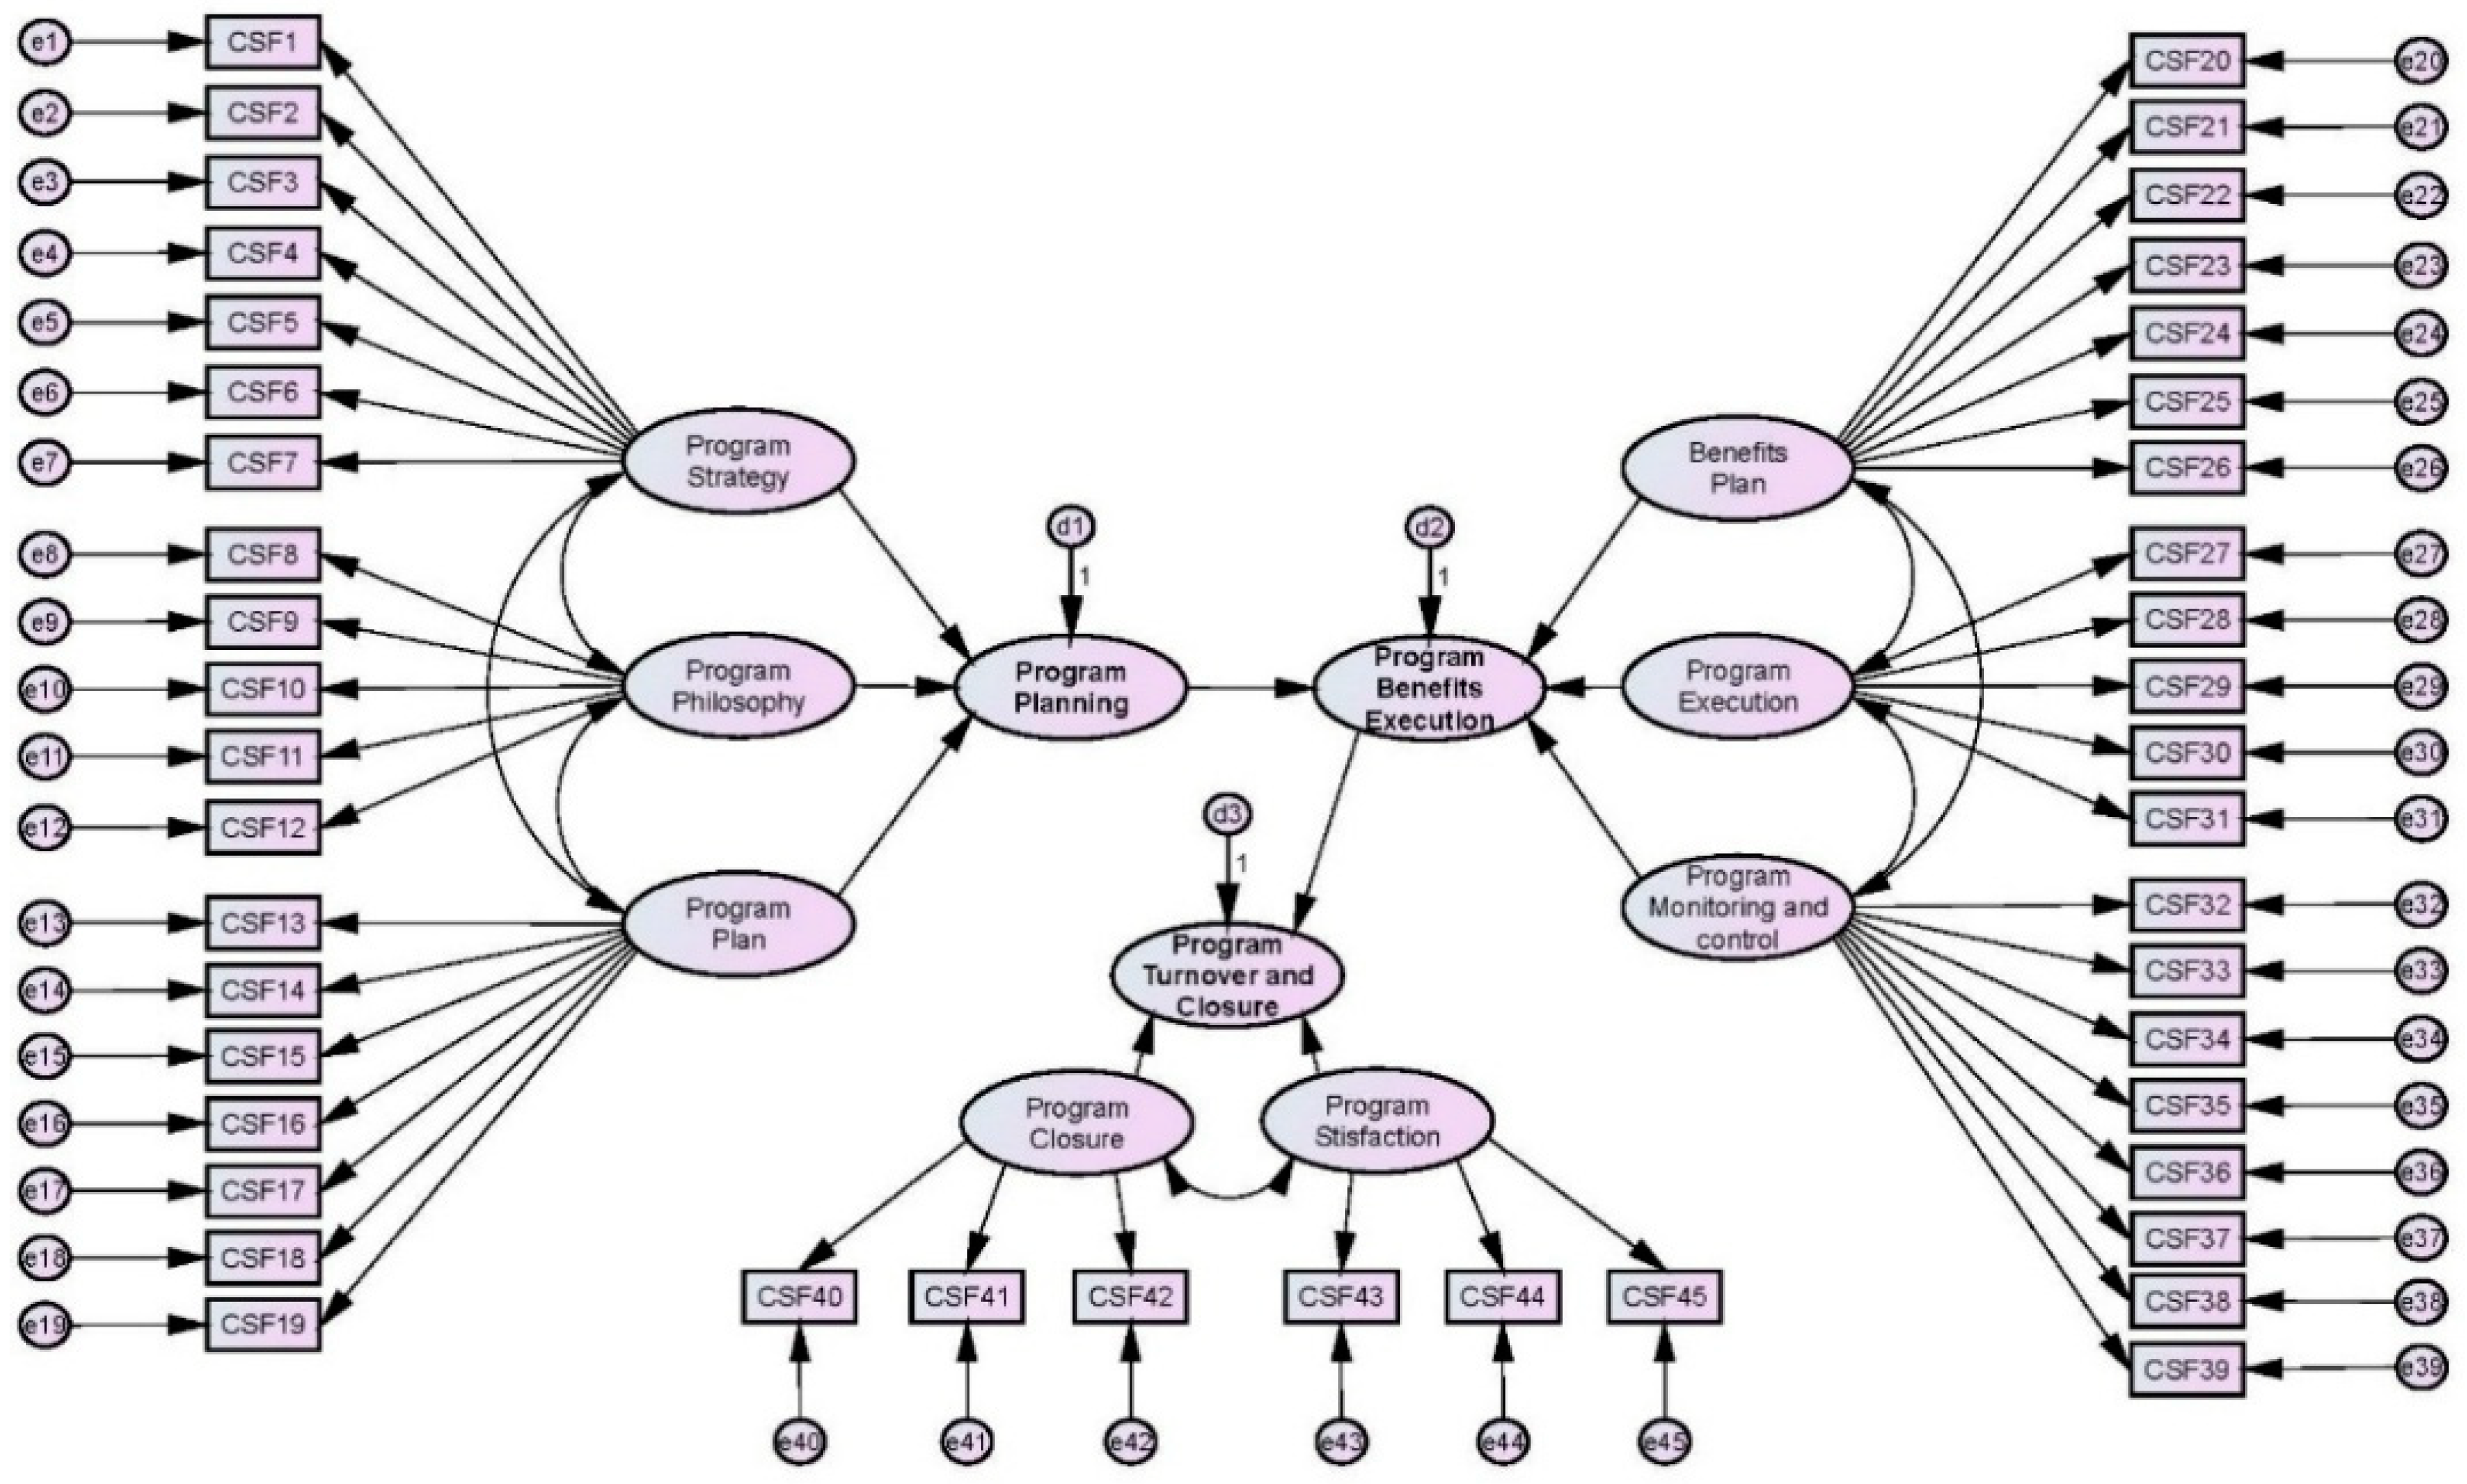
The CSFs that were identified in chapter 4 consist of qualitative factors; however, quantitative measures are required for performance management. Therefore, each CSF was weighted, and a rating method was proposed. The CSFs proposed in this study have interrelationships and causal relations between themselves. Thus, it is necessary to calculate the weights considering these causal relationships. In this regard, this study sought to use SEM for identifying the relationships of each factor and for testing the causal relationships and significance between the variables [42,45]. For example, if the definition of each CSF is poor in each category corresponding to Section I, the definition of CSFs defined in Section II may also produce insufficient results. If this condition continues, insufficient results may also be generated in Section III. Therefore, in this study, SEM was applied to investigate the interrelationships between the factors based on the results of the survey that was previously performed. Figure 2 shows the SEM for program CSFs.
The weights of the section, category, and factor were calculated using the standardized regression weights that were obtained from the SEM and used to compare the relative importance of the independent variables [42]. A total weight of 1000 points was established, and the weights of the section, category, and factor were calculated by applying Equations (1)–(3).
First, the weight of the section was calculated, and the weights for the section were multiplied by 1000, as shown in Equation (1). For example, the standardized section regression of Section I (i.e., Program Planning) is 0.475, and the section weight of 475 points was calculated by multiplying by 1000.
Second, the weight of the category was calculated. Each section weight deduced from Equation (1) was multiplied by the category standardized regression, as shown in Equation (2). For example, a weight of the program strategy was multiplied by the weight of the program planning. This resulted in the weight of 0.54 and was calculated to be 255 points.
Lastly, the weight of the factor was calculated. First, since the category sub-total of factor standardized regression obtained from SEM was not 1.0, factor standardized regression of each CSF was normalized by category. Then each category weight was multiplied by the normalized regression of the factors belonging to the corresponding category, as shown in Equation (3).
Table 5 shows the weights of the section, category, and factor in this study.
5.2. PgDRI
The weights of the section, category, and factor were calculated using the deduced standardized regression weights. The PgDRI developed in this study determines the performance based on evaluation levels 0–5. Level 0 represents the not applicable (N/A) condition; level 1 represents a complete definition; level 2 represents minor deficiencies; level 3 represents some deficiencies; level 4 represents major deficiencies; level 5 represents an incomplete or poor definition.
A rating of 0 was assigned to level 0 and level 1, since level 0 represents the N/A condition and level 1 represents the complete definition. The maximum rating deduced through SEM was assigned to level 5 (see Table 5). For a rating of level 2–4, the linear interpolation method that can easily estimate the interval value is applied by using the level 5 and 1 rating. The ratings for levels 2, 3, and 4 were calculated using the level 5 and level 1 ratings, as shown in Equations (4)–(6).
The PgDRI was determined by calculating the total ratings of each CSF corresponding to levels 1–5. As shown in Table 6, the PgDRI evaluates the level of program definition that is currently implemented by the user (e.g., owner, program manager, project manager, contractor, etc.), and the PgDRI exhibits the ratings of the CSFs, which are summed. In addition to presenting all of the added ratings, the PgDRI identifies the CSFs that have a poor definition in the current program and establishes follow-up measures for the CSFs that lack complete definitions. Therefore, the PgDRI presented in this study produces a lower score with an improved program definition, and thus, a lower PgDRI is desirable. For example, if the definitions of all of the CSFs correspond to level 5 (incomplete or poor definition), the score will be 1000. The evaluation of the PgDRI is expected to increase the likelihood of success for the project performance during the major decision-making phase because the PgDRI could help CSFs with poor definition to be modified and complemented.
6. Validation of the PgDRI
6.1. Case Application
The PgDRI developed in this study was applied to actual in-progress cases for the validation. The test cases included two public programs and one private program. The summary of cases are shown in Table 7.
The owner and program managers of each test case were required to evaluate their respective in-progress program using the PgDRI developed in this study. The PgDRI scores for each of the three test cases were calculated based on the evaluation. As a means of comparison, the cost and schedule growth rates of each program were analyzed using Equations (7) and (8). The cost and schedule information was gathered regarding the initial plan and what is expected to be input throughout the program. The performance of each test case was analyzed using the PgDRI score and the cost and schedule growth rates.
where, Actual Program Cost = Actual input costs at the end of the program; and Initial Predicted Program Cost = Planned costs during the program planning phase.
where, Actual Program Schedule = Actual end date − Actual start date; and Initial Predicted Program Schedule = Planned dates during the program planning phase.
6.2. Findings and Discussion
Table 8 shows the PgDRI scores and the performance of three test cases. Case 1 is a large program that was initiated by the government; military facilities and agencies from various governments are involved in the program. The program consists of 18 projects, the total cost is USD 2.2 billion, and the rate of progress is approximately 80%. For Case 1, much time was spent on establishing the master plan. Owing to the large number of stakeholders involved in the program, the completion of the initial plan was delayed. The PgDRI scores were 440 (Section I, II, and III were 200, 165, and 75, respectively). Additionally, the cost growth rate was approximately 37%, and the schedule growth rate was 20%.
Case 2 is composed of 15 projects, has a total project cost of approximately USD 2.6 billion, and has a progress rate of approximately 70%. The PgDRI scores were 617 (Section I, II, and III were 275, 235, and 108, respectively), which is higher than the scores of Case 1. The cost growth rate was approximately 30%, and the schedule growth rate was 36%.
Case 3 is the mixed-use development program led by the private sector and consists of residential, office, and commercial buildings. The original plan was to invest USD 0.8 billion for five years (2013–2018); however, complex challenges regarding the program feasibility, compensation for migrants, and relevant licenses and permits were encountered. As a result, the final total cost of the project is estimated to be approximately USD 1.3 billion, and the current progress rate is approximately 70%. The PgDRI scores were 702 (Section I, II, and III were 327, 262, and 113, respectively), the cost growth rate was approximately 63%, and the schedule growth rate was 78%.
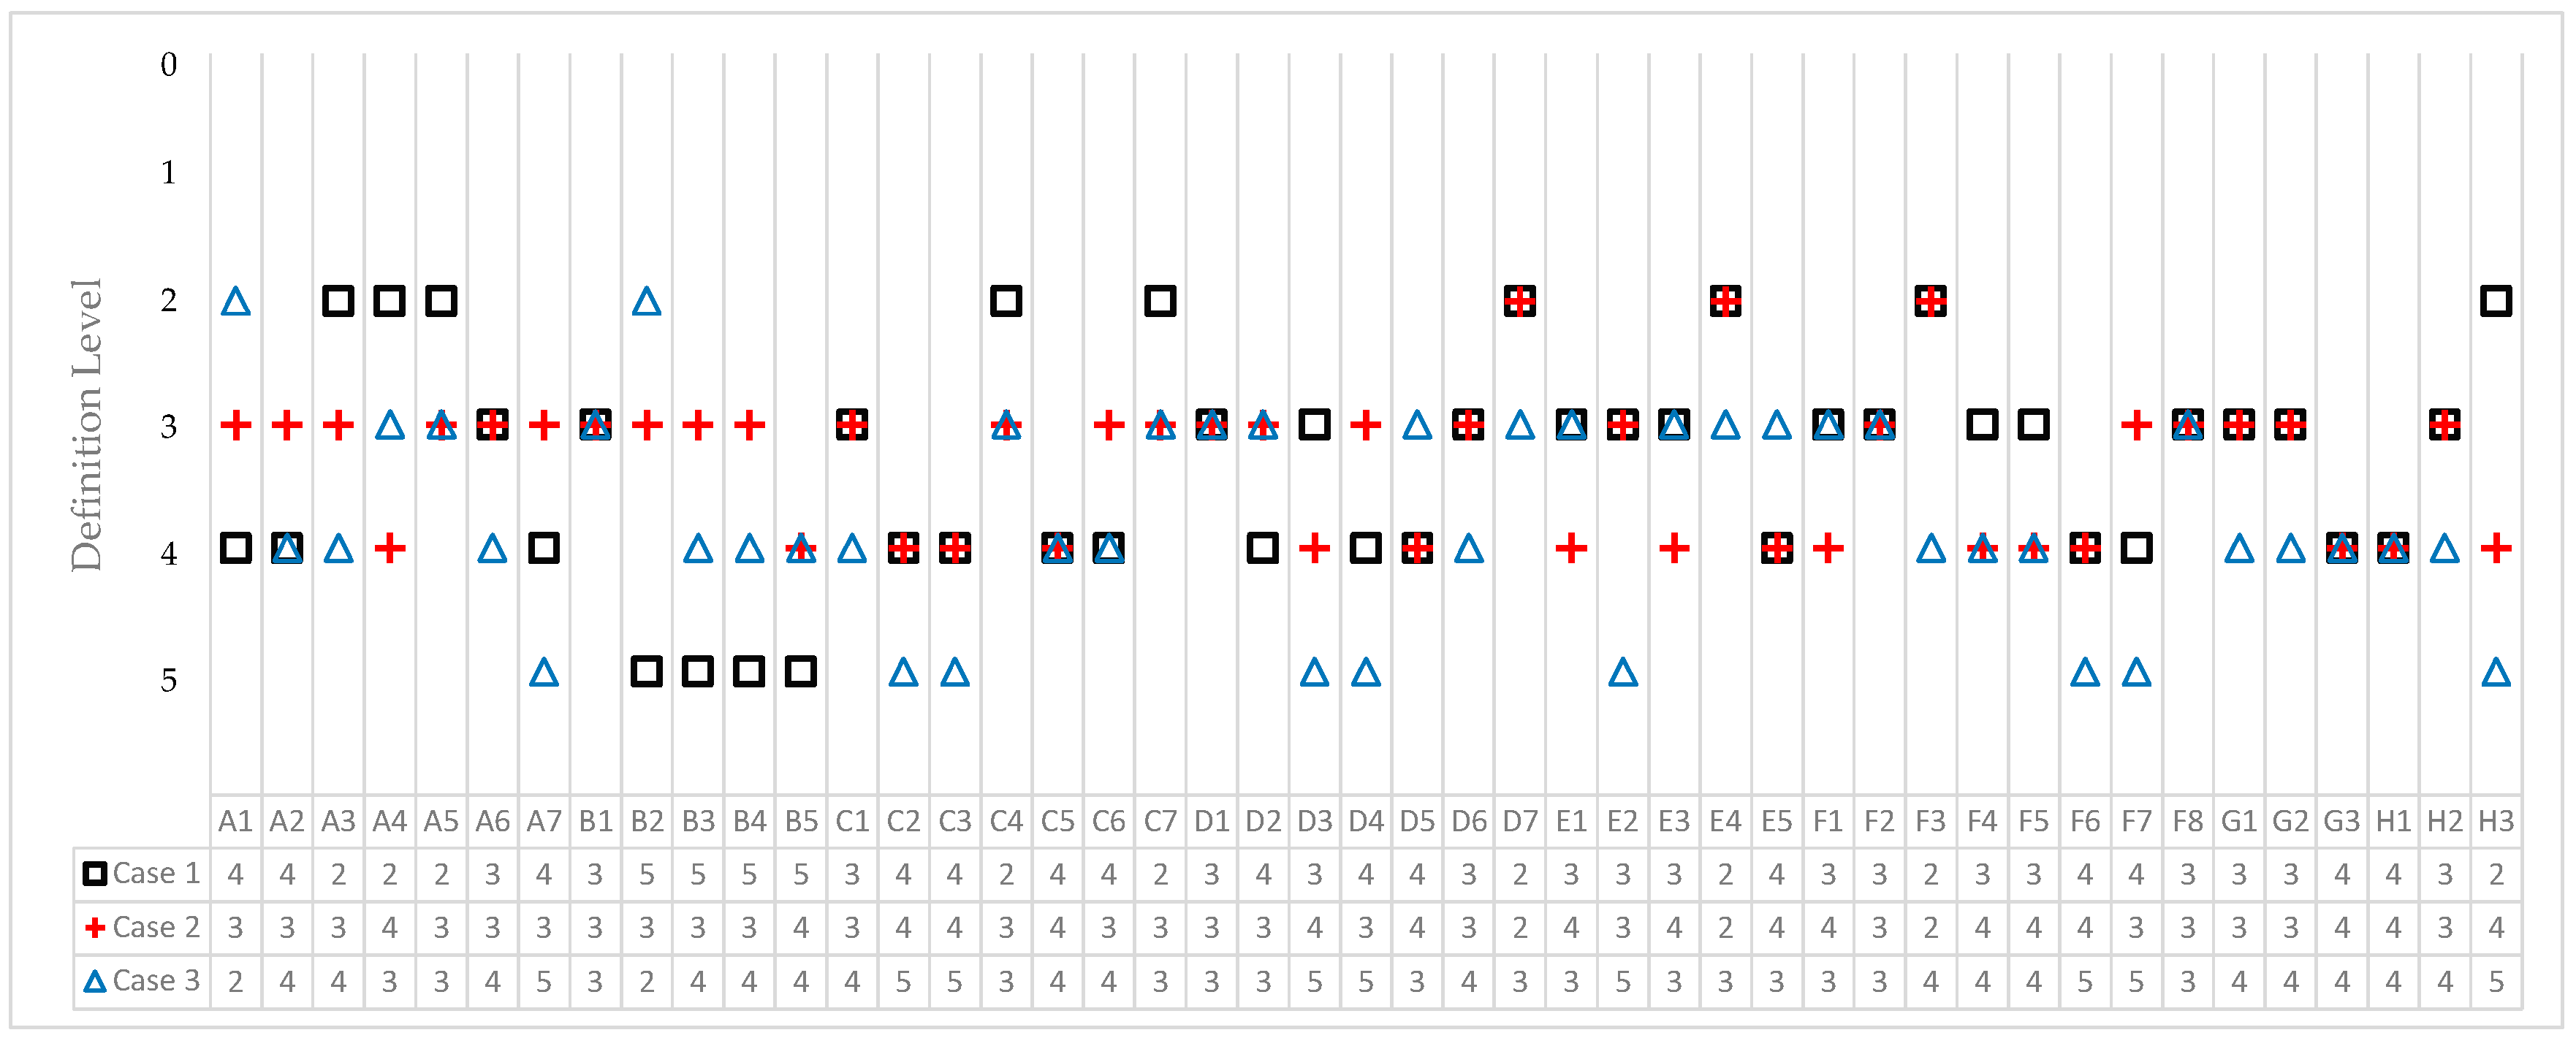
The PgDRI scores and performance of each test case were analyzed in detail. Figure 3 shows the CSFs evaluation result of each test case. In Case 1, Sections I–III showed a score that was approximately 50% of the maximum weight. Therefore, there was a need to further analyze the CSFs. The result of Section I showed that A1 and A2 were both level 4. This was because the situations of the various stakeholders were considered when establishing the master plan, which served as a constraint for establishing one major objective. In addition, A7 was level 4 due to the project period delays that were caused by conflicts with the local residents. These conflicts were due to the resident migrations and specific characteristics of military facilities. In C2, C3 and C5 the schedule, budget estimate and change control system were found to be level 4, suggesting that these factors led to cost overruns and schedule delays. In Section II, D2, D4, D5, F6, and F7 were level 4 because the risks and changes caused by the large amount of stakeholders and the huge business size were not previously identified. For the construction progress and the PgMIS utilization of E2, efforts have also been made to enhance the project performance due to the technology improvements of D2, F3, and F6. In Section III, G3 and H1 were large issues. Due to the specific characteristics of the military facilities, the owner’s detailed commissioning manual and turnover procedures led to unexpected claims and delays. In some cases, this led to a turnover period increase of three years. In Case 1, approximately 20% of the project remains. It is expected that improved results can be obtained by complementing the poorly defined CSFs with the PgDRI developed in this study during the major decision-making phase.
There were various main CSFs that were poorly defined in Case 2. In Section I, A4 and B5 were level 4 due to the lack of planning regarding the program roadmap and design. Similar to case 1, C2, C3, and C5 the schedule and budget estimate were found to be level 4, suggesting that these factors led to cost overruns and schedule delays. In Section II, an overall plan was not generated, and the program scope was not identified leading to A4, D3, D5, E1, and E5. In particular, it was found that the poor contract and financial definitions of E3 led to cost increases. Lastly, the situation of Section III for Case 2 was very similar to that of Case 1. Although the commissioning problem of G3 consistently occurred, it was not recognized during the early stages. As a result, G1, G2, H1, and H3 were negatively affected, resulting in cost increases and schedule delays.
In Case 3, much time was spent on establishing the plan. In Section I, most of the CSFs were found to be poorly defined. Even though the program vision and goal, and program success philosophy were relatively well defined, the final cost increased, and the schedule was delayed. The evaluation results of Section I showed that not only the owner’s vision and goal, but also all CSFs were well defined to improve performance. In Section II, D3, D4, D6 and E2 were found to be very poorly defined. Furthermore, change and schedule management (F6 and F7, respectively) were very poorly planned, which affected to the cost overruns and the schedule delays. Lastly, in Section III, most of the definitions were found to be poor due to the characteristics of commercial and office buildings, which require leasing and sales. In this regard, the owner responded that a countermeasure is currently being devised to deal with this challenge.
With regard to the PgDRI proposed in this study, a lower score indicates a better program definition, thus leading to a higher performance. Thus, to validate the applicability, PgDRI scores were compared with the sum of cost and schedule growth rate (see Figure 4). Figure 4 shows that the cases that have the higher PgDRI scores have a higher sum of growth rate. In case 1 and case 2, the PgDRI scores and the sum of growth rate show a similar variation rate (a, b in Figure 4). In case 3, the trend of variation is relatively similar to case 1 and case 2, while the rate of the sum of growth rate showed higher than that of the PgDRI scores (c in Figure 4). This was a result of the increased number of unexpected risks caused by the characteristics of the private construction program. Consequentially, the test results show the applicability of PgDRI developed in this study. However, there is a limitation in generalizing causality between PgDRI scores and performance prediction as this has applied to only three cases. Accordingly, further research needs to be conducted to investigate causal relationship through additional case applications.
7. Conclusions
Generally, construction programs are configured in the form of multiple projects (or subprograms) and have the characteristics of high complexity, large scale, long-term implementation period, and higher expenses. Since construction programs are larger and longer in scale, cost and schedule than single projects, the initial planning stages of programs are crucial to their success. Therefore, to decrease the negative impacts on the costs, schedule, and change orders, the uncertainties should be reduced through clear definitions of the goals, plans, and scope of the construction program during the early stages. In this regard, this study developed the PgDRI, which is a methodology for predicting the program performance. Several important elements were considered in this study. Forty-five CSFs were identified by analyzing previous studies pertaining to program management, then the CSFs were modified and complemented through expert interviews. For grouping the identified CSFs, a questionnaire survey was conducted among practitioners and researchers from related fields. Based on the survey results, the 45 CSFs were grouped into eight categories to perform the factor analysis. Lastly, the eight categories were grouped into three sections based on the program life cycle. Since the developed CSFs were qualitative variables, the weights for the 45 CSFs were calculated to perform quantitative evaluations. SEM was used due to its ability to analyze complex interrelationships by examining the causal relationship between the factors. Based on the SEM results, the weights were calculated for the 45 CSFs, and the weights of the categories and sections were converted to a scale of 1000 through the sum of the weights for each CSF. Based on the results, the PgDRI, which reflects the final values to which the weights were given, was developed in this study.
For validation, the developed PgDRI was applied to three in-progress construction programs, and the PgDRI scores and the cost and schedule growth rates were analyzed. The results showed that when the cost and schedule growth rates of the three cases increased significantly, the PgDRI scores were also very high. In particular, when the CSFs with high weights were analyzed in detail for each case, the CSFs with poor definitions were found to have negatively impacted the cost and schedule growth rates.
The PgDRI developed in this study is expected to contribute to the body of knowledge on program management by quantifying the performance management of a program. It can be utilized in the major decision-making processes throughout the entire life cycle and can predict the program performance during the early stages. In addition, since the PgDRI was developed in the form of a checklist, it can be easily evaluated by its users. In particular, the PgDRI can contribute to further research as a methodology for quantitatively analyzing the qualitative CSFs. Additionally, users can easily identify the CSFs with poor definitions by using the PgDRI during the program execution. Moreover, the PgDRI can contribute to the success of the program through the intensive management of the CSFs with poor definitions.
Meanwhile, 38 samples were used for grouping and weighting CSFs in order to develop PgDRI, then the PgDRI was applied to three cases to examine its applicability. Therefore, to ensure the objectivity of PgDRI, there is a need for further statistical analysis based on sufficient samples and cases. To this end, the authors are conducting a follow-up study to obtain the appropriate baseline scores for PgDRI through statistical analysis of program cases.
Author Contributions
Conceptualization, Y.C. and C.H.; Methodology, Y.C. and S.H.; Validation, Y.C. and J.K.; Formal Analysis, Y.C.; Investigation, Y.C.; Data Curation, Y.C. and J.K.; Writing-Original Draft Preparation, Y.C.; Writing-Review & Editing, J.K., C.H. and S.H.; Visualization, Y.C. and J.K.; Supervision, C.H.
Conflicts of Interest
The authors declare no conflict of interest.
References
- Thomsen, C. Program Management: Concepts and Strategies for Managing Capital Building Programs; Construction Management Association of America: McLean, VA, USA, 2008. [Google Scholar]
- PMI. The Standard for Program Management, 3rd ed.; Project Management Institute, Inc.: Newtown Square, PA, USA, 2013. [Google Scholar]
- PMAJ. P2M: A Guidebook of Project & Program Management for Enterprise Innovation; Project Management Association of Japan: Tokyo, Japan, 2005. [Google Scholar]
- Gray, R.J. Alternative approaches to programme management. Int. J. Proj. Manag. 1997, 15, 5–9. [Google Scholar] [CrossRef]
- Flyvbjerg, B.; Bruzelius, N.; Rothengatter, W. Megaprojects and Risk: An Anatomy of Ambition; Cambridge University Press: Cambridge, UK, 2003. [Google Scholar]
- Merrow, E.W. Industrial Megaprojects: Concepts, Strategies, and Practices for Success, 1st ed.; Wiley: Hoboken, NJ, USA, 2011; ISBN 047093882X. [Google Scholar]
- Flyvbjerg, B.; Turner, J.R. Do classics exist in megaproject management? Int. J. Proj. Manag. 2018, 36, 334–341. [Google Scholar] [CrossRef] [Green Version]
- Hwang, B.; Asce, M.; Zhu, L.; Siow, J.; Tan, H. Identifying Critical Success Factors for Green Business Parks: Case Study of Singapore. J. Manag. Eng. 2017, 33. [Google Scholar] [CrossRef]
- Sanvido, B.V.; Member, A.; Grobler, F.; Parfitt, K.; Guvenis, M.; Coyle, M. Critical success factors for construction projects. J. Constr. Eng. Manag. 1992, 118, 94–111. [Google Scholar] [CrossRef]
- Rockart, J.F. The changing role of the information systems executive: A critical success factors perspective. Sloan Sch. Manag. 1982, 23, 3–13. [Google Scholar]
- Ejaz, N.; Hussain, J.; Shabbir, F.; Shamim, M.A.; Naeem, U.A.; Tahir, M.F.; Ahmad, N.; Farooq, Q.U. Assessment of Critical Success Factors for Construction Projects in Pakistan. Life Sci. J. 2013, 10, 255–261. [Google Scholar]
- CII. Project Definition Rating Index (PDRI) for Industrial Projects; CII: Austin, TX, USA, 1995. [Google Scholar]
- CII. Pre-Project Planning Tool: PDRI for Buildings; CII: Austin, TX, USA, 1999. [Google Scholar]
- CII. Development of Project Definition Rating Index (PDRI) for General Building Projects; CII: Austin, TX, USA, 1999. [Google Scholar]
- Rubin, I.M.; Seelig, W. Experience as a factor in the selection and performance of project managers. IEEE Trans. Eng. Manag. 1967, 14, 131–135. [Google Scholar] [CrossRef]
- Park, H.; Kim, K.; Kim, Y.-W.; Kim, H. Stakeholder Management in Long-Term Complex Megaconstruction Projects: The Saemangeum Project. J. Manag. Eng. 2017, 33, 05017002. [Google Scholar] [CrossRef]
- Toor, S.; Ogunlana, S.O. Construction professionals’ perception of critical success factors for large-scale construction projects. Constr. Innov. 2008, 9, 149–167. [Google Scholar] [CrossRef]
- Yu, J.H.; Kwon, H.R. Critical success factors for urban regeneration projects in Korea. Int. J. Proj. Manag. 2011, 29, 889–899. [Google Scholar] [CrossRef]
- Heising, W. The integration of ideation and project portfolio management—A key factor for sustainable success. Int. J. Proj. Manag. 2012, 30, 582–595. [Google Scholar] [CrossRef]
- Luo, L.; He, Q.; Xie, J.; Yang, D.; Wu, G. Investigating the Relationship between Project Complexity and Success in Complex Construction Projects. J. Manag. Eng. 2017, 33, 04016036. [Google Scholar] [CrossRef]
- Shehu, Z.; Akintoye, A. The critical success factors for effective programme management: A pragmatic approach. Built Hum. Environ. Rev. 2009, 2, 1–24. [Google Scholar]
- Patanakul, P.; Milosevic, D. The effectiveness in managing a group of multiple projects: Factors of influence and measurement criteria. Int. J. Proj. Manag. 2009, 27, 216–233. [Google Scholar] [CrossRef]
- Shehu, Z.; Akintoye, A. Major challenges to the successful implementation and practice of programme management in the construction environment: A critical analysis. Int. J. Proj. Manag. 2010, 28, 26–39. [Google Scholar] [CrossRef]
- Lycett, M.; Rassau, A.; Danson, J. Programme management: A critical review. Int. J. Proj. Manag. 2004, 22, 289–299. [Google Scholar] [CrossRef]
- Thiry, M. Program Management; Gower: Farnham, UK, 2010. [Google Scholar]
- Evaristo, R.; van Fenema, P.C. A typology of project management: Emergence and evolution of new forms. Int. J. Proj. Manag. 1999, 17, 275–281. [Google Scholar] [CrossRef]
- Ferns, D.C. Developments in programme management. Int. J. Proj. Manag. 1991, 9, 148–156. [Google Scholar] [CrossRef]
- Prieto, R. Strategic Program Management; Construction Management Association of America: McLean, VA, USA, 2008. [Google Scholar]
- Thiry, M. “For DAD”: A programme management life-cycle process. Int. J. Proj. Manag. 2004, 22, 245–252. [Google Scholar] [CrossRef]
- CMAA. Construction Management Standards of Practice, 2011th ed.; Cnstruction Management Association of America: McLean, VA, USA, 2011. [Google Scholar]
- Levin, G.; Ward, J.L. Program Management Complexity: A Competency Model; Talyor & Francis Group: Boca Raton, FL, USA, 2011. [Google Scholar]
- Mancini, M.; Derakhshanalavijeh, R. Uncertainty in megaprojects: Opportunities for the future. In Proceedings of the International Conference on Industrial Engineering and Operations Management, Rabat, Morocco, 11–13 April 2017; pp. 368–379. [Google Scholar]
- OGC (Office of Government Commerce). Managing Successful Programmes; The Stationery Office: London, UK, 2011.
- Partington, D.; Pellegrinelli, S.; Young, M. Attributes and levels of programme management competence: An interpretive study. Int. J. Proj. Manag. 2005, 23, 87–95. [Google Scholar] [CrossRef]
- Pellegrinelli, S.; Partington, D.; Hemingway, C.; Mohdzain, Z.; Shah, M. The importance of context in programme management: An empirical review of programme practices. Int. J. Proj. Manag. 2007, 25, 41–55. [Google Scholar] [CrossRef]
- Shehu, Z.; Akintoye, A. Construction programme management theory and practice: Contextual and pragmatic approach. Int. J. Proj. Manag. 2009, 27, 703–716. [Google Scholar] [CrossRef]
- Pheng, L.S.; Chuan, Q.T. Environmental factors and work performance of project managers in the construction industry. Int. J. Proj. Manag. 2006, 24, 24–37. [Google Scholar] [CrossRef]
- Shi, S.; Chong, H.-Y.; Liu, L.; Ye, X. Examining the Interrelationship among Critical Success Factors of Public Private Partnership Infrastructure Projects. Sustainability 2016, 8, 1313. [Google Scholar] [CrossRef]
- Bingham, E.; Gibson, G.E. Infrastructure Project Scope Definition Using Project Definition Rating Index. J. Manag. Eng. 2017, 33, 04016037. [Google Scholar] [CrossRef]
- Son, H.; Kim, C.; Kim, C. Hybrid principal component analysis and support vector machine model for predicting the cost performance of commercial building projects using pre-project planning variables. Autom. Constr. 2012, 27, 60–66. [Google Scholar] [CrossRef]
- Cao, X.; Li, Z.; Liu, S. Study on factors that inhibit the promotion of SI housing system in China. Energy Build. 2015, 88, 384–394. [Google Scholar] [CrossRef]
- Heo, J. Heo Jun’s Easy-to-Follow AMOS Structure Equation Model; Hannarae: Seoul, Korea, 2013; ISBN 978-89-5566-141-5. [Google Scholar]
- Li, L.; Li, Z.; Wu, G.; Li, X. Critical success factors for project planning and control in prefabrication housing production: A China study. Sustainability 2018, 10. [Google Scholar] [CrossRef]
- Kaiser, H.F. An index of factorial simplicity. Psychometrika 1974, 39, 31–36. [Google Scholar] [CrossRef]
- Cho, K.; Hong, T.; Hyun, C. Effect of project characteristics on project performance in construction projects based on structural equation model. Expert Syst. Appl. 2009, 36, 10461–10470. [Google Scholar] [CrossRef]
- Zhang, L.; Liu, Q.; Wu, X.; Skibniewski, M.J. Perceiving Interactions on Construction Safety Behaviors: Workers’ Perspective. J. Manag. Eng. 2016, 32, 04016012. [Google Scholar] [CrossRef]
Figure 1.
Research framework.

Figure 2.
SEM for Program CSFs.

Figure 3.
Result of CSF Evaluation for the Test Cases.

Figure 4.
Comparison between PgDRI Scores and Performance of the Test Cases.


Table 1.
45 CSFs for Construction Program Management.
| No. | Critical Success Factors (CSFs) | References | No. | Critical Success Factors (CSFs) | References |
|---|---|---|---|---|---|
| CSF-1 | Program Vision and Goal | [2,3,11,14,17,18,19,20,21,31,40] | CSF-24 | Program Work Breakdown Structure | [2,31] |
| CSF-2 | High-Level Program Business Case | [14,17,25,31,40], E 1 | CSF-25 | Site Information | [2,3,19,20,21,25,31] |
| CSF-3 | Organization Strategy | [2,3,14,17,18,21,25,31,40] | CSF-26 | Program Value Evaluation | [2,3] |
| CSF-4 | Program Plan and Roadmap | [2,3,11,14,19,20,21,25,31,40] | CSF-27 | Scope of Program (or Subproject) Overview | [2,3,18,25,31] |
| CSF-5 | Define Expected Benefit | [2,3,14,19,25,31,40] | CSF-28 | Operating PgMIS 2 | [17,20,21,31], E |
| CSF-6 | Feasibility Studies | [2,3,14,31,40], E | CSF-29 | Financial Management | [2,19,20,31] |
| CSF-7 | Environmental Assessment | [2,3,14,31,40], E | CSF-30 | Operation of Governance System | [2,25,31] |
| CSF-8 | Reliability Philosophy | [14,17,40] | CSF-31 | Stakeholder Engagement | [2,11,31] |
| CSF-9 | Program Success Philosophy | [11,14,40] | CSF-32 | Resource Management | [17,18,20] |
| CSF-10 | Maintenance Philosophy | [2,3,11,14,17,19,21,25,31,40] | CSF-33 | Value Engineering Process | [14,31] |
| CSF-11 | Operating Philosophy | [2,3,11,14,19,21,25,31,40] | CSF-34 | Program/Project Design Parameters | [2,17,20,25] |
| CSF-12 | Design Philosophy | [14,20,40] | CSF-35 | Project Control | [2,25] |
| CSF-13 | Each Sub Program (or Project) Programming | [3,11,14,17,21,25,31,40] | CSF-36 | Contract Management | [2,3,11,18,25,31] |
| CSF-14 | Program Schedule Estimate | [14,25,40] | CSF-37 | Change Management | [3,25] |
| CSF-15 | Program Budget Estimate | [2,3,14,17,21,25,40] | CSF-38 | Risk Management | [2] |
| CSF-16 | Program Charter | [2,14,17,25,40], E | CSF-39 | Procurement and Supply Chain Management | [25] |
| CSF-17 | Change Control System | [14,40] | CSF-40 | Deliverable for Design | [2,3,17,25], E |
| CSF-18 | Organization Alignment | [14,25,40] | CSF-41 | Deliverable for Program | [2,3,17,20,21,25], E |
| CSF-19 | Program Governance | [2,3,14,21,25,31,40] | CSF-42 | Turnover | [2,3,17,20,21,25,31], E |
| CSF-20 | Program Infrastructure and Resource | [2,3,17,18,20,25,31] | CSF-43 | Commissioning and Start-up | E |
| CSF-21 | Key Program Risk Issues | [2] | CSF-44 | Evaluates the Actual Benefits | E |
| CSF-22 | Program Management Tool and Techniques | [19,31] | CSF-45 | Program(or Sub Program, Project) Closure | [2,3,11,17,18,19,25,31], E |
| CSF-23 | Program and Project Delivery Method | [2,3,25] |
1 E: Expert Interview; 2 PgMIS: Program management information system.
Table 2.
Program Life Cycle Comparison (Modification of Thiry’s (2010) Research).
| This Research | PMI (2013) | OGC (2011) | PMAJ (2005) | Thiry (2004) |
|---|---|---|---|---|
| Program Planning | Program Definition | Identifying Programme | Define Program | Formulation |
| Defining Programme | Acquire Common View (Program Mission and Value) Understand Common View (Program Community and Architecture) | Organization | ||
| Program Benefits Execution | Program Benefits Delivery (Monitoring and Control) | Managing the Tranches | Integration Management (Integrative management of Projects) | Deployment |
| Delivering the Capability | ||||
| Realizing the Benefits | Structured Value Assessment | Appraisal | ||
| Program Turnover and Closure | Program Closure | Closing the Programme | No identified closing phase | Dissolution |
Table 3.
Result of Factor Analysis for Section I (Program Planning).
| Category | Factors | 1 | 2 | 3 |
|---|---|---|---|---|
| Program Strategy | CSF 13 | 0.935 | 0.091 | 0.144 |
| CSF 15 | 0.909 | 0.053 | 0.033 | |
| CSF 14 | 0.900 | 0.149 | 0.069 | |
| CSF 19 | 0.840 | 0.131 | 0.153 | |
| CSF 17 | 0.781 | 0.138 | 0.141 | |
| CSF 16 | 0.759 | −0.038 | 0.185 | |
| CSF 18 | 0.736 | −0.003 | 0.167 | |
| Program Philosophy | CSF 11 | 0.044 | 0.957 | 0.045 |
| CSF 10 | 0.022 | 0.938 | −0.004 | |
| CSF 8 | 0.001 | 0.899 | 0.043 | |
| CSF 9 | 0.077 | 0.798 | 0.017 | |
| CSF 12 | 0.377 | 0.707 | 0.002 | |
| Program Plan | CSF 6 | 0.049 | −0.051 | 0.883 |
| CSF 1 | 0.209 | 0.097 | 0.751 | |
| CSF 4 | 0.305 | −0.033 | 0.658 | |
| CSF 2 | −0.002 | 0.128 | 0.649 | |
| CSF 7 | 0.049 | −0.051 | 0.601 | |
| CSF 3 | 0.058 | 0.073 | 0.559 | |
| CSF 5 | 0.136 | −0.050 | 0.508 |
Table 4.
CSFs grouped by Life Cycle of a Construction program.
| Section I—Program Planning | |
| Category A. Program Strategy | Category C. Program Plan |
| A1 Program Vision and Goal | C1 Each Sub Program(or Project) Programming |
| A2 High-Level Program Business Case | C2 Program Schedule Estimate |
| A3 Organization Strategy | C3 Program Budget Estimate |
| A4 Program Plan and Roadmap | C4 Program Charter |
| A5 Define Expected Benefit | C5 Change Control system |
| A6 Feasibility Studies | C6 Organization Alignment |
| A7 Environmental Assessment | C7 Program Governance |
| Category B. Program Philosophies | |
| B1 Reliability Philosophy | |
| B2 Program Success Philosophy | |
| B3 Maintenance Philosophy | |
| B4 Operating Philosophy | |
| B5 Design Philosophy | |
| Section II—Program Benefits Execution | |
| Category D. Benefits Plan | Category F. Program Monitoring and Control |
| D1 Program Infrastructure and Resource | F1. Resource Management |
| D2 Key Program Risk Issues | F2. Value Engineering Process |
| D3. Program Management Tool and Techniques | F3. Program / Project Design Parameters |
| D4. Program and Project Delivery Method | F4. Project Control |
| D5. Program Work Breakdown Structure | F5. Contract Management |
| D6. Site Information | F6. Change Management |
| D7. Program Value Evaluation | F7. Risk Management |
| Category E. Program Execution | F8. Procurement and Supply Chain Management |
| E1. Scope of Program (or Subproject) Overview | |
| E2. Operating PgMIS | |
| E3. Financial Management | |
| E4. Operation of Governance System | |
| E5. Stakeholder Engagement | |
| Section III—Program Turnover and Closure | |
| Category G. Program Closure | Category H. Program Satisfaction |
| G1. Deliverables for Design | H1. Commissioning and Start-up |
| G2. Deliverables for Program | H2. Evaluates the Actual Benefits |
| G3. Turnover | H3. Program(or Sub Program, Project) Closure |
Table 5.
The Weights of the Section, Category, and Factor.
| Section | Standardized Section Regression | Section Weight | Category | Standardized Category Regression | Category Weight | Factor Code | Standardized Factor Regression | Normalized Factor Regression | Factor Weight |
|---|---|---|---|---|---|---|---|---|---|
| I. Program Planning | 0.475 | 475 | A. Program Strategy | 0.54 | 255 | A1 | 0.784 | 0.149 | 38 |
| A2 | 0.824 | 0.156 | 40 | ||||||
| A3 | 0.645 | 0.122 | 31 | ||||||
| A4 | 0.841 | 0.159 | 41 | ||||||
| A5 | 0.622 | 0.118 | 30 | ||||||
| A6 | 0.584 | 0.111 | 28 | ||||||
| A7 | 0.976 | 0.185 | 47 | ||||||
| Sub Total | 1.0 | 255 | |||||||
| B. Program Philosophy | 0.10 | 47 | B1 | 0.953 | 0.209 | 10 | |||
| B2 | 0.871 | 0.191 | 9 | ||||||
| B3 | 0.902 | 0.198 | 9 | ||||||
| B4 | 0.878 | 0.193 | 9 | ||||||
| B5 | 0.952 | 0.209 | 10 | ||||||
| Sub Total | 1.0 | 47 | |||||||
| C. Program Plan | 0.36 | 173 | C1 | 0.962 | 0.147 | 25 | |||
| C2 | 0.996 | 0.152 | 26 | ||||||
| C3 | 0.895 | 0.136 | 24 | ||||||
| C4 | 0.942 | 0.144 | 25 | ||||||
| C5 | 0.986 | 0.150 | 26 | ||||||
| C6 | 0.795 | 0.121 | 21 | ||||||
| C7 | 0.985 | 0.150 | 26 | ||||||
| Sub Total | 1.0 | 173 | |||||||
| Sub Total | 1.0 | 475 | - | - | - | 475 | |||
| II. Program Benefits Execution | 0.377 | 377 | D. Benefits Plan | 0.41 | 155 | D1 | 0.709 | 0.133 | 21 |
| D2 | 0.945 | 0.177 | 27 | ||||||
| D3 | 0.893 | 0.167 | 26 | ||||||
| D4 | 0.840 | 0.158 | 24 | ||||||
| D5 | 0.788 | 0.140 | 23 | ||||||
| D6 | 0.473 | 0.089 | 14 | ||||||
| D7 | 0.683 | 0.128 | 20 | ||||||
| Sub Total | 1.0 | 155 | |||||||
| E. Program Execution | 0.25 | 98 | E1 | 0.632 | 0.156 | 15 | |||
| E2 | 0.691 | 0.171 | 17 | ||||||
| E3 | 0.995 | 0.246 | 24 | ||||||
| E4 | 0.928 | 0.225 | 23 | ||||||
| E5 | 0.790 | 0.197 | 19 | ||||||
| Sub Total | 1.0 | 98 | |||||||
| F. Program Monitoring and Control | 0.33 | 124 | F1 | 0.478 | 0.078 | 10 | |||
| F2 | 0.538 | 0.088 | 11 | ||||||
| F3 | 0.688 | 0.112 | 14 | ||||||
| F4 | 0.867 | 0.141 | 17 | ||||||
| F5 | 0.837 | 0.137 | 17 | ||||||
| F6 | 0.957 | 0.156 | 19 | ||||||
| F7 | 0.987 | 0.161 | 20 | ||||||
| F8 | 0.777 | 0.127 | 16 | ||||||
| Sub Total | 1.0 | 124 | |||||||
| Sub Total | 1.0 | 377 | - | - | - | 377 | |||
| III. Program Turnover and Closure | 0.148 | 148 | G. Program Closure | 0.75 | 111 | G1 | 0.484 | 0.216 | 24 |
| G2 | 0.770 | 0.343 | 38 | ||||||
| G3 | 0.990 | 0.441 | 49 | ||||||
| Sub Total | 1.0 | 111 | |||||||
| H. Program Satisfaction | 0.25 | 37 | H1 | 0.570 | 0.294 | 11 | |||
| H2 | 0.988 | 0.510 | 19 | ||||||
| H3 | 0.380 | 0.196 | 7 | ||||||
| Sub Total | 1.0 | 37 | |||||||
| Sub Total | 1.0 | 148 | - | - | - | 148 | |||
| Total | 1.0 | 1000 | - | 3.0 | 1000 | - | - | - | 1000 |
Table 6.
Developed PgDRI.
| Section | Category | Category Weight | Factor Code | Definition Level | Rating 1 | |||||
|---|---|---|---|---|---|---|---|---|---|---|
| N/A | 1 | 2 | 3 | 4 | 5 | |||||
| I. Program Definition | A. Program Strategy | 255 | A1 | - | 0 | 10 | 19 | 29 | 38 | |
| A2 | - | 0 | 10 | 20 | 30 | 40 | ||||
| A3 | - | 0 | 8 | 16 | 23 | 31 | ||||
| A4 | - | 0 | 10 | 21 | 31 | 41 | ||||
| A5 | - | 0 | 8 | 15 | 23 | 30 | ||||
| A6 | - | 0 | 7 | 14 | 21 | 28 | ||||
| A7 | - | 0 | 12 | 24 | 35 | 47 | ||||
| Category Total | - | 0 | 65 | 129 | 192 | 255 | ||||
| B. Program Philosophy | 47 | B1 | - | 0 | 3 | 5 | 8 | 10 | ||
| B2 | - | 0 | 2 | 5 | 7 | 9 | ||||
| B3 | - | 0 | 2 | 5 | 7 | 9 | ||||
| B4 | - | 0 | 2 | 5 | 7 | 9 | ||||
| B5 | - | 0 | 3 | 5 | 8 | 10 | ||||
| Category Total | - | 0 | 12 | 25 | 37 | 47 | ||||
| C. Program Plan | 173 | C1 | - | 0 | 6 | 13 | 19 | 25 | ||
| C2 | - | 0 | 7 | 13 | 20 | 26 | ||||
| C3 | - | 0 | 6 | 12 | 18 | 24 | ||||
| C4 | - | 0 | 6 | 13 | 19 | 25 | ||||
| C5 | - | 0 | 7 | 13 | 20 | 26 | ||||
| C6 | - | 0 | 5 | 11 | 16 | 21 | ||||
| C7 | - | 0 | 7 | 13 | 20 | 26 | ||||
| Category Total | - | 0 | 44 | 88 | 132 | 173 | ||||
| Section I Total | 475 | - | 0 | 121 | 242 | 361 | 475 | |||
| II. Program Benefits Execution | D. Benefits Plan | 155 | D1 | - | 0 | 5 | 11 | 16 | 21 | |
| D2 | - | 0 | 7 | 14 | 20 | 27 | ||||
| D3 | - | 0 | 7 | 13 | 20 | 26 | ||||
| D4 | - | 0 | 6 | 12 | 18 | 24 | ||||
| D5 | - | 0 | 6 | 12 | 17 | 23 | ||||
| D6 | - | 0 | 4 | 7 | 11 | 14 | ||||
| D7 | - | 0 | 5 | 10 | 15 | 20 | ||||
| Category Total | - | 0 | 40 | 79 | 117 | 155 | ||||
| E. Program Execution | 98 | E1 | - | 0 | 4 | 8 | 11 | 15 | ||
| E2 | - | 0 | 4 | 9 | 13 | 17 | ||||
| E3 | - | 0 | 6 | 12 | 18 | 24 | ||||
| E4 | - | 0 | 6 | 12 | 17 | 23 | ||||
| E5 | - | 0 | 5 | 10 | 14 | 19 | ||||
| Category Total | - | 0 | 25 | 51 | 73 | 98 | ||||
| F. Program Monitoring and Control | 124 | F1 | - | 0 | 3 | 5 | 8 | 10 | ||
| F2 | - | 0 | 3 | 6 | 8 | 11 | ||||
| F3 | - | 0 | 4 | 7 | 11 | 14 | ||||
| F4 | - | 0 | 4 | 9 | 13 | 17 | ||||
| F5 | - | 0 | 4 | 9 | 13 | 17 | ||||
| F6 | - | 0 | 5 | 10 | 14 | 19 | ||||
| F7 | - | 0 | 5 | 10 | 15 | 20 | ||||
| F8 | - | 0 | 4 | 8 | 12 | 16 | ||||
| Category Total | - | 0 | 32 | 64 | 94 | 124 | ||||
| Section II Total | 377 | - | 0 | 97 | 194 | 284 | 377 | |||
| III. Program Turnover and Closure | G. Program Closure | 111 | G1 | - | 0 | 6 | 12 | 18 | 24 | |
| G2 | - | 0 | 10 | 19 | 29 | 38 | ||||
| G3 | - | 0 | 12 | 25 | 37 | 49 | ||||
| Category Total | - | 0 | 28 | 56 | 84 | 111 | ||||
| H. Program Satisfaction | 37 | H1 | - | 0 | 3 | 6 | 8 | 11 | ||
| H2 | - | 0 | 5 | 10 | 14 | 19 | ||||
| H3 | - | 0 | 2 | 4 | 5 | 7 | ||||
| Category Total | - | 0 | 10 | 20 | 27 | 37 | ||||
| Section III Total | 148 | - | 0 | 38 | 76 | 111 | 148 | |||
| PgDRI Total | 1000 | - | 0 | 256 | 512 | 756 | 1000 | |||
1 The Score column is filled by the user.
Table 7.
Basic Information of the Test Cases.
| Category | Case 1 | Case 2 | Case 3 |
|---|---|---|---|
| Program type | Military facilities | Military facilities | Residential, Office, and Commercial Buildings |
| Sector | Public | Public | Private |
| No. of Project | 18 projects (97 Buildings) | 15 projects (157 Buildings) | 5 projects (3 Residential, 2 Office, and 1 Commercial Buildings) |
| Total Budget | 2.2 Billion | 2.6 Billion | 1.3 Billion |
| Total Schedule | 10 Years | 13 Years | 8 Years 8 months |
Table 8.
PgDRI Score and Program Performance for the Cases.
| Case Number | PgDRI Scores | Program Performance | |||||
|---|---|---|---|---|---|---|---|
| Cost (Billion USD) | Schedule (Month) | ||||||
| Estimated | Actual | Growth Rate (%) | Estimated | Actual | Growth Rate (%) | ||
| Case 1 | 557 | 1.6 | 2.2 | 37.50 | 100 | 120 | 20.00 |
| Case 2 | 586 | 2 | 2.6 | 30.00 | 110 | 150 | 36.36 |
| Case 3 | 702 | 0.8 | 1.3 | 62.50 | 70 | 107 | 52.86 |
© 2018 by the authors. Licensee MDPI, Basel, Switzerland. This article is an open access article distributed under the terms and conditions of the Creative Commons Attribution (CC BY) license (http://creativecommons.org/licenses/by/4.0/).
Share and Cite
MDPI and ACS Style
Cha, Y.; Kim, J.; Hyun, C.-t.; Han, S. Development of a Program Definition Rating Index for the Performance Prediction of Construction Programs. Sustainability 2018, 10, 2747. https://doi.org/10.3390/su10082747
AMA Style
Cha Y, Kim J, Hyun C-t, Han S. Development of a Program Definition Rating Index for the Performance Prediction of Construction Programs. Sustainability. 2018; 10(8):2747. https://doi.org/10.3390/su10082747
Chicago/Turabian StyleCha, Yongwoon, Jonghyeob Kim, Chang-taek Hyun, and Sangwon Han. 2018. "Development of a Program Definition Rating Index for the Performance Prediction of Construction Programs" Sustainability 10, no. 8: 2747. https://doi.org/10.3390/su10082747
Note that from the first issue of 2016, this journal uses article numbers instead of page numbers. See further details here.