The Evolution of the Urban Spatial Pattern in the Yangtze River Economic Belt: Based on Multi-Source Remote Sensing Data


1
Jiangsu Center for Collaborative Innovation in Geographical Information Resource Development and Application, Nanjing Normal University, Nanjing 210023, China
2
Key Laboratory of Virtual Geographic Environment, Nanjing Normal University, Ministry of Education, Nanjing 210046, China
3
School of Geographic Science, Nanjing Normal University, Nanjing 210046, China
4
College of Geomatics Science and Technology, Nanjing Tech University, Nanjing 211816, China
*
Author to whom correspondence should be addressed.
Sustainability 2018, 10(8), 2733; https://doi.org/10.3390/su10082733
Submission received: 5 July 2018
/
Revised: 26 July 2018
/
Accepted: 1 August 2018
/
Published: 3 August 2018
(This article belongs to the Special Issue Spatial Analysis of Urbanization towards Urban Sustainability)
Abstract
:The development of the Yangtze River Economic Belt (YREB) is an important national regional development strategy and a strategic engineering development system. In this study, the evolution of urban spatial patterns in the YREB from 1990 to 2010 was mapped using the nighttime stable light (NSL) data, multi-temporal urban land products, and multiple sources of geographic data by using the rank-size distribution and the Gini coefficient method. Through statistical results, we found that urban land takes on the feature of “high in the east and low in the west”. The study area included cities of different development stages and sizes. The nighttime light increased in most cities from 1992 to 2010, and the rate assumed an obvious growth tendency in the three urban agglomerations in the YREB. The results revealed that the urban size distribution of the YREB is relatively dispersed, the speed of urban development is unequal, and the trend of urban size structure shows a decentralized distribution pattern that has continuously strengthened from 1990 to 2010. Affected by factors such as geographical conditions, spatial distance, and development stage, the lower reaches of the Yangtze River have developed rapidly, the upper and middle reaches have developed large cities, and a contiguous development trend is not obvious. The evolution of urban agglomerations in the region presents a variety of spatial development characteristics. Jiangsu, Zhejiang, and Shanghai have entered a phase of urban continuation, forming a more mature interregional urban agglomeration, while the YREB inland urban agglomerations are in suburbanization and multi-centered urban areas. At this stage, the conditions for the formation of transregional urban agglomerations do not yet exist, and there are many uncertainties in the boundary and spatial structure of each urban agglomeration.
1. Introduction
The Yangtze River Economic Belt (YREB) is a typical basin economy. From a worldwide perspective, the study of economic problems in the basin began in the 1940s. In 1933, the United States established the Tennessee Valley Authority (TVA) and successfully developed and implemented the Tennessee River Basin Development Plan. The United States’ successful experience led to the model being used by many countries. The economic prosperity and development of the river basin has had a major impact on the economic and social development of the entire basin and even the entire country [1,2,3,4,5]. The YREB occupies an important position in the spatial development pattern of China’s national territory. Especially after entering the modern industrial civilization and rapid urbanization process, the strategic position of the YREB has continuously improved [6,7,8,9]. In the early 1980s, academic Lu Dadao, a prominent economic geographer in China, proposed the “T”-shaped development strategy, that the coastal economic belt and the Yangtze river economic belt meet in the Yangtze River Delta, and the YREB connects the Chengdu–Chongqing region, Wuhan region, and coastal economic belt. This spatial structure accurately reflects the distribution framework of China’s land and resources, economic strength, and development potential. In the new era, Premier Li Keqiang proposed the “second quarter of China’s economic miracle” development goal, and a symposium was held to study the construction of the Yangtze River economic belt on the basis of the golden waterway, providing important support for China’s sustained economic development [10]. “The Guiding Opinions on Promoting the Development of the Yangtze River Economic Belt on the Basis of the Golden Waterway” issued by the State Council clearly stated that it is necessary to build the Yangtze River Economic Belt into an inland river economic belt with global influence [11,12,13,14].
In recent years, the economic level of the YREB has developed rapidly. In 2013, the total gross domestic product (GDP) of the 11 provinces (cities) covered by the YREB was close to 26 trillion, accounting for 41.2% of the total GDP of the country, but the economic development of each city is obviously different [15,16]. The level of coordinated development between cities is not high. In addition, the formation of the YREB and the evolution of its economic spatial structure has experienced four stages of development: the independent development stage, the regional agglomeration and linking stage, the administrative economic zone stage, and the space competition and linking stage. The characteristics of the different stages of spatial structure evolution are manifested by the comprehensive conditions of the level of economic development, the development of cities and towns, the passage of “streams”, and social and political factors. However, the regional spatial structure has structural inertia, and it is an important task for each period of socioeconomic transition to rationally guide and reorganize the spatial structure of the Yangtze River Economic Belt. As an important space for economic and social development, whether the scale of the city is reasonable and whether the distribution structure is perfect are directly related to the functioning of the urban system and the improvement of competitiveness. The fine spatial pattern of the urban system is also one of the goals of regional coordinated development. Therefore, an in-depth analysis of the spatial structure characteristics and evolution laws of urban systems is of great practical significance for the overall improvement of regional competitiveness and influence of the YREB [17], and the trend of urbanization and intensive development provides a basis for the scientific and rational planning of the urban development strategy of the research area.
With the development of a series of urban size distribution theories, such as the law of the primate city and the city rank-size rule, researchers have conducted research on the scale distribution and evolution characteristics of urban systems on a national scale, regional scale, and urban agglomeration. At present, the study of the distribution of urban size in China mainly includes two categories. One category is the study of urban population size distribution, and the other is the study of urban land scale distribution. Through examining existing studies, it was found that under the conditions of selecting different spatial units, countries, or historical development stages, the scale structure of the urban system obtained by the relevant research institutes is not completely consistent [18,19,20,21,22]. At the same time, we also found that most of the existing research uses statistical data as research data, including urban resident population data and urban built-up area statistical data, but with the constant adjustment of administrative divisions in China, the population statistical data and the built-up urban areas are also constantly changing, which creates certain difficulties for understanding the long-term serial spatiotemporal dynamics of the distribution of regional cities. As the number of remote sensing data sources massively increase, the use of remote sensing data to analyze the distribution of urban size has also received increasingly more attention [23,24,25,26,27,28]. These studies mostly explore the model simulations of nighttime light and human society-related factors such as urbanization, urban population, energy consumption, and carbon emissions. There are few comprehensive analysis and research studies on urban systems, urban spatial structures, and pattern evolution [29].
The Yangtze River Economic Belt involves many provinces and large areas, and the economic and social development between the upper and middle reaches is very uneven. To address the above existing issues, this study aims to use multi-temporal urban land-use data and Defense Meteorological Satellite Program/Operational Linescan System (DMSP/OLS) nighttime light time-series data to obtain urban land-use information and the total nighttime light of cities from 1992 to 2010. A comparative study on the spatiotemporal dynamic process of urban land distribution in the YREB and the three major urban agglomerations by using the urban rank-size rule method and the Gini coefficient analysis method, with the support of multi-source time-series remote sensing data, shows the similarities and differences between the spatiotemporal dynamic processes of urban land scale distribution in the YREB, and the urban agglomerations in the region. The aim of this study is to understand the development stage of the regional urban system, and remote sensing data are used to solve the difficult problem of large-scale data collection and analysis across provinces and cities. The variation and evolution of the spatial and temporal dynamic process of the urban land scale distribution in the YERB and the urban agglomeration will be revealed. It will provide a scientific reference for formulating reasonable countermeasures for urban system development and promoting the optimization of the urban system scale structure.
2. Study Areas and Data Sources
2.1. Study Areas
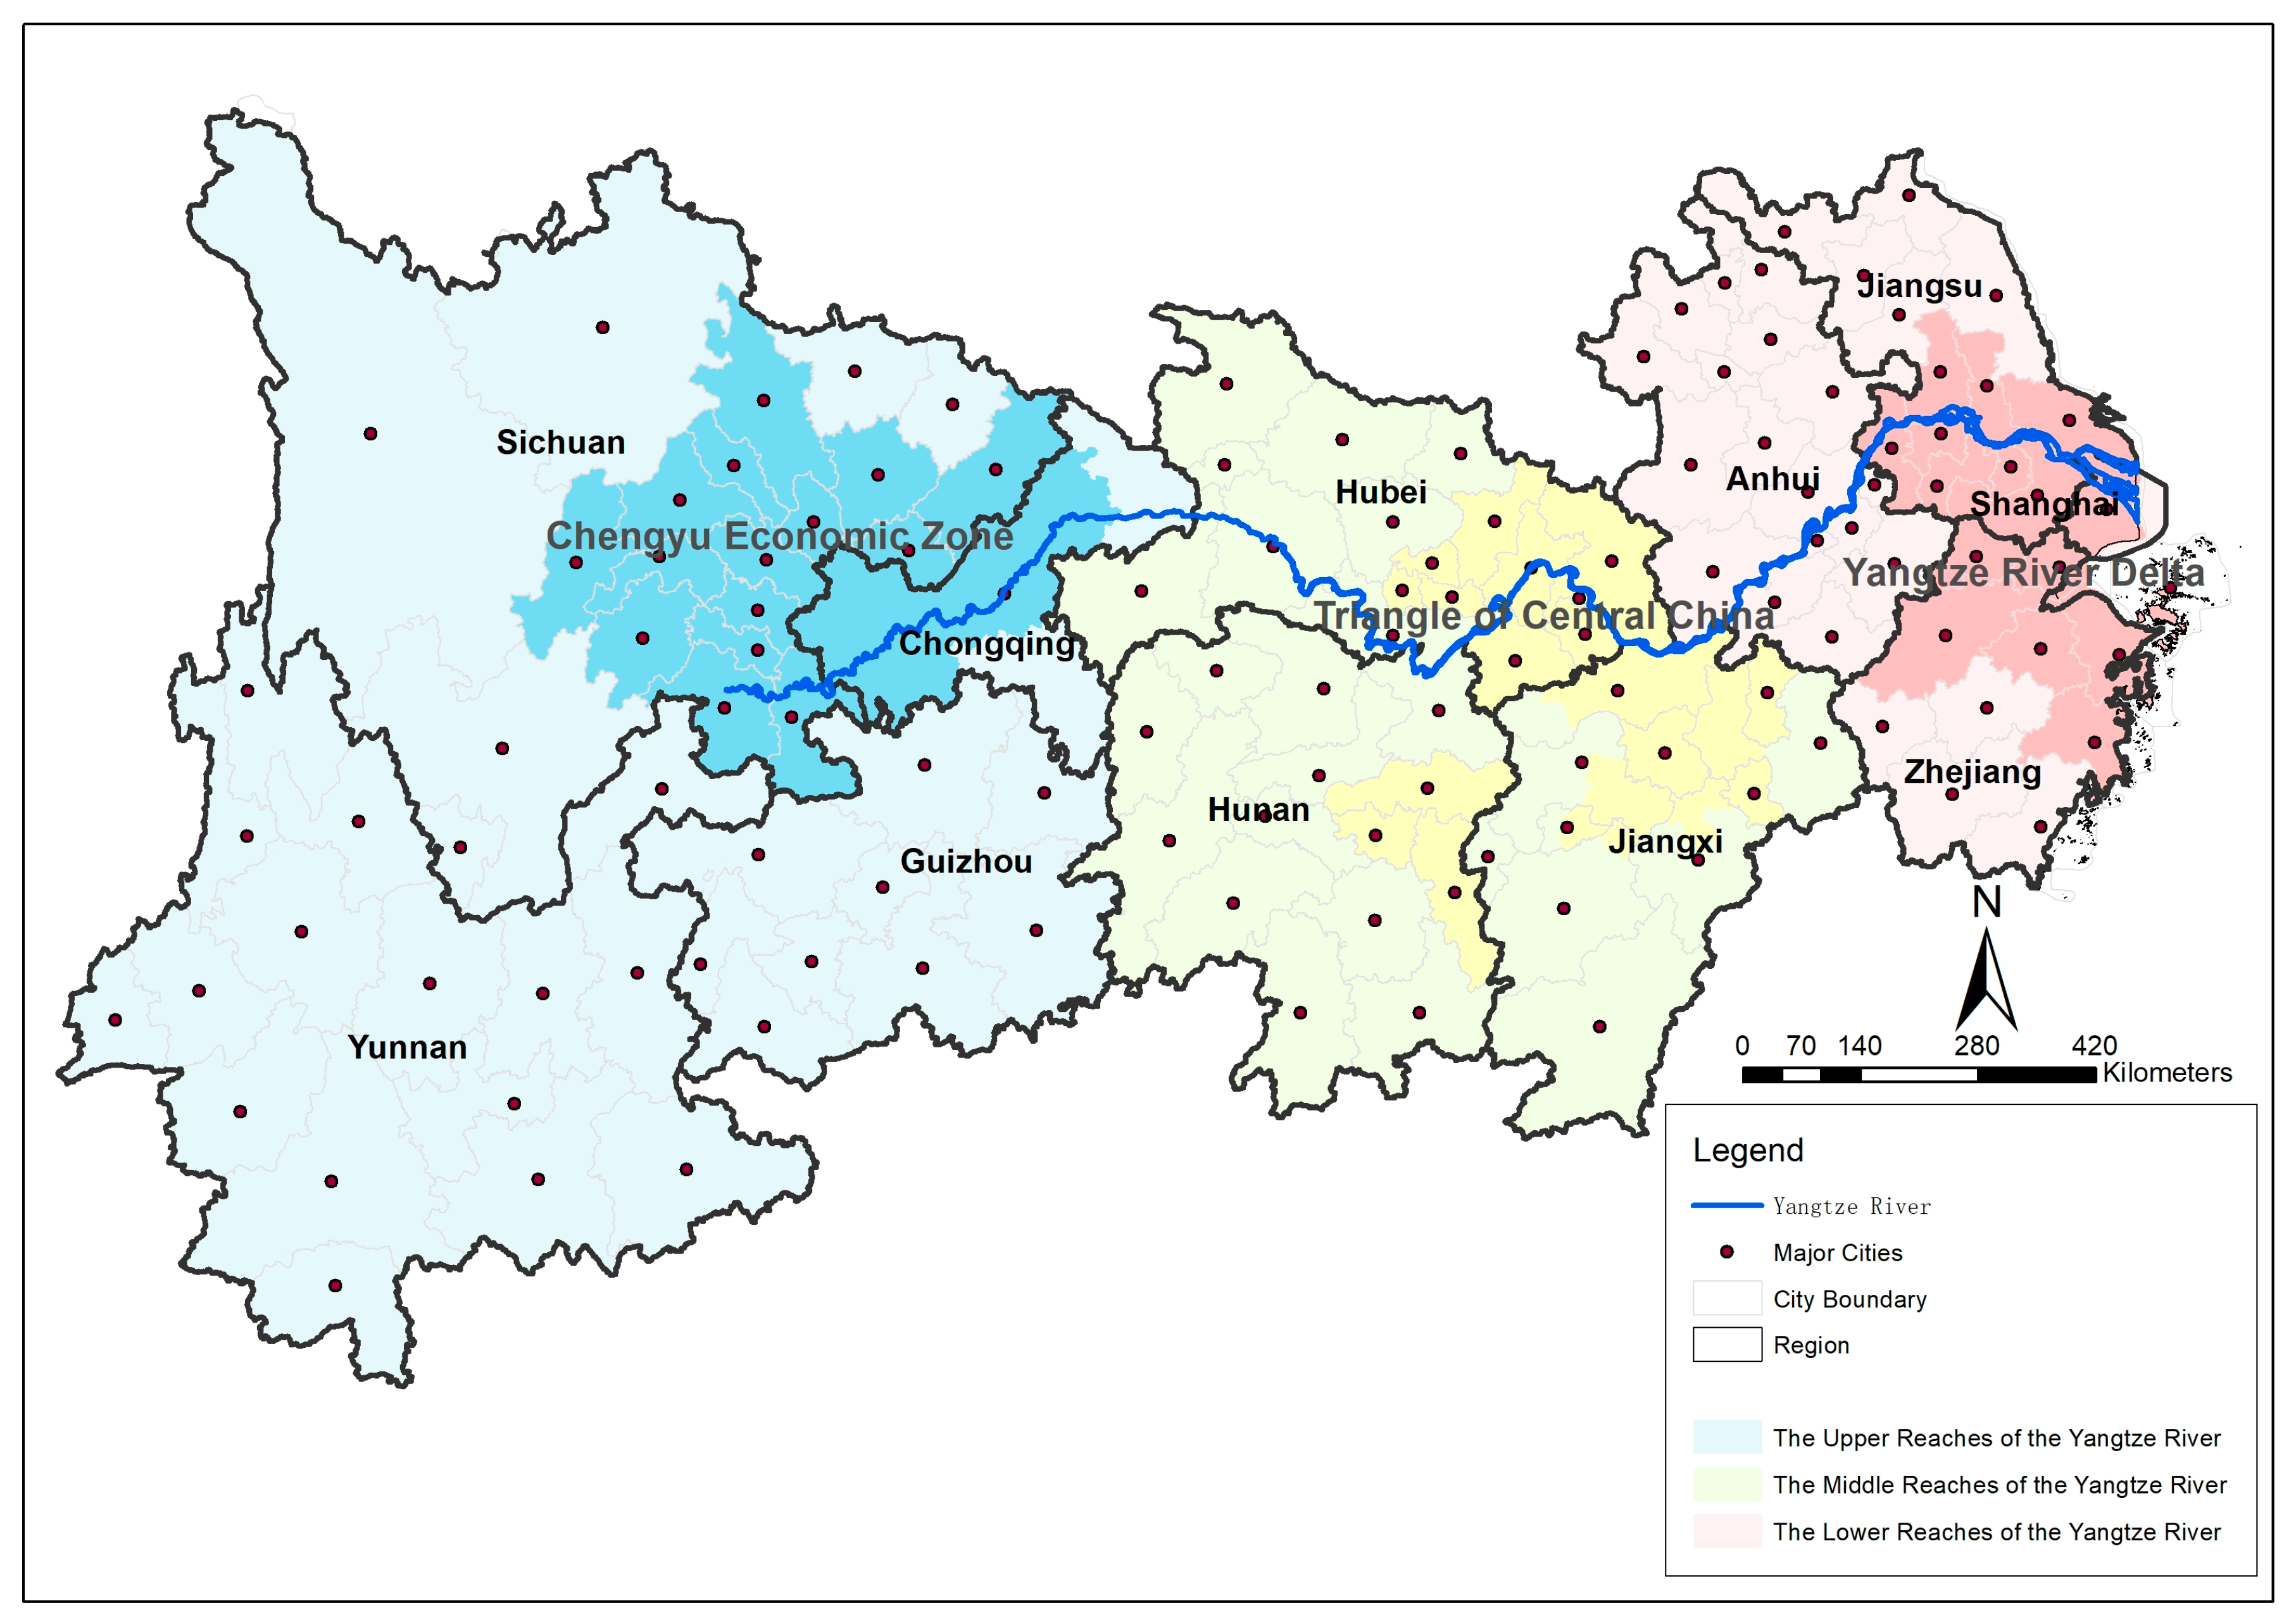
The Yangtze River is the largest river in China, and the third longest river in the world. The total length of the main stream is 6300 km, and the drainage area is 1,800,000 square kilometers, which is about one-fifth of China’s total area. It traverses central China from west to east, and its strategic position is very important (Figure 1). The Yangtze River has a warm climate, plenty of rainfall, and a large number of tributary lakes. The YREB stretches across three regions—East, Central, and West China—and covers 11 cities and provinces including Shanghai, Jiangsu, Zhejiang, Anhui, Jiangxi, Hubei, Hunan, Chongqing, Sichuan, Yunnan, and Guizhou. The river covers an area of approximately 2.05 million square kilometers. The population and production values of the YREB exceed 40% of the country. The YREB provides important support for China’s steady economic growth. As a new round of reform and growth in China, it is an inland river economic belt with global influence, a coordinated development belt of interaction between East and West, and a comprehensive domestic and foreign open coastal belt along the coast of the river. It is also a leading demonstration belt for the construction of ecological civilization. As early as the 1980s, the Central Government proposed the “one line and one axis” strategic concept. “Building Golden Waterways and Building the Yangtze River Economic Belt” was first proposed in a government report in 2014. The “Yangtze River Economic Zone Development Plan Outline” was introduced in 2016. The strategic position of the YREB is very important. It has established a new pattern of development for the “One Axis, Two Wings, Three Poles, and Many Points” of the YREB. The “One Axis” is based on the golden waterway of the Yangtze River, and plays a central role in Shanghai, Wuhan, and Chongqing. The “Two Wings” refer to the Shanghai–Rui and Shanghai Hutong Expressways. The “Three Poles” refers to the Yangtze River Delta and the middle reaches of the Yangtze River, Chengdu Economic Zone. “Multiple Points” refers to the supportive role of the cities other than the three urban agglomerations.
2.2. Data Sources
The DMSP/OLS (Version 4) nighttime light image dataset was published by the National Geophysical Data Center (NGDC) of the National Oceanic and Atmospheric Administration (NOAA). The major sources of the data include six DMSP satellites: F10 (1992–1994), F12 (1994–1999), F14 (1997–2003), F15 (2000–2007), F16 (2004–2009), and F18 (2010–2012). All of the images can be downloaded from the NGDC website (http://ngdc.noaa.gov/eog/dmsp). The DMSP/OLS (Version 4) non-radioactive calibration nighttime light image of each period includes three annual average images: a no-cloud observation frequency image, an average light image, and a stable light image. The nighttime stable light data (NSL) include lights from cities, towns, and other sites with persistent light, and exclude ephemeral events, such as fishing boats and fires. Usually, NSL data are used for studying urbanization and the scope of human activities. The nighttime light dataset is cloud-free, further away from flares, auroras, and other accidental events that impact the image, and finally only night light from urban, rural or other stable sources are retained by the average nighttime light images [30,31,32]. Pixel values of the image data range from 0 to 63, where 0 represents a dark background. Multi-temporal urban land products and reference datasets from 1990 to 2010 (http://www.geosimulation.cn/GlobalUrbanLand.html) are derived from Landsat images pertaining to the 1990–2010 period with a five-year interval. This mapping results provide much more detailed information, while also yielding a significantly improved accuracy, as indicated by the Kappa values, which are 0.4280–0.4953 at the global level, and ~0.3306 (in China) at the country level [25].
Other auxiliary data mainly contain the administrative boundaries at the national, provincial, city, and county levels, and were provided by the NGCC (National Geomatics Center of China) with a scale of 1:4,000,000, statistical data of major cities in the YREB were provided by the statistical database of China’s economic and social development (http://tongji.cnki.net/), land-use/land-cover data of the YREB (Geographical Information Monitoring Cloud Platform, http://www.dsac.cn/; National Geomatics Center of China, http://www.globallandcover.com), and the planning area of the YREB (Yangtze River Delta Science Data Center, http://nnu.geodata.cn:8008/).
3. Methodology
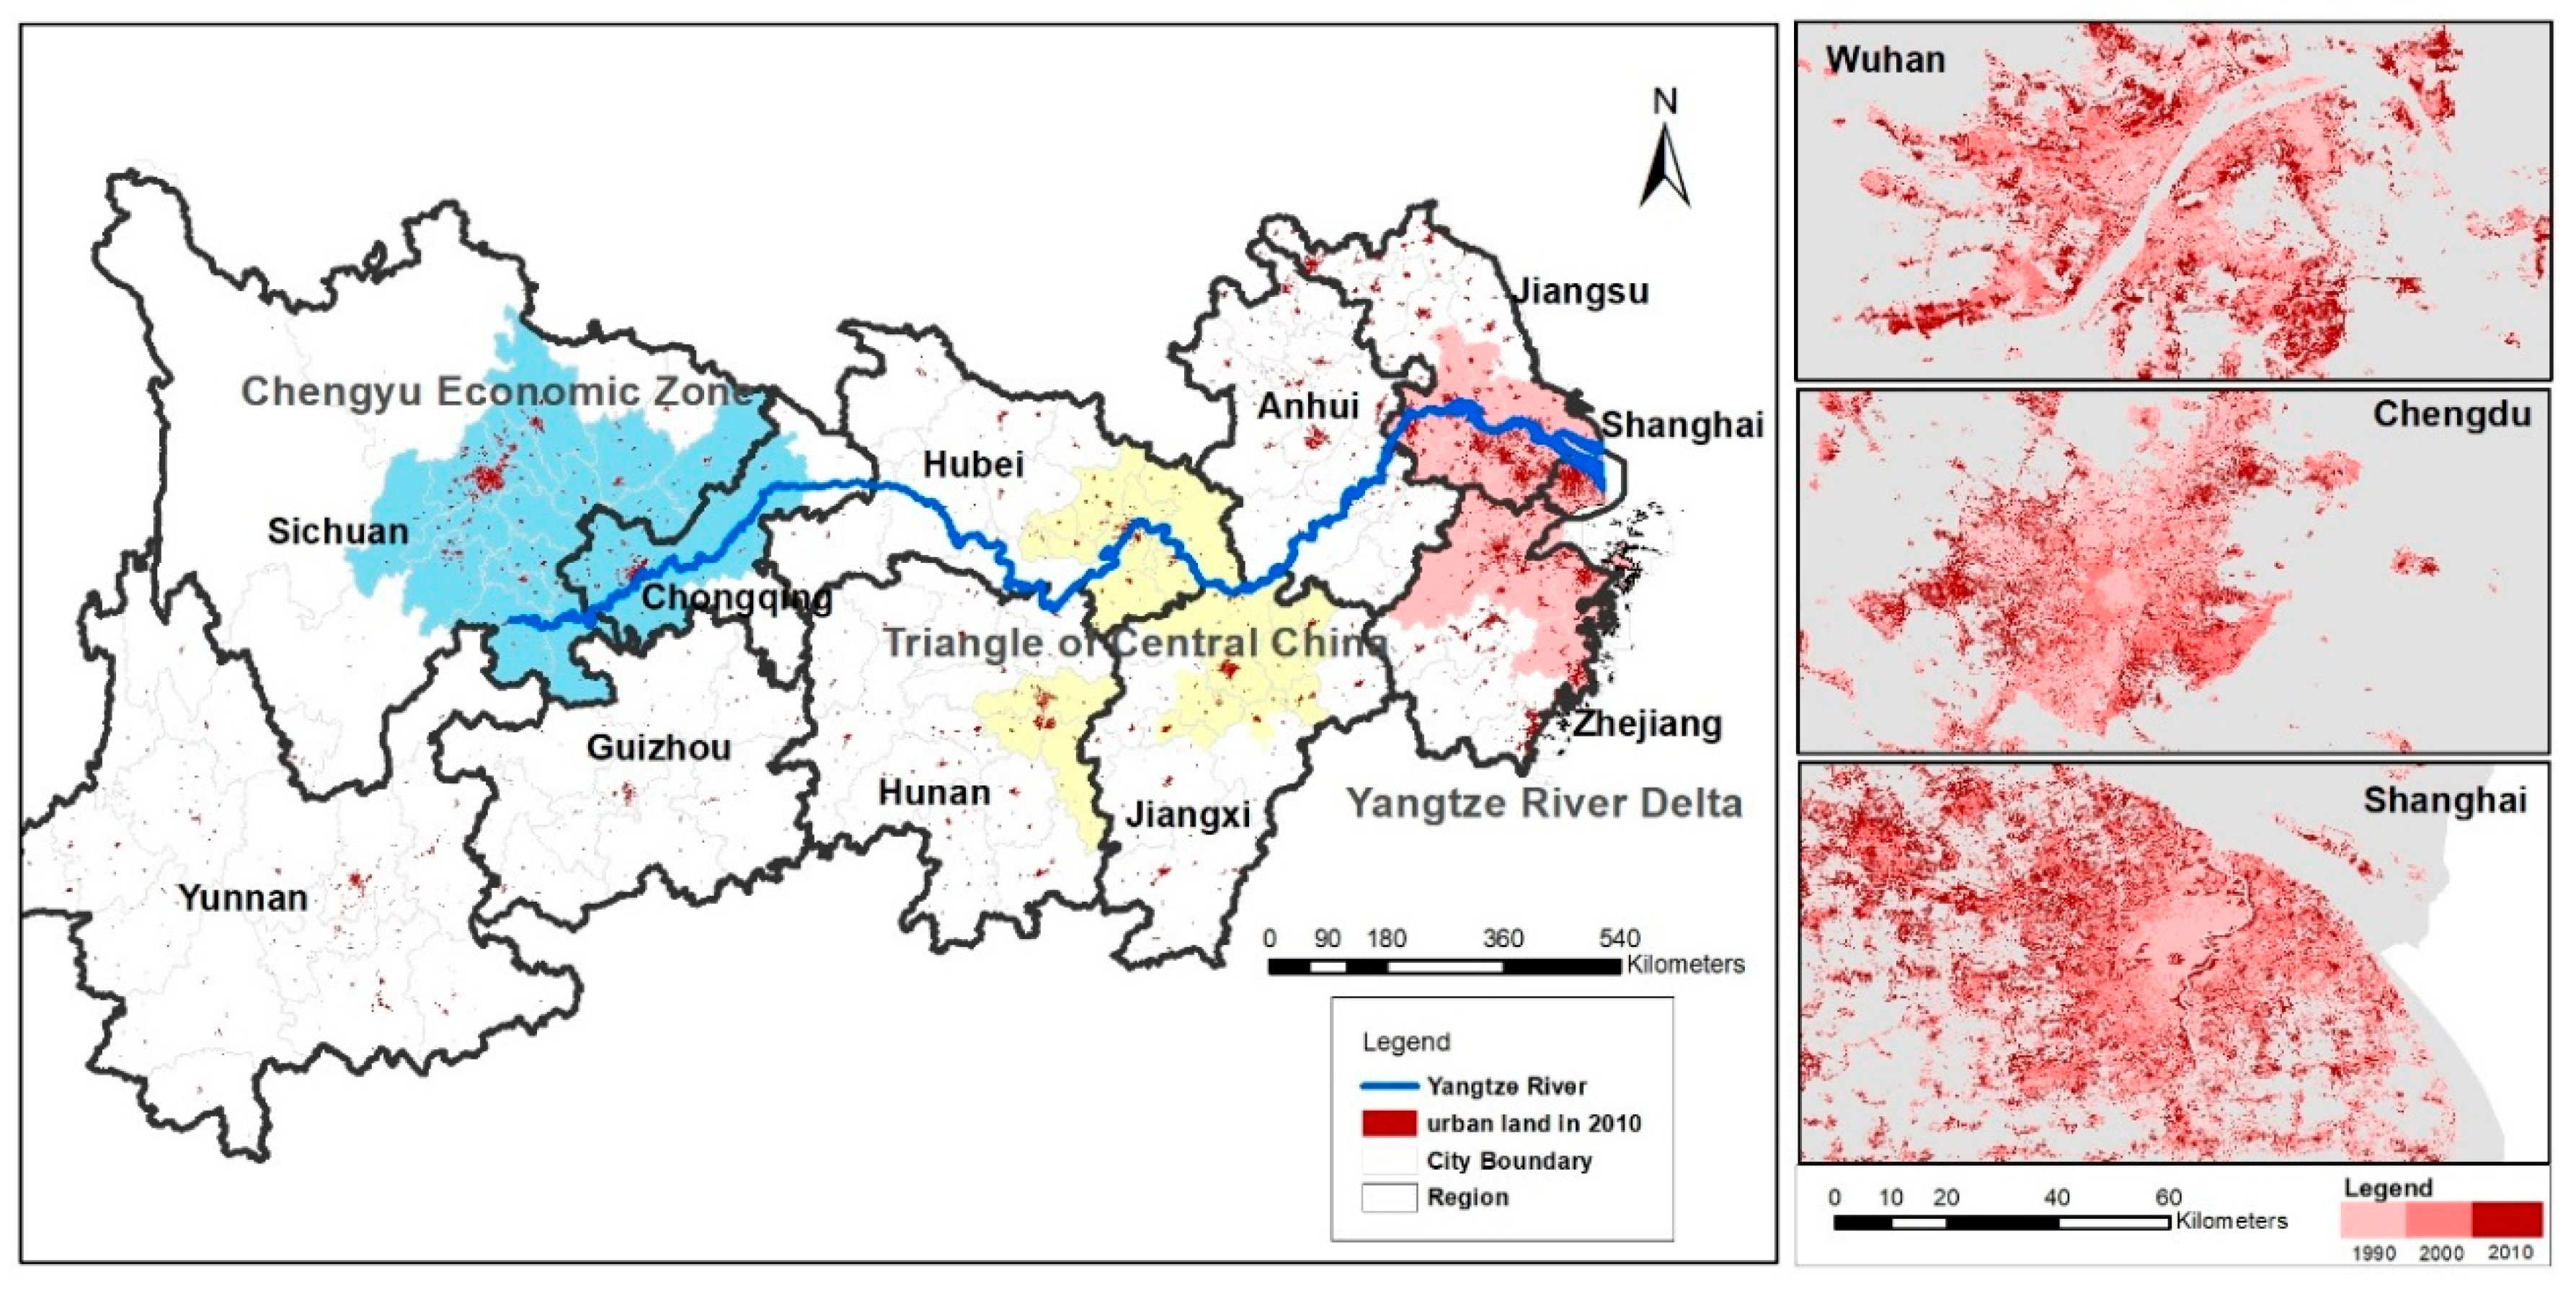
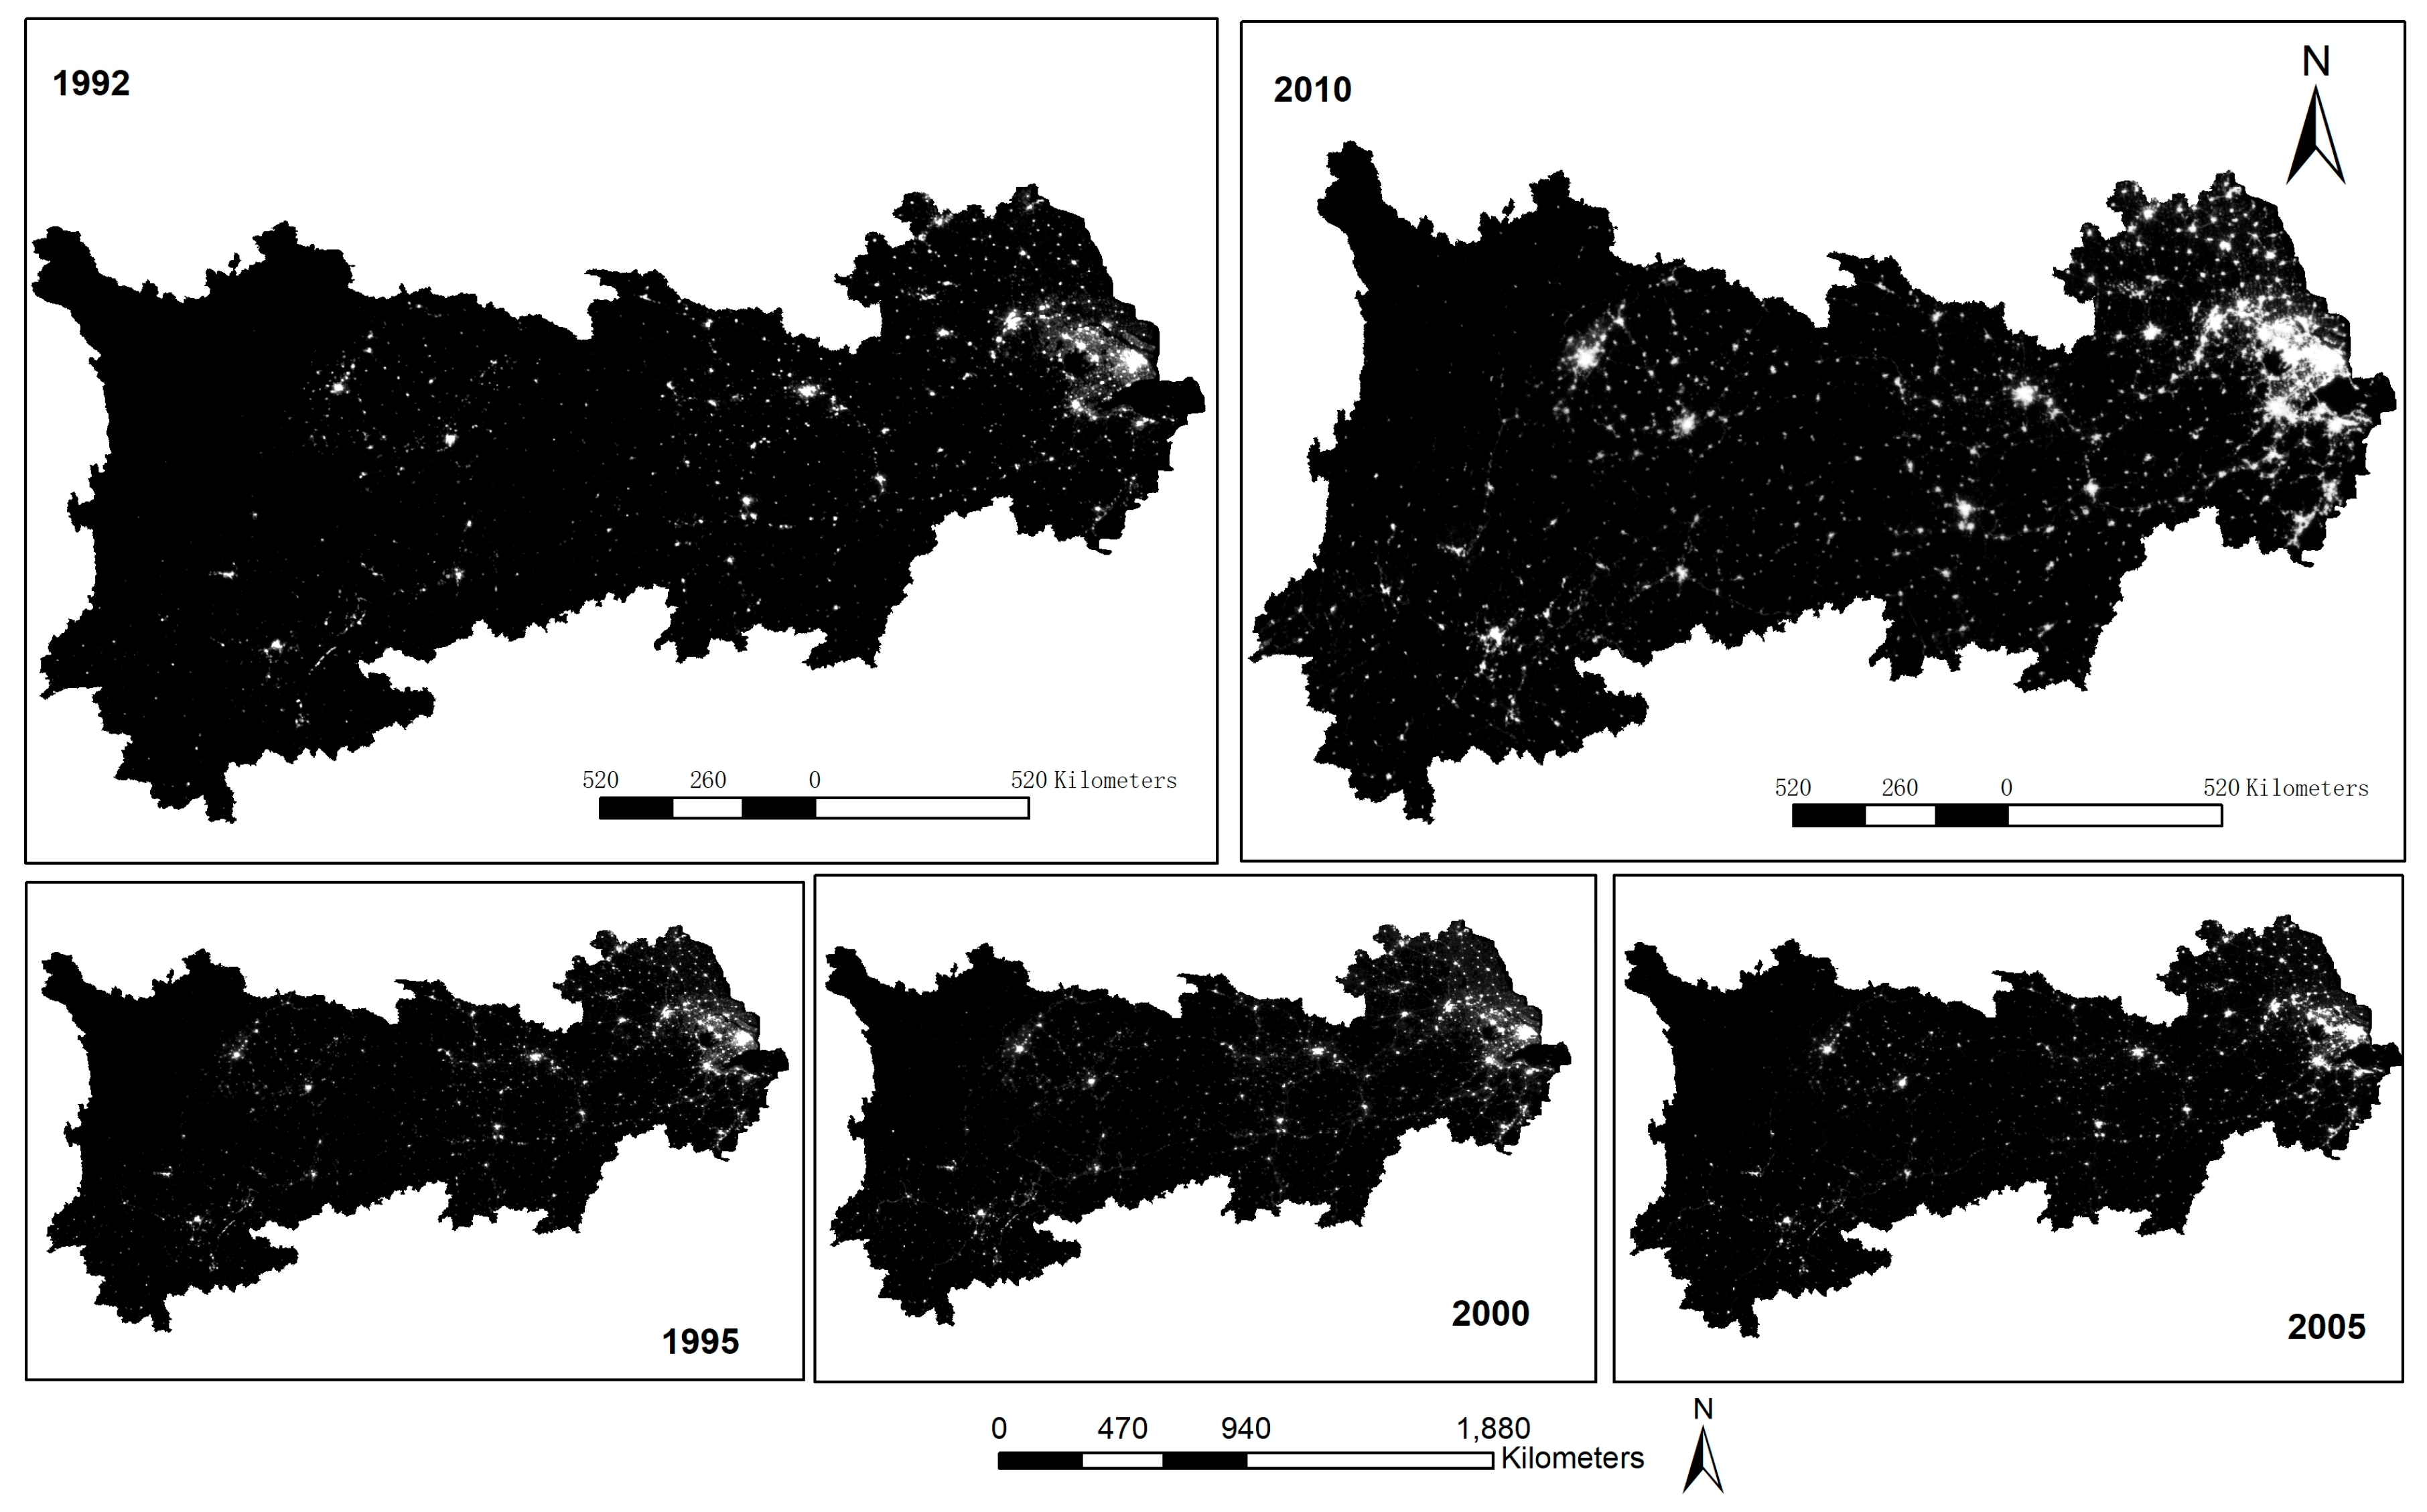
Although the data of multi-temporal urban land products have good accuracy in the world, data in the YREB need further correction. Consider national land-use data products (1990–2010) and GlobeLand30 (2010) as a reference, multi-temporal urban land products were checked by visual interpretation technology and clipped using the vectorized boundaries of the YREB. Thus, urban land dataset distribution images of the YREB from 1990 to 2010 were obtained (Figure 2). Furthermore, DMSP/OLS NSL data from 1992 to 2010 were used to obtain the total amount of urban light and reflect the range of urban human activities. Due to problems such as the supersaturation of nighttime light data, this study performed supersaturated correction, multi-sensor correction, and time continuity correction on the NSL data from 1992 to 2010 (Figure 3).
3.1. Urban Size Distribution Model
The regional spatial structure of the YREB was formed and evolved over the course of long-term economic activities. Taking into account factors such as natural geography, cultural context, the overall function of the economic zone, and the integrity of the administrative area, it is an economic zone form based on the basin, with the Yangtze River as a link and the urban economic zone as the basic unit. To examine and analyze the spatial structure evolution of the YREB, we analyzed the upstream area, midstream area, and downstream areas separately. Many studies have shown that nighttime light data, as a measure of regional economic development, can better reflect the long-term trend of economic development in cities along the YREB. We introduced the scale of urban land and the total amount of urban nighttime light as indicators, which reflect the status of urban social and economic development, so as to further combine social and political factors to analyze [23]. Since China has a large floating population all year round, using the urban statistical population to measure the size of the urban has certain inaccuracy. Therefore, we use the urban land area to represent the urban size, and at the same time, the total amount of nighttime lights in the urban is used as a measure of urban size.
For the relationship between the size of a city and the order in which the city is ranked by population against all of the other cities in the study area, the American sociologist Zipf proposed the rank-size rule. At the same time, Small [33,34] pointed out that nightlight remote sensing images can provide a globally uniform brightness threshold to verify Zipf’s rule, and they can be used to analyze the urban size distribution in the YREB by total nighttime light and rank of the city. The NSL data and urban land data in the YREB were used to extract the urban size distribution by the rank-size rule method. From the perspective of the relationship between the size of urban land and rank, the degree of distribution of land size distribution among the three major urban agglomerations in the YREB was compared [35,36,37].
The rank-size rule is a mathematical model that is used to describe the relationship between urban rank and size distribution, which can be defined as follows:
It is a special case when, in the Zipf’s law model, q = 1. Take the logarithmic change of Equation (1):
where is the urban land size of the th area. is the urban land size of the largest city. is the rank of the th urban land size. q is the Zipf index, which is a key parameter used to characterize the relationship between the size and the rank of the city. is the urban land size of the first city. When the value of is close to 1, it means that the size of the urban land is close to the ideal state. The size of urban land use is of the first type when |q| is greater than 1, the size of urban land is relatively concentrated, and large cities develop better than medium and small cities. When |q| is less than 1, the size of urban land is of a secondary type, and the size of urban land is relatively scattered, and medium and small cities are relatively developed. For long-term sequential dynamic analysis of the study area, if |q| increases, it indicates that the strength of the urban land-scale distribution tends to be more concentrated than that of dispersed power. Conversely, if |q| decreases, it indicates that the dispersive power of urban land-scale is greater than the power of concentration.
The development of the city is affected by many known and unknown factors. However, the city is a growing organic organization. Under normal circumstances, self-similarity will occur in urban and rural settlement systems, which is a manifestation of system health and optimization [38]. The balance of urban development can be used to indicate the health and optimization of an urban system. Fractal research is the frontier of contemporary theoretical geography [39]. Studies show that because of the size-free structure of urban systems, it has fractal features [40]. The constant coefficient D of the Pareto formula is regarded as a fractal dimension. There are already relevant explanations and derivation procedures for this [41,42].
where R2 is the judgment coefficient and q is the Zipf index. Fractal dimensions of urban size distribution (D) changes can reflect the degree of equilibrium in the urban system. The greater the equilibrium index, the closer the size between cities, the more balanced the city, and the lower the urban primacy index. In contrast, the more unbalanced the size of the city, the higher the urban primacy index.
D*q = R2 (R2: Judgment coefficient)
3.2. Urban Size Difference Analysis Model
Although the index of the urban rank-size rule can reflect the trend of urban-size distribution, it emphasizes the relationship between the size and its corresponding rank. The Gini coefficient can reflect the degree of distribution of the size of a country or region and focus on the gap between the sizes of regional cities. The Gini coefficient was defined by the American economist Albert Hirschmann in 1943 and is an indicator to measure the fairness of income distribution defined by the Lawrence curve. Professor J.U. Marshall of York University in Canada used the Gini coefficient to study the growth and development of cities of different sizes. Therefore, the Gini coefficient has become one of the commonly used indicators that reflect the degree of urban-scale distribution in urban system research.
The Gini coefficient was used to compare and analyze the extent of urban land distribution within the three major urban agglomerations in the YREB, and it compensated for the weakness of a lack of return fitting when there were larger gaps in the regional cities [43,44]. The size of the city is mainly measured by the size of the urban land, population, etc. Due to the difficulty in obtaining data, many research studies on the distribution of urban size are based on the size of the urban population. This paper will use urban land and NSL data to calculate and analyze the urban size development and evolution of the YREB from 1990 to 2010.
Taking urban land data as an example, assume that the study area consists of n cities, S is the sum of the urban land sizes of the n cities, and T is the sum of the absolute value of the difference between the urban land sizes of each city in the study area. The Gini coefficient (G) of the urban size distribution is defined as:
where the Gini coefficient ranges from 0 to 1. When G is closer to 0, the more dispersed the distribution of urban land between cities, and the smaller the difference in the size of urban land. When G is closer to 1, the more concentrated the distribution of urban land between cities, and the greater the difference in the size of urban land. In general, the urban geography field believes that when the urban Gini coefficient is above 0.6, the urban size distribution is extremely unbalanced [37]. NSL data also reflect urban size and economic development, so this model is commonly used.
G = T/2S (n − 1)
4. Results
4.1. The Spatiotemporal Change Characteristics of Urban Land in the YREB
The Yangtze River Economic Belt includes features in three large areas of China, including the concept of natural geography of the Yangtze River upstream, midstream, and downstream areas. It also contains the economic significance of the Yangtze River Delta urban agglomeration, the Chengdu Chongqing urban agglomeration, and the triangle of central China. In this study, the YREB was divided into the Yangtze River upstream, midstream, and downstream areas (a total of 130 provinces and cities) to analyze the characteristic urban space development patterns during the past 20 years. Urban land data and NSL data were used to analyze the characteristics and trends of urban change in the YREB.
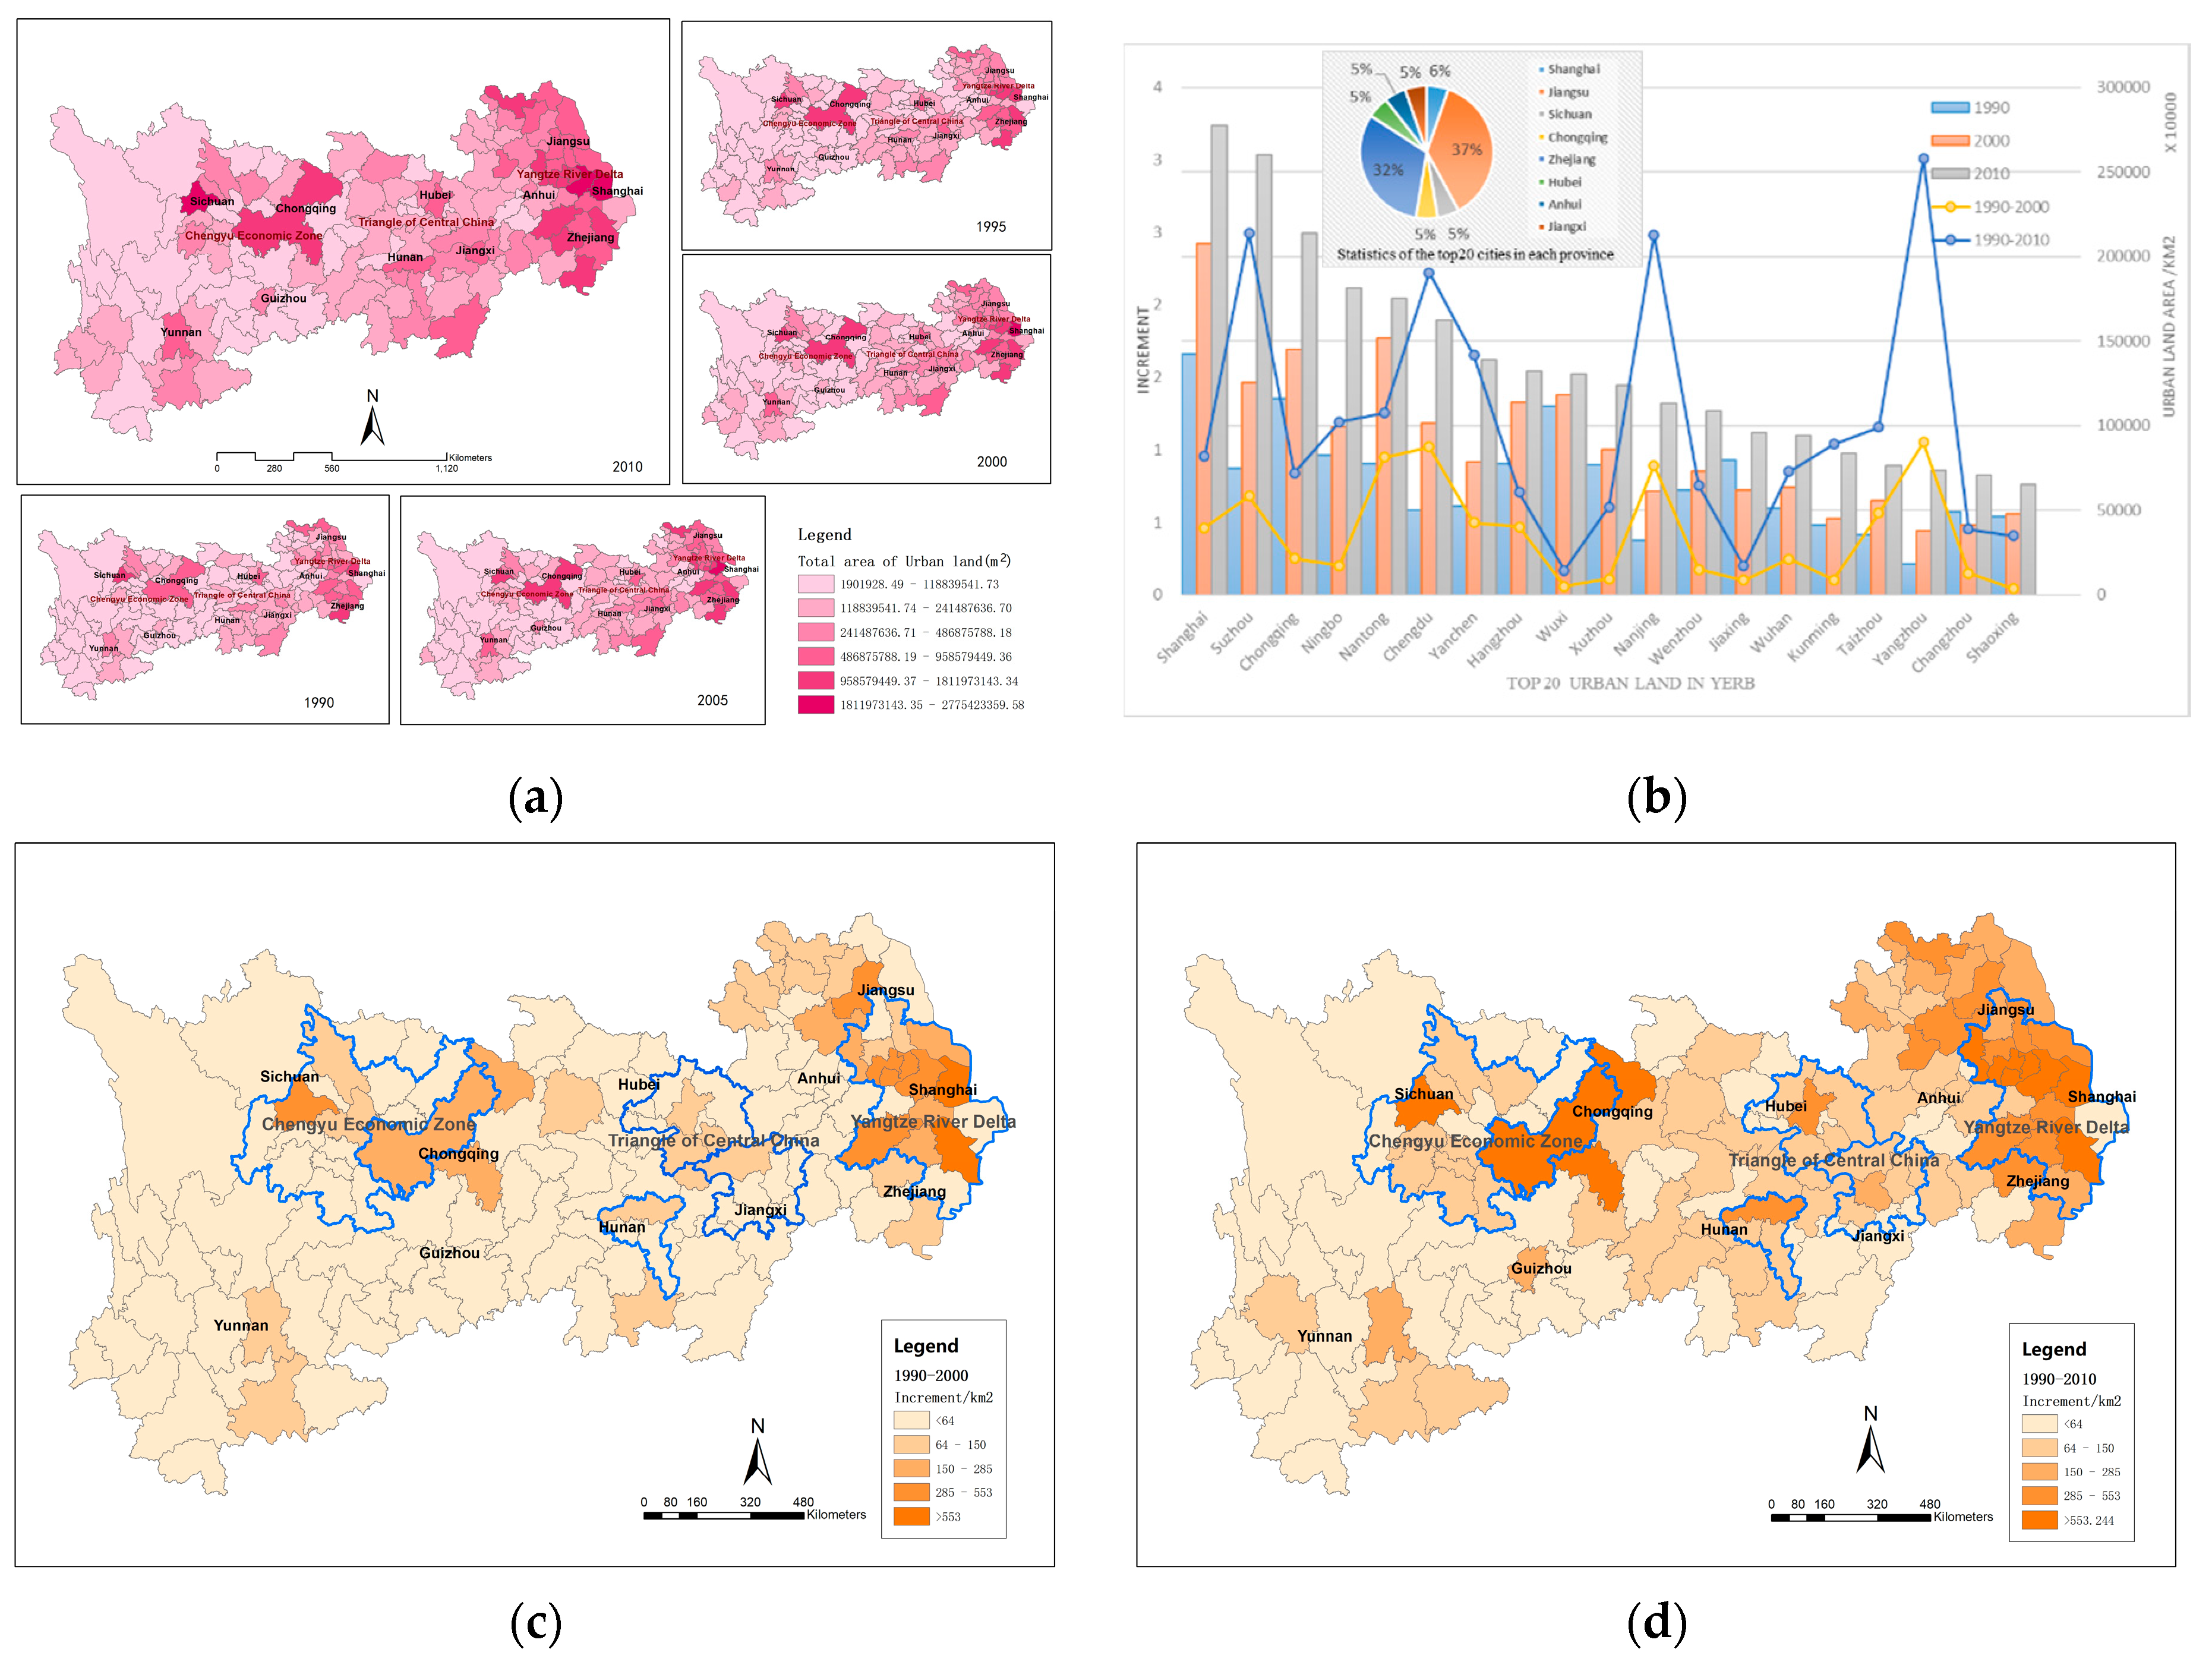
In this paper, we used the modified multi-temporal urban land data (1990, 1995, 2000, 2005, and 2010) and the administrative boundary data of the 1:400 million basic geographic data in the YREB to obtain urban land statistics for 130 cities in the study area. As a result, the spatial distribution, area, increment, and other statistical information of different urban lands for five years were also collected. From the spatial distribution data of urban land data in the YREB from 1990 to 2010 (Figure 4a), the spatial distribution of urban space generally presented a trend of dense cities in the east, and less urban land in the central and western cities. The entire YREB includes cities at different stages of development and different sizes. The location conditions and development basis of each city are different, and the speed of its size changes with time.
From 1990 to 2010, Chongqing, Chengdu, Shanghai, Ningbo, Suzhou, and Wuxi were the cities with the largest increases in urban land from 1990 to 2010. Cities with large increases in urban land were mainly located north of Zhejiang Province and south of Jiangsu Province in the Yangtze River Delta; Chengdu and Chongqing in the upper reaches also had greater growth. Figure 4b shows the top 20 cities with the largest urban land area. It can be seen that the growth of urban land showed a trend of consistent and balanced growth from 1990 to 2000; however, the growth of urban land had a significant increase in the cities of Nantong, Changzhou, and other cities in the downstream regions from 1990 to 2010. It can be seen from the statistical results about urban land growth in the top 20 cities, the Yangtze River Delta urban agglomerations account for the majority, and the other cities belong to the middle reaches of the Yangtze River and Chengdu–Chongqing urban agglomerations. It highlights the urban agglomeration as a regional unit that leads the YREB to participate in global competition and the “Belt and Road” construction. It will become the strategic core area for the economic growth of the YREB and the region with the most potential and vitality for future growth. In contrast, in cities in the upstream and middle reaches of the Yangtze River Delta, the increase in urban land was small, and the increase was generally lower than 64 km2 (Figure 4c,d). In the middle reaches of the Yangtze River, the overall size of urban land was significantly smaller than that of the downstream areas. In the last 20 years, driven by the core cities of Wuhan, Changsha, and Nanchang in the middle reaches of the urban agglomerations, other cities were slowly increasing in urban land. Most cities reached an increase of more than 64 km2. In the upper reaches of the Yangtze River, the growth trend of the city size was less obvious. The size of urban land was increasingly larger and concentrated in the Chengdu–Chongqing urban agglomerations dominated by Chengdu City and Chongqing City. Compared with cities in the Yangtze River Delta, the size and growth of urban land in the surrounding cities of the upper reaches of the Yangtze River still lagged far behind. The urban agglomeration is the key development zone and optimized development zone of the YREB. As an economically developed region of the YREB, the resource and environment carrying capacity is large, and the development intensity and future development potential are both high. In the past 20 years, consistent with the content of the National Main Functional Area Plan, the Yangtze River Delta urban agglomeration has been used as an optimized development zone. The urban land in Nantong, Changzhou, and Suzhou has maintained a leading position. The core of the Chengdu–Chongqing urban agglomeration city of Sichuan and Chongqing also has a higher growth rate, which is consistent with the national positioning of Chengdu–Chongqing urban agglomeration as a key development zone.
4.2. The Spatiotemporal Change Characteristics of Human Activity in the YREB
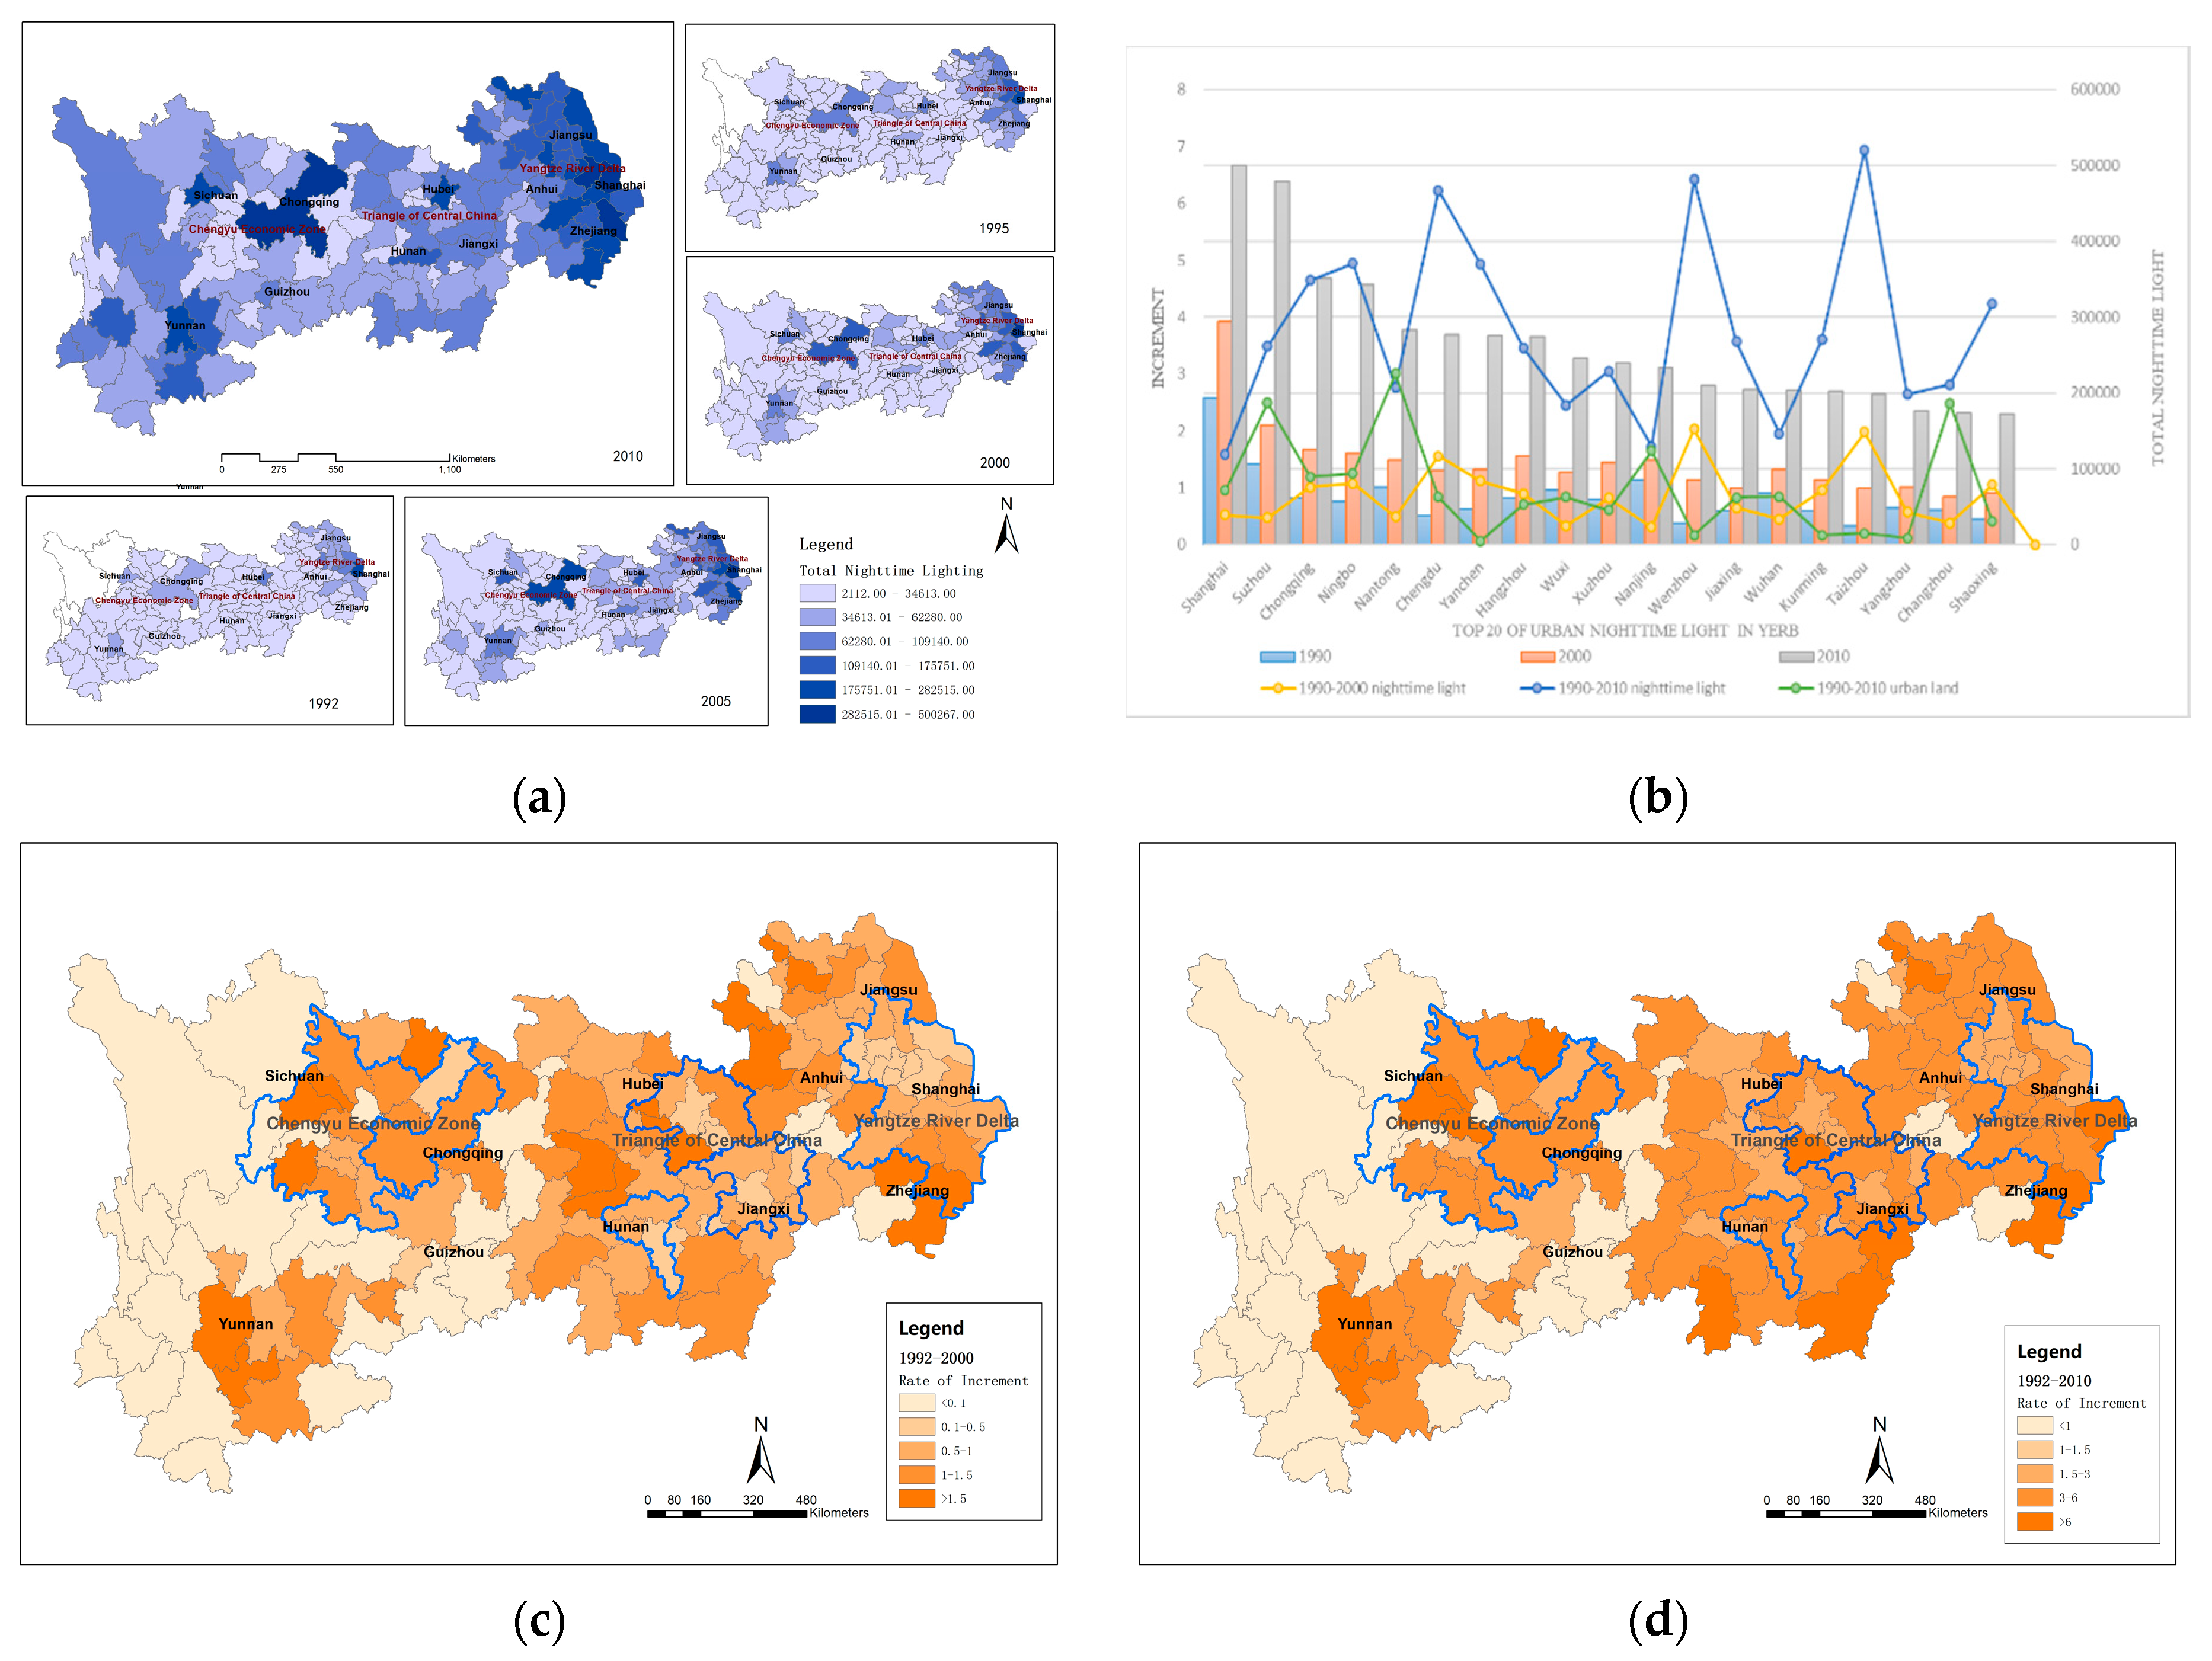
On the basis of the analysis of urban land, to further analyze the urban area evolution characteristics of the urban human activity range, this paper selected DMSP/OLS NSL data from 1992 to 2010 to explore the evolution of the human activity spatial pattern in the YREB. Using the administrative boundary data of the 1:400 million basic geographical data, we obtained the total nighttime light value of 130 cities. The statistics suggest that each city in the YREB has obvious spatial non-equilibrium characteristics. Overall, the nighttime light intensity of the YREB shows a significant upward trend. From 1992 to 2010, the urban spatial distribution of the YREB was generally represented by a special strip-shaped core–periphery structure with relatively dense eastern regions and relatively sparse middle and western regions. According to the unified hierarchical display from 1992 to 2010, the number of cities with high total light increased significantly (Figure 5a). In 1992, the higher nighttime light value areas were mainly concentrated in the downstream areas represented by Shanghai, Nanjing, etc. The total nighttime light of the cities in the upper reaches of the Yangtze River was relatively low other than Kunming, Chengdu, and Guiyang. In 2010, the nighttime light values of Shanghai and its surrounding cities in the Yangtze River Delta region increased significantly compared with that in 1992, showing a continuous pattern. The total amount of urban light in the middle reaches of the Yangtze River and the upper reaches of the Yangtze River has increased significantly since 2005. The total amount of nighttime light in the surrounding urban areas with Chongqing and Chengdu as the centers has increased to varying degrees.
The light density of the upper, middle, and lower reaches of the Yangtze River shows a significant difference. The light sizes for Jiangsu Province, Zhejiang Province, and Shanghai in the lower reaches of the Yangtze River; Jiangxi Province, Hunan Province, and Hubei Province in the middle reaches of the Yangtze River; and Chongqing and Chengdu in the upper reaches of the Yangtze River all have significant advantages regarding the size of their nighttime light. These data correspond to the Yangtze River Delta urban agglomeration centered on Shanghai–Nanjing–Hangzhou, the middle reaches of the Yangtze River centered on Wuhan–Changsha–Nanchang, the Chengdu–Chongqing city group cluster centered on Chongqing–Chengdu, and the center of the central Yunnan urban agglomeration, which is centered on Kunming. At the same time, four major cities, including Shanghai, Nanjing, Wuhan, and Chongqing along the Yangtze River formed a coastal urban belt along the mainstream of the Yangtze River, forming four urban dense areas and a major urban belt in the YREB.
Based on the total nighttime light of the cities in the YREB from 1992 to 2010, a statistical analysis of 10-year intervals and 20-year intervals was carried out (in this case, the first 110 cities in the total amount of nighttime light were analyzed because there were more cities at the end of the total number of nighttime lights in 2010, and there were few lights in the city in 1992; thus, its increment will affect the grading of other cities). Figure 5c,d show that after removing some cities with low early-light values, the growth rate of the lights basically represented the current urban agglomeration development pattern in the past 10 years, mainly in the Chengdu–Chongqing economic zone, the middle reaches of the Yangtze River, and the Yangtze River Delta urban agglomeration. The total growth rate of urban light around the core cities in the urban agglomeration was high. It also shows that, driven by the core cities of the middle and lower reaches of the urban agglomeration, the development trend of the secondary cities was more obvious, basically reaching a growth rate that was 1 to 1.5 times. From 1990 to 2010, the total nighttime lights growth of the cities in the YREB was greater, and most of them exceeded a one-fold increase. Cities in the urban clusters in the region showed a significant increase, outlining the planning scope of urban development for the three urban agglomerations in the region. Figure 5b shows the trend of nighttime light growth at 10-year and 20-year intervals. In comparison, the cities of Shanghai and south of Jiangsu had a larger size of total nighttime light in 1990, but the cities such as Chongqing and Wenzhou had a relatively low scale of total nighttime light. So, compared to Shanghai and south of Jiangsu, cities such as Chongqing and Wenzhou showed a large increase. Through comparative analysis, we can see that the core cities of the Chengdu–Chongqing urban agglomeration and other important cities of Yangtze River Delta urban agglomeration have obvious development under the promotion of the new round of planning [45,46]. Meanwhile, in the statistical analysis chart, we add the incremental curve of urban land use from 1990 to 2010 for comparative analysis. Compared between the increase in the amount of urban land used for green marking and the total amount of urban nighttime light in blue can be seen. The obvious difference is that the total amount of urban nighttime light in Chengdu, Ningbo, Wenzhou, and Shaoxing has increased significantly, but the growth of urban land is relatively small. These cities are economically developed areas of various provinces, with superior locations, rapid urban construction and development, and level of intensive use of urban land is high. The urban land in Nantong, Nanjing, Changzhou, and other cities is relatively large, and the increase in nighttime light is relatively small. According to relevant policies and regional geographical conditions. The problems of extensive land use in Nantong City, Changzhou City, and Nanjing City can be found, but the central urban areas of these places are developing rapidly, while the land-use efficiency of the districts and counties is too low, resulting in a low degree of overall land intensive.
4.3. Analysis Results of the Urban Rank-Size Rule in the YREB
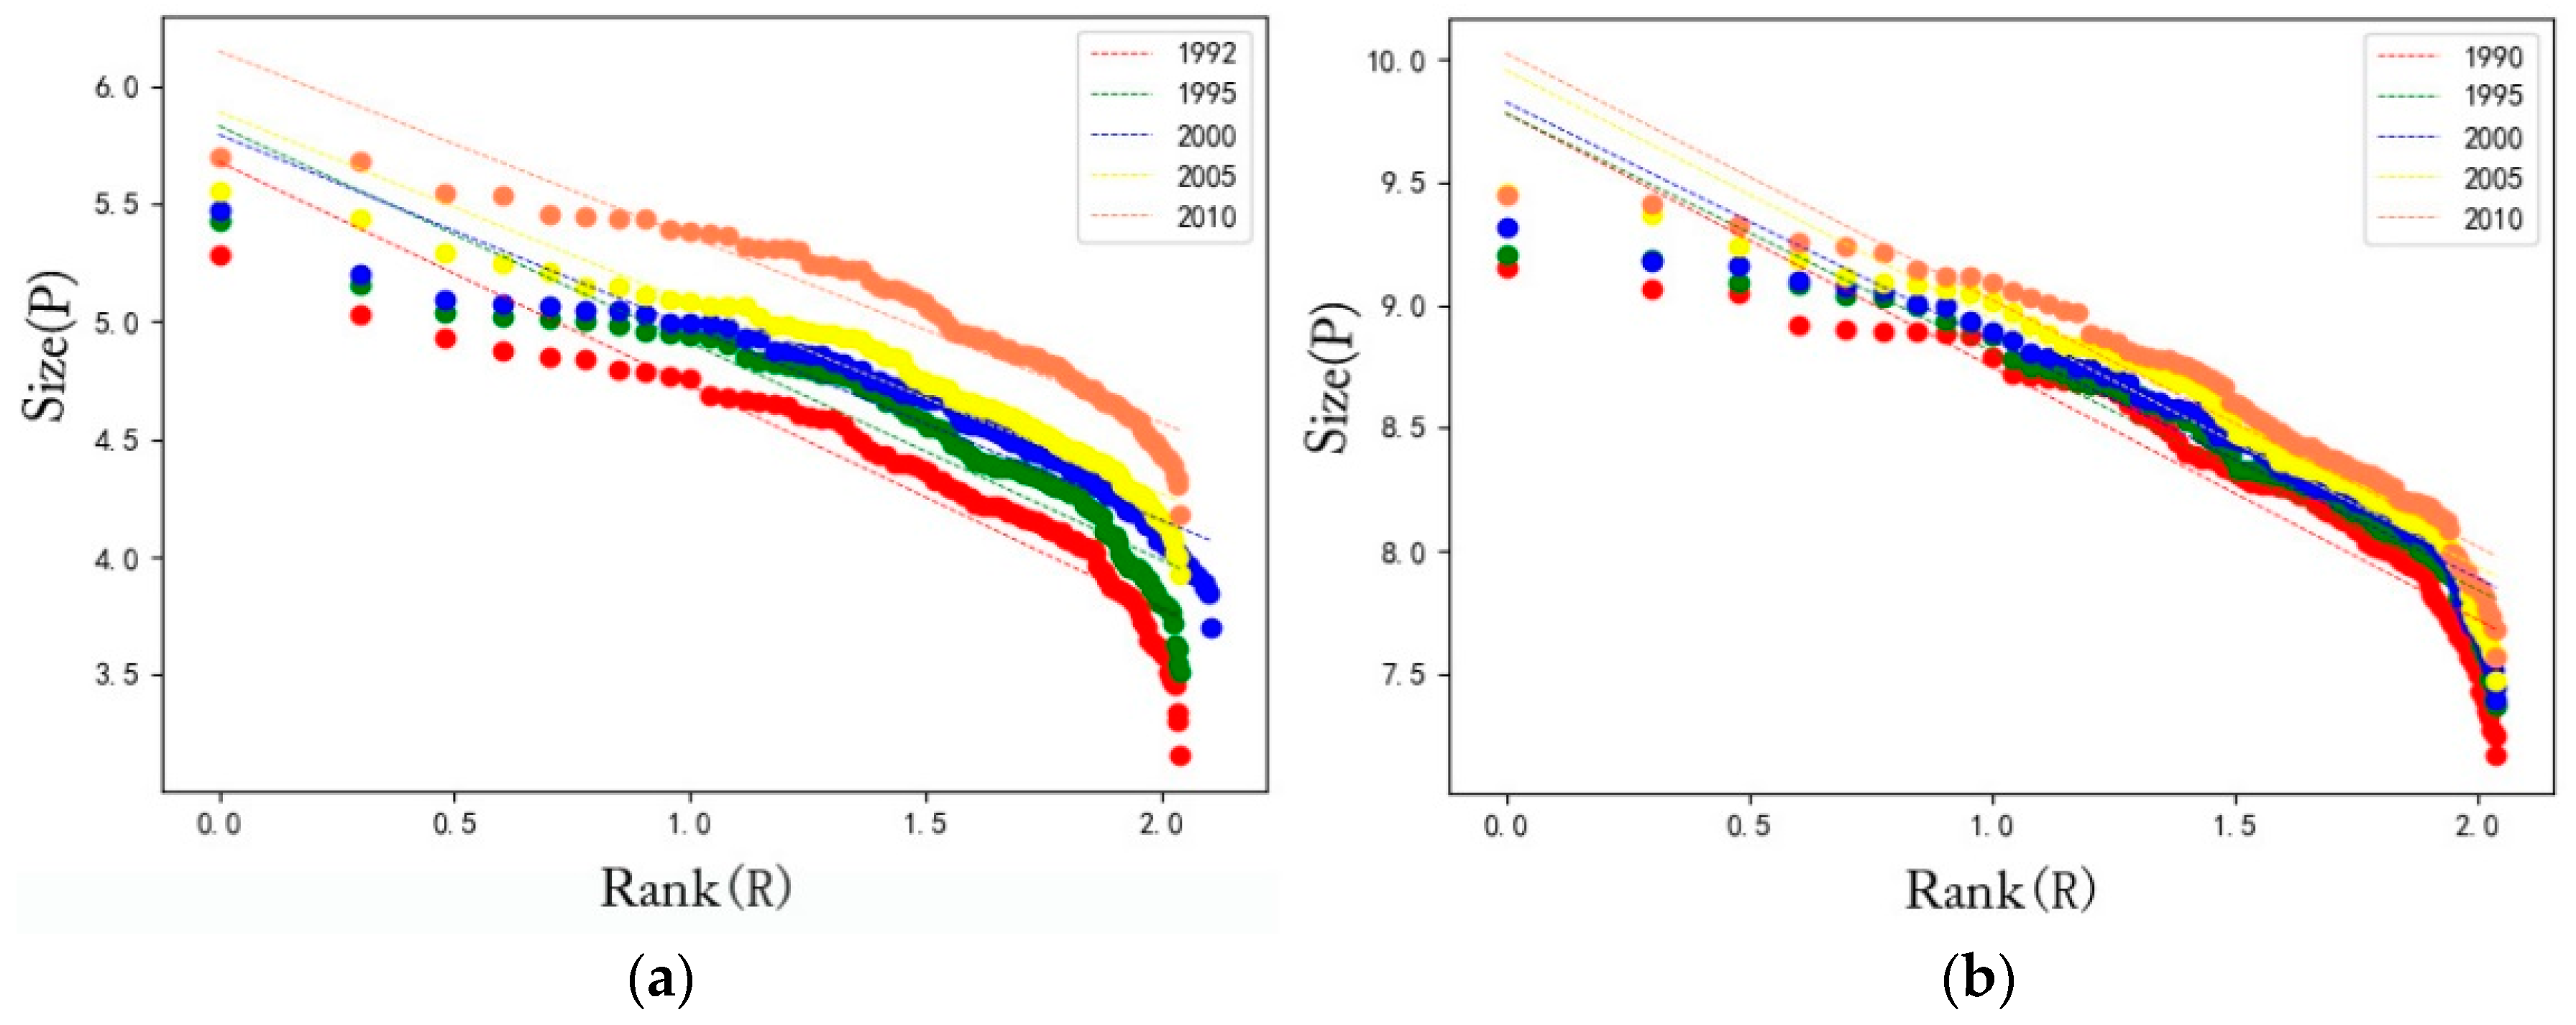
According to the urban rank-size rule, tail-tailing was performed on the lower tail of the reliability distribution [34,35]. Finally, the urban size analysis of the city’s nighttime light size was performed for the first 110 cities. Equation (2) can be used to estimate the fixed intercept; the intercept is not fixed in two forms, and the intercept fixed model is the actual first city population size as P1, i.e., a = lnP1 is known. The model starts with the overall urban system and uses the order-scale model to obtain the theoretical first city size while the intercept is not fixed. The estimation found that for the urban system of the YREB, the intercepted unfixed model had a better fitting effect. The urban land data and its order are fitted by regression, the total nighttime light and its order are also fitted by regression. Both the F statistic of the equation and the t statistic of the variable pass the saliency test with a level of 5%. Table 1 only gives model estimation results with an inaccurate intercept model [47]. Figure 6 shows the rank-size curves of the urban land size/total nighttime light in the study area in 1990, 2000, and 2010. The results show that the coefficients of the fitting of each regional model are above 0.9. The goodness of model fitting is good; it can indicate the urban rank-size rule and better describe the analysis of urban land-use size and nighttime light size in the study area.
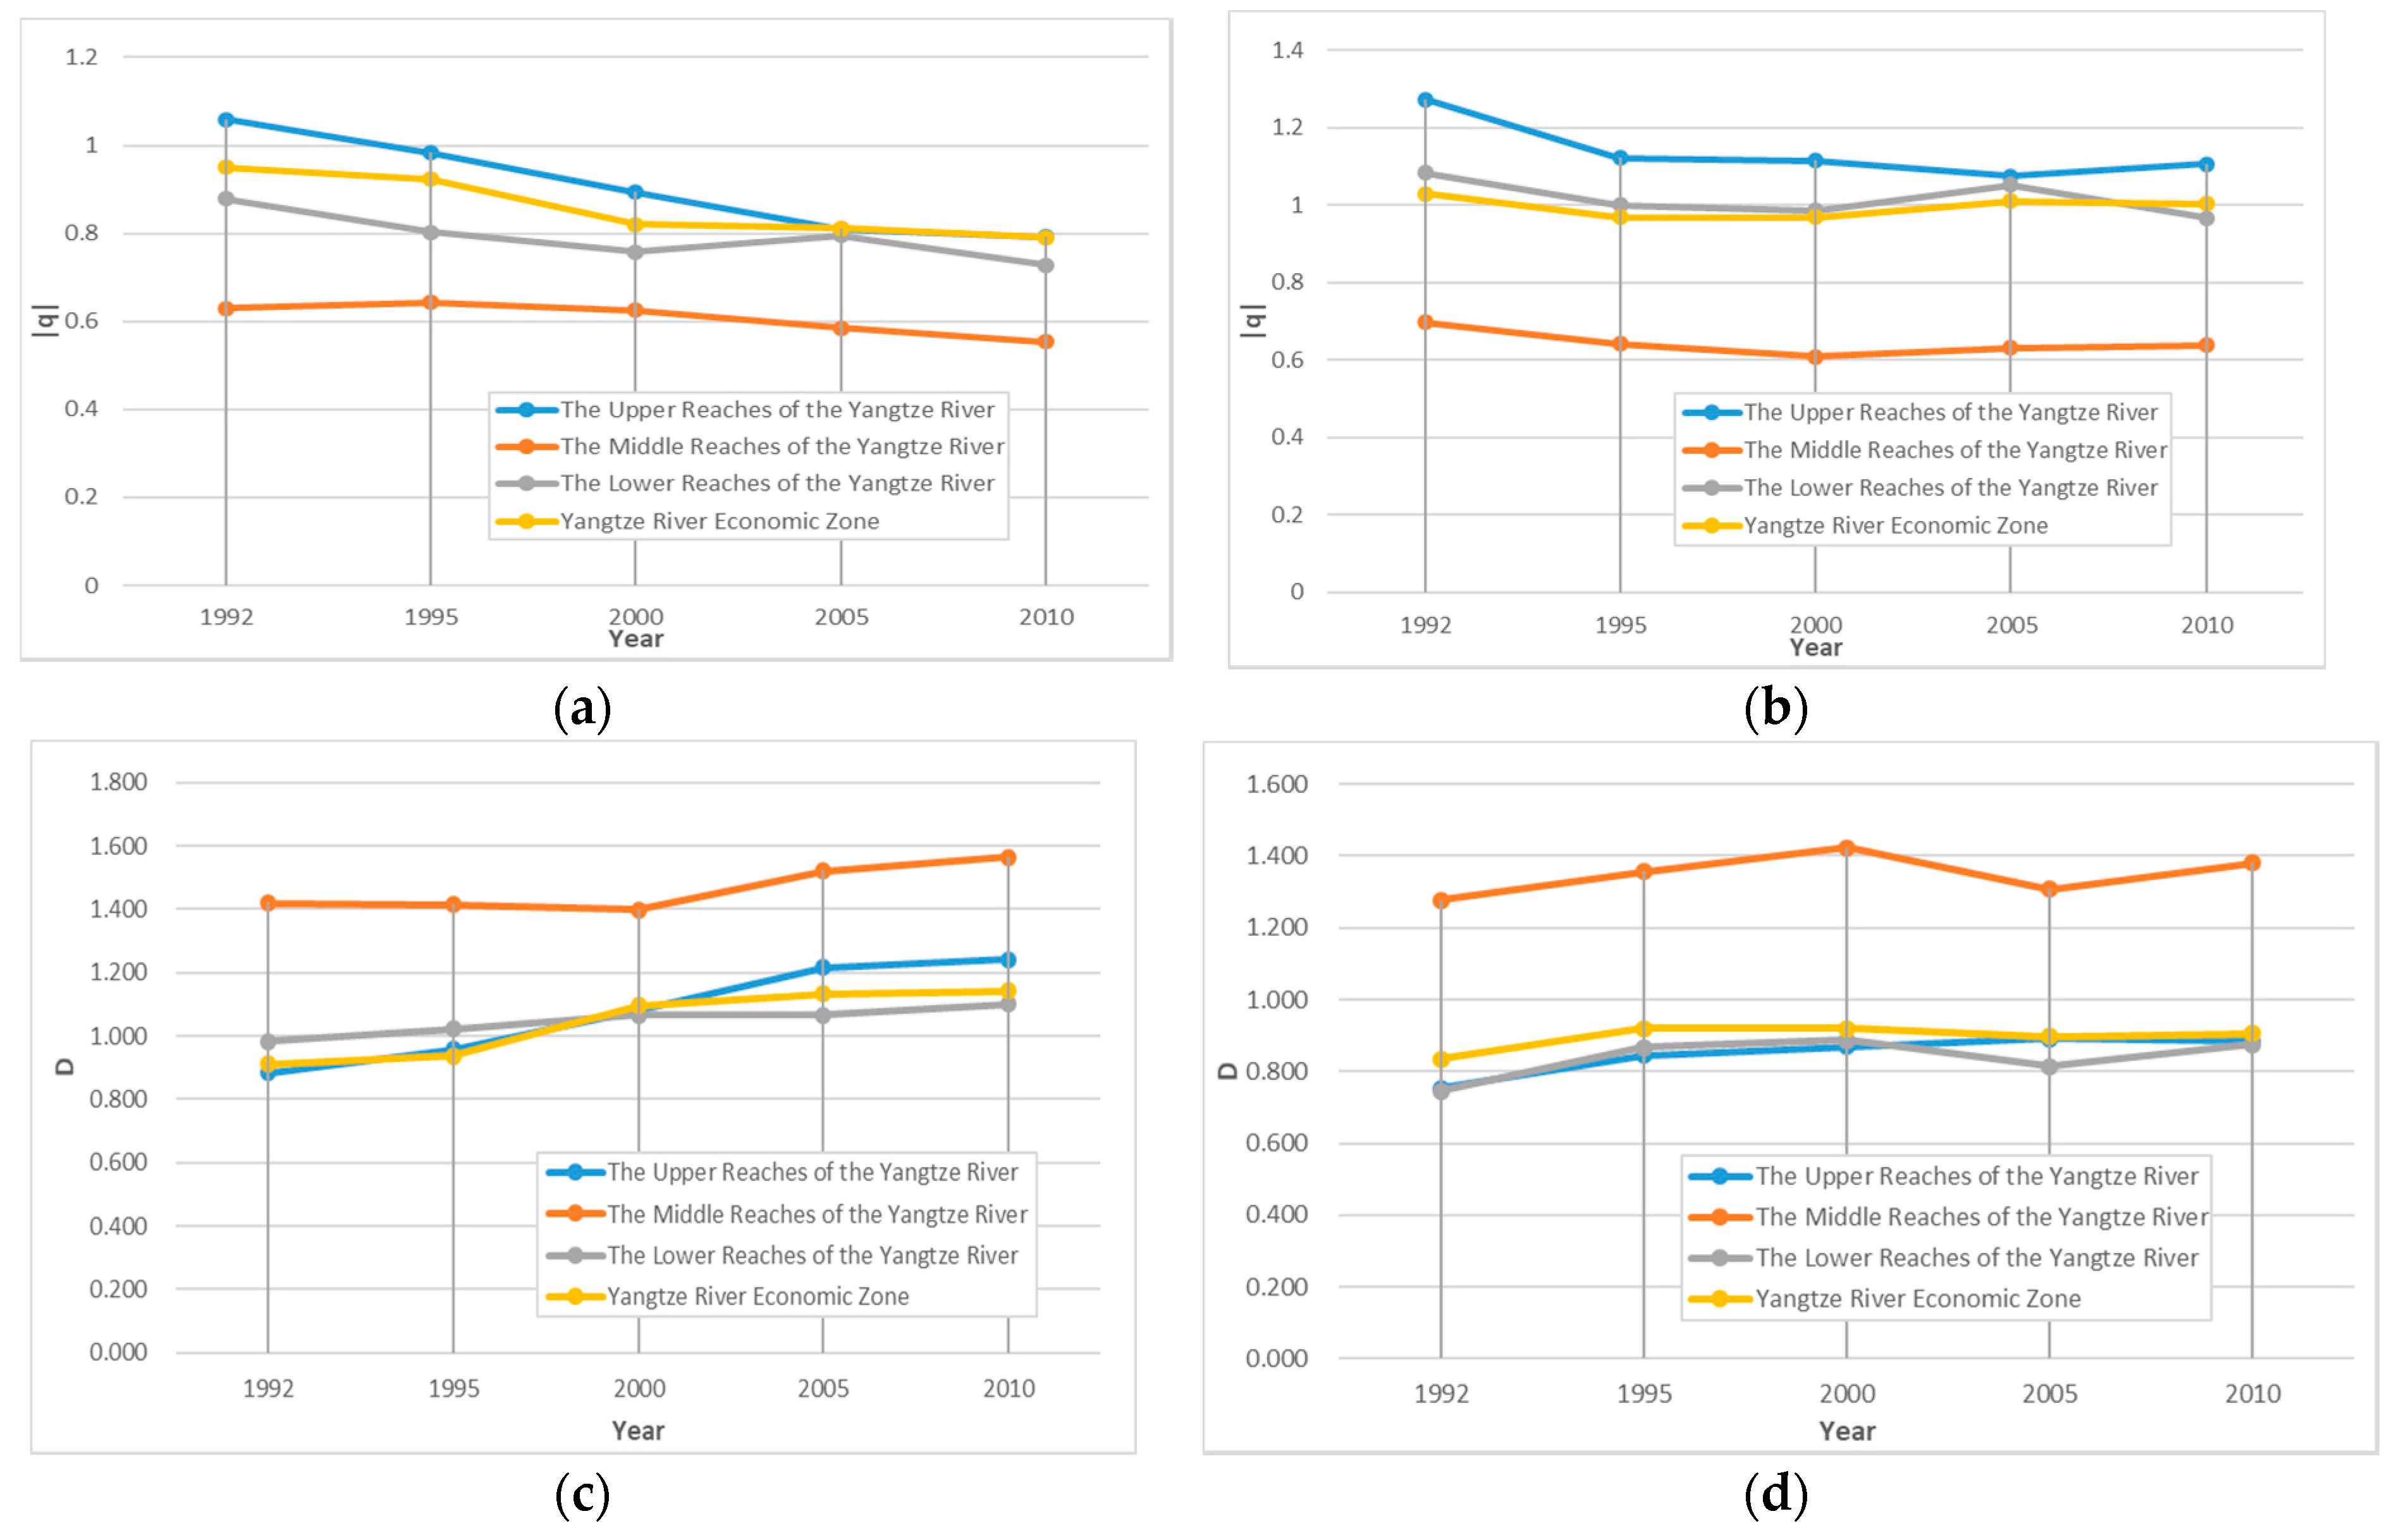
Table 1 shows the results of total nighttime light and urban land by the urban land rank-size rule from 1992 to 2010, and the |q| of the urban rank size time-series is shown in Figure 7 in the YREB and the three subzones (the upper reaches of the Yangtze River, the middle reaches of the Yangtze River, and the lower reaches of the Yangtze River). We can see the following. (1) According to the goodness of fit R2, the significance test at the level of 0.01 has been passed for the rank-scale rule double logarithmic regression model of the three regions of the YREB. The value of |q| decreased from 1.030 in 1992 to 0.968 in 2000 in the YREB. The value began to show an upward trend in 2005 and was greater than 1, while in the urban nighttime light rank-size rule double logarithm in the regression model, the value of |q| was less than 1, showed a declining trend year by year, and decreased from 0.950 in 1992 to 0.790 in 2010. (2) In the upper reaches of the Yangtze River, the value of |q| was always greater than 1, with a slight downward trend in the urban land rank-size rule double logarithmic regression model, while the value of |q| decreased from 1.059 in 1992 to 0.792 in 2010 in the nighttime light rank-size rule double logarithmic regression model. (3) In the middle reaches of the Yangtze River, the value of |q| was always less than 1, and remained between 0.60–0.69 in the urban land rank-scale double logarithmic regression model. In the nighttime light rank-size rule double logarithmic regression model, the value of |q| was always smaller than 0.63, and the presentation tended to decrease overall; the |q| value decreased to 0.554 in 2010. (4) In the lower reaches of the Yangtze River, the value of |q| always fluctuated near 1, most of the years remained at approximately 1 in the urban land rank-size rule double logarithmic regression model. In the nighttime light rank-size rule double logarithmic regression model, the value of |q| was always less than 1, and the overall trend was gradually decreasing from 0.878 in 1992 to 0.728 in 2010.
The above results indicate that the size of urban land in the YREB was relatively close to Zipf’s ideal, the pattern of urban land was considered as a secondary type except in 1995 and 2000, and the size of urban land was slightly decentralized and high-level cities did not stand out. The size of urban land appeared to be the initial urban type after 2000, and the size of urban land was concentrated. The size of the city reflected by the nighttime lights always showed the size of the urban size. The size of the land within the area was scattered, and the size of the high-order city was not very prominent. It showed that the scattered power of the urban land was greater than the concentrated force, indicating that in the Yangtze River Economic Belt, the distribution of urban land sizes was gradually decentralized, and the size of small and medium-sized cities gradually increased. The first type of cities in the region was not prominent.
In contrast, the size of the urban reflected by the nighttime light was always presented as a secondary type, the size of nighttime light within the area was scattered, the size of the high-order urban areas was not very prominent, and the power of the scattered size of urban land was greater than the strength of concentration. Thus, the size of nighttime light in the YREB was gradually decentralized. The size of small and medium-sized urban areas gradually increased, and the first type of urban area in the region was not prominent. From the results of the district experiment, the urban size of nighttime light and urban land have shown the first type of distribution in the upper reaches of the Yangtze River. Although the trend gradually shifted to subtype, the overall development still shows that large cities were relatively developed, and that small and medium-sized cities developed slowly. In the middle reaches of the Yangtze River, there was a clear secondary development trend, indicating that the monopoly of the first city in the region was not prominent enough, and that the size of small and medium cities was large. In the lower reaches of the Yangtze River, although the size of the urban land shows the first type of features, the index of urban nighttime light shows a secondary type, which reflects the rapid development of urban areas in the lower reaches of the Yangtze River. The monopoly of the first city was not prominent, and the size of the small and medium-sized cities was not the same. The problem of urban intensive land use remains to be explored. Judging from the trend of the time-series, the lower reaches of the Yangtze River present a trend of greater use of land-scale decentralized forces than concentrated forces, and the size of small and medium cities are also gradually developing.
The nighttime light of urban fractal dimension D shows that the degree of equilibrium in the middle reaches of the Yangtze River was relatively high, and the sizes of the cities were relatively close. The degree of equilibrium in the upstream and downstream areas was lower than that in the middle reaches, which indicates that the size of cities in the region was relatively uneven, and that the first degree of city was higher. The urban land size description showed a similar trend. The uniformity of the middle reaches of the Yangtze River was relatively high, reflecting the current low urban primacy index in the middle reaches of the Yangtze River. The degree of equilibrium in the YREB and the upper reaches was relatively small, and the urban primacy index was higher, the advantage of cities was more obvious, and the city sizes were quite different. Regardless of urban land data or total nighttime light data, the overall balance of the land size distribution in the YREB reflects a growing trend. The size of urban land has continued to increase, indicating that the YREB is a system with a clearly enhanced balance.
4.4. Analysis Results of the Gini Coefficient in the YREB
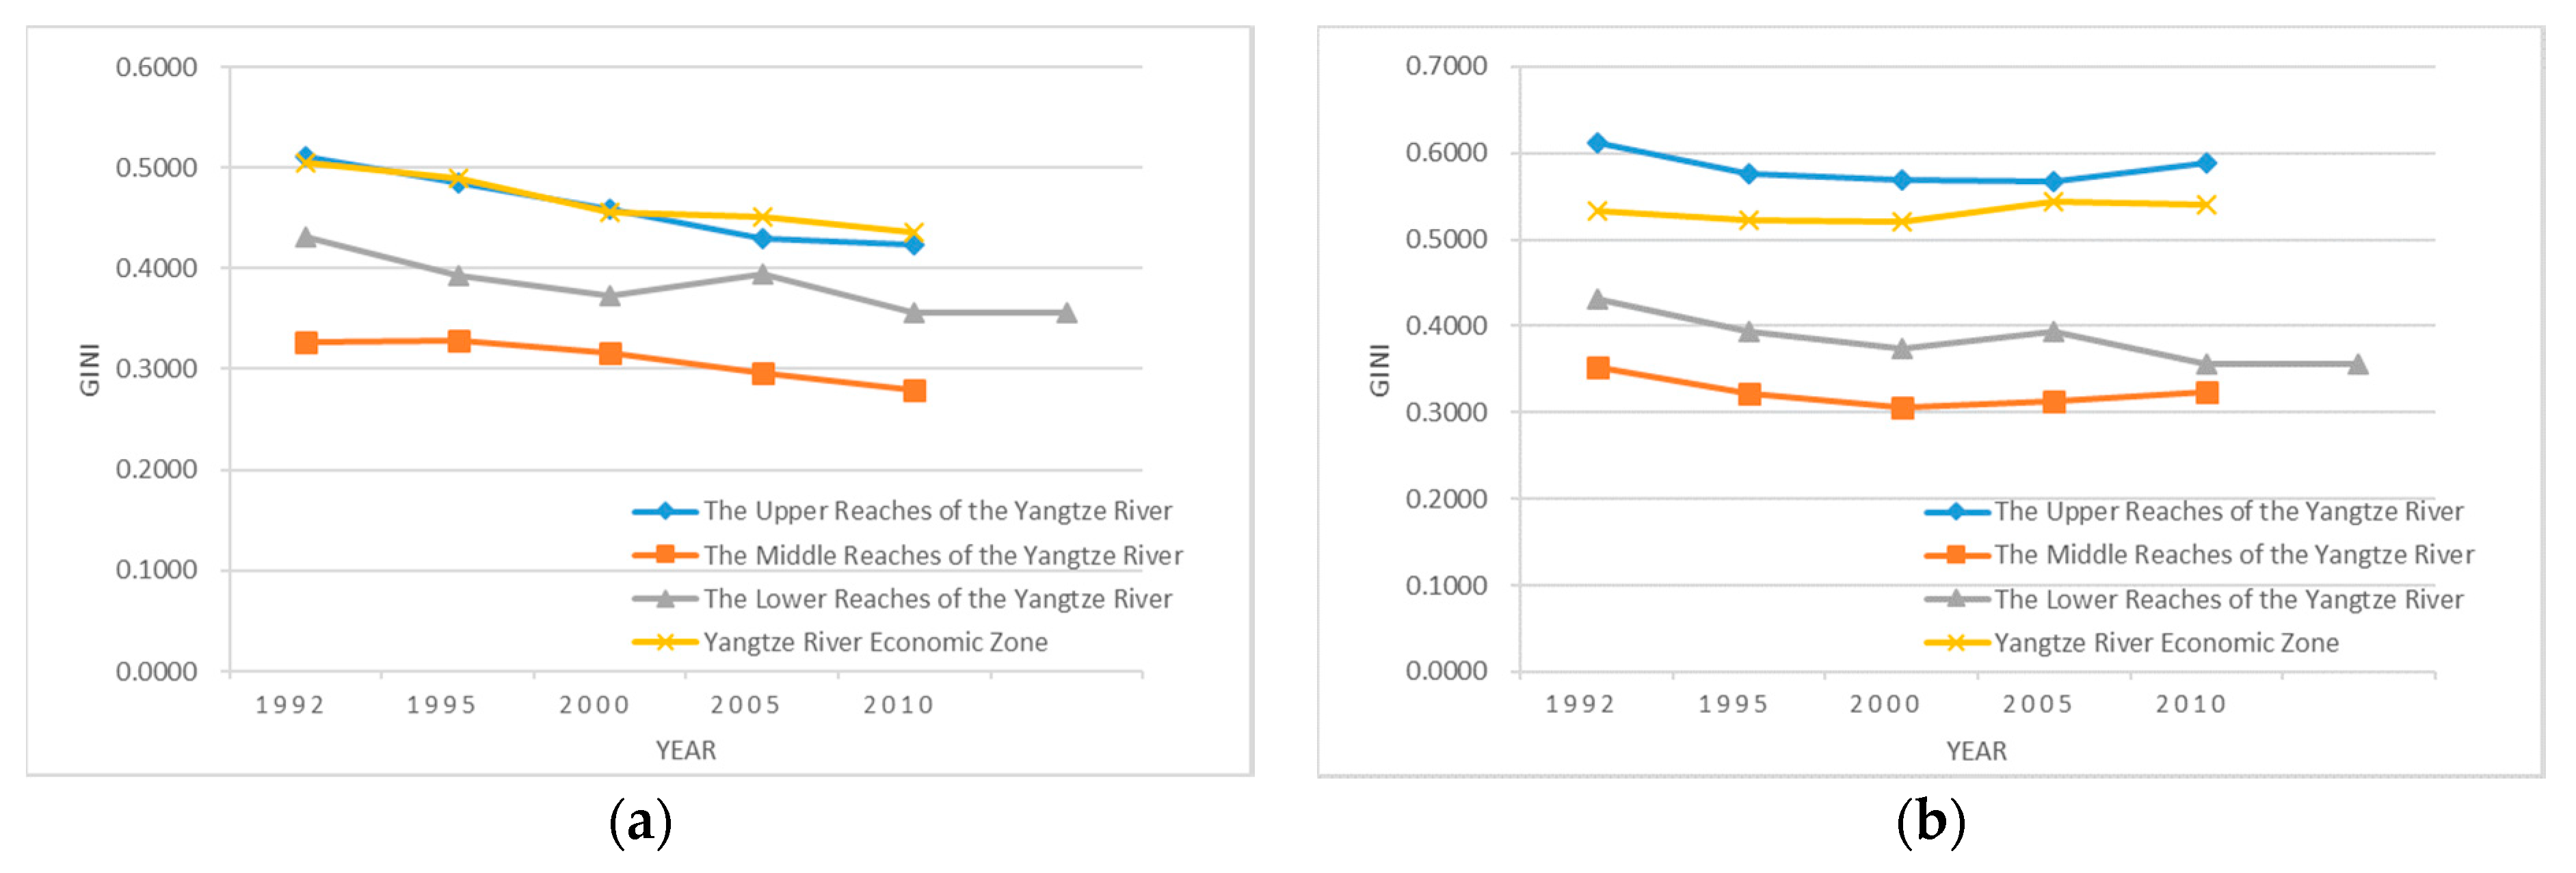
To better reflect the regional differences in the distribution of cities in the YREB, this paper estimates the Gini coefficient by urban land data and nighttime light data. The level of the urban Gini coefficient in the YERB is divided into five levels [48]; namely, high dispersion (0~0.45), scattered (0.45~0.50), equilibrium (0.50~0.55), agglomeration (0.55~0.60), and high aggregation (0.60~1). The calculation results are shown in Table 2.
The distribution of Gini coefficients in different years for the region is shown in Figure 8. The analysis of the results of Lorentz curve fitting and the Gini coefficient parameter estimation is as follows:
- (1)
- Within the scope of the YREB, the Gini coefficient of urban nighttime light estimate is 0.47, and the average Gini coefficient for urban land use is 0.53. From 1992 to 2010, urban land in the region showed a balanced development model, but it is also at a critical value of equilibrium and aggregation. It also reflects that the development of the YREB’s economy requires a large amount of investment in construction land to drive expansion. In comparison, the expansion speed of big cities is faster than that of small cities, and the scale of urban nighttime light has grown from a uniform in 1992 to a high dispersion in 2010, which reflects the difference in the development of large cities and small and medium-sized cities in the region. There is also a difference between the efficiency of urban land use and the efficiency of urban land utilization, and there is a certain degree of conflict between the sizes of urban land and nighttime light.
- (2)
- From a regional perspective, the average Gini coefficient of urban nighttime light estimate is 0.46 in the upper reaches of the Yangtze River, and the average Gini coefficient of urban land is 0.58; the urban nighttime light size in the upper reaches of the Yangtze River has been uniformly dispersed and highly distributed since 1992. The size of urban land has remained clustered and developed, indicating that a large amount of construction land has been invested to stimulate economic development in the upper reaches of the Yangtze River. However, the size of nighttime light shows a high degree of dispersion; combined with geographical conditions and land management policies, we believe that the problem of inefficient use of urban land and the extensive growth of cities in the region exists. The average Gini coefficient of urban nighttime light estimate is 0.31 in the middle reaches of the Yangtze River, and the average Gini coefficient of urban land is 0.32. The urban nighttime light size and urban land size have been highly fragmented since 1992. To a certain extent, it conforms to the characteristics of the development of the planning document named “Outline of Development Planning for the Yangtze River Economic Belt”. The average Gini coefficient of urban nighttime light estimate is 0.38 in the lower reaches of Yangtze River, and the average Gini coefficient of urban land is 0.48. The urban nighttime light size has been highly dispersed in the lower reaches of the Yangtze River since 1992, and the size of urban land has been decentralized. The overall Gini coefficient is higher than that in the middle reaches of the Yangtze River, reflecting that the expansion rate of big cities is faster than that of small cities.
- (3)
- In contrast, the size of urban land among the cities varies the most in the upper reaches of the Yangtze River, and the size of urban land is most concentrated and less balanced. The size of land is relatively small in the middle reaches of the Yangtze River, and the size distribution of cities is relatively divergent and balanced. The lower reaches of the Yangtze River are in a decentralized state; some cities are concentrated, and the overall situation shows an imbalance, although overall economic development is higher than in other regions. The size of urban land in the YREB presents a critical state of decentralization to equilibrium, indicating that the overall size of urban land is well developed, but the size of urban land is continuously narrowing in the middle and lower reaches of the Yangtze River, and the distribution of urban land size tends to be dispersed. Among them, the distribution of urban land in the middle reaches of the Yangtze River tends to be the most dispersed. However, the trend reflected by the nighttime light size is that the difference in the size of urban areas between cities is continuously shrinking, and the distribution of urban land sizes tends to be dispersed, which shows that there is a difference between urban expansion and actual human activities. Although the distribution characteristics of the urban land size and their level of economic development do not have a completely positive linear relationship, this can, to a certain extent, reflect the significant impact of differences in economic development levels on the Gini coefficient of urban size distribution.
5. Conclusions
The city is an open and complex giant system. Its development is not an isolated and single process. Many cities under a certain regional environment form an organic overall network, namely, an urban system. The regional urban system, as an advanced model of urban geographic space and network organization expansion, is the result of the combined effect of urban regionalization and regional urbanization. It is precisely because of the regional characteristics of the administrative divisions and the scope of influence of the urban areas that the spatial autocorrelation characteristics of the cities are exhibited due to the existence of spatial dependence. In this paper, we use multi-source remote sensing data, combined with the urban rank-size rule, fractal theory, and the Gini coefficient to explore the spatial evolution of urban land in the YREB from 1990 to 2010. We have reached the following conclusions:
- (1)
- The size of urban land is represented by the urban land and urban nighttime light data extracted by remote sensing data sources. The size of urban land in the YREB conforms to the urban rank-size rule, and the size of urban land continues to increase, but the size of urban land is less balanced. Compared with the traditional analysis of the use of statistical yearbook data to measure the size of urban land, the remote sensing data source used in this paper has obvious advantages, and it can solve problems such as the inability to measure the indicators caused by changes in administrative divisions. Through the analysis of remote sensing urban land data and total nighttime light data, it can be seen that the level of urban development in the YREB showed a spatial unbalanced trend between 1990–2010, which basically presented high and low levels in the east, and gradually decreased. The pattern and the development trend and intensity were more obvious in the downstream areas, and the region showed a slow development trend driven by the core cities in the middle and lower reaches.
- (2)
- The Yangtze River Economic Belt, as a leading demonstration zone, innovation driving zone, and coordinated development zone for the construction of national ecological civilization, has important theoretical and practical research value. Due to differences in historical basis, geographical location conditions, economic development level, population, resources, the environment, and regional development policies, the distribution of urban land in the upper reaches, middle reaches, and lower reaches of the Yangtze River in the YREB also showed some differences. The size of major urban land systems tends to be coordinated in the upper reaches of the region, and large, medium and small cities develop simultaneously. The distribution of urban land tends to be dispersed in the middle reaches, the size of land use in medium-sized cities is relatively stable, and the size of urban land expansion in high-order cities is not obvious. Therefore, we should increase the construction of the first city in the middle reaches of the Yangtze River, and at the same time give priority to the development of small and medium-sized cities and key small towns. The upper reaches show that the growth of high-order urban land is significantly faster than that of middle and low-ranking urban areas. In recent years, relevant studies have been conducted on regional differences in China’s economic and urbanization development. From the perspective of GDP and other economic indicators, the differences between the three regions in the YREB are gradually expanding. However, from the perspective of the scale and spatial distribution of urban land in this study, under the constraints of basic geographical conditions and land management policies, the overall difference has not been further widened.
- (3)
- Although there is no general best urban land size at present, the study generally shows that the concentration of urban size distribution cannot be too large, urban land is excessively concentrated in mega-urban areas and big urban areas, the resources of the urban system are expensive, and the environmental pressure is heavy. The degree of concentration of the city size distribution should not be too small, which means that there is a small difference in the size of land use among the cities in the urban system. As a result, the economic efficiency of the urban system is poor, and the land is wasted. Therefore, when the government departments carry out the development planning, layout, and control of the urban system, they must properly grasp the current status and characteristics of the urban land size distribution in different regions, and carry out reasonable and differential policy adjustments to optimize the distribution of the urban system size and enhance the overall competitiveness. At the same time, the urban land area and nighttime light quantity obtained by remote sensing data are used as indicators to measure the urban size. The rank-size rule can well describe the distribution characteristics of the city size in the study area. As a useful attempt, this study can quickly and conveniently measure the scale of urban land use in large-scale areas, and compare the efficiency of urban land use by nighttime light data. This will provide support and assistance for the timely understanding and mastering of regional and even urban land use and expansion in the long-term sequence, as well as adjusting and optimizing the spatial pattern of land urbanization, and preventing the loss of control of land urbanization.
Author Contributions
Y.L. had the original idea for this study, wrote the paper, completed the literature review and analyzed the data. H.S. and G.S. processed the data; X.C. drew the analysis figures and read the literature. N.J. reviewed the paper structure and gave advice to the methodology design. All authors have read and approved the final manuscript.
Funding
This research was undertaken at the Nanjing Normal University, School of geography and funded by the National Natural Science Foundation of China (NO.: 41601449; 41501431; 41771421) and the Natural Science Foundation of the Jiangsu Higher Education Institutions of China (NO.: 16KJD420002), the Priority Academic Program Development of Jiangsu Higher Education Institutions (NO.: 164320H116).
Acknowledgments
Acknowledgments for the data support from the Yangtze River Delta Science Data Center. National Earth System Science Data Sharing Infrastructure, National Science & Technology Infrastructure of China (http://nnu.geodata.cn).
Conflicts of Interest
The authors declare that they have no conflict of interest.
References
- Tan, C. Spatial Differentiation and Development of Economy in the Yellow River Basin; Science Press: Beijing, China, 2011. [Google Scholar]
- Abu-Zeid, M.A.; Biswas, A.K. River Basin Planning and Management; Oxford University Press: Oxford, UK, 1996. [Google Scholar]
- Hipple, J.D.; Drazkowski, B.; Thorsell, P.M. Development in the Upper Mississippi Basin: 10 years after the Great Flood of 1993. Landsc. Urban Plan. 2005, 72, 313–323. [Google Scholar] [CrossRef]
- Xu, J. Research on the Mode of Foreign Valley Development and Development Strategy of Jiangsu Province along the Yangtse River. Master’s Thesis, Southeast University, Nanjing, China, 2004. [Google Scholar]
- Zanette, D.H.; Manrubia, S.C. Role of Intermittency in Urban Development: A Model of Large-Scale City Formation. Phys. Rev. Lett. 1998, 79, 523–526. [Google Scholar] [CrossRef]
- Gan, L.; Li, D.; Song, S. Is the Zipf law spurious in explaining city-size distributions. Econ. Lett. 2006, 92, 256–262. [Google Scholar] [CrossRef]
- Kongjian, Y. Ten major strategies for urban ecology. Ecol. Econ. 2003, 2, 35–36. [Google Scholar]
- Lin, Z.; Gang, Z.; Xianzhong, C. Research on Spatial Characteristic of the Economic Relation Network of Yangtze Economic Zone. Econ. Geogr. 2015, 35, 1–7. [Google Scholar]
- Fan, J.; Wang, Y.; Chen, D.; Zhou, C. Analysis on the spatial development structure of the Yangtze River Economic Belt. Prog. Geogr. 2015, 34, 1336–1344. [Google Scholar]
- Lu, D. Economic belt construction is the best choice of economic development layout: The enormous potential for the Changjiang River economic belt. Sci. Geogr. Sin. 2014, 34, 769–772. [Google Scholar]
- Huang, G.H.; Liu, C.J.; Xu, Z.H. Carbon emission reduction potential and low-carbon development strategy in Yangtez River economic belt. Resour. Environ. Yangtze Basin 2018, 27, 695–704. [Google Scholar]
- Wang, W.; Zhang, T.; Chen, Y. Coordinated development pattern of “Five Modernizations” of prefecture level cities or above in the Yangtze River economic zone. Sci. Geogr. Sin. 2018, 28, 385–393. [Google Scholar]
- Yao, Z. Process evaluation and path exploration of regional economic development: Based on the empirical data of the Yangtze River economic belt 11 province from 2003 to 2015. Econ. Geogr. 2018, 38, 46–52. [Google Scholar]
- National Development and Reform Commission. Development Planning of Urban Agglomeration in the Middle Reaches of the Yangtze River [EB/OL]. Available online: http://www.sdpc.gov.cn/zcfb/zcfbtz/201504/t20150416_688229.html (accessed on 26 July 2018).
- Zhou, J.Z.; Wang, L.; Zhang, Y. Urbanization development and gradient evolution of the Yangtze River Economic Belt. Stat. Decis. 2018, 5, 131–134. [Google Scholar]
- Chen, X. The formation, evolvement and reorganization of spatial structure in Yangtze River economic zone. Acta Geogr. Sin. 2007, 62, 1265–1276. [Google Scholar]
- Zhang, C.; Wang, C.; Lv, Y.; Shen, T. Research on City System Spatial Structure of the Yangtze River Economic Belt: Based on DMSP/OLS Night Time Light Data. Urban Dev. Stud. 2015, 22, 19–27. [Google Scholar]
- Moura, N.J., Jr.; Ribeiro, M.B. Zipf law for Brazilian cities. Phys. A 2005, 367, 441–448. [Google Scholar] [CrossRef]
- Veneri, P. On City Size Distribution: Evidence from OECD Functional Urban Areas; OECD Regional Development Working Papers; OECD Publishing: Paris, France, 2013. [Google Scholar]
- Chen, K.; Zhuang, Y. Spatial Econometric Analysis of the Rank-size Rule for Urban System: A Case of Prefectural-level cities in China’s Middle Area. Sci. Geogr. Sin. 2012, 32, 905–912. [Google Scholar]
- Berry, B.J.L.; Okulicz-Kozaryn, A. The city size distribution debate: Resolution for US urban regions and megalopolitan areas. Cities 2012, 29, S17–S23. [Google Scholar] [CrossRef]
- Chen, J.; Zhuo, L.; Shi, P. The study on urbanization process in China based on DMSP/OLS data: Development of a light index for urbanization level estimation. J. Remote Sens. 2003, 7, 168–175. [Google Scholar]
- Li, D.; Li, X. An Overview on Data Mining of Nighttime Light Remote Sensing. Acta Geod. Cartogr. Sin. 2015, 44, 591–601. [Google Scholar]
- Li, D.; Yu, H.; Li, X. The spatial-temple pattern analysis of city development in countries along the belt and road initiative based on nighttime light data. Geomat. Inf. Sci. Wuhan Univ. 2017, 42, 711–720. [Google Scholar]
- Liu, X.; Hu, G.; Chen, Y.; Li, X.; Xiaocong, X.; Li, S.; Pei, F.; Wang, S. High-resolution multi-temporal mapping of global urban land using Landsat images based on the Google Earth Engine Platform. Remote Sens. Environ. 2018, 209, 227–239. [Google Scholar] [CrossRef]
- Yu, B.; Shu, S.; Liu, H.; Song, W.; Wu, J.; Wang, L.; Chen, Z. Object-based spatial cluster analysis of urban landscape pattern using nighttime light satellite images: A case study of China. Int. J. Geogr. Inf. Sci. 2014, 28, 2328–2355. [Google Scholar] [CrossRef]
- Pandey, B.; Joshi, P.; Seto, K.C. Monitoring urbanization dynamics in India using DMSP/OLS night time lights and SPOT-VGT data. Int. J. Appl. Earth Observ. Geoinf. 2013, 23, 49–61. [Google Scholar] [CrossRef]
- Shi, K.; Chen, Y.; Yu, B.; Xu, T.; Chen, Z.; Liu, R.; Li, L.; Wu, J. Modeling spatiotemporal CO2 (carbon dioxide) emission dynamics in China from DMSP-OLS nighttime stable light data using panel data analysis. Appl. Energy 2016, 168, 523–533. [Google Scholar] [CrossRef]
- Fan, J.; Ma, T.; Zhou, C.; Zhou, Y.; Xu, T. Comparative Estimation of Urban Development in China’s Cities Using Socioeconomic and DMSP/OLS Night Light Data. Remote Sens. 2014, 6, 7840–7856. [Google Scholar] [CrossRef] [Green Version]
- Li, C.; Li, G.; Zhu, Y.; Ge, Y.; Kung, H.T.; Wu, Y. A likelihood-based spatial statistical transformation model (LBSSTM) of regional economic development using DMSP/OLS time series and nighttime light imagery. Spat. Stat. 2017, 21. [Google Scholar] [CrossRef]
- Yue, W.; Zhang, L.; Liu, Y. Measuring sprawl in large chinese cities along the yangtze river via combined single and multidimensional metrics. Habitat Int. 2016, 57, 43–52. [Google Scholar] [CrossRef]
- Liu, Y.; Zhang, X.; Kong, X.; Wang, R.; Chen, L. Identifying the relationship between urban land expansion and human activities in the Yangtze River economic belt, china. Appl. Geogr. 2018, 94, 163–177. [Google Scholar] [CrossRef]
- Small, C.; Elvidge, C.D.; Balk, D. Spatial Scaling of Stable Night Lights. Remote Sens. Environ. 2011, 115, 269–280. [Google Scholar] [CrossRef]
- Small, C.; Sousa, D. Humans on Earth: Global extents of anthropogenic land cover from remote sensing. Anthropocene 2016, 14, 1–33. [Google Scholar] [CrossRef]
- Jiang, B.; Jia, T. Zipf’s Law for all the natural cities in the United States: A geospatial perspective. Int. J. Geogr. Inf. Sci. 2011, 25, 1269–1281. [Google Scholar] [CrossRef]
- Jiang, B.; Yin, J.; Liu, Q. Zipf’s law for all the natural cities around the world. Int. J. Geogr. Inf. Syst. 2015, 29, 498–522. [Google Scholar] [CrossRef] [Green Version]
- Yang, Y.; Li, Y.; He, C.; Liu, Z.; Huang, Q. A comparative study on spatiotemporal dynamics of city size distribution among three urban agglomerations in Bohai Rim: Based on the analysis and perspective of nighttime light data from 1992 to 2012. Econ. Geogr. 2016, 36, 59–69. [Google Scholar]
- Tan, M.; Lu, C. Distribution of China city size expressed by urban built-up area. Acta Geogr. Sin. 2003, 58, 285–293. [Google Scholar]
- Liu, J.; Chen, Y. Fractal studies of urban geography in the past and future. Sci. Geogr. Sin. 2000, 20, 166–171. [Google Scholar]
- Yue, W.; Xu, J.; Si, Y.; Xu, L. Applications of fractal geometry theory in the study of human geography. Geogr. Territ. Res. 2001, 17, 51–56. [Google Scholar]
- Wu, Z.; Dai, X.; Yang, W. On reconstruction of parato formula and its relationship with development of urban system. Hum. Geogr. 2001, 17, 51–56. [Google Scholar]
- Yong, C.; Rong, C.; Nanshan, A. Fractal study of urban scale distribution. Econ. Geogr. 1993, 3, 48–53. [Google Scholar]
- Wang, Y.; Zhang, J.; Li, C.G.; Zhang, X.N. Evolution and spatial characteristics of city scale distribution in northeast China. Econ. Geogr. 2011, 31, 55–59. [Google Scholar]
- Chen, X.; Li, X.; Qiu, Z.; Jiang, D. A Gini coefficient-based equilibrium study for the distribution of city size. Stat. Decis. 2017, 1, 1,93–97. [Google Scholar]
- Zuo, X. Study on the Development of Urban Agglomeration in Yangtze River Delta; Xuelin Press: Shanghai, China, 2006. [Google Scholar]
- The State Council. Guiding Opinions of the State Council on Promoting the Development of the Yangtze River Economic Belt by Relying on the Golden Waterway; People’s Publishing House: Beijing, China, 2014.
- Anselin, L. Spatial Econometrics: Methods and Models; Kluwer Academic Publishers: Boston, MA, USA, 1988; pp. 32–54. [Google Scholar]
- Zhu, S.; Zheng, B. Regional differences of urban size distribution in China from Gini coefficient. Stat. Decis. 2014, 6, 127–129. [Google Scholar]
Figure 1.
The study areas of the Yangtze River Economic Belt (YREB).

Figure 2.
Urban land datasets between 1990–2010 in the YREB.

Figure 3.
Nighttime stable light (NSL) data after correction in the YREB.

Figure 4.
The distribution of urban land increments in the study area between 1990–2010, with (a) Thematic map of urban land area classification in the YREB (1990 to 2010), (b) Increment of urban land in the top 20 cities of the YREB (1990 to 2000, 1990 to 2010), (c) Spatial distribution of the urban land increase in the YREB (1990 to 2000), and (d) Spatial distribution of the urban land increase in the YREB (1990 to 2010).

Figure 5.
The distribution of total nighttime light in cities of the YREB between 1992 to 2010, with (a) Thematic map of total nighttime light classification in the YREB (1992 to 2010), (b) Increment of total nighttime light in the Top 20 cities of the YREB (1992 to 2000, 1992 to 2010), (c) Spatial distribution of total nighttime light increase in the YREB (1992 to 2000), and (d) Spatial distribution of total nighttime light increase in the YREB (1992 to 2010).

Figure 6.
Logarithmic curve of the rank-size distribution in YREB from 1990 to 2010, with (a) Rank-size plots of total nighttime light and order in the YREB (1992–2010), and (b) Rank-size plots of urban land and rank in the YREB (1990–2010).
Figure 6.
Logarithmic curve of the rank-size distribution in YREB from 1990 to 2010, with (a) Rank-size plots of total nighttime light and order in the YREB (1992–2010), and (b) Rank-size plots of urban land and rank in the YREB (1990–2010).

Figure 7.
|q| and urban size distribution (D) of the rank-size double logarithm in the top 110 areas of the YREB, with (a) The chart of |q| showing the urban total nighttime light from 1992 to 2010, (b) The chart of |q| showing the urban land from 1990 to 2010, (c) The chart of D showing the urban total nighttime light from 1992 to 2010, and (d) The chart of D showing the urban land from 1990 to 2010.

Figure 8.
The Gini coefficient of the YREB, with (a) The chart of the Gini coefficient showing urban total nighttime light from 1992 to 2010, and (b) The chart of the Gini coefficient showing urban land from 1990 to 2010.
Figure 8.
The Gini coefficient of the YREB, with (a) The chart of the Gini coefficient showing urban total nighttime light from 1992 to 2010, and (b) The chart of the Gini coefficient showing urban land from 1990 to 2010.


Table 1.
The regressive results of the rank-size double logarithm among three urban agglomerations in the YREB from 1992 to 2010.
Table 1.
The regressive results of the rank-size double logarithm among three urban agglomerations in the YREB from 1992 to 2010.
| Year | Yangtze River Economic Belt | The Upper Reaches of the Yangtze River | The Middle Reaches of the Yangtze River | The Lower Reaches of Yangtze River | ||||||||
|---|---|---|---|---|---|---|---|---|---|---|---|---|
| Total Nighttime Light of the City | |q| | lgP1 | R2 | |q| | lgP1 | R2 | |q| | lgP1 | R2 | |q| | lgP1 | R2 |
| 1992 | 0.950 ** | 5.678 | 0.865 | 1.059 ** | 5.059 | 0.936 | 0.630 ** | 4.805 | 0.894 | 0.878 ** | 5.478 | 0.863 |
| 1995 | 0.923 ** | 5.831 | 0.864 | 0.983 ** | 5.187 | 0.942 | 0.643 ** | 4.987 | 0.909 | 0.803 ** | 5.600 | 0.821 |
| 2000 | 0.820 ** | 5.794 | 0.899 | 0.894 ** | 5.261 | 0.965 | 0.626 ** | 5.064 | 0.876 | 0.758 ** | 5.620 | 0.808 |
| 2005 | 0.812 ** | 5.890 | 0.920 | 0.810 ** | 5.323 | 0.983 | 0.584 ** | 5.138 | 0.889 | 0.796 ** | 5.766 | 0.847 |
| 2010 | 0.790 ** | 6.148 | 0.902 | 0.792 ** | 5.598 | 0.984 | 0.554 ** | 5.384 | 0.866 | 0.728 ** | 5.987 | 0.801 |
| Urban Land Size | |q| | lgP1 | R2 | |q| | lgP1 | R2 | |q| | lgP1 | R2 | |q| | lgP1 | R2 |
| 1992 | 1.030 ** | 9.780 | 0.86 | 1.274 ** | 9.298 | 0.960 | 0.697 ** | 8.903 | 0.891 | 1.083 ** | 9.622 | 0.807 |
| 1995 | 0.968 ** | 9.779 | 0.892 | 1.122 ** | 9.273 | 0.947 | 0.642 ** | 8.906 | 0.870 | 1.000 ** | 9.632 | 0.867 |
| 2000 | 0.968 ** | 9.825 | 0.890 | 1.115 ** | 9.282 | 0.970 | 0.609 ** | 8.920 | 0.866 | 0.985 ** | 9.679 | 0.874 |
| 2005 | 1.010 ** | 9.955 | 0.906 | 1.075 ** | 9.296 | 0.958 | 0.632 ** | 8.993 | 0.825 | 1.053 ** | 9.838 | 0.857 |
| 2010 | 1.003 ** | 10.024 | 0.909 | 1.106 ** | 9.403 | 0.976 | 0.638 ** | 9.054 | 0.881 | 0.966 ** | 9.840 | 0.845 |
* Denotes a very significant correlation (confidence coefficient 5%); ** denotes an extremely significant correlation (confidence coefficient 1%).
Table 2.
Gini coefficient in the YREB from 1990 to 2010.
| The Upper Reaches of the Yangtze River | The Middle Reaches of the Yangtze River | |||||||
| Year | Scale of Nighttime Light | Scale of Urban Land | Scale of Nighttime Light | Scale of Urban Land | ||||
| Gini Coefficient | Equilibrium Level | Gini Coefficient | Equilibrium Level | Gini Coefficient | Equilibrium Level | Gini Coefficient | Equilibrium Level | |
| 1992 | 0.5105 | Equilibrium | 0.6124 | Agglomeration | 0.3276 | High dispersion | 0.3524 | High dispersion |
| 1995 | 0.4852 | Scattered | 0.5769 | Equilibrium | 0.3278 | High dispersion | 0.3228 | High dispersion |
| 2000 | 0.4584 | Scattered | 0.5696 | Agglomeration | 0.316 | High dispersion | 0.3056 | High dispersion |
| 2005 | 0.4292 | High dispersion | 0.568 | Agglomeration | 0.2962 | High dispersion | 0.3127 | High dispersion |
| 2010 | 0.4234 | High dispersion | 0.5897 | Agglomeration | 0.2793 | High dispersion | 0.3232 | High dispersion |
| The Lower Reaches of the Yangtze River | Yangtze River Economic Zone | |||||||
| Year | Scale of Nighttime Light | Scale of Urban Land | Scale of Nighttime Light | Scale of Urban Land | ||||
| Gini Coefficient | Equilibrium Level | Gini Coefficient | Equilibrium Level | Gini Coefficient | Equilibrium Level | Gini Coefficient | Equilibrium Level | |
| 1992 | 0.4318 | High dispersion | 0.4915 | Scattered | 0.5044 | Equilibrium | 0.5341 | Equilibrium |
| 1995 | 0.3935 | High dispersion | 0.4754 | Scattered | 0.49 | Scattered | 0.5224 | Equilibrium |
| 2000 | 0.3731 | High dispersion | 0.4729 | Scattered | 0.4551 | Scattered | 0.5205 | Equilibrium |
| 2005 | 0.3937 | High dispersion | 0.4934 | Scattered | 0.4515 | Scattered | 0.5448 | Equilibrium |
| 2010 | 0.3563 | High dispersion | 0.4583 | Scattered | 0.4363 | High dispersion | 0.5401 | Equilibrium |
© 2018 by the authors. Licensee MDPI, Basel, Switzerland. This article is an open access article distributed under the terms and conditions of the Creative Commons Attribution (CC BY) license (http://creativecommons.org/licenses/by/4.0/).
Share and Cite
MDPI and ACS Style
Li, Y.; Shao, H.; Jiang, N.; Shi, G.; Cheng, X. The Evolution of the Urban Spatial Pattern in the Yangtze River Economic Belt: Based on Multi-Source Remote Sensing Data. Sustainability 2018, 10, 2733. https://doi.org/10.3390/su10082733
AMA Style
Li Y, Shao H, Jiang N, Shi G, Cheng X. The Evolution of the Urban Spatial Pattern in the Yangtze River Economic Belt: Based on Multi-Source Remote Sensing Data. Sustainability. 2018; 10(8):2733. https://doi.org/10.3390/su10082733
Chicago/Turabian StyleLi, Yang, Hua Shao, Nan Jiang, Ge Shi, and Xin Cheng. 2018. "The Evolution of the Urban Spatial Pattern in the Yangtze River Economic Belt: Based on Multi-Source Remote Sensing Data" Sustainability 10, no. 8: 2733. https://doi.org/10.3390/su10082733
Note that from the first issue of 2016, this journal uses article numbers instead of page numbers. See further details here.