Multi-Disciplinary Determination of the Rural/Urban Boundary: A Case Study in Xi’an, China

1
State Key Lab of Resources and Environmental Information System, Institute of Geographic Sciences and Natural Resources Research, Chinese Academy of Sciences, 11A Datun Road, Chaoyang District, Beijing 100101, China
2
University of Chinese Academy of Sciences, 19A Yuquan Road, Shijingshan District, Beijing 100049, China
*
Author to whom correspondence should be addressed.
Sustainability 2018, 10(8), 2632; https://doi.org/10.3390/su10082632
Submission received: 19 June 2018
/
Revised: 20 July 2018
/
Accepted: 23 July 2018
/
Published: 26 July 2018
(This article belongs to the Special Issue Spatial Analysis of Urbanization towards Urban Sustainability)
Abstract
:Rapid urbanization in China has blurred the boundaries between rural and urban areas in both geographic and conceptual terms. Accurately identifying this boundary in a given area is an important prerequisite for studies of these areas, but previous research has used fairly simplistic factors to distinguish the two areas (such as population density). In this study, we built a model combining multi-layer conditions and cumulative percentage methods based on five indicators linking spatial, economic, and demographic factors to produce a more comprehensive and quantitative method for identifying rural and urban areas. Using Xi’an, China as a case study, our methods produced a more accurate determination of the rural-urban divide when compared to data from the National Bureau of Statistics of the People’s Republic of China. Specifically, the urbanization level was 3.24% lower in the new model, with a total urban area that was 621.87 km2 lower. These results were checked by field survey and satellite imagery for accuracy. This new model thus provides local governments and other interested parties a theoretical and technological foundation for more accurate rural/urban planning and management in the future.
1. Introduction
Rapid urbanization in China since the 1990s has blurred the boundaries between rural and urban areas, creating increasingly serious problems for policy makers trying to define the characteristics of Chinese urbanization development. Although scientific methods are key to effectively distinguishing rural and urban areas, the statistical criteria and standards defining urban populations have changed regularly since the founding of the People’s Republic of China, leading to the lack of a unified approach. For example, during the 1980s, administrative divisions were changed in all regions of China. Due to this lack of uniform standards for rural-urban divisions, definitions of urbanization based on urban population alone cannot truly reflect the actual development characteristics of Chinese cities and towns. For this reason, studies of urbanization in China do not always match international standards, a problem that can be mitigated by accurate geographical delineation [1,2].
Geographical phenomena are complex, non-linear problems with subjectively uncertain indicators. For example, it is unclear which indicators consistently determine whether a given piece of land is urbanized or not. Additionally, the evaluation weight assigned to indicators can be quite subjective, introducing further errors. Many developed countries, such as the United States, the United Kingdom, and Japan, use regional identities combined with administrative regions at specified spatial scales to define rural-urban boundaries at different resolutions. For the highest accuracy, these countries use the smallest census unit as the smallest geographical unit when defining rural-urban divisions [3].
Understanding the characteristics defining rural and urban areas is key to developing methods for defining their boundaries. Since the 1930s, scholars have generally focused on economic functions, defining rural areas as being mainly engaged in agricultural production and having a low population density, while urban areas are mainly engaged in non-agricultural production and have a higher population density. Moreover, urban areas are usually the economic and political center of a given region [4]. For example, economists define “urban” as a network of accumulated economic, social, and physical entities in a certain spatial region. In this context, urban areas encompass various economic markets in a limited space and gather various economic factors on a large scale in a defined geographic area. These factors form an internal network that also interacts with outside areas. Sociologists define “urban” as communities where most residents engage in industrial, commercial, and other non-agricultural activities. Urban areas are thus a basic community for living and working, where the vocational structure is more diversified and extensive than in rural areas [5]. In general, the working and living pace in urban areas is faster than rural areas, while the population density, mobility, and heterogeneity are all higher. In this view, urban areas provide a distinct type of community consisting of a dense, non-agricultural population that is maintained by a common culture in a certain region. Geographers describe urban areas as a macroscopic phenomenon, with spatial and regional characteristics that integrate the national economic capacity and labor forces while concentrating secondary and tertiary industries [6]. These areas have obvious spatial characteristics, including a defined range and a relatively permanent residential area. The Standard for Basic Terminology of Urban Planning defines “urban” as a residential area gathering non-agricultural production and population [7].
In China, due to the evolution of standards and statistical policies, using the administrative region boundary as the data source tends to lead to greater deviations between these boundaries and the physical region. In addition, the Rural-Urban Division Standards, promulgated in 1999, uses the township as the basic unit, resulting in a lower classification accuracy. On the other hand, many researchers delineate urban areas in a given time span through time series analyses and simulations considering multiple factors, such as population, economy, land use, and policy, despite the complex relationships between any two given factors. It is, therefore, important to develop a fast, effective, and accurate system for defining rural-urban divisions in China using modern technology. In this study, we used the city of Xi’an, Shaanxi Province, China to propose and test a new integrated model delineating rural-urban boundaries by multiple indicators, including geography, economics, demography, sociology, and infrastructure, at the census tract scale. This approach allowed us to better define the concepts of “rural” and “urban” as they apply in modern China, providing better guidance for urban planning, sustainable development, urban statistical analyses, administrative division management, and overall urban development policy.
2. Materials and Methods
2.1. Indicators for Rural and Urban Areas
In China, the National Bureau of Statistics approved new rules on the classification of rural and urban (the “Regulations” hereafter) in 2008. The third article of the Regulations defines these areas by administrative division, with consideration of buildings and infrastructure already built or planned, including public facilities and residences. To aid in the improved delineation of rural and urban areas, we defined a set of indicators affecting this determination (Table 1), all of which should be integrated for best results.
2.1.1. Principles for Selecting Indicators
Comparisons between rural and urban areas must occur within the same administrative area to be meaningful and operational. Based on past research, it is most meaningful to consider economic and geographic indicators. However, to reduce the effect of, it is best to use multiple methods and indicators [8].
Chinese scholars have studied the functional space division of regional systems from different research perspectives, and have proposed different concepts, such as spatial functions [9,10], regional functions [11,12], anti-functions [13,14,15], and specific functions [16]. Our study refers primarily to a metropolitan structure model and a regional urban model, the latter of which is mainly driven by the development of industrial and township enterprises, such as in the Pearl River Delta. In addition, numerous researchers have focused on urban development boundaries [17] and peri-urban areas [18,19], which we also considered when selecting indicators. Another influential study used a transdisciplinary approach in the identification of typologies of peri-urban areas and applied it to the Lisbon Metropolitan Area [18], an approach that can contribute to a more targeted implementation of planning and management strategies. Finally, some previous studies used land use and infrastructure as an important index to study the difference between rural and urban areas [20,21] or distinguished between rural and urban areas based on land use and landscape [22,23].
Therefore, when selecting urban-rural indicators, we adhered to the following principles: (1) The indicator must be related to the characteristics of rural and urban areas and must relate to the population, infrastructure, and/or society; (2) due to the limitations of the indicator selection, it is not possible to list all possible indicators, so those used must be widely representative; and (3) all data used must be easily available and useable.
2.1.2. Indicators Establishment
After considering references and available data resources, we decided to build our indicator set with regard to three aspects: Infrastructure and environmental conditions, population size, and residential area size. We intended to select indicators that reflected the characteristics of urban areas and highlighted the differences between rural and urban settings.
1. Infrastructure and Environmental Conditions
This vital set of factors can assess the level of urbanization directly; it includes the seismic performance of buildings, landform conditions, traffic conditions, basic communication conditions, the proportion of high-rise buildings, and the density of horizontal distribution. We used point of interest (POI) density as an indicator here as these are widely and easily available through electronic mapping services, covering items, such as government agencies, companies, shopping malls, hospitals, and restaurants. On the one hand, since POI data is the necessary data for navigation maps, the update speed and level of detail of the navigation data are closely related to urban development. Therefore, it can be understood that the area where the POI is denser is the area where the population is more mobile. On the other hand, different classifications of POIs in a certain area can reflect the degree of urban construction in the area, and thus reflect the level of urbanization. Therefore, the analysis of POI data is of great significance to the rural-urban division. In this paper, the POI data of the same year as the statistical data is selected for analysis to maintain data consistency. As POIs are usually displayed in point format, their density can reflect the relationship between rural and urban areas. As a first attempt at the multi-conditional model building, the distribution of POIs was used as an indicator. More detailed research will be carried out in the future.
2. Population Density
Population is a primary criterion for distinguishing rural and urban areas. In the past few decades, the proportion of the non-agricultural population in the total population has generally been used as an indicator in China. However, due to the large mobility of the Chinese population, this ratio is no longer used as the main criterion for calculating the urbanization rate. Therefore, we used the population density by census block instead.
3. Transportation Infrastructure
The road conditions in rural areas are quite different from those in urban areas. Although most cities in China are externally connected by highways, road conditions in rural areas are less developed. Especially in the mountainous Western China, some rural areas have limited or no external connectivity. Therefore, the density and development of transportation infrastructure is an important indicator for distinguishing between rural and urban areas.
4. Spatial Characteristics
In China, the demographic census is conducted by area. In the 2010 National Population Census, the National Bureau of Statistics added “census tracts” as the smallest unit in the census; each census area was divided into census tracts according to the workload that a census clerk can undertake. The spatial distribution of these census tracts can also reflect the level of population concentration, so we used census tract density to distinguish rural and urban areas. The study area contained 3713 census blocks and 35,368 census tracts.
In addition to these four indicators, we chose the “Neighborhood Committee” from a semantic perspective. We have selected POI density, population density, road network density, census tracts density in blocks from the conditional judgment (Table 2). We then selected the absolute urban areas as the first step, then assessed the indicators; the more indicators a given area satisfied, the higher level of urbanization it represented.
2.2. Methods
2.2.1. Technical Approach
We developed an integrated rural-urban boundary delineation model using existing data (Figure 1). First, five data sources were digitized using ArcGIS 10.2 software and projected into a standard coordinate system with any necessary corrections. Next, we used three analytical methods to produce data-based indicators and obtained five output layers for conditional judgment. This allowed us to extract theoretical rural-urban boundaries. We then extracted typical sample areas from the overall results and compared them with the rural-urban division defined by the National Bureau of Statistics in 2010, using imagery and field observations to check whether a typical area should be considered urban. We then obtained the final rural-urban division results and the rural-urban boundary.
2.2.2. Threshold Determination
We used the cumulative percentage method to confirm the standards for urban areas. This is the amount of data distributed in each group after the data is sorted by a certain variable. The ratio of each group’s frequency to the total is the proportion, while the sum of frequencies below or above a certain value is the cumulative percentage. Rising values are considered upward accumulation; the final cumulative value is 100%. We used a combination of qualitative and quantitative methods to determine the rural-urban division. First, we conducted random sampling of data points and removed abnormal data. Next, we obtained the frequency distribution histogram of urban attributes, and used statistical analysis to determine the indicator threshold used to distinguish urban and rural areas.
2.2.3. Multi-Factor Spatial Superposition
Overlay analysis is a common method for extracting implicit information from spatial data. In a geographic information system (GIS) context, superimposing two data layers combines or relates their attributes, allowing the comparison of spatial and attribute relationships. This method can combine visual information, points, lines, polygons, and grids.
We used the multi-factor spatial superposition method [14] with several influencing factors to filter the study area’s census tracts and obtain multiple condition judgments. The resulting rural-urban attributes were exported to obtain the macro-scale division of rural-urban areas.
2.2.4. Study Area
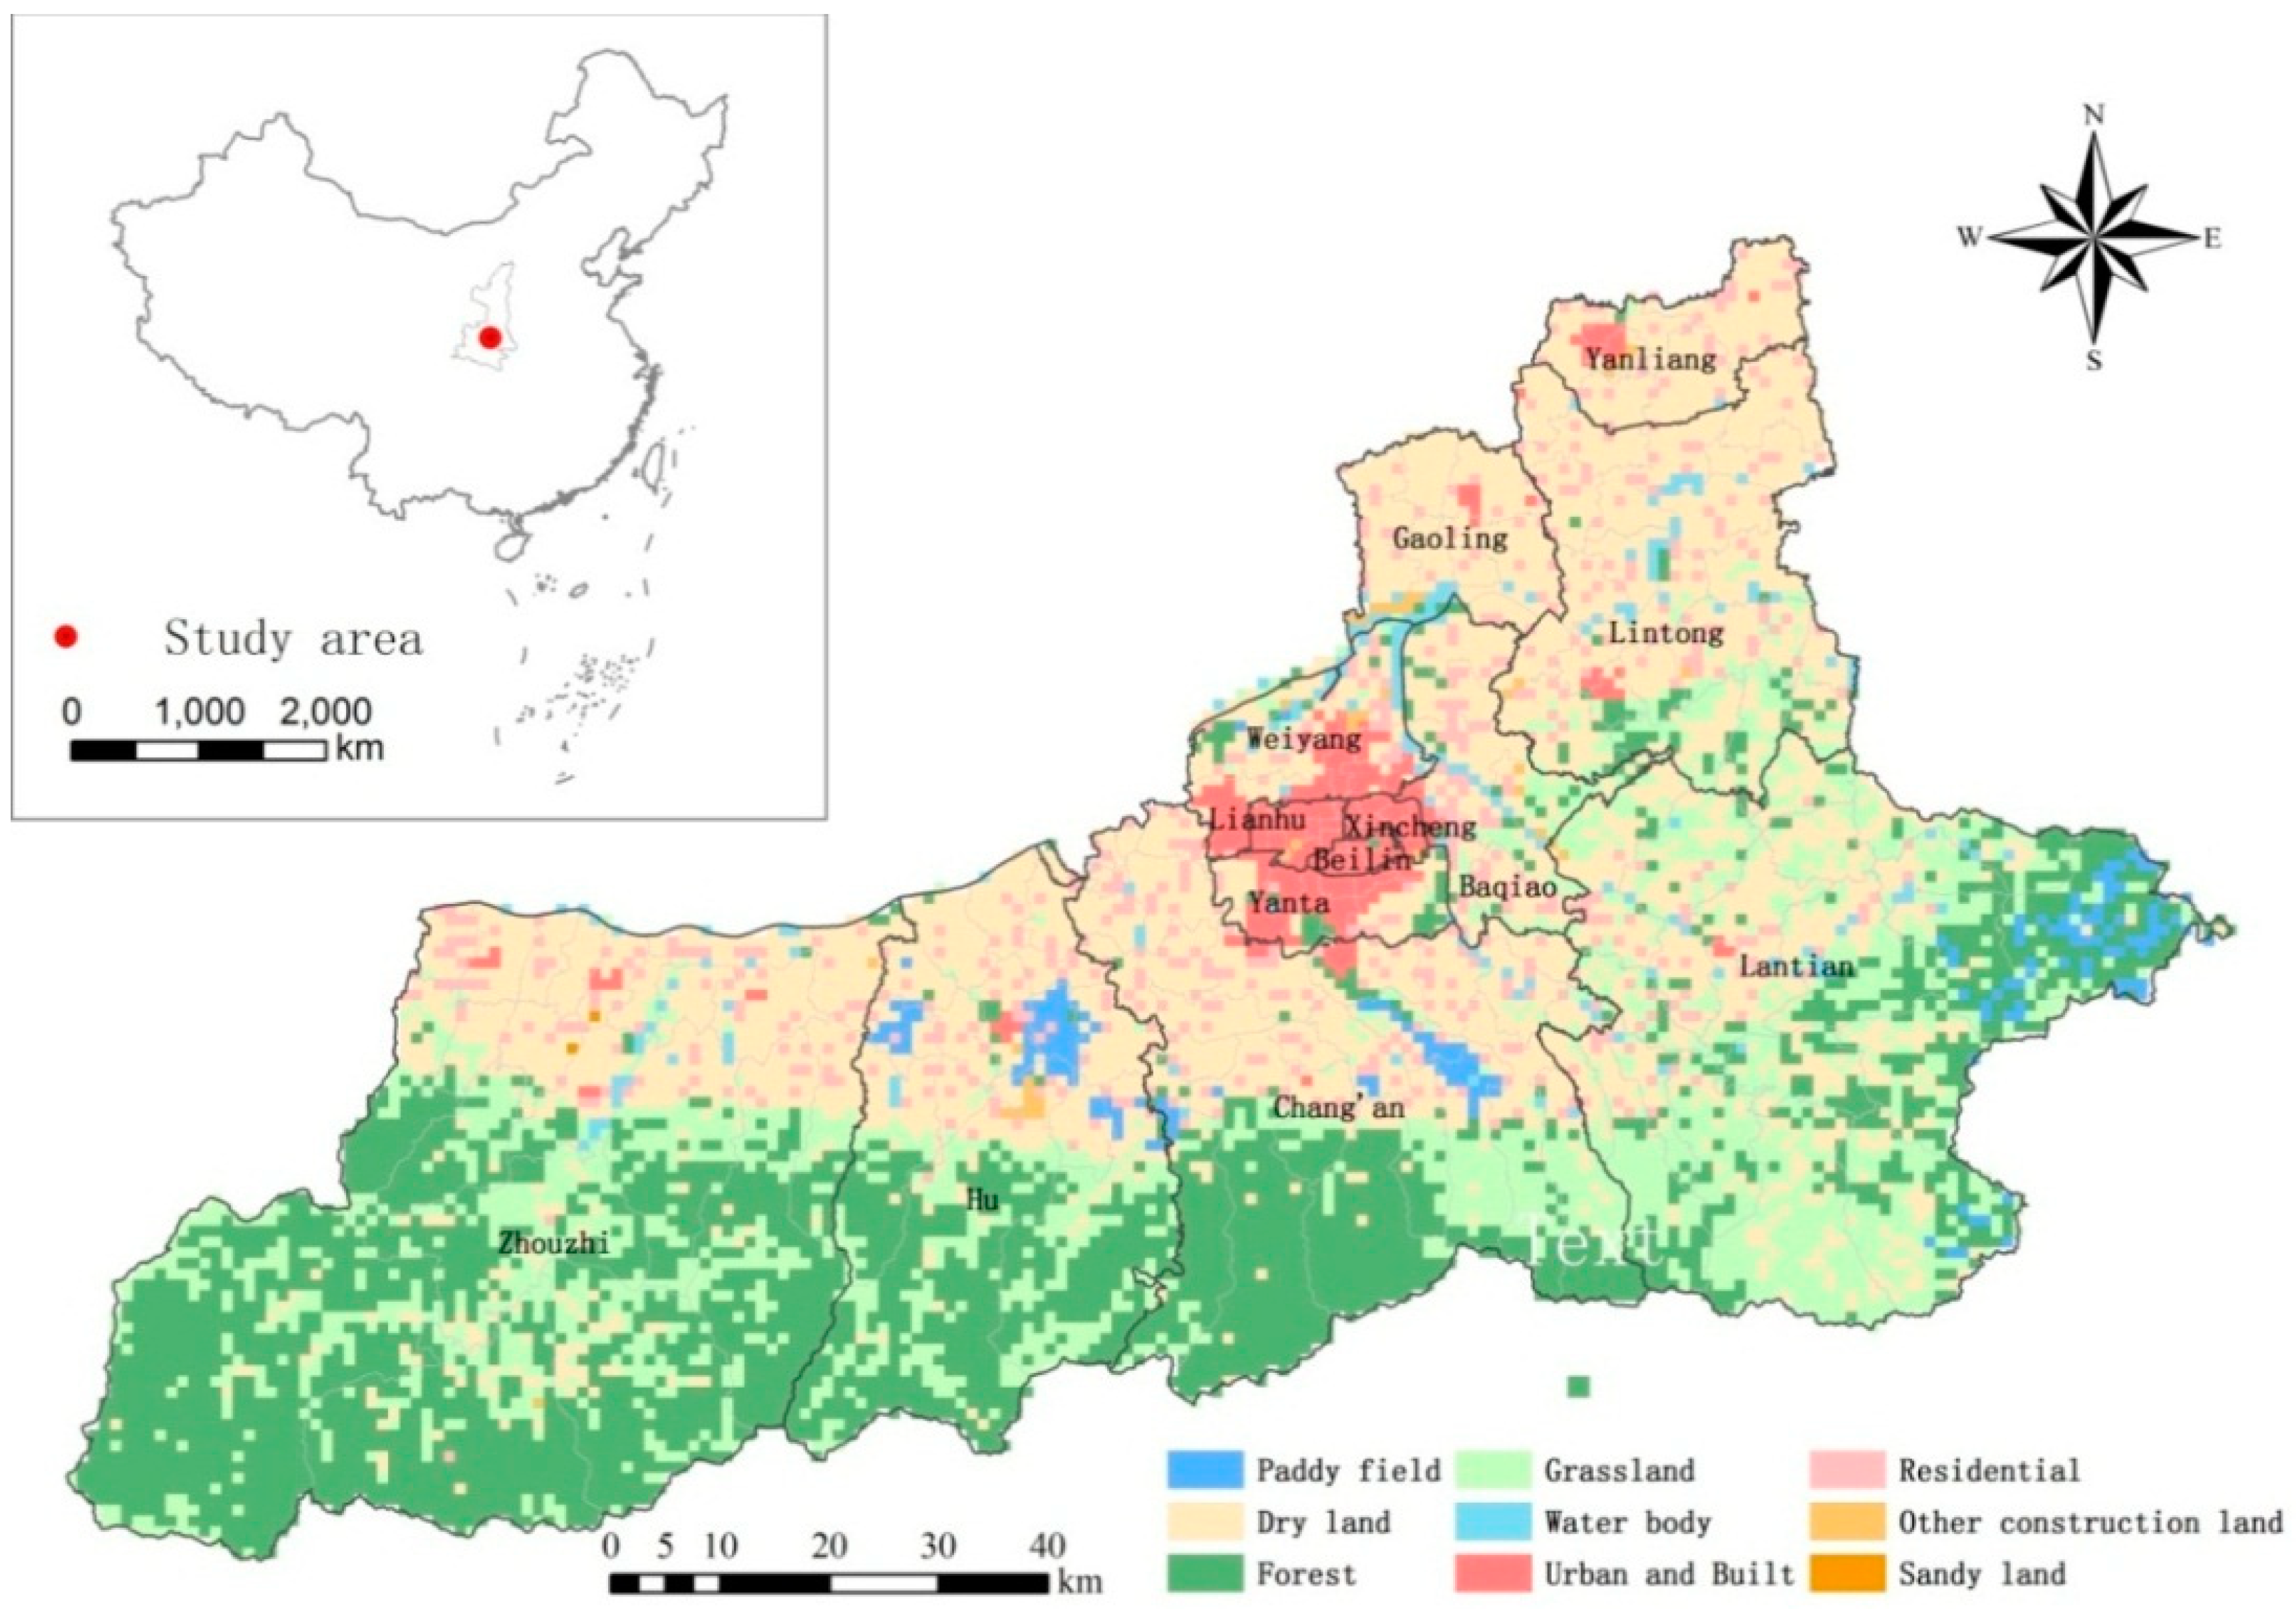
Xi’an is located in the Guanzhong Basin, with the Weihe River to the north and the Qinling Mountains to the south. As of 2017, it was comprised of eleven districts and two counties: Xincheng District, Beilin District, Lianhu District, Yanta District, Weiyang District, Changan District, Baqiao District, Yanliang District, Lintong District, Gaoling County, Hu County, Zhouzhi County, and Lantian County (2010), covering a total area of 10,106.2 km2. The area’s average elevation is 424 m, although the elevation range is the highest among all comparable cities in China. It has a warm temperate monsoon climate, with an annual temperature of ~15 °C and an annual rainfall of ~600 mm. Xi’an is a transportation hub for aviation, railways, and highways in Western China, with a registered household population in 2010 of 7,960,000. During Xi’an’s rapid urbanization, two areas were revised from district to county within five years, so the urbanization rate based on administrative divisions appears much higher than the actual value.
The land use in the study area is shown in Figure 2. The data was based on the Landsat TM/ETM remote sensing image as the main data source, which is generated by manual visual interpretation. Land use types include 6 primary types and 25 secondary types of cultivated land, forest, grassland, water area, residential land, and unused land. In the subject of the paper, the authors combined land use types into 9 categories, including paddy field, dry land, forest, grass land, sandy land, water body, urban and built, residential, and other construction land (Figure 2).
The base data used in this study included the Xi’an City’s digital elevation model (DEM) data, population statistical data, the vectorized data of road network data and point of interest (POI), and other relevant data (Table 3). The main research unit is the minimum unit according to the sixth census. The normalization of data is especially important. All data were corrected by developing a unified projected coordinate system.
3. Results
3.1. Threshold Determination
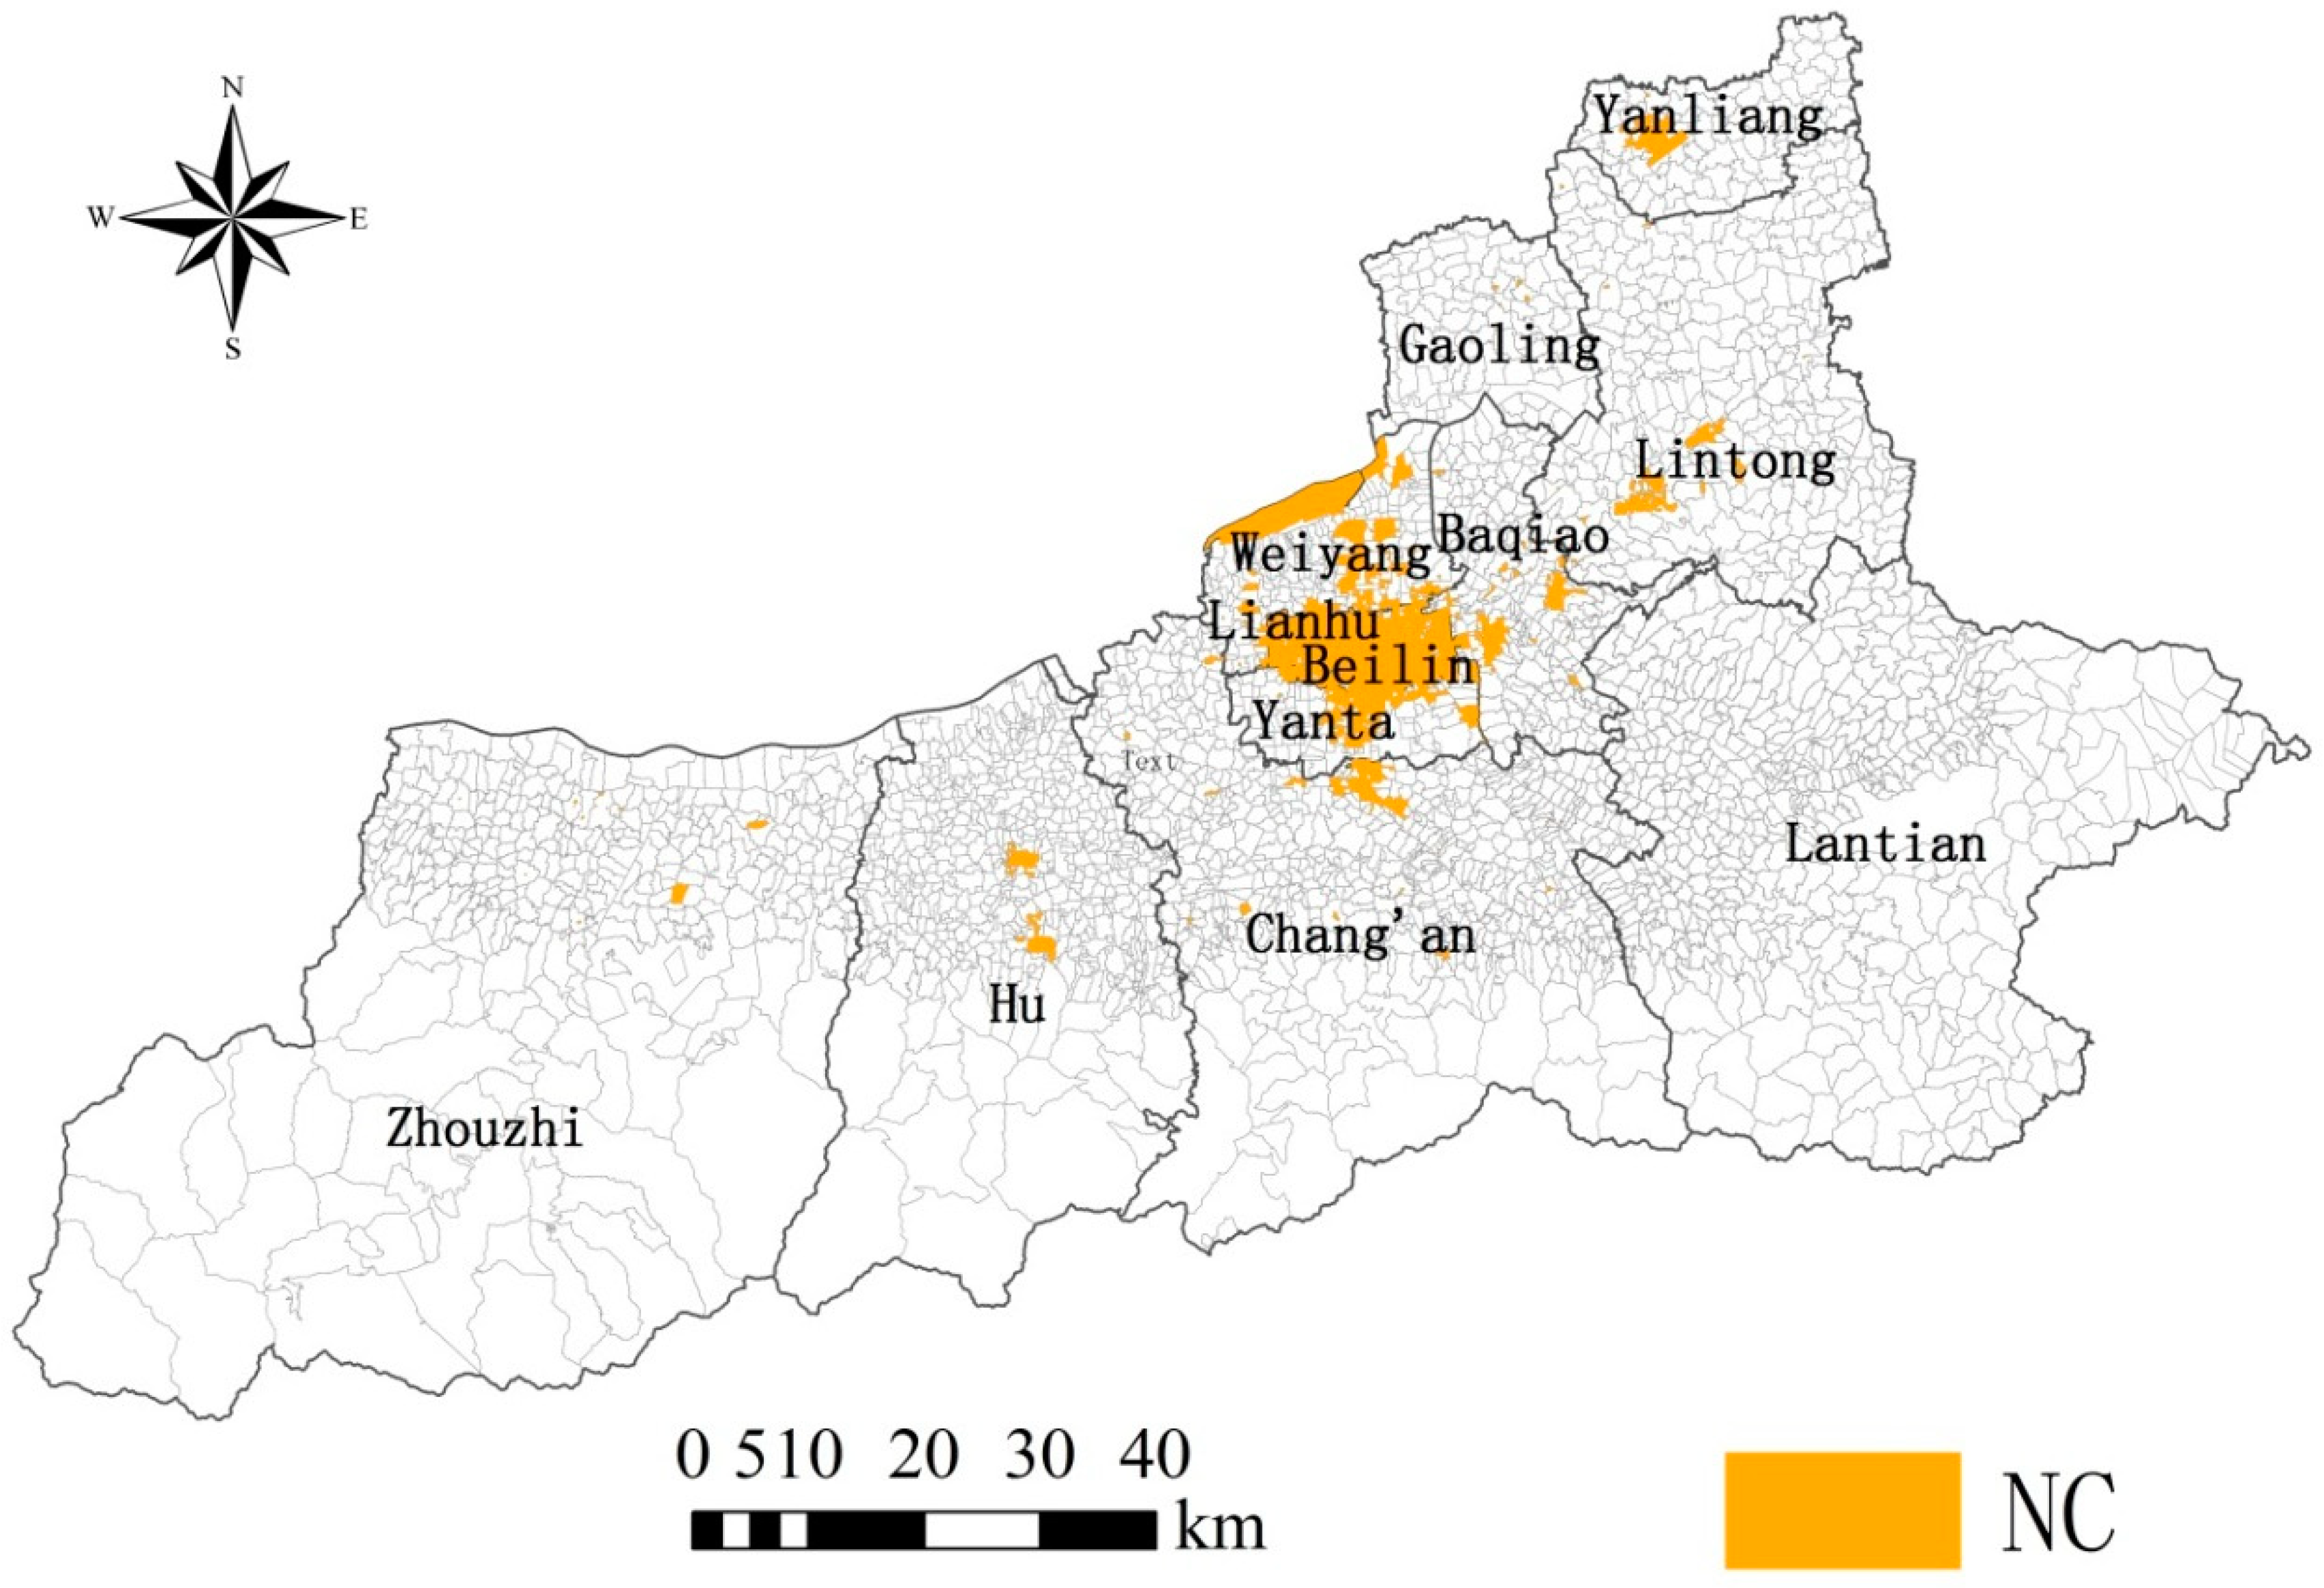
First, we extracted the absolute urban areas based on the semantic connotation, in which census tracts, including the “neighborhood committee”, were preferentially selected (Figure 3). Next, we overlapped the remote sensing image and the selection result, then enlarged the area of the main city. The neighborhood committee area primarily covered the central downtown area, reflecting its urban characteristics.
Second, we determined the threshold values of various indicators using mathematical statistics and remote sensing images. For example, to determine the population density threshold in census blocks, we divided these into 19 bins and plotted them on a histogram, and then calculated the cumulative frequency (Figure 4).
The population density data of the census block was processed, and after the removal of the abnormal point, the frequency distribution histogram of the population density of the census block was obtained (Figure 4). Looking at the cumulative frequency curve of Figure 4, when the density of the population (DOP) reached 1100 people/block, the first turning point began to appear, and the cumulative frequency reached more than 60%. When the DOP reached 1300 people/block, the cumulative frequency was over 70%. Therefore, we identified the population density bins of 1100, 1200, and 1300 people/block as turning points in the trend where the frequency slope was gentler, and used these to generate population density maps (Figure 5). By overlapping these maps with high-resolution remote sensing images, the degree of fitting of the boundary between the main urban construction contour and the population density distribution result was compared. We determined that a population density of 1200 was closest to the threshold for urbanization in Xi’an, and used this value as an indicator for each census block.
We used similar methods to determine thresholds for the census tract, POI, and road network density indicators. The final criteria for determining rural-urban divisions are shown in Table 4.
3.2. Empirical Results
Using the thresholds given in Table 4, we used ArcGIS 10.2 to classify all census blocks in the study area by the extent to which they met each condition; this involved filling the missing parts of the main urban area, processing the peripheral part of the main urban area, processing the discrete map of the rural and urban areas, treating the noise of the discrete pattern spots in the rural areas, and patch processing around the satellite towns. The final map shows the boundaries dividing urban and rural areas in which the more thresholds were exceeded, and the more likely the area was to be urban (Figure 6). The most likely urban areas were in the main city of Xi’an and satellite towns in Zhouzhi County, Lantian County, Hu County, Lintong District, Yanliang District, and Gaoling District. The area satisfying all five conditions formed a contiguous urban zone that included the main city of Xi’an and parts of the adjacent Changan District and Baqiao District, as well as a small number of administrative units in the Zhouzhi County, Hu County, Lantian County, Lintong District, Yanliang District, and Gaoling District. This shows that it is possible to judge the county area by local government; this is verified in a later section.
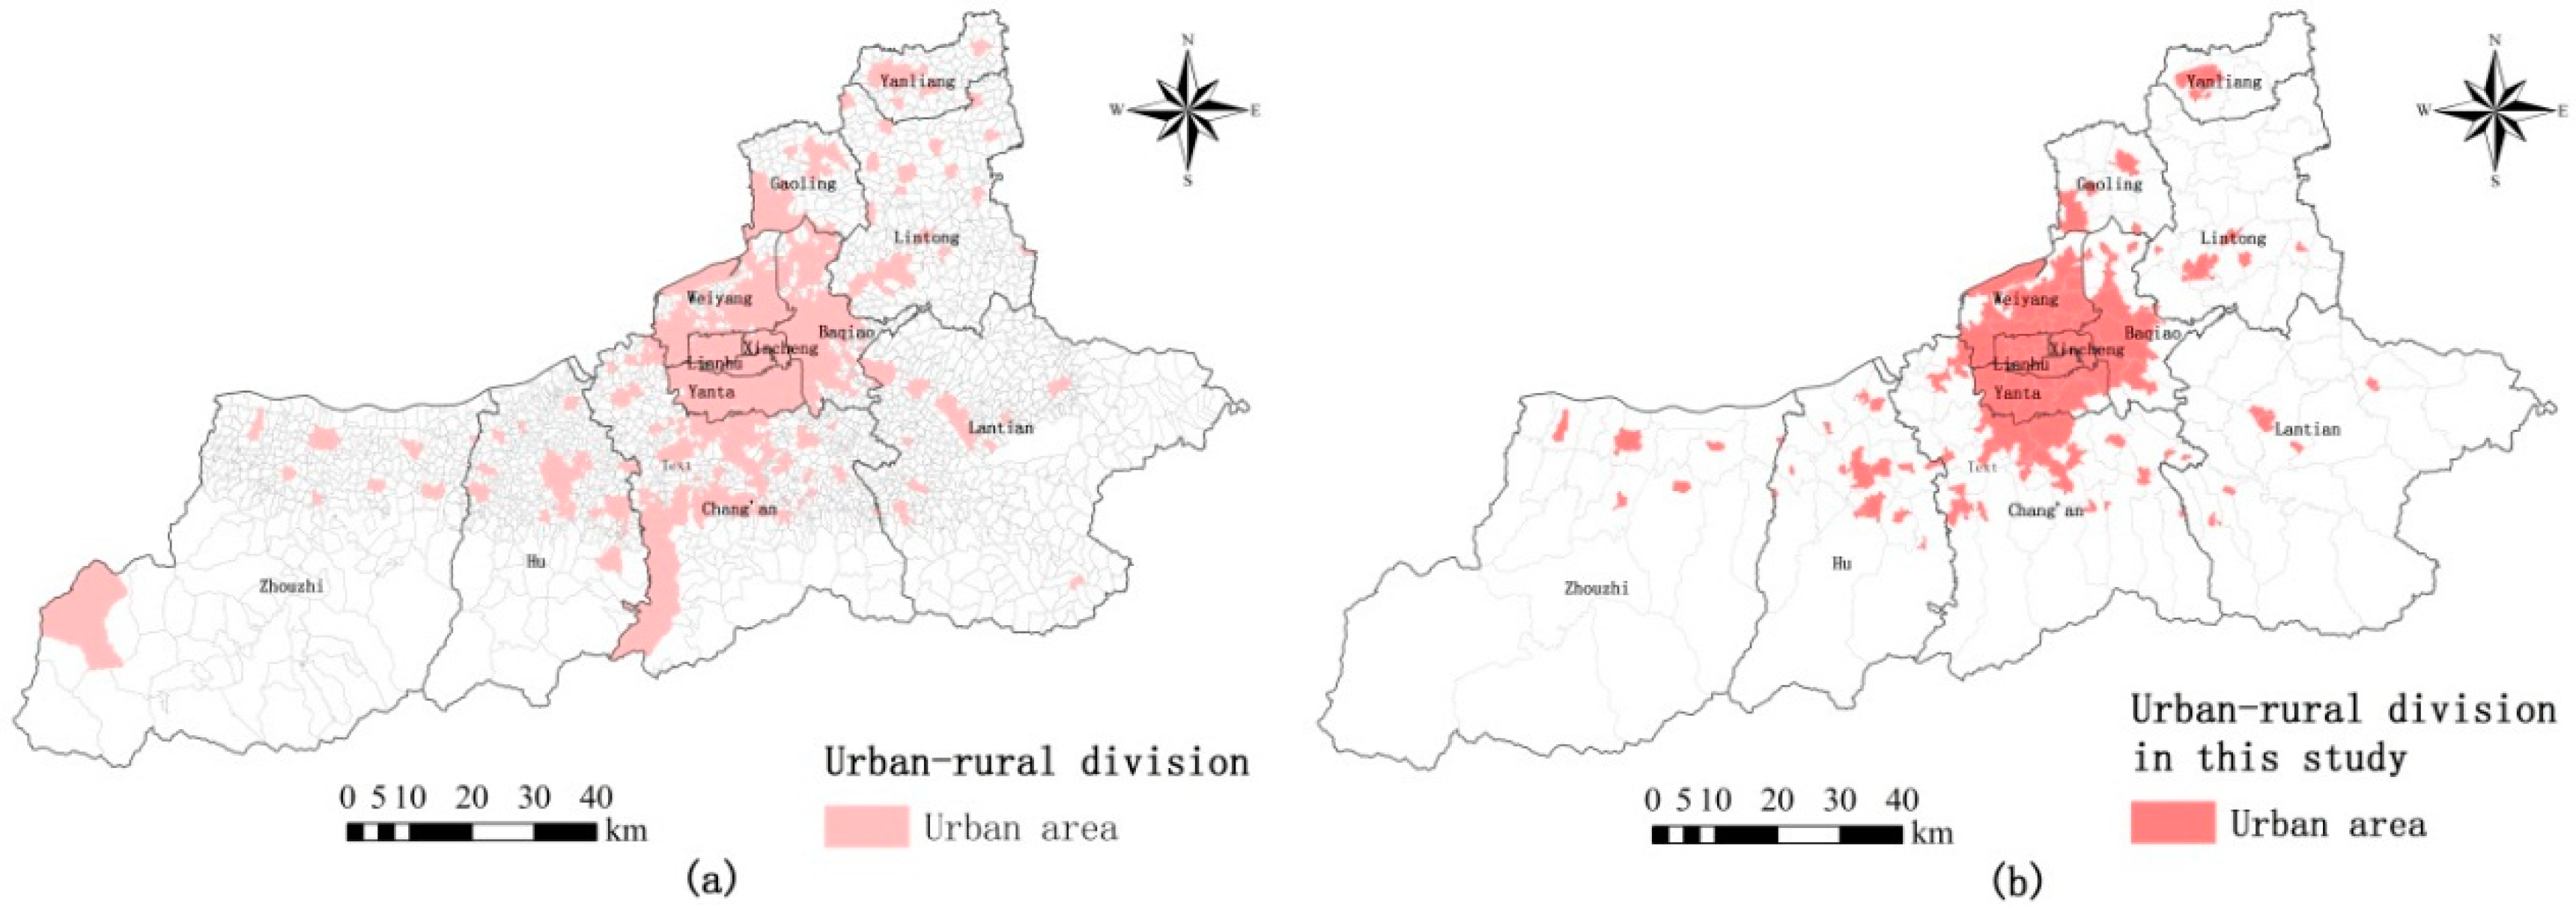
3.3. Comparison with National Bureau of Statistics
A comparison of our results with the classifications defined by the National Bureau of Statistics in 2010 showed that the range of urban areas defined by our model was smaller (Figure 7). The main urban areas of Xi’an (including Weiyang District, Lianhu District, Xincheng District, Yanta District, and Baqiao District) have obvious attributes of urban areas, so these parts of the main city zone meet the five conditions and can be defined as urban areas. Likewise, the suburbs and the main townships in other county areas also meet multiple conditions and can be directly identified as urban areas.
Our results defined a smaller number of census blocks as urban as compared with data from the National Bureau of Statistics (Table 5), representing an area that was 621.87 km2 smaller and a population that was 269,616 people smaller. In other words, our methods defined an urbanization rate that was 3.24% lower.
Superimposing both datasets identified areas defined by both methods as urban (Figure 8). One noticeable difference occurred in portions of the southern mountainous area of Xi’an, where the National Bureau of Statistics marked more areas as urban than our results did.
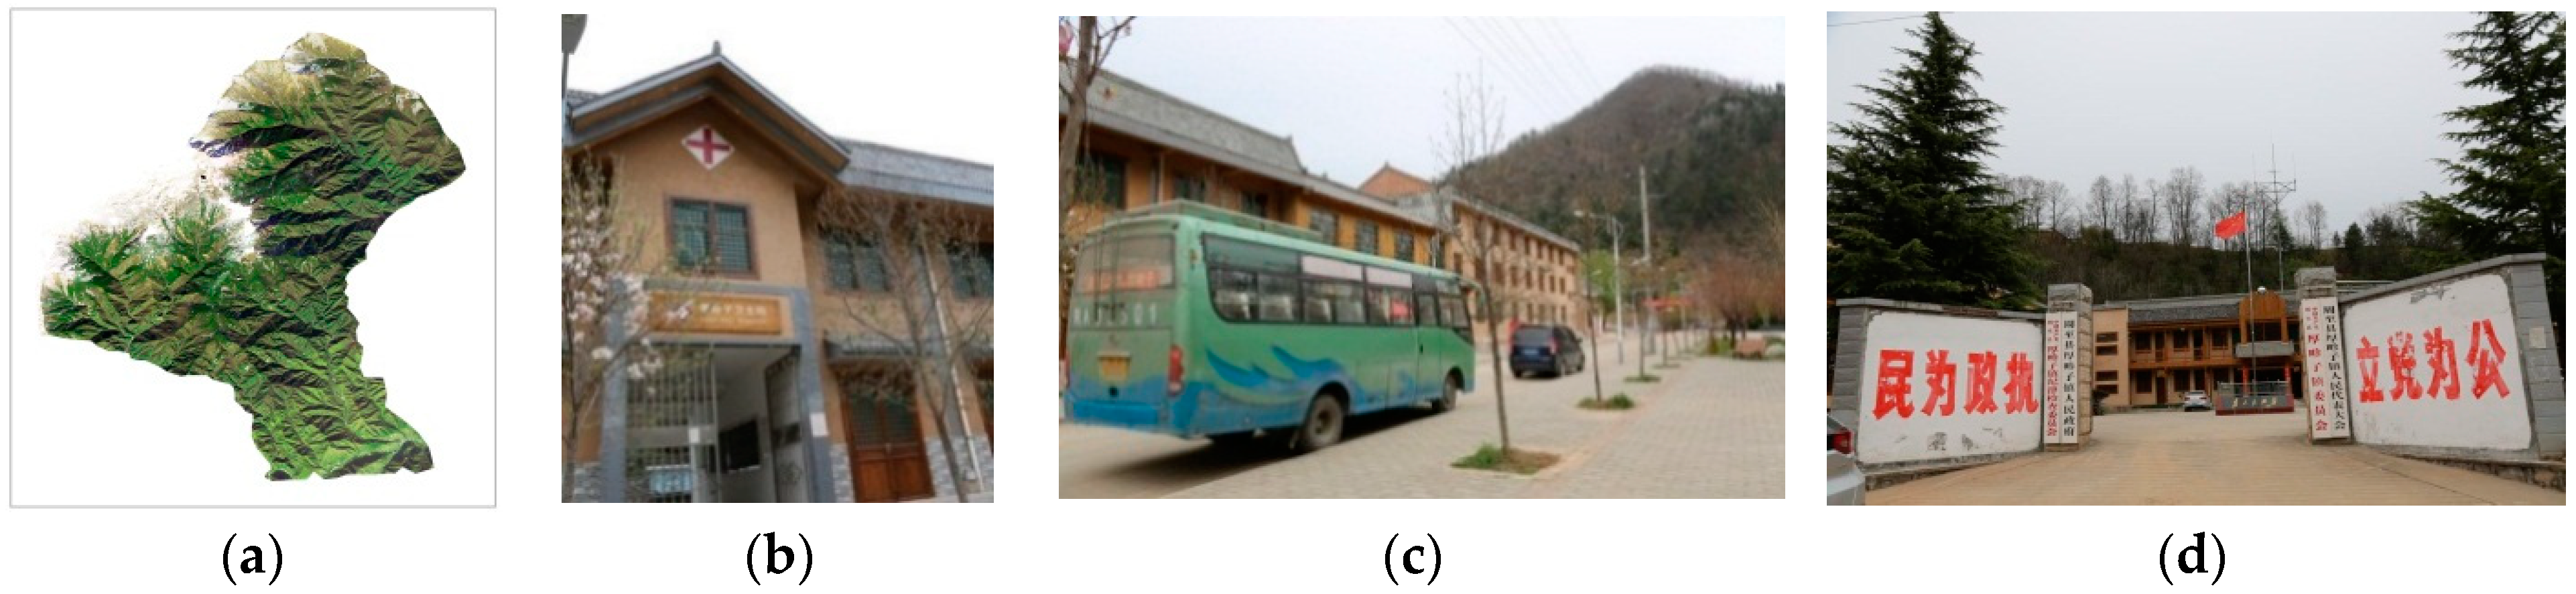
For example, the National Bureau of Statistics (NBS) identified the Houzhenzi Village Committee as urban, although inspection of satellite imagery showed that this is a mountainous area with limited urban characteristics (Figure 9). Field checks demonstrated that the level of infrastructure here was far from that of urban areas (Figure 9). This area has 280 permanent residents (of which 121 are urban) with a population density of 2.1 people/km2, far below the level of urban areas. There is only one commercial street that is 100 m long and the only medical facility is a health center (lower than a hospital). The transportation facilities are limited to roadside bus stops connecting to the Zhouzhi County. Unlike the NBS, our results did not classify this as an urban area.
4. Discussion
Unlike most research on determining the rural-urban boundary, we used a more integrated approach to this issue that has three advantages over current methods. First, as the comparison with NBS data showed, our results were narrower and more precise. Our use of the multiple-conditions model allowed the quantitative identification of urban areas and impact factor thresholds, resulting in a more accurate rural-urban boundary. Also, the basic unit in this study matched the smallest census unit, increasing the precision with which we could calculate the urbanization rate. Our use of data covering many societal and geographic factors allowed the rapid and accurate determination of urbanization, making this approach convenient for management, planning, and policy design.
Second, our approach uses a more broadly based definition of rural and urban that considered more attributes of these areas and allowed for a more comprehensive and integrated view of the subject. The definitions we used reflect a multi-disciplinary view that goes beyond the traditional focus on narrow factors, such as population density or non-agricultural population. The 3.24% reduction in the urbanization rate shown in our results confirms the scientific validity of using this broader set of rural-urban attributes.
Third, our approach has provided interesting insights into the spatial patterns of rural and urban areas. Previous researchers have assumed that the most obvious characteristics of rural-urban boundaries include changes in land use or the proportion of urban population. However, we applied geospatial, economic, demographic, and societal factors to improve the accuracy of this determination. Using our five conditions, we determined that the “Neighborhood Committee” areas could be considered urban areas as they are generally located in city centers and are exclusively or mainly composed of urban areas and other artificial surfaces with the highest population density in the city.
However, with the development of the big data era, more and more data information can be obtained and used in the work of the rural-urban division. How to integrate the massive data of different disciplines and use them in this research must become a major research direction.
5. Conclusions
Rapid urbanization in China has created a high degree of urbanization along with various related problems. We combined the cumulative percentage method and high-resolution remote sensing images to establish a multi-condition judgment model that could better determine the boundary between rural and urban areas. This model considered the density of road networks, points of interest, population, and census tracts (based on the minimum census units) to assess the urbanization level of Xi’an, China from multi-disciplinary demographic, economic, and societal perspectives. Field research and comparisons with data from the National Bureau of Statistics showed that the quantitative rural-urban boundary determined by this model was more precise, with a 3.24% lower urbanization rate. The resulting data allowed rural-urban boundaries in Xi’an City to be mapped objectively, representing an innovative and improved method for studying the essential differences between rural and urban areas.
The accurate identification of rural and urban boundaries achieved by this new model can provide strong technical support for further research on urban and rural planning, while helping scholars establish a deeper understanding of these areas and their spatial distribution. Such results can be used to guide urban planning and construction to allocate resources (such as transportation) more efficiently to avoid waste, and can promote mutual cooperation among regions toward improving urban development in China.
Although this research was necessarily limited to a relatively narrow case study area, given its initial success, we intend to apply the methods to other parts of China in future work to further explore its applicability. Doing so will help us determine how this approach can be more widely applied to gain a better understanding of rural and urban areas. As urban planning and territorial management always seek to ensure greater efficiency through improved knowledge, the adoption of a multi-conditional method allows a more precise determination of rural and urban characteristics, which can better guide policies.
Author Contributions
L.F. and Y.W. conceived the paper and experiments; L.F. and Y.W. performed the experiments; L.F. analyzed the data; L.F. wrote the paper.
Funding
This research was funded by National Bureau of Statistics and UNICEF (United Nations International Children’s Emergency Fund).
Acknowledgments
The authors gratefully acknowledge the supported of National Bureau of Statistics and UNICEF (United Nations International Children’s Emergency Fund). Thanks are due to all scientists involved in UNICEF project-The sixth census data gridding and rural-urban demarcation monitoring.
Conflicts of Interest
The authors declare no conflict of interest.
References
- Zhou, Y.; Si, Y. Establishing the Concepts of Physical Urban Area in China. J. Geogr. Sci. 1995, 4, 289–301. (In Chinese) [Google Scholar]
- Zhou, Y. Urban Geographic Exploration; Zhou Yixing Collection; Commercial Press: Beijing, China, 2001. (In Chinese) [Google Scholar]
- State Council of the PRC. The Provisions on the Division of Rural and Urban Areas by Statistics. 2008. Available online: http://www.stats.gov.cn/tjsj/tjbz/200610/t20061018_8666.html (accessed on 25 July 2018).
- Robin, J.P. Defining the Rural-Urban Fringe. Soc. Forces 1968, 47, 202–215. [Google Scholar]
- Barrett, A.; Gregory, S. Ethnoracial Diversity across the Rural-Urban Continuum. Ann. Am. Acad. 2017, 672, 26–45. [Google Scholar]
- Wang, Y.A. Study on China’s Criteria for the Rural-Urban Division. Master’s Thesis, Southwest Jiaotong University, Chengdu, China, 2012. (In Chinese). [Google Scholar]
- Ministry of Construction of the PRC. Standard for Basic Terminology of Urban Planning; Ministry of Construction of the PRC: Beijing, China, 1999.
- Tang, L.; Ruth, M.; He, Q.; Mirzaee, S. Comprehensive evaluation of trends in human settlements quality changes and spatial differentiation characteristics of 35 Chinese major cities. Habitat Int. 2017, 70, 81–90. [Google Scholar] [CrossRef]
- Jin, X.; Wang, H.; Tu, J.; Zhang, Z. To assess comprehensive urban environmental quality with multi-factor space superposition assessment method. Adm. Technol. Environ. Monit. 2009, 3, 561–570. (In Chinese) [Google Scholar]
- Chen, W.; Duan, X.; Chen, J. Methods for Dividing Spatial Development Functional Zones. J. Geogr. Sci. 2004, S1, 53–58. (In Chinese) [Google Scholar]
- Xie, G.; Lu, C.; Zhen, L. The Purpose, Progress, and Mothed for Regional Spatial Functional Zone Division. Geogr. Sci. Res. 2009, 3, 561–570. (In Chinese) [Google Scholar]
- Jiang, A. Main Functional Zone: New Frontier and New Practice of Regional Development. Theory Dev. Res. 2007, 2, 14–17. (In Chinese) [Google Scholar]
- Wu, F.; Webster, C.J. Simulation of land development through the integration of cellular automata and multicriteria evaluation. Environ. Plan. B 1998, 5, 103–126. [Google Scholar] [CrossRef]
- Li, X.; Yang, Q.; Liu, X. Geographical Simulation System: Cellular Automation and Multi-Agent; Scientific Press: Beijing, China, 2007. (In Chinese) [Google Scholar]
- Wang, C.; Zhao, H.; Sun, G. Optimizing Main Functions to Develop Functional Region Division in Counties: A Case Study of Shangyu. Geogr. Sci. Res. 2007, 3, 481–490. (In Chinese) [Google Scholar]
- Liu, C.; Zeng, J. Regional Spatial Supply-Demand Model and Spatial Structural Optimization Route Selection—Scientific Basis for Functional Zone Construction. Econ. Geol. 2009, 1, 26–30. (In Chinese) [Google Scholar]
- Liu, J.; Zhang, G.; Zhuang, Z.; Cheng, Q.; Gao, Y.; Chen, T.; Huang, Q.; Xu, L.; Chen, D. A new perspective for urban development boundary delineation based on SLEUTH-InVEST model. Habitat Int. 2017, 70, 13–23. [Google Scholar] [CrossRef]
- Gonçalves, J.; Gomes, M.C.; Ezequiel, S.; Moreira, F.; Loupa-Ramos, I. Differentiating peri-urban areas: A transdisciplinary approach towards a typology. Land Use Policy 2017, 63, 331–341. [Google Scholar] [CrossRef]
- Jorge, G.; Marta, C.G.; Sofia, E. Defining mobility patterns in peri-urban areas: A contribution for spatial and transport planning policy. Case Stud. Transp. Policy 2017, 5, 643–655. [Google Scholar]
- Cheng, M.; Lu, Y. Investment efficiency of urban infrastructure systems: Empirical measurement and implications for China. Habitat Int. 2017, 70, 91–102. [Google Scholar] [CrossRef]
- Julia, B.; John, R.L. Schools at the Rural-Urban Boundary: Blurring the Divide. Ann. Am. Acad. 2017, 672, 185–201. [Google Scholar]
- Peng, J.; Zhao, S.; Liu, Y.; Tian, L. Identifying the urban-rural fringe using wavelet transform and kernel density estimation: A case study in Beijing City, China. Environ. Model. Softw. 2016, 83, 286–302. [Google Scholar] [CrossRef]
- Mattias, Q. Landscapes out of order: Studying the inner urban fringe beyond the rural-urban divide. Geogr. Ann. Ser. B Hum. Geogr. 2018, 89, 269–282. [Google Scholar]
Figure 1.
Flow chart of the model used for the identifying the rural-urban boundary in Xi’an, China.
Figure 1.
Flow chart of the model used for the identifying the rural-urban boundary in Xi’an, China.

Figure 2.
Study area: Location of Xi’an in the Shaanxi Province (inset) and LUCC of Xi’an with districts and counties. (Land use data source: Resource and Environment Data Cloud Platform, Institute of Geographic Sciences and Natural Resources Research, CAS.).
Figure 2.
Study area: Location of Xi’an in the Shaanxi Province (inset) and LUCC of Xi’an with districts and counties. (Land use data source: Resource and Environment Data Cloud Platform, Institute of Geographic Sciences and Natural Resources Research, CAS.).

Figure 3.
Neighborhood committee (NC) distribution by census block.

Figure 4.
Histogram of the population density in census blocks.

Figure 5.
Distribution of different population densities by census block.

Figure 6.
Classification results by census block. Areas exceeding threshold conditions (defined in Table 4) are more likely to be urban.
Figure 6.
Classification results by census block. Areas exceeding threshold conditions (defined in Table 4) are more likely to be urban.

Figure 7.
Comparison of urban areas defined by (a) the National Bureau of Statistics and (b) this study.
Figure 7.
Comparison of urban areas defined by (a) the National Bureau of Statistics and (b) this study.

Figure 8.
Superimposed results for urban designations from this study and the National Bureau of Statistics.
Figure 8.
Superimposed results for urban designations from this study and the National Bureau of Statistics.

Figure 9.
Images from the Houzhenzi Village Committee, defined as urban by the National Bureau of Statistics (NBS) and rural by our methods: (a) Satellite image; (b) health center; (c) commercial street; and (d) government building.
Figure 9.
Images from the Houzhenzi Village Committee, defined as urban by the National Bureau of Statistics (NBS) and rural by our methods: (a) Satellite image; (b) health center; (c) commercial street; and (d) government building.


Table 1.
Indicators affecting the distinction between rural and urban areas.
| Structural Content | Functional Content | ||
|---|---|---|---|
| Definition | Delineation | Definition | Delineation |
| Location | Census categories | Social orientation | Political, economic, and cultural center (or not) |
| Administration | Census units | Population density | Density of population in census unit or smaller unit |
| Scale | Shape and size of area | Census unit | The workload for each enumerator per day in the census |
| Residential area | Extend of non-agricultural economic activities | Road network | Different grades of road network construction |
| Population density | People per spatial unit | Utility services | Area served by specific services (or not) |
| Infrastructure | Density per spatial unit | Building construction | Area, height |
Table 2.
Classification of urbanization attribute indicators.
| Principles | Notes on Rural and Urban Attributes |
|---|---|
| Semantic perspective | The census units containing the name “Neighborhood Committee” are selected as absolute urban areas. |
| Conditional judgment | The density of permanent resident populations based on census block. |
| The density of census tracts based on census blocks. | |
| POI density based on census blocks. | |
| Road network density based on census blocks. |
Table 3.
Data sources (all data from 2010).
| Data Type | Details |
|---|---|
| Vectorized | Census tracts |
| Road networks | |
| POIs | |
| Demographics | |
| Geographic | DEM (30 × 30 m) |
| Other | Statistical census |
| Remote sensing imagery (5 × 5 m) |
Table 4.
Multi-factor standards for determining the boundary between rural and urban areas.
| Indicator | Meaning | Features | Threshold |
|---|---|---|---|
| Neighborhood committee in census block | Committees of residents, communities, etc. | Directly defined as rural or urban areas | Already defined as rural or urban |
| Population density in census block | Population | Max value: 616,305 Minimum value: 0 Mean value: 6478.19 | 1200 people/block |
| Census tracts density in census block | Number of census tracts in census blocks | Max value: 2133.96 Minimum value: 0 Mean value: 26 | 5 unit/block |
| POI density in census block | Density of infrastructure | Max value: 1787.61 Minimum value: 0 Mean value: 58 | 10 unit/block |
| Road network density in census block | Transportation infrastructure | Max value: 60,480.1 Minimum value: 0 Mean value: 3706.17 | 3500 |
Table 5.
Comparison of study results and statistical data.
| Urban/Rural Indicators | This Study | National Bureau of Statistics (2010) |
|---|---|---|
| Number of urban census blocks | 1257 | 1370 |
| Total urban area | 957.34 km2 | 1579.21 km2 |
| Population | 5,429,354 | 5,698,970 |
| Urbanization rate | 65.36% | 68.6% |
© 2018 by the authors. Licensee MDPI, Basel, Switzerland. This article is an open access article distributed under the terms and conditions of the Creative Commons Attribution (CC BY) license (http://creativecommons.org/licenses/by/4.0/).
Share and Cite
MDPI and ACS Style
Fang, L.; Wang, Y. Multi-Disciplinary Determination of the Rural/Urban Boundary: A Case Study in Xi’an, China. Sustainability 2018, 10, 2632. https://doi.org/10.3390/su10082632
AMA Style
Fang L, Wang Y. Multi-Disciplinary Determination of the Rural/Urban Boundary: A Case Study in Xi’an, China. Sustainability. 2018; 10(8):2632. https://doi.org/10.3390/su10082632
Chicago/Turabian StyleFang, Lei, and Yingjie Wang. 2018. "Multi-Disciplinary Determination of the Rural/Urban Boundary: A Case Study in Xi’an, China" Sustainability 10, no. 8: 2632. https://doi.org/10.3390/su10082632
Note that from the first issue of 2016, this journal uses article numbers instead of page numbers. See further details here.