1. Introduction
Exposure to extremely low frequency electromagnetic fields (ELFs) is almost inevitable almost anywhere in the world in populations with a certain degree of development and well-being. Exposure in homes comes from home wiring but mainly from electrical and electronic appliances and equipment connected to the grid within the home. Typically, an extremely low frequency magnetic field (ELF-MF) of around 1 mG (0.1 μT), 50 Hz, is detected inside a typical house in Spain [
1,
2]. Normally there is more magnetic field where there is a higher consumption of electric current, and these higher levels are mainly observed in the kitchen, where the refrigerator is always connected, but consumes power when the compressor is started up, the electric stove consumes power by resistance or induction, and the electric oven, the extractor fan, the various small electrical appliances and the microwave oven consumes power when started up from time to time. It is worth mentioning that of all of them it is the microwave that produces the greatest magnetic induction in the kitchen by far with respect to other household appliances and this is due to its high power consumption to power the magnetron, when the microwave oven is turned on the MF exceeds 0.5 μT in almost half of the kitchen, although this exposure is of short duration since the microwave is running for only a few minutes.
Other sources of exposure that go unnoticed by residents and are under their control are speakers on stereos and radio receivers connected to the wall socket, which in some cases are in the bedroom headboards. However, there is fear and concern about possible exposure to electromagnetic fields from high- and medium-voltage wiring and transformer stations, especially internal transformer stations (TSs), which in Spain are commonly located inside residential buildings on the ground floor. In these cases, the fear comes from a combination of ignorance of exposure levels and lack of control over them, which obviously depends on the supply of electrical power to communities and industrial and service areas through wiring and TSs.
Is there an objective basis for justifying residents’ concerns? From an epidemiological standpoint, a first study in 1979 [
3] found that the pediatric population living near high-current wiring configurations doubled the risk of leukemia. These epidemiological results were confirmed in two combined analyses [
4], which with a cut-off level of 0.3 μT found an odd ratio (OR) of 1.7 (95% CI: 1.2–2.3), and with a cut-off level of 0.4 μT [
5] observed an OR of 2.0 (95% CI: 1.3–3.1). Based on these epidemiological studies, the International Agency for Research on Cancer (IARC) classifies ELF as a possible human carcinogen, classification 2B, based on these studies in which there is “limited” epidemiological evidence for a causal relationship between exposure to an ELF magnetic field and childhood leukemia. Finally, the results of Wertheimer and Leeper [
3], Greenland et al. [
4] and Ahlbom et al. [
5] are confirmed by Kheifets et al. [
6] in a combined analysis of seven studies using the reference of 0.3 μT. However, the epidemiological results are not supported by a known biophysical mechanism, and various confounding arguments are put forward to explain this association, which is ruled out (Greenland, [
7]; Greenland and Kheifets, [
8]), and corrections in the exposure estimation, when taken into account, increase the level of association rather than subtract the level of association (Greenland, [
7]; Kheifets and Oksuzyan, [
9]).
One of the problems encountered in epidemiological studies is the scarcity of individuals with high exposure and the low participation of controls to carry out the measures. One of the alternatives proposed to resolve this situation and improve epidemiological studies is the proposal to study the buildings containing TSs, in particular TSs inside residential buildings on the ground floor (Kheifets and Oksuzyan, [
8]). In the TSs, the wiring connections and current bars converge, which when carrying large currents generate high MF values that decay rapidly with the distance. Therefore, the attached dwellings, next to or above the TSs, would result in strong exposure for their residents, while for more distant dwellings the level of exposure would be much lower. The knowledge of the level of ELF-MF in the dwellings of the buildings with internal TS on the ground floor would allow the establishment of some mathematical statistical models to know the level of exposure of the residents retrospectively, knowing the building where their dwelling is located and the location of their dwelling without the need to measure in each case. This would greatly facilitate environmental and epidemiological studies, eliminate the control selection biases, and eliminate confounding agents, such as the ionized air surrounding the high-voltage cables, which would not be present in the dwellings attached to the TSs. Measurement campaigns have been carried out in Finland, Israel, Hungary, and Switzerland to analyze a possible exposure assessment procedure (Ilonen et al. [
10]; Hareuveny et al. [
11]; Szabo et al. [
12]; Thuroczy et al. [
13]; Martin Rösli et al. [
14]); in these works, in the framework of the TransExpo project [
15,
16,
17,
18], specific measurements have been made in apartments in buildings on which TSs are located on the ground floor.
In this work, an ELF-MF measurement campaign carried out in Silla, (València), is presented. Silla is a city in the autonomous community of València (Spain), located in the county of L’Horta Sud, and with a population of 18,440 according to 2017 data from the National Institute of Statistics [
19]. The municipality of Silla promoted this work in response to the demand of a large part of the affected residents, concerned about the possible exposure of their homes. The City Council of Silla proposed to carry out a detailed analysis of the exposure levels of residents in their homes, to assess the possible environmental impact with respect to the levels previously mentioned from epidemiological studies.
A detailed analysis of MF exposure in each room of each home was necessary because TSs are localized sources of MF, unlike other structures such as medium- and high-voltage power transmission lines. The exposure in the adjoining dwellings, either above or to the sides, will be a localized exposure. It is possible that only some rooms are subject to high exposure, and the other rooms may have normal levels of MF from a domestic environment. Depending on the type of TS, the structure of the building, age, and the type of housing, it is also possible that almost all the housing is subjected to high levels of MF. This paper aims to provide information in this regard, and the usefulness would be in its possible extrapolation to the general population under these circumstances.
Finally, there are also homes in large buildings whose construction planning has allowed for the existence of a meter cabinet attached to some part of the community’s home. In these cases, all the electrical current consumed by the community passes through this cabinet, giving rise to high levels of MF in these parts of the home. This situation has also been considered, in particular for the future perspective that the remote management of meters by PLC signal [
20] also increases radiation levels in these areas.
This article presents the first systematic campaign of ELF-MF measures from TSs carried out in a Spanish city. To our knowledge, this would be the first article in which the measurements obtained from spatial averages in grids are presented, in each room, where average exposure values are calculated with descriptive statistics of the measurements in all the dwellings, and the environmental impact is analyzed taking into account the number of rooms in each dwelling. This work would be a further contribution to the knowledge of the exposure levels of residents, and would complement all the work done in this area to date in the world.
2. Materials and Methods
A census of all the TSs in the town of Silla (València, Spain) was carried out. In the elaboration of this census the TSs on industrial land, the areas of agricultural use and in general all the TSs of non-residential use were omitted. There were 31 TSs in the urban area of Silla, throughout the municipality, discounting the TSs in the industrial and agricultural areas. Of these TSs, one supplied power to a communications center, one supplied power to a supermarket, and in both cases its maintenance was managed by their respective companies. The remaining 29 TSs supply energy to various areas of the city and were managed and maintained by the electricity distribution company.
Most of the TSs were found embedded in the ground floors of buildings, of which only two had dwellings next door embedded in the structure of a building, one TS was found in a single-story house with dwellings on the sides, one very old tower TS was found without adjoining dwellings, and three TSs were found in prefabricated concrete cases in landscaped spaces away from dwellings.
With the support of municipal officials, the residents of the houses above or next to the TSs were contacted, informed of the campaign of measures to be carried out by the municipality and asked for written permission to access the houses to carry out the measurements. Information was also collected on the number of persons residing in the dwelling, adults and children, and other information for future statistical treatment. The census of the TSs with the addresses of the dwellings with authorization to measure and the respective contact telephone numbers were provided to our team to proceed with the measurement campaign.
It was decided that the measures had to show the most unfavorable situation, the one in which the levels of MF were expected to be higher, for that reason the temporary range of measurements was chosen from 18:30 to 22:00 in which the energy consumption was assumed to reach maximum levels due to the fact that the residents have returned from their working day, and the families are in their homes, cooking, watching television, and doing their domestic chores with the electrical appliances with the consequent consumption of electrical energy.
The campaign of measures started in the last week of September 2017 and lasted until February 2018. Residents were first phoned, and the visit was arranged, and then visited. The study was approved by the ethics committee of the University of València.
The measures were carried out with the EFA-300 [
21]. The measurements carried out in each house aim to show the ELF-MF landscape by optimizing the measurement time in each case. Upon entering the house, a quick inspection of the MF levels was carried out in all its accessible rooms. The measurements were carried out following the “walking procedure”, widely used in noise measurement campaigns and usually followed by our technicians since 2000 [
1]. In measurements with the EFA-300, it is measured at each step and stored in memory and/or recorded. The meter is held by hand approximately 1.0 m above the ground. In each zone it is measured in a spatial grid covering the area. If high levels of magnetic induction are detected, the source is identified and measured in distance and around the source to limit the area of greatest exposure. The measures are regularly distributed in the areas under study to identify the sources of emissions and their extent. If vertical field gradients are discovered, the sources are searched and the field levels on the ground are characterized. In this way, any MF source is detected a properly located.
Measurements were not recorded in spaces where the measurements made were negligible or within the normal levels of a dwelling or open space away from TSs or other foreign sources of MF. Finally, it was not measured in inaccessible spaces, spaces with furniture and fixtures that prevent access and use on a regular basis.
Typical MF measurements in a house in Spain are around 0.1 μT. Values above 0.3 μT are found very close to appliances that are in operation, the refrigerator when the compressor is running, the washing machine, the electric stove either by resistance or induction, and especially the microwave oven. These measurements are found in the kitchen, which is usually the area of the house with the highest exposure of ELF-MF.
3. Results
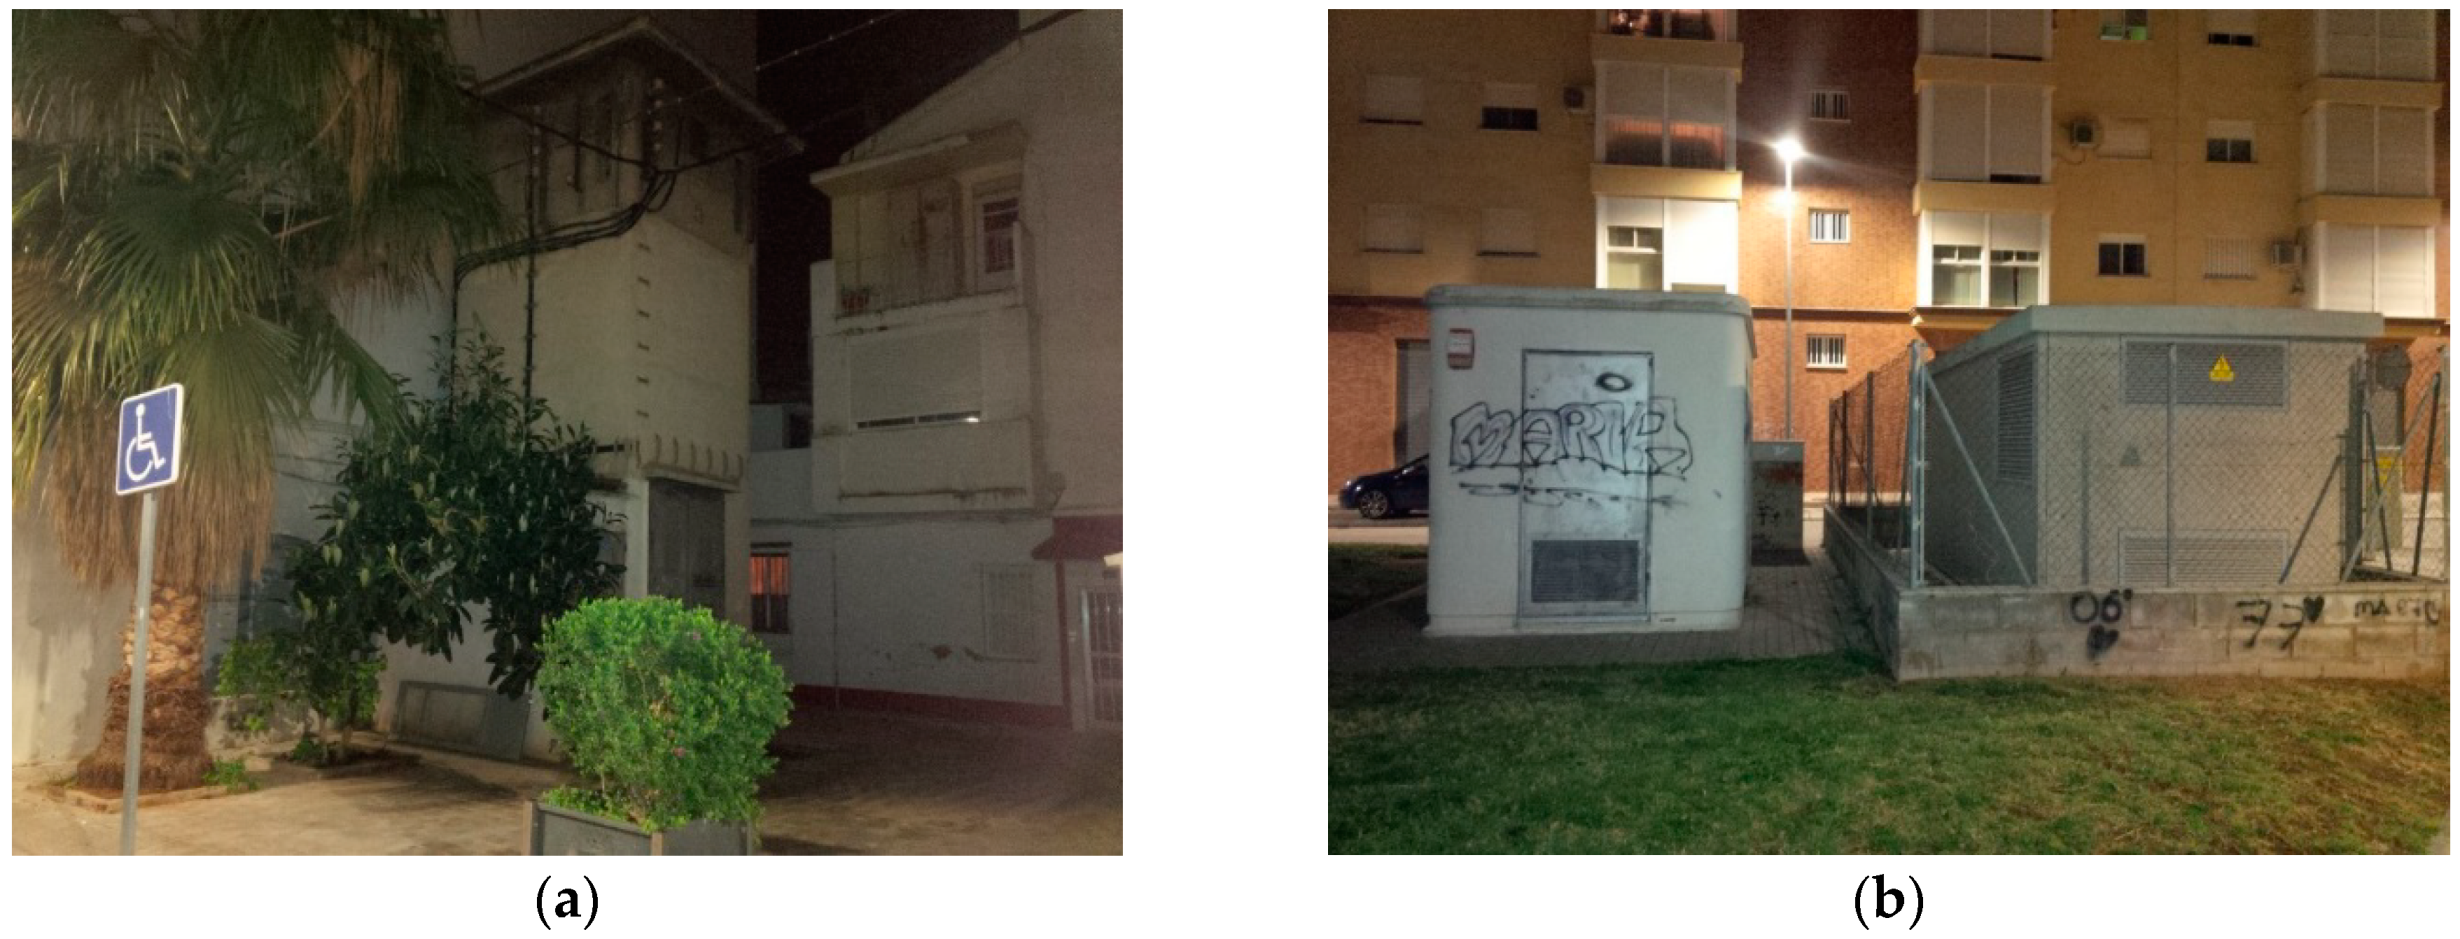
Of the total number of encountered TSs, one was excluded from the study because the residents living above the TSs refused to collaborate in the study. Of the remaining TSs counted, there were: 1 TS in a recently constructed concrete case on the periphery of a school playground, 2 TS in two prefabricated concrete boxes in a newly developed area less than 10 years old, see
Figure 1, away from the building blocks in the center of a landscaped area, 1 TS next to a block of recent buildings less than 10 years old, very close to a ground-floor house. There is a very old tower TS from before 1960, away from a block of very old houses (see
Figure 1). There is also 1 TS located on the ground floor of an old house, possibly from around 1960, purchased and fitted out by the electricity distribution company. Finally, there is 1 TS attached to the corner of a block of old buildings from before 1980; this TS has apartments next to it and no apartments on top of it. In total we counted 7 TSs that would result in high levels of magnetic induction in areas of easy access from the sides. Finally, we added to the studio an apartment that had a panel of electricity meters attached to the outside wall of an area of the house, which would also lead to high levels of MF in lateral access areas, in particular a ground-floor dwelling. The rest up to the totality are TSs located in ground-floor spaces, at street level, which have dwellings on top, and parking or commercial areas on their sides.
The installations are normally operated by the electricity supply company. When developing and building, specifications are given to the developer-builder agent to prepare the spaces and install the TSs, which are then transferred to the company that supplies the electricity and that, after the assignment, takes care of their maintenance. These specifications have changed in the last 60 years and this has given rise to different types of spaces, with different spacing between equipment walls and ceiling where obviously the considerations of maximum use of space have prevailed, without going into assessing aspects related to the minimization or shielding of the magnetic field. In response to residents’ response to possible exposure to magnetic fields, new developments have evolved and no longer have internal TSs in new buildings, especially sensitive areas such as schools. If they have sufficient land area, TSs are usually installed in the center of avenues or garden areas. TSs located on the ground floors of old buildings in downtown area are difficult to modify due to the lack of spaces, in these cases the minimization of ELF-MF in the adjacent spaces requires a change in the configuration of the wiring or the TS technology itself.
Two of the TSs under study did not belong to the electricity supply company. In Spain there is the possibility that a TS may not belong to the supply company, in this case the supply company conducts the electricity in medium-voltage to the TS, and the TS owners are responsible for its management and proper maintenance. Normally, to avoid maintenance costs, the promoters of the installation pass it on to the electricity supply company.
Table 1 shows the results of the measurements in the 31 locations. The age is indicated in ten years intervals, is known by municipal technicians and is easily deduced from the observation of the techniques and building materials used in the construction. In
Table 1, it is indicated whether the TS is below or next to it, and the descriptive statistical parameters of the measurements are presented in microTesla (μT), maximum, minimum, mean, median and standard deviation. The number of spaces where it has been measured is indicated, and finally the average value of the measurements made in the bed or beds of the most affected spaces are also presented.
Our measurements are within the order of magnitude of the measurements carried out in Finland, Switzerland, Hungary, Israel, Bulgaria, and The Netherlands [
10,
11,
12,
13,
14,
15,
16,
17,
18], in the framework of the TransExpo Project [
15]. The average of the average values gives us an average value of 0.4 μT for the dwellings above or adjacent to the TS. This result is interesting because it almost coincides with the average values obtained in Israel, Bulgaria and Netherlands [
15], and is close to the average of Finland and Switzerland, which show average values of 0.56 (0.17–1.55), and 0.59 (0.16–1.30). However, our result is about half that of Hungary, 0.98 (0.18–3.68). The measurements were made in circumstances of minimal electricity consumption within each dwelling, i.e., without cooking stoves or baking ovens, or heating electric stoves. The consumption in the houses was caused by the luminaires and occasionally the televisions turned on. This is important in order to have some assurance that the measure being taken has its source in the TS, and not in the wiring of the house itself. These circumstances are not obvious in the previous works [
10,
11,
12,
13,
14,
15,
16,
17,
18]. Also, when the successive averages are carried out, the values obtained are smoothed out and do not appear to be so high; however, they are high in some areas where values of 2–20 μT were reached. There were circumstances of very high magnetic fields in spatially reduced areas where residents occupied these areas in very short periods of time, and cases where the magnetic field was not excessively high, but affected virtually the entire dwelling. These special circumstances have been assessed with the introduction of the weighted average and the environmental impact factor to be introduced below.
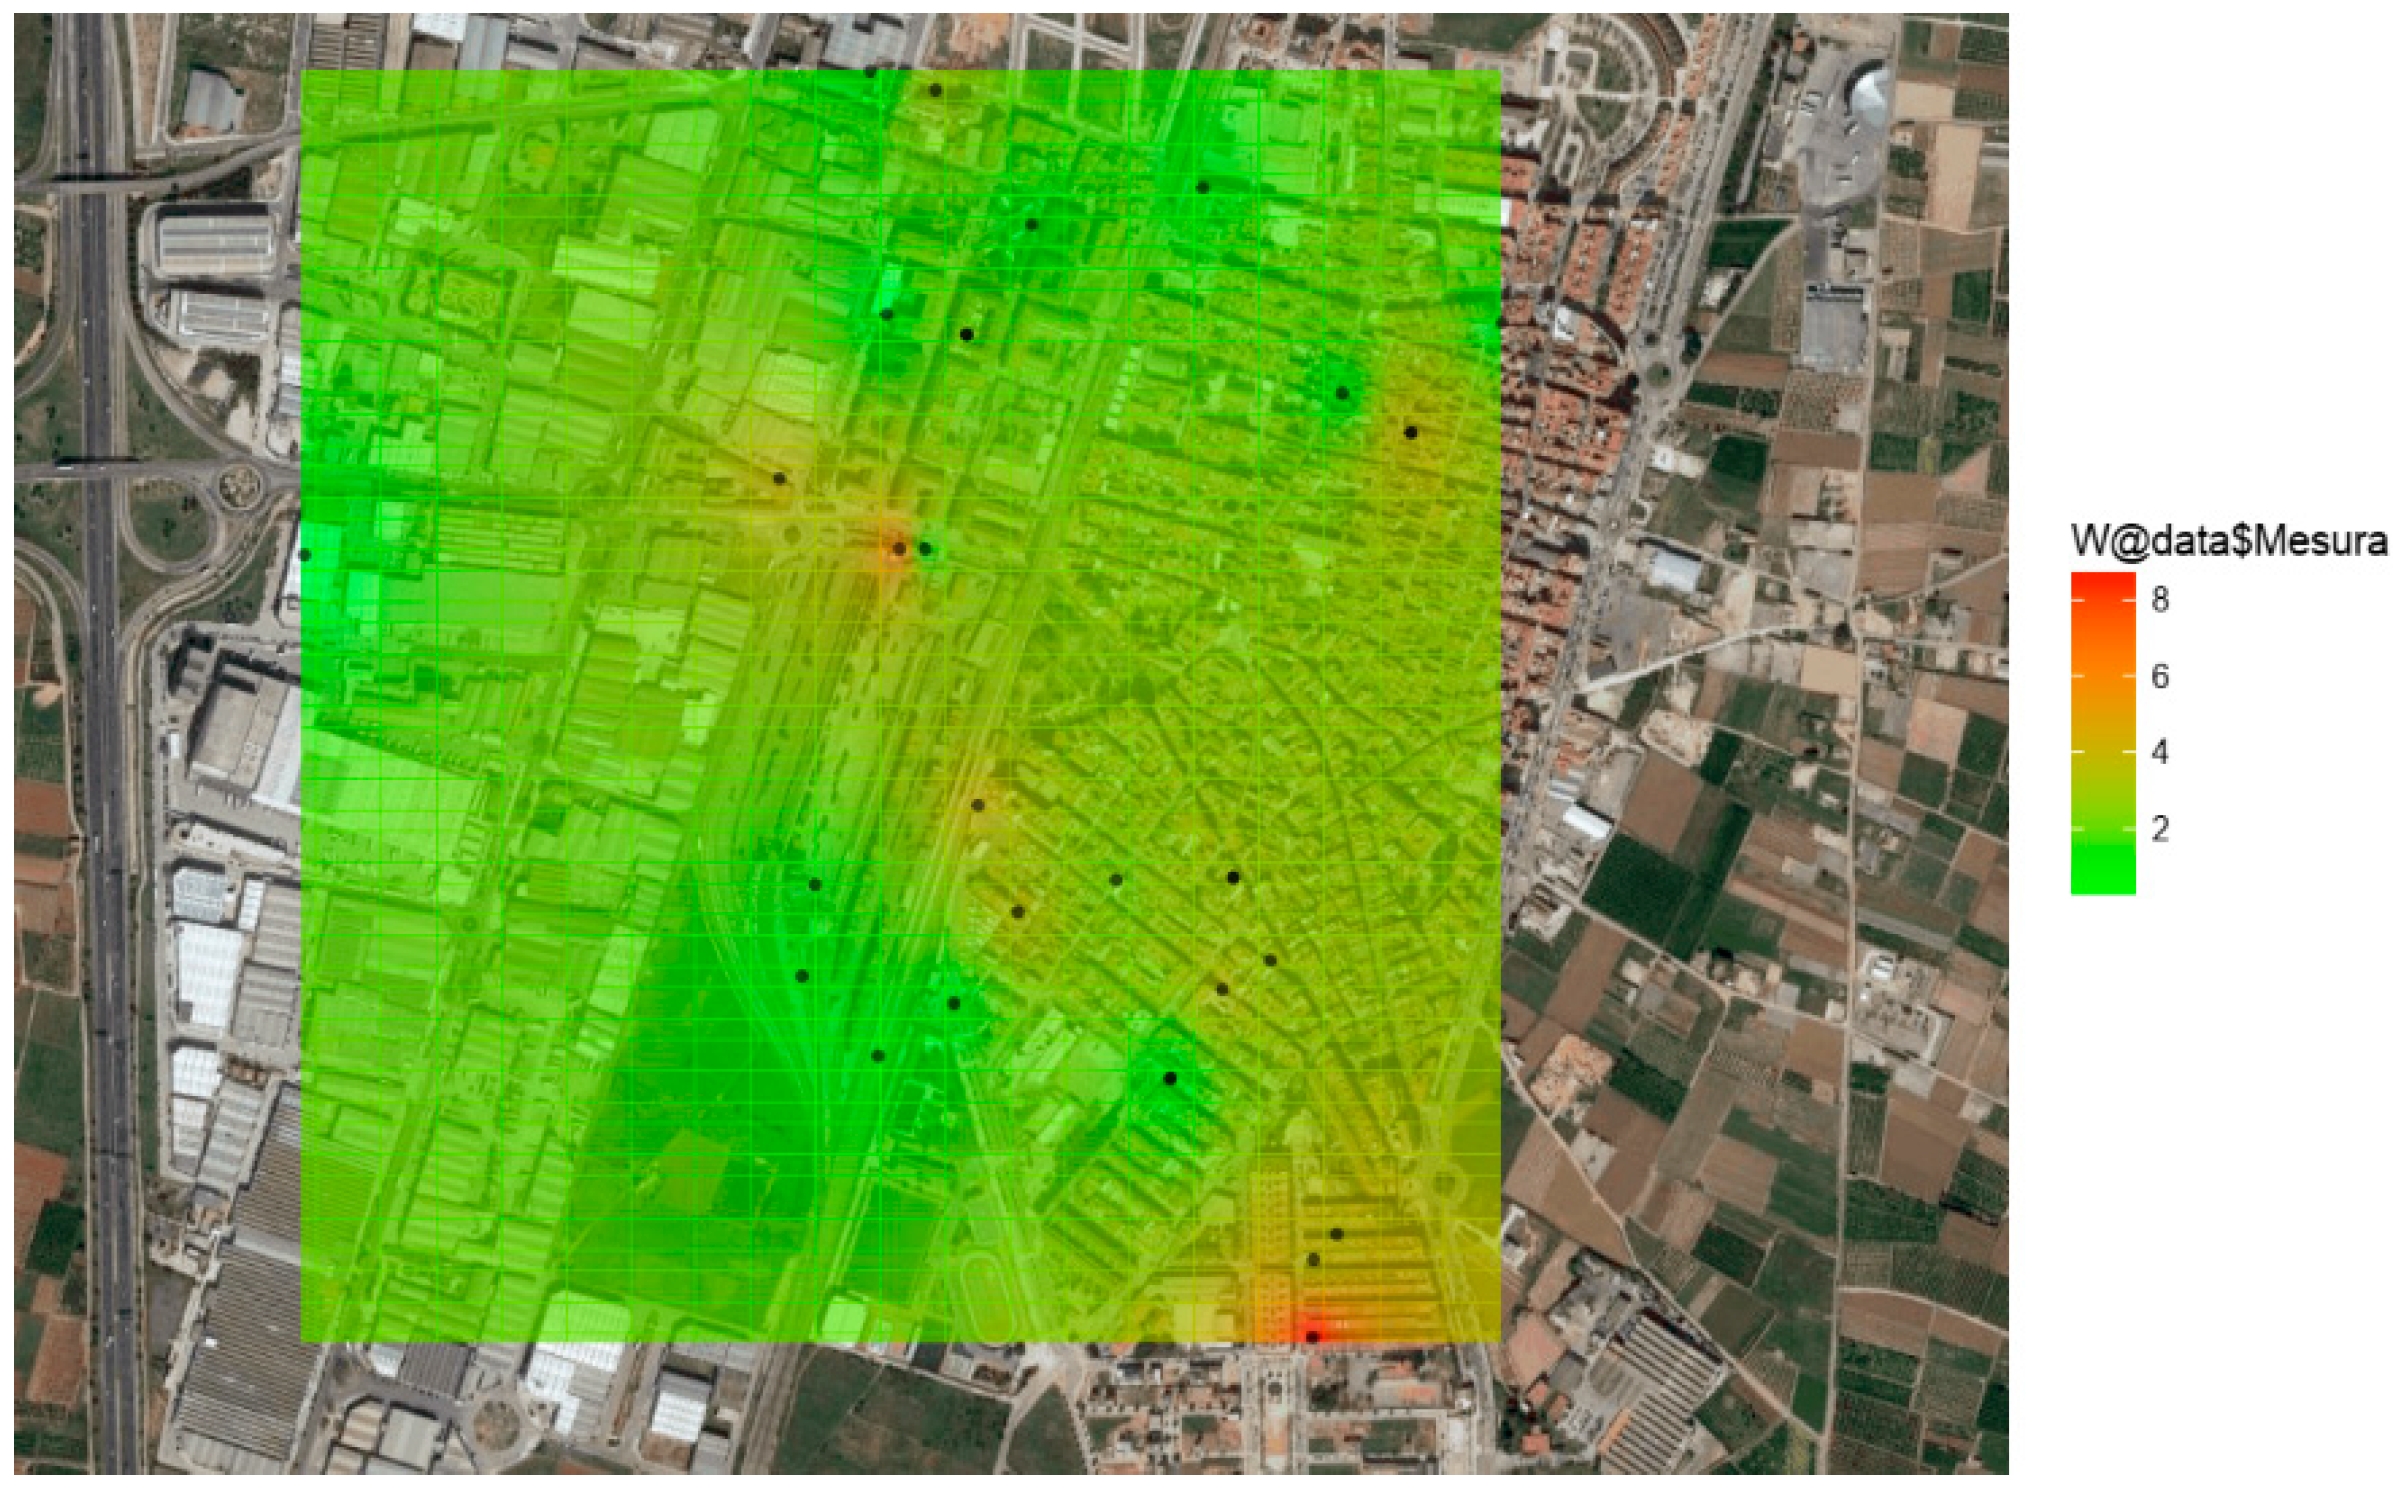
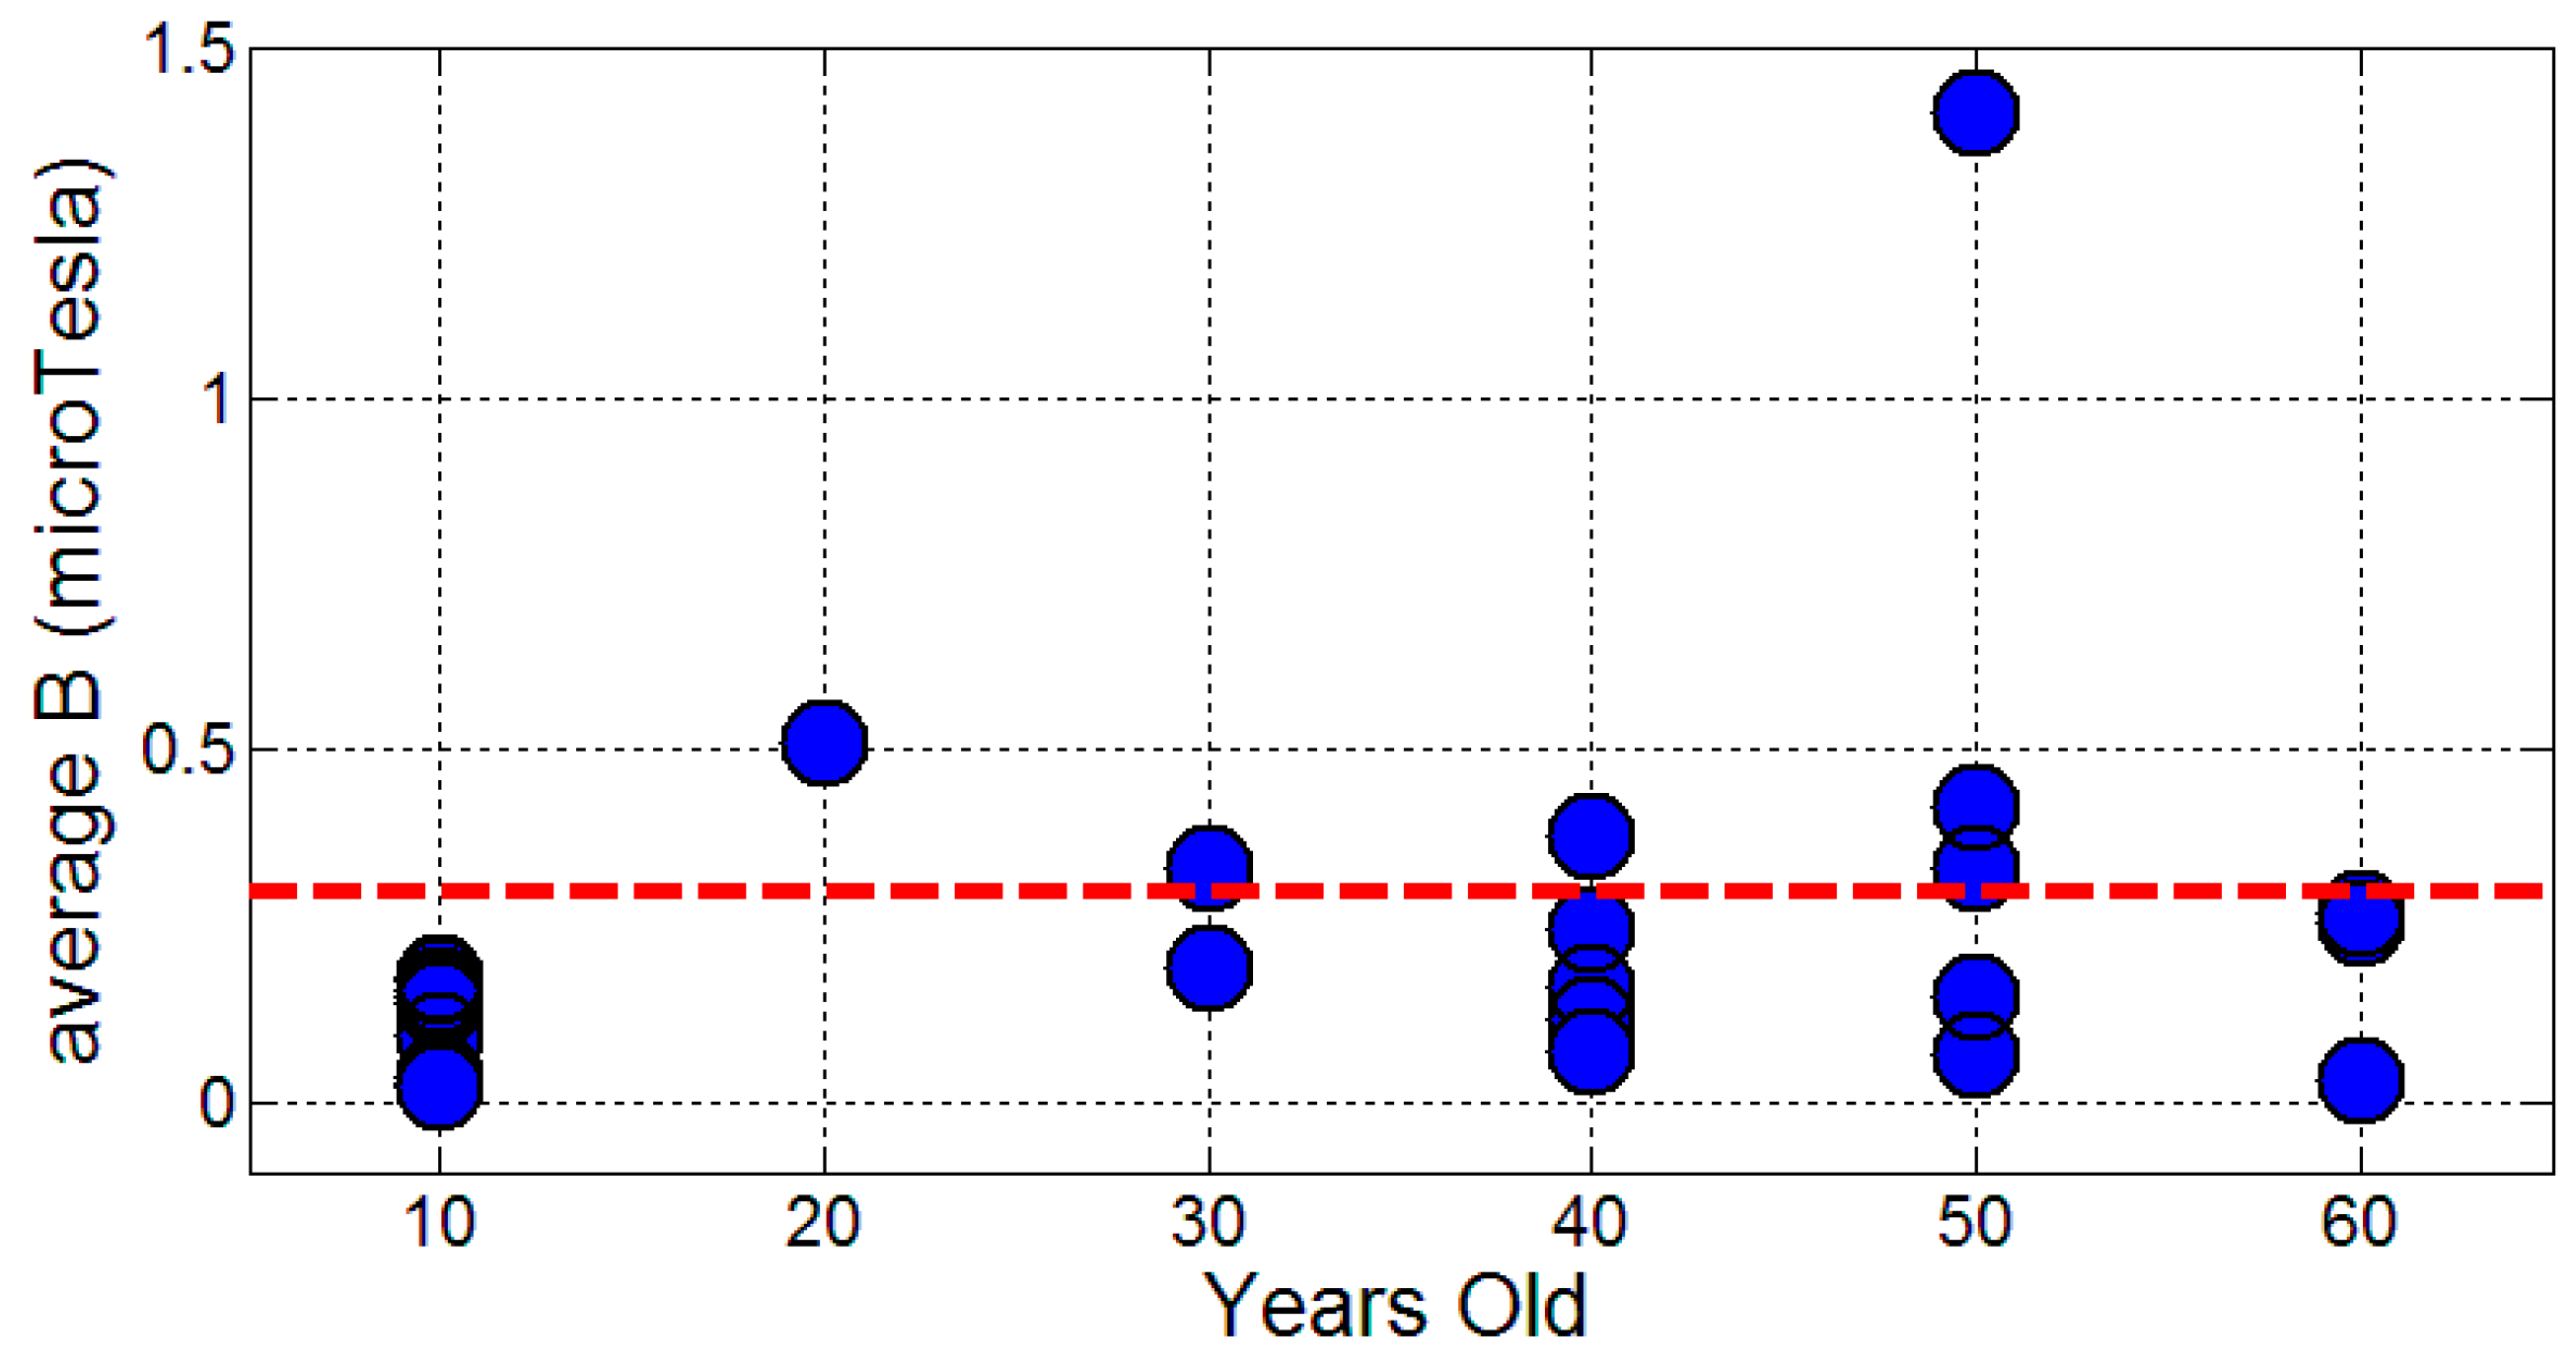
Figure 2 shows the location of TSs on a map of Silla, where the interpolated values are shown in a color code using a geostatistical procedure [
18,
19], and
Figure 3 shows the mean value at each place (from
Table 1) with a red line showing the limit level of 0.3 μT.
From the measures in
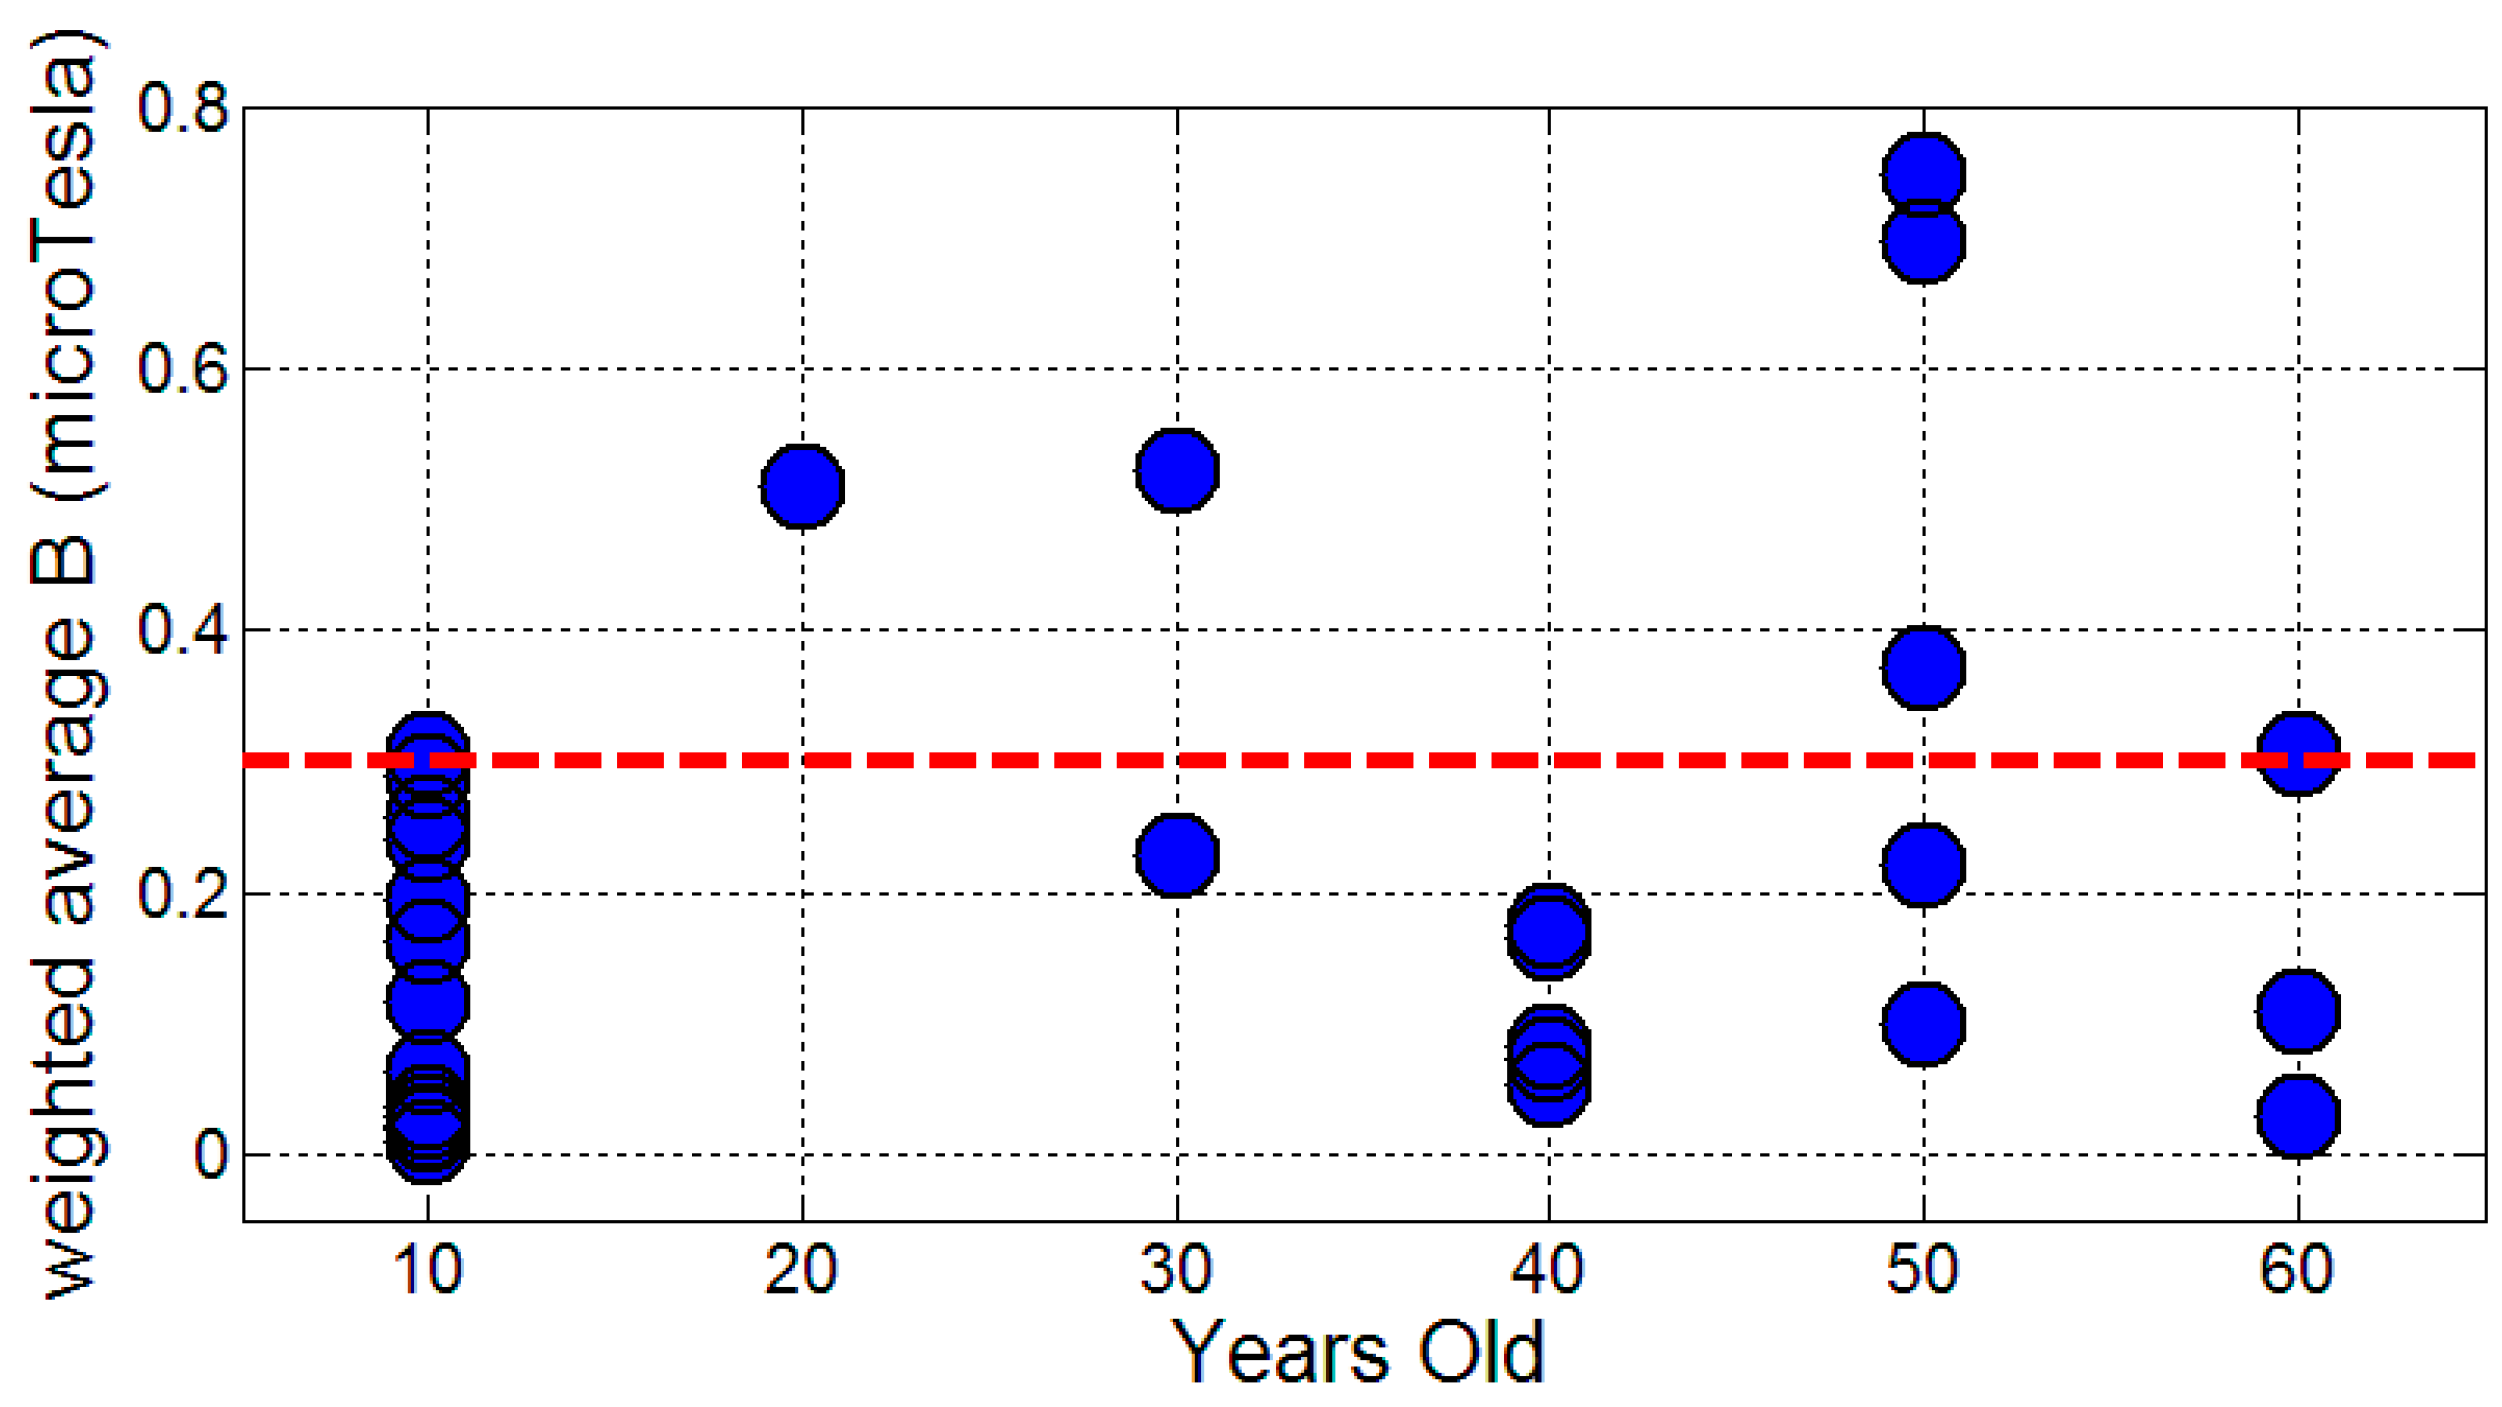
Table 1, a weighted exposure level is calculated that takes into account the possible permanence of residents in each part of the dwelling and bedroom. The average level of exposure in the rooms and in the bed is taken into account, assuming that the resident spends 12 h in his or her home and of these, 8 h rests in the bedroom. The averaged measurement in the rooms is multiplied by 1/3 and the measure in the bed is multiplied by 2/3, the sum of both amounts gives us the weighted average in each dwelling. The weighted average is shown in
Figure 4, with a red line showing the limit level of 0.3 μT.
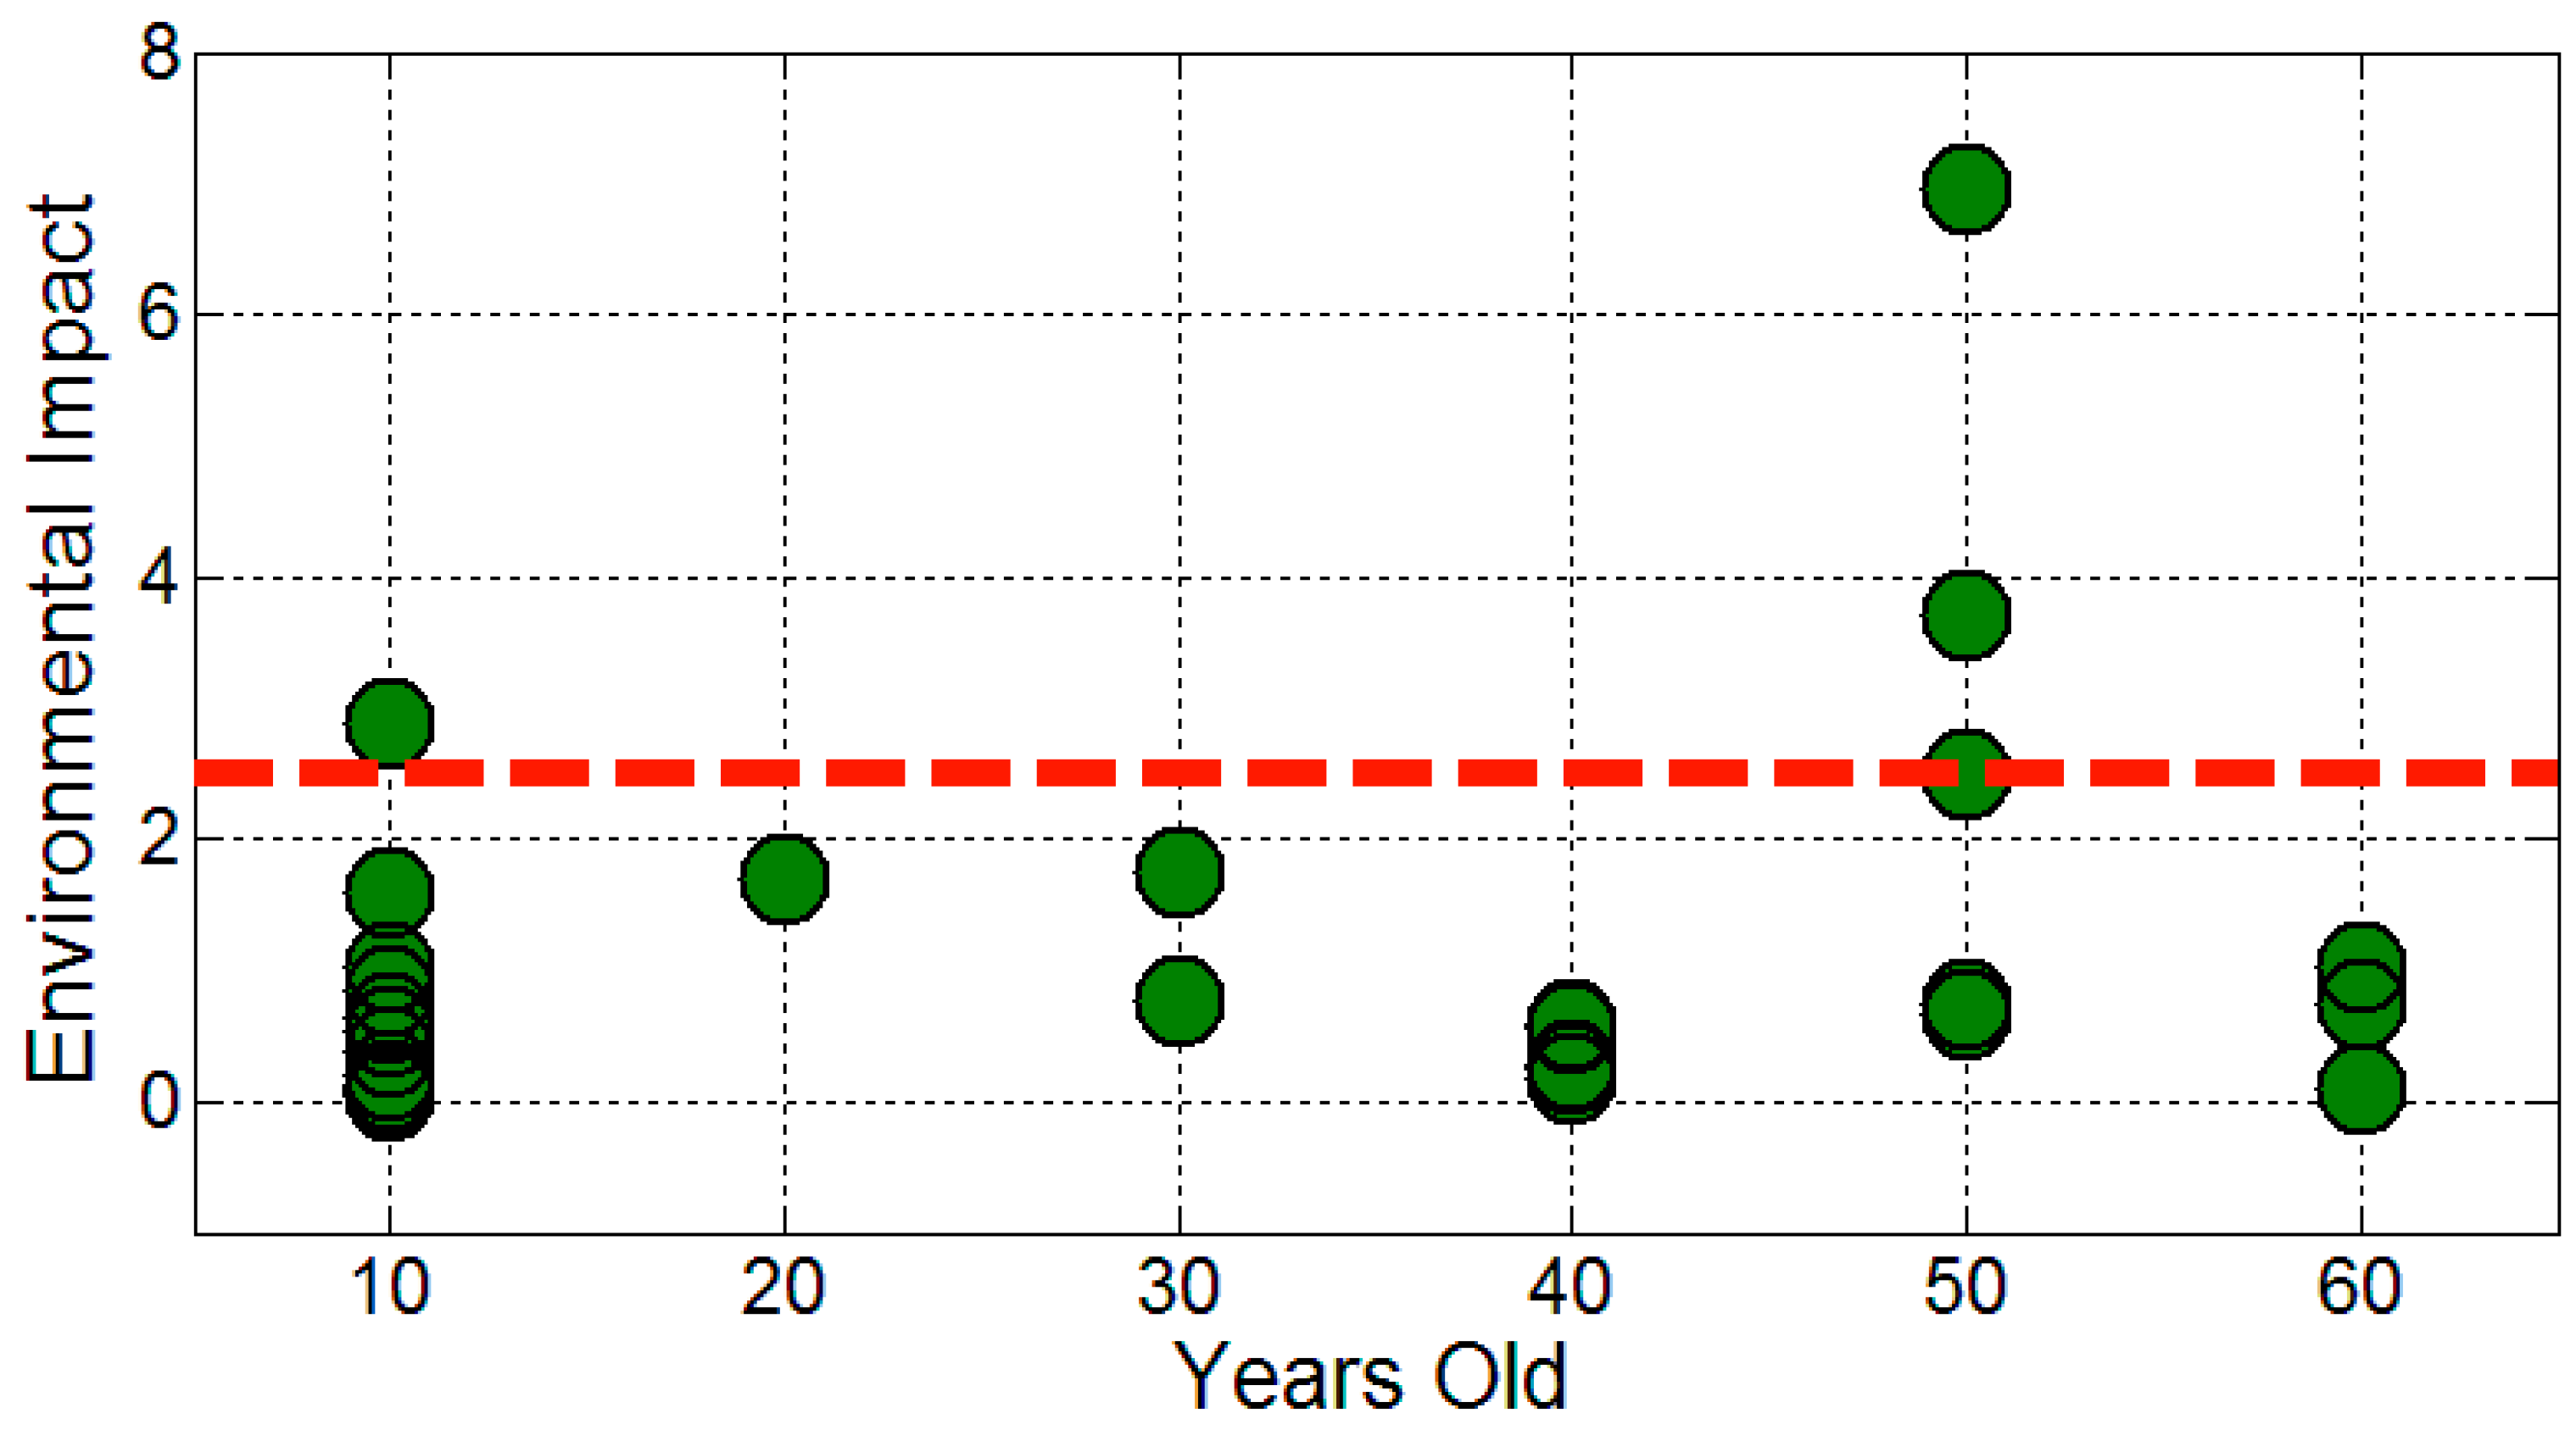
When residents are informed of the levels of exposure in each room, residents may carry out individual actions to reduce exposure, which would be of a temporary nature, pending other definitive minimization actions by the company in charge of TS maintenance. If the house has many rooms and mostly MF levels are low there are many possibilities for relocation. Based on this, we developed an environmental impact indicator that not only evaluates the weighted exposure level, but also the possibility of minimizing the exposure with individual actions of residents. For example, the area with high exposure is a single room or only the bedroom, but there are other rooms with low or normal levels, in this case the resident can change the bedroom and this indicator would score 1, on the extreme side this indicator would be 3 for high exposure in all rooms with no possibility of relocation. The environmental impact is calculated by multiplying the weighted exposure times the score and divided by 0.3 (the maximum). The environmental impact calculated in this way is shown in
Figure 5, with a red line showing the limit level of 2.5. The value 2.5 is a reference value in a home with half of the rooms well below the recommended levels (0.3 μT).
4. Discussion
The obtained results must be analyzed according to the MF measured levels and the affected area. Obviously, all the measures are below the levels set by Spanish legislation, 100 μT at 50 Hz, which is Royal Decree 1066/2001, based on the guidelines of the European recommendation [
24].
There are 20 dwellings, 65%, with maximum values above the recommendation of 0.3 μT, but the maximum values can be in very small areas, or areas of low traffic and therefore have little environmental impact. In this case it is necessary to take into account the average values and average values weighted according to the temporary occupation in each room. There are six homes, 22.2% of the 27 locations, with mean values above the recommendation of 0.3 μT. These are the measurements in A4-11-15-19-20-26. Of these measurements, two, A27-28, correspond to TS in isolated concrete boxes and these are transit zones. A15 is a TS that has been installed in an old single-family house but that affects recent neighboring houses, is not the most common case. Of these six sites, four correspond to buildings dating from 1960–1980. This would indicate that the levels exceeding the recommendations for housing would be mainly in buildings more than 40 years old. Although it would not be the responsibility of the utility company, but of the construction developer, the guidelines are set by the utility company, and the developer always tries to scratch the square meters of construction to the maximum to obtain the maximum return on the investment made. On the other hand, the possible environmental sensitivity in Spain 30 years ago is not the same as it is at the moment and this is reflected in the measures carried out: the most recent installations tend to have less impact on the neighboring houses. The sites of the new A27-28 urbanization have the TSs in prefabricated concrete cabins far from the houses, and the recent constructions that do not have space to relocate outside the buildings show lower levels due to a combination of a better cabling layout and a higher height of the first floor.
We then assess the impact on residents based on the weighted average level. The weighted average level takes into account the average level of exposure in the rooms which is multiplied by 1/3 and the measure in the bed which is multiplied by 2/3, the sum of both amounts gives us the weighted average in each dwelling.
Figure 4 shows that the weighted mean of ELF-MF levels varies between a minimum of 0.01 and a maximum of 0.75, we find seven dwellings that reach weighted average levels above 0.3 μT, i.e., we find that about one quarter of the residents living above or next to a TS have a weighted average exposure higher than the 0.3 μT.
The possibility of a hypothetical relocation of the bedroom or of the areas of greater permanence within the dwelling has also been assessed to reduce the weighted exposure level, is done by assigning an environmental impact index. The environmental impact assesses the possibilities of relocation to minimize, in addition to the weighted average level. The indicator of environmental impact on residents varies between 0.03 and 6.96. We observe that it is 0.03 for the case of average levels well below the recommendations and/or with large dwellings with reduced affected area, and the maximum is 6.96 for a dwelling with high levels in all rooms and no possibility of relocation. The value 2.5 is an intermediate value in a home with half of the rooms well below the recommended cut-off levels (0.3 μT). From this quantification and from the results shown in
Figure 5, we can see that we have three cases, 11% of the total, which imply a high environmental impact on reported residents.
5. Conclusions
In this work we present the ELF-MF measurements made in dwellings located above or next to TSs in a typical population of the Mediterranean coast. This work includes the first campaign of measures of this nature carried out in Spain, among the first three in Europe, and four in the world. It has been measured in all the rooms or spaces of the dwellings that have been accessible by measuring a spatial average in a grid.
Without assessing whether the Spanish regulations respect the epidemiological evidence, simply taking it as an obligatory reference, and using the city of Silla as a representative city of the whole country, we could say that in every place in an urban environment MF levels comply with Spanish regulations or “official standard”. The official standard in Spain is the Royal Decree 1066/2001, a copy of the European recommendation [
24], and ICNIRP (International Commission on Non-Ionizing Radiation Protection) guidelines. The limits of official standard in Spain are 100 μT at 50 Hz.
The “recommended level” or “limit level” 0.3 μT comes from the bibliographical references [
2,
3,
4,
5,
6,
7,
8,
9]. Other references sustaining this recommended level can be found in [
2] or elsewhere [
25]. The “recommended level” does not correspond to “official standard”. There is no consensus that chronic exposure in the range >0.3 μT have any health effects. Health agencies acknowledge that there is a suspicion that such effects may exist, but health agencies have not concluded that health problems actually do exist [
26].
We could say that apartments not attached or next to a TS have (associated to TS) MF levels far below 0.3 μT. Also, we could say that the electrical meter cabinets have a limited influence on the adjacent dwellings (A31 in
Table 1), the weighted exposure and the environmental impact is minimal, but this could depend on the configuration of the wiring relative to the dwelling, and it would be necessary to study a greater number of cases to reach a more generalized conclusion.
A notable result of this work is that approximately a quarter of the population living above or next to a TS would be exposed to a weighted MF greater than 0.3 μT.
Another important result of this work is that approximately 10% of this population would not be able to relocate their bedroom or living room to minimize the level of exposure, i.e., after measuring and analyzing their home and looking at the possibilities of rearranging the activity in the home to minimize exposure, about 10% of the homes would have difficulties with this possibility and possibly residents would have to leave their home and look for a home that did not have a TS underneath it.
A positive outcome of the present campaign is that empirically is demonstrated that TSs in spaces far from homes, in landscaped areas or in the center of wide avenues, have a negligible impact in residents. Also, in existing constructions it is possible to minimize the exposure to MF by better conditioning of the space around the TSs, more distance between TSs and houses, and possibly a better layout of the wiring. It is shown empirically that modern TSs located on the ground floor of more recent buildings definitively have the lowest environmental impact.
This work is of great interest regarding its use in future epidemiological studies. A large amount of relevant information was collected that may be utilized in a future epidemiological study with a proper statistical treatment.


