How an Open Innovation Strategy for Commercialization Affects the Firm Performance of Korean Healthcare IT SMEs

1
Technology Management, Economics, and Policy Program, College of Engineering, Seoul National University, 1 Gwanak-ro, Gwanak-gu, Seoul 08826, Korea
2
Graduate School of Health Science Business Convergence, College of Medicine, Chungbuk National University, 1 Chungdae-ro, Seowon-gu, Cheongju 28644, Korea
*
Author to whom correspondence should be addressed.
Sustainability 2018, 10(7), 2476; https://doi.org/10.3390/su10072476
Submission received: 14 June 2018
/
Revised: 7 July 2018
/
Accepted: 11 July 2018
/
Published: 16 July 2018
(This article belongs to the Section Economic and Business Aspects of Sustainability)
Abstract
:Small and medium-size enterprises (SMEs) in the healthcare IT industry must have innovative technology and, at the same time, be able to commercialize this technology in order to have sustainable growth, as enterprises in any other industry do. However, due to the lack of resources of SMEs, many studies focus on effective and innovative strategies based on a resource-based view. To be more effective, some SMEs collaborate with other companies in the manufacturing process, not as a closed, but rather as an open innovation. However, this collaboration is difficult and bears risks. Additionally, as an external factor, the government certification system attempts to help SMEs. Therefore, in this study, we performed a multiple regression analysis centered on firms’ resources and strategies. Three results were obtained. First, in terms of the firms’ resources, the higher the quality of patents that measure firm capacity, the higher the firm performance. Second, regarding the firms’ strategies, cooperation with external companies in the manufacturing process has a positive effect on firm performance. Third, receiving government certification (InnoBiz certification), as a form of cooperation with the government, has a negative impact on firm performance. In other words, the present government policy to support the R&D of SMEs needs to be adjusted. SMEs can develop high-quality patents, and strategies for cooperation with external companies can enhance the innovation performance of enterprises.
1. Introduction
The healthcare IT industry, which was created by the fusion of advanced information and communication technology (ICT) and medical technology, is regarded as a new growth engine that can effectively cope with various social and economic problems, caused by aging and chronic diseases, and enable economic revitalization [1,2]. Especially, Korea has a high demand for the introduction and development of digital healthcare due to the rapid improvement of the economic level, the aging population, and the high interest in healthy life [3]. In order to promote the healthcare IT Industry, the Korean government is striving to establish a reasonable support system and a regulatory system for related technologies and enterprises.
Small and medium-size enterprises (SMEs) can only survive if they possess certain technologies or strategies. Due to resource limitations and to prevent failure, SMEs should build a strategy that is able to increase the profit of the enterprise using its flexible structure [4,5,6]. Otherwise, the business would not be sustainable [7,8].
While it is important for SMEs to develop competitive technologies, there is the risk and uncertainty concerning whether the innovation investment will be successful, and the innovation requires enormous capital and time in the development process [9,10,11]. In order to strategically use limited resources, studies on SME innovation are based on the resource-based view (RBV). RBV points out that the ability to use resources appropriately for innovation is the key to enterprises’ innovation and success [12,13,14,15,16], and the extent of innovation is determined by the strategy and resources of the organization [10,17]. With a competitive strategy for using resources, SMEs can own their technology, which is measured based on patent information [18,19].
However, innovation is also important for the profit of SMEs to commercialize this technology and directly influence sales. Strategies and an environment for the commercialization of the developed innovative technologies are important for SMEs to make profits [20,21].
As the IT and health care industries are being combined, competition among SMEs for the development of new technology is becoming severe, and a commercialization strategy in the manufacturing process is becoming more important [22,23,24,25]. It is too costly for SMEs to develop a new manufacturing process each time they develop new technologies. Thus, some SMEs cooperate with other firms in the manufacturing process.
Furthermore, in the early stage of reviving industries through convergence [26], the government support policy is important for the healthcare industry, which is facing a new phase through convergence with the IT industry because the government support policy is an important factor in the performance of SMEs [27,28,29]. Innovative products in emerging markets are often created by SMEs. This means that SMEs need R&D investment and collaboration with others, which also includes the government support policy. There are two representative support policies for innovative SMEs in South Korea: Venture certification and InnoBiz certification. However, there is no policy or development direction for the healthcare IT industry itself. Thus, it is necessary to examine whether the current policy is appropriate for nurturing healthcare IT SMEs, which means taking leap in decades.
In order to be sustainable, it is necessary to examine how SMEs should develop a strategy from technology development relating to commercialization and government policy. To extend the studies on cooperation strategies [30,31] and the analysis of strategies from technology development for commercialization [23], a research framework exploring the use of government policy as a strategy is needed.
Therefore, this study identifies factors that have a positive effect on firm performance. Its research framework not only encompasses the investigation of the technological innovation strategy of the healthcare IT industry, but also the government support policy effect and commercialization strategy from the perspective of open innovation. Section 2 describes the research framework and hypotheses, Section 3 presents the data methodology, Section 4 presents results, and Section 5 discusses the results.
2. Research Framework and Hypotheses
2.1. Firm Strategy
2.1.1. Utilizing Outsourcing Strategy and Firm Performance
As technology grows at a faster pace, open innovation is becoming more important. In terms of open innovation, establishing strategies for collaboration is becoming more important in the healthcare industry in order to catch up with the pace of technology development [32]. Open innovation is defined as “the use of purposive inflows and outflows of knowledge to accelerate internal innovation, and to expand the markets for the external use of innovation, respectively”, as suggested by Chesbrough (2003) [33]. There are several types of open innovations and challenges [34,35,36,37]. However, collaboration for commercialization could reap benefits because the company that processes internal technology can commercialize it through external agencies [38]. An advantage of commoditization in cooperation with the external firm is that it can exclusively commercialize technology as well [39]. Moreover, there are more innovative products as collaboration increases [40]. As a result of various collaborations, it is found that improved products led to increased sales and a better launch of new products [41]. Collaboration between companies in the manufacturing process could be a sustainable strategy [42]. In light of the aforementioned, it is valuable for SMEs to cooperate in order to commercialize a product.
However, SMEs are at risk of losing core competences, such as R&D, so it is difficult to commercialize through cooperation with external organizations [43]. Nevertheless, it is necessary for companies with closed innovation to have sufficient openness to catch up with competitors [44].
To avoid risk, vertical collaboration could be a proper strategy for SMEs. The degree of vertical collaboration positively affects performance [45]; outsourcing is seen as vertical collaboration. Outsourcing reduces costs and time, and improves quality, which leads to an increase in firm performance [46,47]. It is revealed that outsourcing is beneficial to firm performance by analyzing, through structural equation modeling, outsourcing factors and the relationship between supply chain performance and business performance [46]. Thus, the more the manufacturing process is outsourced for commercialization, the more sales performance has a chance to increase.
In order to promote the innovation activities of start-up companies, the South Korean government has tried to solve the asymmetry of information in venture firms and capital markets through a certification policy. This is consistent with Lerner’s (2002) claim that government certification can address information asymmetry in capital markets [29]. Since the late 1990s, the Korean government has implemented venture certification policies and InnoBiz certification policies, as governments have developed diverse support policies for SMEs, such as credit guarantees [48] and tax incentives [49], because government policy is an important factor in driving technological change [50].
InnoBiz is a compound word of Innovation and Business and refers to a technologically innovative SME that has secured competitiveness based on technological advantage. An InnoBiz-certified company is a stable growth company, with comprehensive technological innovation capabilities, that has been in operation for more than three years and that can continuously achieve technological innovation and value innovation to secure global market competitiveness. Relatively, the benefits of venture certification systems are focused on start-ups with less than three years of experience. As venture certification systems offer various benefits to companies that have been certified as venture companies, InnoBiz certification also provides comprehensive benefits, such as policy fund support, investment fund creation, management consulting, overseas certification, and pioneering the market.
Government support policies are effective for capability expansion and cost reduction, but some studies suggest that such government policies can hinder cooperation [51]. The case of Korea’s certification policy has been revealed as positively effective for firm performance. Innovative enterprise certification has a positive effect on business performance, and there are differences in management performance between technological innovation type SMEs and management innovation SMEs [52]. It is also found that there is a significant difference between the types of innovation and labor productivity, excluding operating profit, by comparing the differences in management performance between venture-certified firms and InnoBiz-certified SMEs. Whether the factors influencing performance are different was also analyzed [53]. Therefore, the following hypotheses are drawn to investigate whether the effect of government policy on corporate performance is negative or positive.
Hypothesis 1.
The higher the outsourcing ratio of manufacturing, the more a firm’s performance can increase.
2.1.2. Utilizing a Government Certification System and Firm Performance
In order to promote the innovation activities of start-up companies, the South Korean government has tried to solve the asymmetry of information in venture firms and capital markets through a certification policy. This is consistent with Lerner’s (2002) claim that government certification can address information asymmetry in capital markets [28]. Since the late 1990s, the Korean government has implemented venture certification policies and InnoBiz certification policies, as governments have developed diverse support policies for SMEs, such as credit guarantees [48] and tax incentives [49], because government policy is an important factor in driving technological change [50].
InnoBiz is a compound word of Innovation and Business and refers to a technologically innovative SME that has secured competitiveness based on technological advantage. An InnoBiz-certified company is a stable growth company, with comprehensive technological innovation capabilities, that has been in operation for more than three years and that can continuously achieve technological innovation and value innovation to secure global market competitiveness. Relatively, the benefits of venture certification systems are focused on start-ups with less than three years of experience. As venture certification systems offer various benefits to companies that have been certified as venture companies, InnoBiz certification also provides comprehensive benefits, such as policy fund support, investment fund creation, management consulting, overseas certification, and pioneering the market.
Government support policies are effective for capability expansion and cost reduction, but some studies suggest that such government policies can hinder cooperation [51]. Innovative enterprise certification has a positive effect on business performance, and there are differences in management performance between technological innovation type SMEs and management innovation SMEs [52]. It is also found that there is a significant difference between the types of innovation and labor productivity, excluding operating profit, by comparing the differences in management performance between venture-certified firms and InnoBiz-certified SMEs. Whether the factors influencing performance are different was analyzed [53]. Therefore, the following hypotheses are drawn to investigate whether the effect of government policy on corporate performance is negative or positive.
Hypothesis 2a.
An InnoBiz-certified company has a higher firm performance than a company without certification.
Hypothesis 2b.
A venture-certified company has a higher firm performance than a company without certification.
Hypothesis 2c.
A venture-certified company with InnoBiz and would have a higher firm performance than company with no certification.
2.2. Firm Resources
Innovation is not always good for the performance of SMEs [54]. RBV is based on the belief that resources and capabilities are important for competitive advantage [12]. As the business environment changes, however, the assumptions of the existing RBV are not matching up with the dynamics of the market. Thus, the RBV has been expanded to strategically use corporate resources for the success of a company’s innovation [13,14,15,16]. In particular, it is important for SMEs to have their own skills [55]. This technology has been mainly measured as the number of patents and the level of patent information [18,19,56,57,58] so that the patent analysis can present a strategy to assess a company’s technology development.
2.2.1. Firm Patents and Firm Performance
Because patents protect proprietary technology and can confirm the technological development and scalability, analyzing patents can reveal how a company’s proprietary technology can affect its growth and development. Patents are important resources for enterprises and can affect firm performance [59,60,61].
Particularly, an analysis using qualitative information, as well as quantitative information regarding patents, is able to consider the characteristics of a patent [18,19]. Typically, patent families and cited patents are used to determine the value of a patent. Patent family means a patent registered in various countries. The first patent is registered in one country and then expanded to other counties. The expansion of the scope of patents filed in the domestic market to foreign countries is taking into consideration the technology preemption in the overseas market, and the size of the patent family represents the international value of the patent right [19]. Thus, although patent numbers do not affect sales performance, the number of patent families and patent family members can have a positive impact on sales performance [62,63,64]. In other words, the greater the number of family patents, the more likely it is to commercialize in the target country, which can lead to an increase in sales.
Hypothesis 3a.
The greater the number of patent families, the higher the increase in firm performance.
A cited patent refers to a patent that is referred to or used by another patent. A cited patent may represent the extent of the technology of a cited patented technology [65]. Thus, cited patents are also being studied for their effect on firm performance as valuable patents [18]. Cited patents, representing high technology, are also used to evaluate the value of M&A targeting companies [66]. Narin et al. (1987) weigh cited patents among registered patents of the US pharmaceutical industry [56]. As a result, the positive relationship between the number of cited patents and the financial performance is confirmed.
Hypothesis 3b.
The more cited patents, the higher the increase in firm performance.
2.2.2. Firm Characteristics and Firm Performance
In order to investigate our hypotheses, the characteristics of SMEs should be controlled. While it is important to collaborate in the manufacturing process, SMEs must have their own technology, distinct from that of competitors [55]. The more SMEs invest in R&D to have their own technology, the higher the company’s capabilities [67]. In addition, the possibility of developing innovative products increases, together with firm performance, as R&D investment increases [68,69]. However, R&D investment also has the risk of failing. Thus, the impact of R&D investment on firm performance should be controlled.
The healthcare IT industry is still in its early stages, so there are a lot of young and small companies and this factor should be controlled for hypothesis testing. As a company grows older, its R&D activities and investments are reduced, and the profitability of the company is lowered as more and more companies seek rent [70]. There are also studies that conclude that the larger the company, the better the company’s performance [71]. However, there are some studies that show that firm size is not related to performance [72,73]. The number of employees can be used as a proxy of firm size [74]. Moreover, looking at the performance of SMEs in terms of innovation, they differ depending on the age of the company [54]. Therefore, the size and age of the company should be controlled.
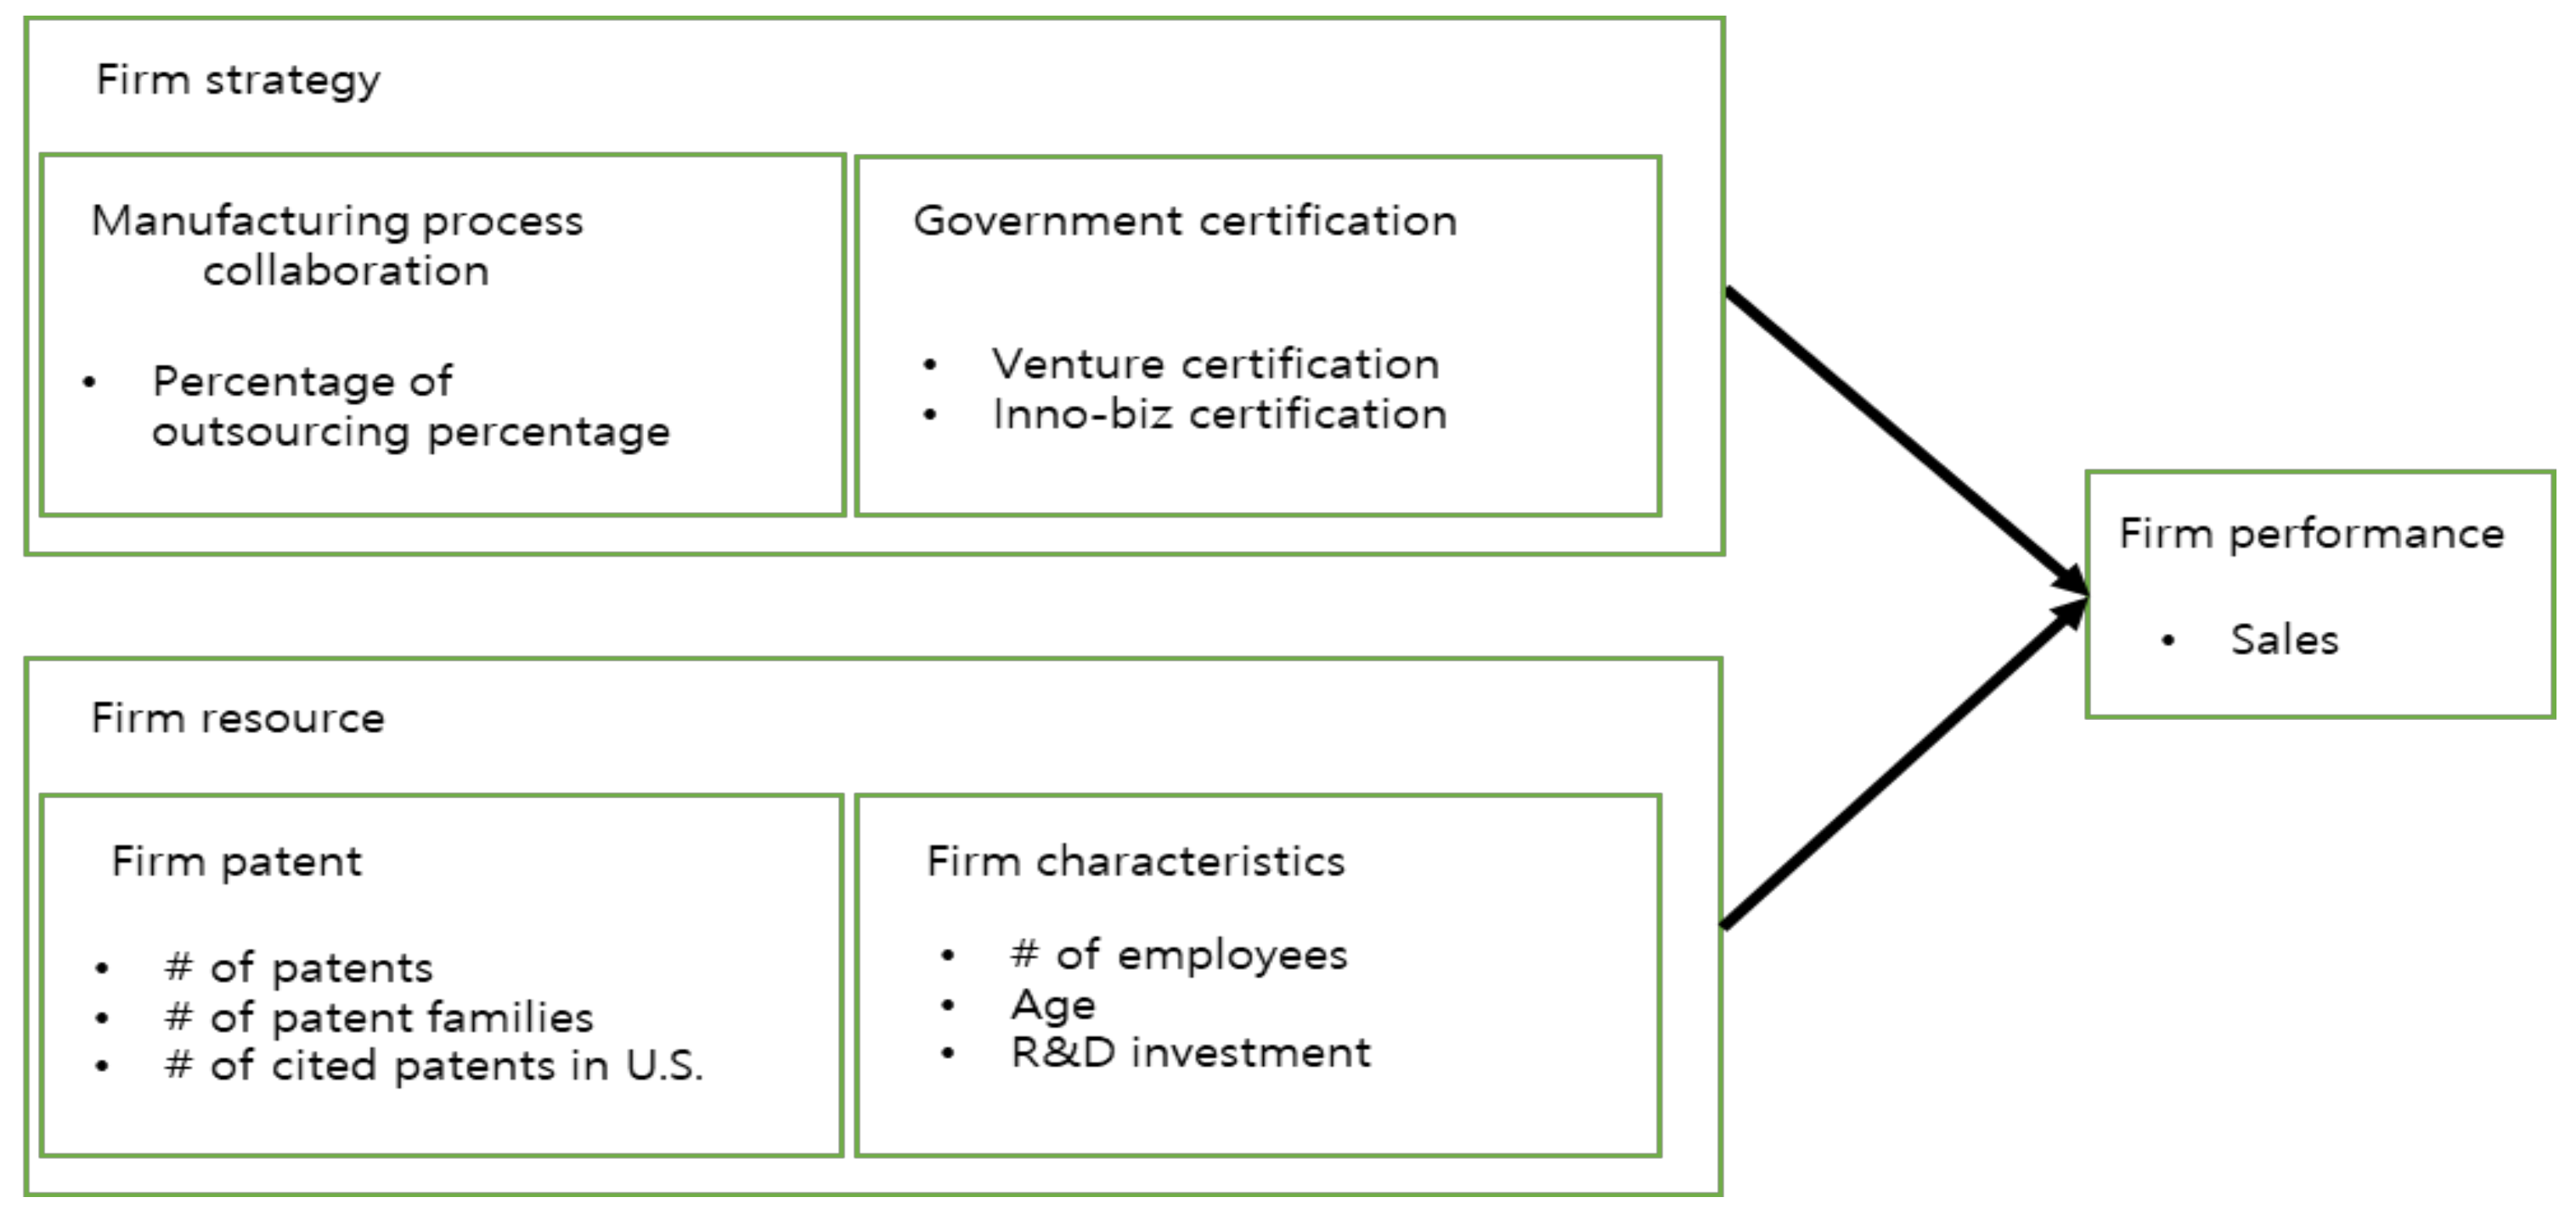
To verify the hypotheses, the research model is drawn in Figure 1.
The research model is divided into firm strategy and firm resources based on RBV. The firm strategy consists of manufacturing process collaboration and government certification. Firm resources consist of firm patents and firm characteristics. The model is intentionally simplified to measure the effect of firm resources and firm strategy. There might be other relevant variables, which are not included in this model. Nonetheless, the model was developed, as shown in Figure 1, with the specific purpose of testing the above-stated hypotheses. Further research might help to extend the current model and find different relationships.
3. Data and Econometric Specification
3.1. Variables
The variables used in this study are presented in Table 1. Sales is a proxy of firm performance as a dependent variable. The independent variables consist of firm strategy and firm resources. The manufacturing process collaboration of the firm strategy is a percentage of outsourcing, and the government certification concerns whether the company received InnoBiz certification, venture certification, or both.
Firm resources consist of firm patents and firm characteristics. The number of patents, family patents, and cited patents were used as variables of firm patents. The age, number of employees, and R&D investment were used as variables to control firm characteristics.
3.2. Data
Among the SMEs, supported by the R&D project of the Small and Medium Business Administration, data concerning healthcare IT SMEs were collected, and SMEs are divided into the manufacturing industry and the service industry, according to the standard industry classification [77]). The data of a total of 858 SMEs are used: 733 SMEs in the manufacturing sector and 125 SMEs in the service sector. SMEs’ basic information and management information (sales, age, number of employees, R&D intensity) are collected from Korean company data (KED), and patent information is collected from WIPS (http://www.wipscorp.com/main.wips, a Korean company offering global patent information services). The outsourcing percentage of companies, and information concerning whether to obtain the government certification system, is based on the survey data of Small and Medium Business Administration.
Information from 2011 to 2013 concerning whether or not the company received a government certification is used. The remaining variables data are based on the three-year average from 2011 to 2013. Descriptive statistics on healthcare IT firms is presented in Table 2. Information about the service sector and manufacturing is presented in Appendix Table A1 and Table A2.
3.3. Analysis Model
Multiple regression was applied for the statistical analysis of financial performance. Multiple regression model with firm performance (y = sales) can be expressed as follows:
Note: Out = Outsourcing, I/V = Certification, PatentA = # of patent, PatentF = # of patent Family, PatentC = # of cited patent, Age = Age, EMP = # of employees, RND = R&D.
The correlation of the variables used, and the variance inflation factor (VIF) of the explanatory variables, are shown in Table 3. If VIF is less than 10, multicollinearity does not exist [78]. As shown in Table 3, the VIF of each variable is smaller than 10. Thus, the variables used in this study do not have multicollinearity.
4. Summary of Findings
The analysis on whether open innovation is better for SMEs is done by a multiple regression model through Stata. We constructed three models: Model 1 is the analysis of the entire healthcare IT industry, model 2 is the manufacturing industry only, and model 3 is the service industry only. The results, in the same order as the hypotheses, are presented in Table 4. The findings, explaining whether they rejected the hypotheses, are described.
In the manufacturing process for the commercialization of products, the higher the cooperation with external companies, the greater the positive effect on the sales in the manufacture industry, but this cooperation has no significant effect in the service industry (Hypothesis 1 is partially accepted).
Most hypotheses investigating the influence of government policies are rejected (Hypothesis 2b and Hypothesis 2c are rejected), except for Hypothesis 2a, which is accepted in the service industry but not in the manufacture industry. In other words, obtaining venture certification has no impact on the service and the manufacturing industry. The InnoBiz certification has an insignificant effect on the sales of the manufacturing industry, but a positive effect on the service industry. However, when firms obtain both certifications, there is no effect at all, not even in the service industry. This means that only the InnoBiz certification has a positive effect on sales in the service industry. In the case of the manufacture industry, when the firm has both InnoBiz certification and venture certification, sales are negatively affected compared to firms with no certification.
Hypothesis 3b is accepted. In other words, the more patents, the more advanced and powerful the technology and the greater the sales of SMEs. However, Hypothesis 3a, in which a larger number of patent families would have a positive impact on sales, is rejected in both the manufacturing and the service industry. Even possessing more patent families has a significantly negative effect on firm performance.
5. Discussion and Limitations
5.1. Discussion
SMEs must have innovativeness and establish commercialization strategies to increase firm performance. As an extension of studies on the capabilities of SMEs based on RBV, the importance of collaborating with other companies is considered in this study. Especially, the fast-growing health care industry is converging with IT and can profit, not only from the innovation itself, but also from any commercialization manufacturing process strategy. Simultaneously, government support policies that are important to SMEs in the early stage of the life cycle of convergence sectors help SMEs to reach a better firm performance. However, previous studies are mostly based on RBV [9,10,11,12,13,14,15,16,17], and even the studies considering the collaboration could not consider the government support policy as the firm strategy [22,23,24,25]. Therefore, this study proposed a research model for firm performance by adding an open innovation perspective to RBV. First, factors affecting firm performance are classified as firm strategy and firm resources. The firm strategy is divided into external cooperation and government certification policy. As a firm resource, the patents and characteristics of the firm were taken into account.
First, cooperation with external companies in the manufacturing process for commercialization has a positive effect on firms in the manufacture industry. Despite the risks associated with outsourcing, it can provide benefits, such as costs and time savings [79,80,81]. This study found that outsourcing in the manufacturing process is better for the firm’s strategy in the healthcare IT industry, and previous studies revealed that outsourcing could improve the firm performance [45,46,47]. Unlike a large company with a scale of economy, it can be good for the company’s performance to cooperate in the manufacturing process, as this process requires multiple resources.
Even though the government’s support policy has a positive effect on firm performance [52,53], it is found that the current government certification system as the current support policy was not effective in this study. Similar results, concerning the venture capital, have also been found in studies regarding government support for SMEs [82,83,84]. If the current government certification system is maintained, it may be effective to focus on the service industry but not the manufacture industry. Furthermore, it would be counterproductive for a company to receive both venture and InnoBiz certification, so the company may need to avoid receiving both certifications. Moreover, among the certified companies, there are some that do not actually do R&D. Therefore, the process of certification for policy efficiency should be considered again.
Unlike in previous studies [19,63,64], the number of family patents has a negative impact on firm performance. This means that, rather than registering as many patents as possible in other countries, registering a patent only in its target country is good for firm performance. In summary, SMEs should develop high quality technology as much as they can, but it may be better for sales not to invest in registering patents in other countries, unless there is a market for commercialization.
5.2. Limitations
The limitations of this study are as follows. First, it is significant that this study measured outsourcing as a proxy for the degree of external collaboration. However, since this study used only Korean data, it is necessary to study data from the U.S. or other countries. In this study, we focused on technology innovation and cooperation in commercialization and took variables into account. Further studies need to consider strategies of SMEs, taking into account other variables as well. In addition, it is necessary to analyze the important factors of sales in each group benefiting from each government certification in order to present the direction of government policy development. Despite these limitations, this study is meaningful in that it presents a commercialization strategy for SMEs in the era of healthcare and IT convergence.
6. Conclusions
This study extends the RBV by combining it with open innovation to explain the firm collaboration strategy with external organizations. In conclusion, it is important for SMEs to strive to develop high technology, but it is also beneficial for them to cooperate with other firms in the commercialization process. Furthermore, it is advantageous to not receive government certification, unless it is a firm in the service industry.
Author Contributions
Conceptualization, E.K. and H.K.; Methodology, E.K. and H.K.; Data Curation, H.K. and E.K.; Writing—Original Draft Preparation, H.K. and E.K.; Writing—Review & Editing, E.K. and H.K.; Supervision, E.K.; Project Administration, E.K.; Funding Acquisition, E.K.
Funding
This research received no external funding.
Acknowledgments
This research is supported by The International Science and Business Belt Program through the Ministry of Science, ICT and Future Planning (2016K000282), Republic of Korea. This research was supported by a grant of the Medical Research Information Center of the National Research Foundation through the Ministry of Science and ICT (2018R1A6A6040880), Republic of Korea.
Conflicts of Interest
The authors declare no conflict of interest.
Appendix A

Table A1.
Descriptive statistics of manufacture industry.
| Dependent Variable | Variable | Number of Firms | Mean | Std. Dev. | Min | Max | |
| Firm performance | Sales (billion KRW) | 733 | 10.917 | 39.78653 | 0 | 674.867 | |
| Independent Variable | Variable | Number of Firms | Mean | Std. Dev. | Min | Max | |
| Firm strategy | Manufacturing process collaboration | Outsourcing | 733 | 27.43656 | 31.98263 | 0 | 100 |
| Government certification | Certification | 2.379263 | 1.292351 | 1 | 4 | 2.379263 | |
| Firm resources | Firm patents | # of patents | 1.178718 | 3.00112 | 0 | 44.66666 | 1.178718 |
| # of patent families | 2.581628 | 6.476984 | 0 | 80.33334 | 2.581628 | ||
| # of cited patents | 0.017735 | 0.134357 | 0 | 2.333333 | 0.017735 | ||
| Firm characteristics | Age | 733 | 10.51023 | 7.115093 | 1 | 58 | |
| # of employees | 733 | 36.65211 | 91.76058 | 1 | 1317 | ||
| R&D (million KRW) | 733 | 256.7136 | 1348.172 | 0 | 21169.52 |
Table A2.
Descriptive statistics of service industry.
| Dependent Variable | Variable | Number of Firms | Mean | Std. Dev. | Min | Max | |
| Firm performance | Sales (billion KRW) | 125 | 3.367852 | 10.60352 | 0 | 100.6813 | |
| Independent Variable | Variable | Number of Firms | Mean | Std. Dev. | Min | Max | |
| Firm strategy | Manufacturing process collaboration | Outsourcing | 125 | 2.44 | 12.33955 | 0 | 100 |
| Government certification | Certification | 125 | 1.792 | 1.145088 | 1 | 4 | |
| Firm resources | Firm patent | # of patents | 125 | 0.208 | 0.370663 | 0 | 1.666667 |
| # of patent families | 125 | 0.450667 | 0.71874 | 0 | 3.333333 | ||
| # of cited patents | 125 | 0 | 0 | 0 | 0 | ||
| Firm characteristics | Age | 125 | 7.312 | 5.19835 | 1 | 33 | |
| # of employees | 125 | 20.48 | 39.4019 | 1 | 256 | ||
| R&D (million KRW) | 125 | 6.871552 | 56.89774 | 0 | 621.464 |
Note: KRW = Korean Republic Won. certification: 1 = nothing, 2 = InnoBiz certification, 3 = venture certification, 4 = both InnoBiz certification and venture certification.
References
- Firouzi, F.; Rahmani, A.M.; Mankodiya, K.; Badaroglu, M.; Merrett, G.V.; Wong, P.; Farahani, B. Internet-of-Things and big data for smarter healthcare: From device to architecture, applications and analytics. Future Gener. Comput. Syst. 2018, 78, 583–586. [Google Scholar] [CrossRef]
- Shin, D.C. ICT and Healthcare in Korea: Present and Perspectives. Jpn. Med. Assoc. J. 2014, 57, 75–83. [Google Scholar]
- Park, J.; Shim, W.; Lee, J. A study for Promoting Digital Healthcare in Korea through an Improved Regulatory System. Inf. Policy 2018, 25, 60–81. [Google Scholar]
- Hudson, M.; Smart, A.; Bourne, M. Theory and practice in SME performance measurement systems. Int. J. Oper. Prod. Manag. 2001, 21, 1096–1115. [Google Scholar] [CrossRef]
- Qian, G.; Li, L. Profitability of small-and medium-sized enterprises in high-tech industries: The case of the biotechnology industry. Strateg. Manag. J. 2003, 24, 881–887. [Google Scholar] [CrossRef]
- Grant, R.M. The resource-based theory of competitive advantage: Implications for strategy formulation. Knowl. Strategy 1999, 33, 114–135. [Google Scholar]
- Crawford, C.M. New product failure rates—Facts and fallacies. Res. Manag. 1979, 22, 9–13. [Google Scholar] [CrossRef]
- Berggren, E.; Nacher, T. Introducing new products can be hazardous to your company: Use the right new-solutions delivery tools. Acad. Manag. Executive 2001, 15, 92–101. [Google Scholar] [CrossRef]
- Eisenhardt, K.M.; Martin, J.A. Dynamic capabilities: What are they? Strateg. Manag. J. 2000, 21, 1105–1121. [Google Scholar] [CrossRef]
- Acs, Z.J.; Audretsch, D.B. Innovation in large and small firms: An empirical analysis. Am. Econ. Rev. 1988, 78, 678–690. [Google Scholar] [CrossRef]
- Nooteboom, B. Innovation and diffusion in small firms: Theory and evidence. Small Bus. Econ. 1994, 6, 327–347. [Google Scholar] [CrossRef]
- Barney, J. Firm resources and sustained competitive advantage. J. Manag. 1991, 17, 99–120. [Google Scholar] [CrossRef]
- Dierickx, I.; Cool, K. Asset stock accumulation and sustainability of competitive advantage. Manag. Sci. 1989, 35, 1504–1511. [Google Scholar] [CrossRef]
- Priem, R.L.; Butler, J.E. Is the resource-based “view” a useful perspective for strategic management research? Acad. Manag. Rev. 2001, 26, 22–40. [Google Scholar]
- Teece, D.J.; Pisano, G.; Shuen, A. Dynamic capabilities and strategic management. Strateg. Manag. J. 1997, 18, 509–533. [Google Scholar] [CrossRef] [Green Version]
- Wang, C.L.; Ahmed, P.K. Dynamic capabilities: A review and research agenda. Int. J. Manag. Rev. 2007, 9, 31–51. [Google Scholar] [CrossRef]
- Verona, G. A resource-based view of product development. Acad. Manag. Rev. 1999, 24, 132–142. [Google Scholar] [CrossRef]
- Trajtenberg, M. A penny for your quotes: Patent citations and the value of innovations. RAND J. Econ. 1990, 21, 172–187. [Google Scholar] [CrossRef]
- Harhoff, D.; Scherer, F.M.; Vopel, K. Citations, family size, opposition and the value of patent rights. Res. Policy 2003, 32, 1343–1363. [Google Scholar] [CrossRef] [Green Version]
- Song, X.M.; Parry, M.E. A cross-national comparative study of new product development processes: Japan and the United States. J. Mark. 1997, 61, 1–18. [Google Scholar] [CrossRef]
- Mitchell, V.L.; Zmud, R.W. The effects of coupling IT and work process strategies in redesign projects. Organ. Sci. 1999, 10, 424–438. [Google Scholar] [CrossRef]
- Ahuja, G. Collaboration networks, structural holes, and innovation: A longitudinal study. Adm. Sci. Q. 2000, 45, 425–455. [Google Scholar] [CrossRef]
- Zahra, S.A.; Nielsen, A.P. Sources of capabilities, integration and technology commercialization. Strateg. Manag. J. 2002, 23, 377–398. [Google Scholar] [CrossRef] [Green Version]
- Nieto, M.J.; Santamaría, L. The importance of diverse collaborative networks for the novelty of product innovation. Technovation 2007, 27, 367–377. [Google Scholar] [CrossRef] [Green Version]
- Ku, K.C.; Kao, H.P.; Gurumurthy, C.K. Virtual inter-firm collaborative framework—An IC foundry merger/acquisition project. Technovation 2007, 27, 388–401. [Google Scholar] [CrossRef]
- Klepper, S. Entry, exit, growth, and innovation over the product life cycle. Am. Econ. Rev. 1996, 86, 562–583. [Google Scholar]
- Martí, J.; Quas, A. A beacon in the night: Government certification of SMEs towards banks. Small Bus. Econ. 2018, 50, 397–413. [Google Scholar] [CrossRef]
- Lerner, J. The government as venture capitalist: The longrun impact of the SBIR program. J. Bus. 1999, 72, 285–318. [Google Scholar] [CrossRef]
- Lerner, J. When Bureaucrats Meet Entrepreneurs: The Design of Effective Public Venture Capital Programmes. Econ. J. 2002, 112, 73–84. [Google Scholar] [CrossRef]
- Luke, R.D.; Begun, J.W.; Pointer, D.D. Quasi firms: Strategic interorganizational forms in the health care industry. Acad. Manag. Rev. 1989, 14, 9–19. [Google Scholar] [CrossRef]
- Bossink, B.A. The development of co–innovation strategies: Stages and interaction patterns in interfirm innovation. R D Manag. 2002, 32, 311–320. [Google Scholar] [CrossRef]
- Arora, A.; Gambardella, A. Evaluating technological information and utilizing it: Scientific knowledge, technological capability, and external linkages in biotechnology. J. Econ. Behav. Organ. 1994, 24, 91–114. [Google Scholar] [CrossRef]
- Chesbrough, H. The logic of open innovation: Managing intellectual property. Calif. Manag. Rev. 2003, 45, 33–58. [Google Scholar] [CrossRef]
- Christensen, J.F.; Olesen, M.H.; Kjær, J.S. The industrial dynamics of Open Innovation—Evidence from the transformation of consumer electronics. Res. Policy 2005, 34, 1533–1549. [Google Scholar] [CrossRef]
- Lettl, C.; Herstatt, C.; Gemuenden, H.G. Users’ contributions to radical innovation: Evidence from four cases in the field of medical equipment technology. R D Manag. 2006, 36, 251–272. [Google Scholar] [CrossRef]
- West, J.; Gallagher, S. Challenges of open innovation: The paradox of firm investment in open-source software. R D Manag. 2006, 36, 319–331. [Google Scholar] [CrossRef]
- Enkel, E.; Gassmann, O.; Chesbrough, H. Open R&D and open innovation: Exploring the phenomenon. R D Manag. 2009, 39, 311–316. [Google Scholar]
- Chesbrough, H.; Crowther, A.K. Beyond high tech: Early adopters of open innovation in other industries. R D Manag. 2006, 36, 229–236. [Google Scholar] [CrossRef]
- Lichtenthaler, U.; Ernst, H. External technology commercialization in large firms: Results of a quantitative benchmarking study. R D Manag. 2007, 37, 383–397. [Google Scholar] [CrossRef]
- Becker, W.; Dietz, J. R&D cooperation and innovation activities of firms—Evidence for the German manufacturing industry. Res. Policy 2004, 33, 209–223. [Google Scholar]
- Faems, D.; Van Looy, B.; Debackere, K. Interorganizational collaboration and innovation: Toward a portfolio approach. J. Prod. Innov. Manag. 2005, 22, 238–250. [Google Scholar] [CrossRef]
- Vachon, S.; Klassen, R.D. Environmental management and manufacturing performance: The role of collaboration in the supply chain. Int. J. Prod. Econ. 2008, 111, 299–315. [Google Scholar] [CrossRef]
- Carpay, F.; Hang, C.C.; Yu, D. Management of outsourcing R&D in the era of open innovation. In Proceedings of the 5th International Symposium on Management of Technology, Hangzhou, China, 1–3 June 2007; pp. 252–266. [Google Scholar]
- Lichtenthaler, U. Open innovation in practice: An analysis of strategic approaches to technology transactions. IEEE Trans. Eng. Manag. 2008, 55, 148–157. [Google Scholar] [CrossRef]
- Tomlinson, P.R. Co-operative ties and innovation: Some new evidence for UK manufacturing. Res. Policy 2010, 39, 762–775. [Google Scholar] [CrossRef]
- Kroes, J.R.; Ghosh, S. Outsourcing congruence with competitive priorities: Impact on supply chain and firm performance. J. Oper. Manag. 2010, 28, 124–143. [Google Scholar] [CrossRef]
- Varadarajan, R. Outsourcing: Think more expansively. J. Bus. Res. 2009, 62, 1165–1172. [Google Scholar] [CrossRef]
- Kuo, C.-J.; Chen, C.-M.; Sung, C.-H. Evaluating guarantee fees for loans to small and medium-sized enterprises. Small Bus. Econ. 2011, 37, 205–218. [Google Scholar] [CrossRef]
- Busom, I.; Corchuelo, B.; Martínez-Ros, E. Tax incentives… or subsidies for Business R&D? Small Bus. Econ. 2014, 4, 571–596. [Google Scholar] [CrossRef]
- Nemet, G.F. Demand-pull, technology-push, and government-led incentives for non-incremental technical change. Res. Policy 2009, 38, 700–709. [Google Scholar] [CrossRef]
- Klaassen, G.; Miketa, A.; Larsen, K.; Sundqvist, T. The impact of R&D on innovation for wind energy in Denmark, Germany and the United Kingdom. Ecol. Econ. 2005, 54, 227–240. [Google Scholar]
- Shin, S.; Kim, M. The Effects of Innovation Type SME Certificates focused on the Financial Performance between the Inno biz and the Main biz. Korean Manag. Consult. Rev. 2013, 13, 193–217. [Google Scholar]
- Kwak, S.; Suh, C. A Comparison of Management Performance between Technology Innovation and Management Innovation Companies. Korean Prod. Oper. Manag. Soc. 2010, 21, 321–337. [Google Scholar]
- Rosenbusch, N.; Brinckmann, J.; Bausch, A. Is innovation always beneficial? A meta-analysis of the relationship between innovation and performance in SMEs. J. Bus. Ventur. 2011, 26, 441–457. [Google Scholar] [CrossRef] [Green Version]
- Pullen, A.J.; Weerd-Nederhof, P.C.; Groen, A.J.; Fisscher, O.A. Open innovation in practice: Goal complementarity and closed NPD networks to explain differences in innovation performance for SMEs in the medical devices sector. J. Prod. Innov. Manag. 2012, 29, 917–934. [Google Scholar] [CrossRef]
- Narin, F.; Noma, E.; Perry, R. Patents as indicators of corporate technological strength. Res. Policy 1987, 16, 143–155. [Google Scholar] [CrossRef]
- Griliches, Z. Patent statistics as economic indicators: A survey. In R&D and Productivity: The Econometric Evidence; University of Chicago Press: Chicago, IL, USA, 1998; pp. 287–343. [Google Scholar]
- Acs, Z.J.; Audretsch, D.B.; Feldman, M.P. Real effects of academic research: Comment. Am. Econ. Rev. 1992, 82, 363–367. [Google Scholar]
- Scherer, F.M. Firm size, market structure, opportunity, and the output of patented inventions. Am. Econ. Rev. 1965, 55, 1097–1125. [Google Scholar]
- Cormanor, W.S.; Scherer, F.M. Patent statistics as a measure of technical change. J. Political Econ. 1969, 77, 392–398. [Google Scholar] [CrossRef]
- Ernst, H. Patenting strategies in the German mechanical engineering industry and their relationship to company performance. Technovation 1995, 15, 225–240. [Google Scholar] [CrossRef]
- Chang, Y.H.; Yang, W.G.; Lai, K.K. Valuable patent or not? Depends on the combination of internal patent family and external citation. In Proceedings of the Technology Management for Global Economic Growth (PICMET), Phuket, Thailand, 18–22 July 2010; pp. 1–6. [Google Scholar]
- Agostini, L.; Caviggioli, F.; Filippini, R.; Nosella, A. Does patenting influence SME sales performance? A quantity and quality analysis of patents in Northern Italy. Eur. J. Innov. Manag. 2015, 18, 238–257. [Google Scholar] [CrossRef]
- Agostini, L.; Nosella, A.; Soranzo, B. The impact of formal and informal appropriability regimes on SME profitability in medium high-tech industries. Technol. Anal. Strateg. Manag. 2015, 27, 405–419. [Google Scholar] [CrossRef]
- Lin, B.W.; Chen, C.J.; Wu, H.L. Patent portfolio diversity, technology strategy, and firm value. IEEE Trans. Eng. Manag. 2006, 53, 17–26. [Google Scholar] [Green Version]
- Breitzman, A.; Thomas, P. Using patent citation analysis to target/value M&A candidates. Res.-Technol. Manag. 2002, 45, 28–36. [Google Scholar]
- Bruce, A.; Christopher, T. R&D intensity and acquisitions in high-technology industries: Evidence from the US electronic and electrical equipment industries. J. Ind. Econ. 2002, 48, 47–70. [Google Scholar]
- Song, S.-H. The relationships between types of firms and technical innovation influences in the telecommunication hardware industry: Configuration approach. KASBA 1995, 14, 65–111. (In Korean) [Google Scholar]
- Uotila, J.; Maula, M.; Keil, T.; Zahra, S.A. Exploration, exploitation, and financial performance: Analysis of S&P 500 corporations. Strateg. Manag. J. 2009, 30, 221–231. [Google Scholar]
- Loderer, C.F.; Waelchli, U. Firm Age and Performance. Available online: https://ssrn.com/abstract=1342248 (accessed on 13 June 2018).
- Paul, J.; Parthasarathy, S.; Gupta, P. Exporting challenges of SMEs: A review and future research agenda. J. World Bus. 2017, 52, 327–342. [Google Scholar] [CrossRef]
- Pavitt, K.; Robson, M.; Townsend, J. The size distribution of innovating firms in the UK: 1945–1983. J. Ind. Econ. 1987, 35, 297–316. [Google Scholar] [CrossRef]
- Cohen, W.M.; Klepper, S. A reprise of size and R&D. Econ. J. 1996, 106, 925–951. [Google Scholar]
- Rogers, M. Networks, firm size and innovation. Small Bus. Econ. 2004, 22, 141–153. [Google Scholar] [CrossRef]
- Ortega-Argilés, R.; Potters, L.; Vivarelli, M. R&D and productivity: Testing sectoral peculiarities using micro data. Empir. Econ. 2011, 41, 817–839. [Google Scholar]
- Lichtenberg, F.R.; Siegel, D. The impact of R&D investment on productivity–New evidence using linked R&D–LRD data. Econ. Inq. 1991, 29, 203–229. [Google Scholar]
- KHIDI. Development of Value Assessment Model for IT Converged Healthcare Services; Korea heath industry development institute (KHIDI): Seoul, Korea, 2013. [Google Scholar]
- Myers, R.H. Detecting and combating multicollinearity. In Classical and Modern Regression with Applications; ASA: Boston, MA, USA, 1990; pp. 368–423. [Google Scholar]
- Bozarth, C.; McDermott, C. Configurations in manufacturing strategy: A review and directions for future research. J. Oper. Manag. 1998, 16, 427–439. [Google Scholar] [CrossRef]
- Heikkila, J.; Cordon, C. Outsourcing: A core or non-core strategic management decision? Strateg. Chang. 2002, 11, 183–193. [Google Scholar] [CrossRef]
- Holcomb, T.R.; Hitt, M.A. Toward a model of strategic outsourcing. J. Oper. Manag. 2007, 25, 464–481. [Google Scholar] [CrossRef]
- Bertoni, F.; Tykvová, T. Does governmental venture capital spur invention and innovation? Evidence from young European biotech companies. Res. Policy 2015, 44, 925–935. [Google Scholar] [CrossRef]
- Grilli, L.; Murtinu, S. Government, venture capital and the growth of European high-tech entrepreneurial firms. Res. Policy 2014, 43, 1523–1543. [Google Scholar] [CrossRef]
- Alperovych, Y.; Groh, A.; Quas, A. When Can Government Venture Capital Funds Bridge the Equity Gap? Available online: http://papers.ssrn.com/abstract=2718061 (accessed on 12 December 2016).
Figure 1.
Research Framework.

Table 1.
Explanation of variables.
| Dependent Variable | Variable | Explanation | Reference | |
| Firm performance | Financial performance | Sales | Firm’s sales | [75] |
| Independent Variable | Variable | Explanation | Reference | |
| Firm strategy | Manufacturing process collaboration | Outsourcing | The percentage of outsourcing in the manufacturing process | [47] |
| Government certification | Certification | Whether the firm has InnoBiz certification or venture certification or both | [52,53] | |
| Firm resources | Firm patents | # of patents | Number of registered patents | [60] |
| # of patent families | Number of family patents | [18] | ||
| # of cited patents | Number of cited patents | [65] | ||
| Firm characteristics | Age | Age of the firm | [54] | |
| # of employees | Number of employees | [74] | ||
| R&D investment | The amount of R&D investment | [76] |
Table 2.
Descriptive statistics.
| Dependent Variable | Variable | Number of Firms | Mean | Std. Dev. | Min | Max | |
| Firm performance | Sales (billion KRW) | 858 | 9.817185 | 37.08705 | 0 | 674.867 | |
| Independent Variable | Variable | Number of Firms | Mean | Std. Dev. | Min | Max | |
| Firm strategy | Manufacturing process collaboration | Outsourcing | 858 | 23.79487 | 31.20228 | 0 | 100 |
| Government certification | Certification | 858 | 2.293706 | 1.288123 | 1 | 4 | |
| Firm resources | Firm patents | # of patents | 858 | 1.037296 | 2.798271 | 0 | 44.66666 |
| # of patent families | 858 | 2.271173 | 6.039287 | 0 | 80.33334 | ||
| # of cited patents | 858 | 0.015152 | 0.12433 | 0 | 2.333333 | ||
| Firm characteristics | Age | 858 | 10.04429 | 6.958815 | 1 | 58 | |
| # of employees | 858 | 34.29604 | 86.3082 | 1 | 1317 | ||
| R&D (million KRW) | 858 | 220.3147 | 1249.283 | 0 | 21169.52 |
Note: KRW = Korean Won. Certification: 1 = nothing, 2 = InnoBiz certification, 3 = venture certification, 4 = both InnoBiz certification and venture certification.
Table 3.
Summary of coefficient of correlation and VIF.
| VIF | Sales | EMP | Age | PatentA | PatentF | PatentC | I/V | Out | RND | |
|---|---|---|---|---|---|---|---|---|---|---|
| sales | 1.0000 | |||||||||
| EMP | 2.32 | 0.8648 | 1.0000 | |||||||
| Age | 1.14 | 0.0623 | 0.1903 | 1.0000 | ||||||
| PatentA | 6.43 | 0.3279 | 0.3192 | −0.0978 | 1.0000 | |||||
| PatentF | 8.88 | 0.3836 | 0.4257 | −0.0809 | 0.8862 | 1.0000 | ||||
| PatentC | 1.72 | 0.222 | 0.0779 | −0.1461 | 0.5301 | 0.4449 | 1.0000 | |||
| I/V | 1.28 | −0.2664 | −0.3143 | −0.2072 | 0.1447 | 0.1070 | 0.0911 | 1.0000 | ||
| Out | 1.05 | −0.03 | −0.1342 | −0.0341 | −0.0640 | −0.1005 | −0.0564 | 0.0167 | 1.0000 | |
| RND | 2.47 | 0.7428 | 0.5747 | −0.1109 | 0.5229 | 0.5432 | 0.4904 | 0.0341 | −0.1523 | 1.0000 |
Note: EMP = # of employees, Age = Age, PatentA = # of patent, PatentF = # of patent Family, PatentC = # of cited patent, I/V = Certification, Out = Outsourcing, RND = R&D.
Table 4.
Results of regression.
| Variables | Model 1 | Model 2 | Model 3 | ||
|---|---|---|---|---|---|
| Firm strategy | Manufacturing process collaboration | Outsourcing | 0.0531 ** | 0.0518 ** | 0.0125 |
| (0.0208) | (0.0237) | (0.0177) | |||
| Government certification | InnoBiz certification | −2.808 | −4.494 | 40.48 *** | |
| (2.846) | (3.128) | (2.494) | |||
| Venture certification | −1.078 | −1.471 | 0.865 | ||
| (1.754) | (2.055) | (0.589) | |||
| InnoBiz certification + Venture certification | −4.788 *** | −5.131 ** | 0.578 | ||
| (1.824) | (2.063) | (0.850) | |||
| Firm resources | Firm patents | # of patents | 2.212 *** | 2.260 *** | 1.573 * |
| (0.442) | (0.475) | (0.799) | |||
| # of patent families | −1.289 *** | −1.327 *** | −0.742 * | ||
| (0.231) | (0.249) | (0.376) | |||
| # of cited patents in the U.S. | 49.84 *** | 50.36 *** | |||
| (13.91) | (14.90) | ||||
| Firm characteristics | # of employees | 0.281 *** | 0.287 *** | 0.128 *** | |
| (0.0107) | (0.0118) | (0.00684) | |||
| Age | 0.0885 | 0.0817 | 0.0128 | ||
| (0.119) | (0.132) | (0.0594) | |||
| R&D investment | 0.0091 *** | 0.0089 *** | 0.0454 *** | ||
| (0.000736) | (0.000791) | (0.00569) | |||
| Constant | −1.998 | −1.633 | −0.653 | ||
| (1.337) | (1.652) | (0.416) | |||
| Observations | 858 | 733 | 125 | ||
| R-squared | 0.745 | 0.746 | 0.953 | ||
Note: Standard errors in parentheses. *** p < 0.01, ** p < 0.05, * p < 0.1.
© 2018 by the authors. Licensee MDPI, Basel, Switzerland. This article is an open access article distributed under the terms and conditions of the Creative Commons Attribution (CC BY) license (http://creativecommons.org/licenses/by/4.0/).
Share and Cite
MDPI and ACS Style
Kim, H.; Kim, E. How an Open Innovation Strategy for Commercialization Affects the Firm Performance of Korean Healthcare IT SMEs. Sustainability 2018, 10, 2476. https://doi.org/10.3390/su10072476
AMA Style
Kim H, Kim E. How an Open Innovation Strategy for Commercialization Affects the Firm Performance of Korean Healthcare IT SMEs. Sustainability. 2018; 10(7):2476. https://doi.org/10.3390/su10072476
Chicago/Turabian StyleKim, Hana, and Eungdo Kim. 2018. "How an Open Innovation Strategy for Commercialization Affects the Firm Performance of Korean Healthcare IT SMEs" Sustainability 10, no. 7: 2476. https://doi.org/10.3390/su10072476
Note that from the first issue of 2016, this journal uses article numbers instead of page numbers. See further details here.