Integrated Approaches for Business Sustainability: The Perspective of Corporate Social Responsibility


Institute of Business and Management, National Chiao Tung University, No. 118 Chung-Hsiao W. Rd., Sec. 1, Taipei City 10044, Taiwan
*
Author to whom correspondence should be addressed.
Sustainability 2018, 10(7), 2318; https://doi.org/10.3390/su10072318
Submission received: 16 June 2018
/
Revised: 26 June 2018
/
Accepted: 2 July 2018
/
Published: 4 July 2018
(This article belongs to the Section Economic and Business Aspects of Sustainability)
Abstract
:Although many companies are aware of the importance of sustainability and CSR, they still focus on profits without considering sustainable development. This study explores the relationships among corporate social responsibility (CSR), corporate reputation (CR) and corporate financial performance (CFP), by testing the mediating effect of CFP and constructing an integrated sustainability model based on the CSR perspective and stakeholder theory. Although many recent studies have investigated CSR using structural equation modeling to test the relationships among the three variables, measuring this mediation effect is quite rare in the literature. We use Reputation Institute as a secondary data source of CSR and CR and collect data for the period 2011–2017 on 39 companies in 15 countries (i.e., 273 observations). Firm size, sales growth rate, interest coverage ratio, age and industry are the control variables. Our results show that CR positively affects CFP and CSR. Furthermore, we find integrated approaches for business sustainability, revealing that CFP enhances CSR and also that it has a mediating effect on the relationship between CR and CSR.
1. Introduction
Schaltegger and Burritt [1] believe managers need to have motivations to lead their corporation to sustainable operations. Related studies divide motivation into four types: reactionary (short-term interest), reputational (corporation image), responsible (inside-out performance management system) and collaborative (working on guiding people outside who are affected by the business to have a conversation). With the increase in media focus and global impact, companies have to cultivate and maintain a specific image and reputation to bring about more interest. Performance is a relevant aspect in this kind of analysis [2], especially on financial achievement. Jones [3] assesses how reputation affects the Wall Street stock market between 1987 to 1989, showing that a better reputation less decreases share prices. Schnietz and Epstein [4] examine the Seattle WTO conference in 1999 and point out that, compared to those industries with lower reputations that dropped 2.36%, industries with good reputations only fell 1.1%, which seems not significant. Therefore, a good reputation can secure better financial status. From the stakeholder theory, when a company has better financial performance, stakeholders will have more expectations on its performances. Corporate social responsibility (CSR) is a crucial indicator, as it is now in a corporate financial report as well as the “CSR Area” on an enterprise’s homepage.
CSR is synonymous with sustainability [5]. The United Nations has further strengthened this identification through the “2030 Sustainable Development Agenda”, which includes 169 targets and 17 sustainable development goals based on the Millennium Development Goals and focuses on three aspects of sustainable development: economic, social and environmental. Many studies have been conducted on CSR in recent years, using structural equation modeling (SEM) to test the relationships among the three variables. In fact, it is quite rare in the literature to construct integrated approaches for business sustainability. The main objective of this study is to identify and construct the structural relationships among CR, CSR and CFP and to measure the mediating effect of CR on these relationships. This research uses Reputation Institute (RepTrak®) as a secondary data source for CR and CSR. In the research areas of CR and CSR, RepTrak® is a commonly used source of information.
Previous research on CR, CSR and CFP has primarily used data from developed countries such as the United States or those in Europe [6], whereas this study utilizes data from the Reputation Institute (RepTrak®) since it is one of the world’s most credible sources of CR and CSR data, with samples from the largest number of countries. RepTrak® data span 15 countries: Australia, Brazil, Canada, China, France, Germany, India, Italy, Japan, Mexico, the Netherlands, South Korea, Spain, the UK and the U.S. RepTrak® contains data from more than 150,000 respondents, all reflecting the consumer’s point of view. RepTrak® conducts a scorecard analysis using its standardized RepTrak® methodology to ensure relevance among corporate reputation with additional data available, including admiration and respect, recognized reputation, good feeling, trust and CSR, with additional data available on products/services, innovation, workplace, governance, citizenship, leadership and financial performance. We select Tobin’s Q, ROA, quick ratio, operating cycle and debt to tangible assets ratio, because they are commonly used as objective indicators in recent studies [7], to measure corporate financial performance. Since these secondary data represent results from the previous year (e.g., 2017 data are from 2016 performance), it is possible to maintain consistency of the sample over the fiscal year. In this research, a seven-year period of data and 39 companies comprise the sample, for a total of 273 observations. Firm size, sales growth rate, interest coverage ratio, age and industry are used as the control variables.
The primary contributions of this research are to verify that corporate reputation (CR) can increase corporate financial performance (CFP) and CSR and can help establish the sustainability of business operations by using SEM analysis, which differs from previous relevant research on CSR. Employing structural relationships to describe and test for CR, CFR and CSR, we find that CFP is an important intermediary variable. Previous studies have indicated that CR is a key factor in the relationship between CSR and competitive advantage [8] but these studies mainly focus on regression analysis through questionnaires (subjective data) or secondary (objective) information [9,10,11]. Some studies have used SEM analysis on questionnaire data [6] but very few have used secondary data [11]. This study employs secondary data to analyze CFP as a mediating variable and explores the impact of CR on CSR from an objective viewpoint.
This paper is organized as follows: Following the introduction, Section 2 reviews the literature and constructs hypotheses. Section 3 explains the methodology, variables and data. Section 4 describes empirical results. Section 5 discusses hypothesis verifications and research limitations. Section 6 concludes this paper.
2. Literature Review and Hypotheses
2.1. Corporate Social Responsibility (CSR)
Godfrey [12] believes CSR is a multidimensional structure with detailed definitions in documents, forming three main parts: (1) It helps carry out a business deal with real transparency. (2) In management decisions, all members’ welfare is considered. (3) It helps to seek and actively bring out the effect to the society, exceeding the minimum requirement of the law. According to Fombrun [13], CSR can be accessed through the following dimensions: Products & Services, Innovation, Workplace, Governance, Citizenship, Leadership and Performance. The score after the assessment is the CSR ranking calculation method used by Reputation Institute.
The marketplace presently believes that companies generally have a responsibility to operate in ways that fulfill the tenets of CSR. Over the past several decades, the literature devoted exclusively to a discussion about CSR has proliferated. The concept has not only been widely discussed in scholarship but has also been accepted as dogma in industry [14].
Although CSR means that a company’s management has a responsibility to society, it also implies that firms providing products and services to increasingly sensitive consumers must shoulder more responsibility for social welfare and environmental maintenance. However, in practice, the term has different meanings for everyone [6,15]. For some, CSR is the responsibility of the legal system, which represents ethical and philanthropic responsibilities; however, additional responsibilities are not entirely understood as direct obligations but rather like voluntary practice [14].
From a broad perspective, the World Business Council for Sustainable Development proposes that CSR signifies the continuing commitment of enterprises to contribute to ethical behavior and economic development, while doing everything possible to improve the quality of life for labor, their families and local communities [16]. The architecture of the different facets of CSR as proposed by Carroll [17] and Friedman [18] has been widely discussed in follow-up studies. Friedman believes that CSR is a company’s most fundamental management responsibility. When operated properly, CSR can contribute to increasing shareholder wealth. Carroll believes that CSR should include economic, legal, ethical and unconditional charity and social expectations and also that decisions regarding these objectives should be made by the manager of the company rather than regulated by law or decided by business interests.
Despite these divergent views, most of the various definitions of CSR in recent years have one thing in common: the need to be able to map out environmental management policies that are in line with social expectations. Since the hallmarks of the present business environment are rapid change and uncertainty, organizations must be able to adjust and adapt to social expectations to cope with the dynamic changes caused by globalization and technological improvement [15,19,20].
This research is based on Friedman’s study [18] and concurrently considers economic and ethical dimensions. We use the survey conducted by the Reputation Institute and refine its facets to include products/services, innovation, workplace, governance, citizenship, leadership and financial performance. The strong emphasis on the economic facet in this study is due to the fact that financial gain is an important pillar in the survival of a company and ethical behavior is just one of the factors affecting the survival of enterprises [21].
2.2. CSR and Corporate Reputation
CSR is based on an overall evaluation by corporate stakeholders, coming through direct experience derived from any form of communication between the stakeholders and the company and it is obtained through the information provided by the company regarding comparisons with its competitors [22]. Corporations will engage in CSR to improve social welfare in order to enhance corporate reputation (CR) [23]. The findings of [24] show that the relationship between CSR and CR contains both certainty and a degree of nuance. Many studies strongly indicate that CSR activities implemented by corporations involve the ambition to develop CR [9,25,26]. Furthermore, [27] note that the fulfillment of economic and/or non-economic CSR objectives could be a strategic means to increase CR.
In order to achieve a socially affirmative corporate reputation (CR), companies often implement CSR initiatives with seemingly selfless charity events; however, such selflessness is debatable [24]. Many enterprises insert their name, related merchandise, or even utilize placement marketing in these CSR-related events to improve their CR. Despite this, enhancing CR through CSR activities does benefit society and a firm’s business.
For CSR to enhance the relationship between economic responsibility and reputation, Fombrun states [28] the enterprise must satisfy its consumers by providing quality products and generate sufficient profits for investors. Under such conditions, CSR activities can improve corporate reputation. From this viewpoint, CSR must satisfy the requirements of economic responsibilities to be able to provide products and services that meet the social expectations and business ethics and thus enhance CR.
Reputation is comprised of legal responsibilities, ethical responsibilities and philanthropic responsibilities, which are described as follows [29].
Legal responsibilities: An enterprise must fulfill its economic mission within the legal framework. The financial world has recently witnessed many companies committing scandals, such as Enron and Arthur Anderson. Illegal behaviors by such companies have led these once prominent enterprises to financial ruin. These examples demonstrate consumers’ negative perception about these enterprises.
Ethical responsibilities: Legal responsibilities prevail over ethical responsibilities. Companies fulfill their ethical responsibilities to ensure that their behavior or actions will not harm individuals or the broader society. The nature of ethical responsibilities is what is right, just and fair. Previous studies have indicated that if consumers are aware of a company’s ethical activities, then that awareness will have a positive impact on its corporate reputation [30].
Philanthropic responsibilities: Enterprises voluntarily assume philanthropic responsibilities based on humanitarian principles using financial and/or non-financial resources. However, society expects that good corporate citizens will participate in charity activities to contribute to society.
Using the right tool for study is very important. The tool must be able to comply with the following three points to form an effective dynamic model of multi-layered structure causation: (1) it must be well known; (2) when studying CR, there must be cognitive facets to explore; (3) it must be widely used [31]. Casado & Peláez note [32] note that such a management tool must be able to regularly monitor and evaluate its impact on these companies from a public viewpoint and identify the most important content to explore. In addition to its tangible and intangible assets, it should have the following characteristics: a structured, multi-surface reconstruction; common relevance; and universal values must be difficult to manipulate, slowly accumulated, convertible for calculation and able to be classified and verified. During the past 10 years, many consultants and research institutions have developed comprehensive professional evaluation indicators of intangible assets such as reputation, brand and CSR, hoping to measure the thoughts and perceptions of primary stakeholders about their company and its competitors. The tool should have the perspective of multiple industries and geographical regions and be able to discuss the impact of differences among them comprehensively or separately. RepTrak® is one of the few tools that meets all of the aforementioned conditions and is the most commonly used tool with a proven reputation [33]. Fombrun [13] believes CR can be assessed by the following dimensions: Admiration and respect, Recognized reputation, Good feeling and Trust.
2.3. CSR and Corporate Financial Performance (CFP)
Much research analysis has taken place over the past 30 years on the relationship between CSR and Corporate Financial Performance (CFP). On the positive effect, some believe CSR can increase CFP or vice versa. There are still many controversies about which one is the cause and which one else is the result [34]. Barnett [35] believes the connection between CSR and financial performance target is still an unclear area. His study confirms there might be some missing critical connection or cause and effect problem on the impact from CSR to CFP or the direction of the correlation. It is worth noting that the main characteristics and limitations of the methodological approach, including the use of indicators [36].
Most present businesses are aware of the importance of CSR. In order to achieve sustainable development, companies must improve their influx of capital, establish CSR investment funds and redesign their business model. Marx [26] points out that numerous studies have attempted to explore the relationships between CFP and CSR indicators. There are many different opinions about these relationships [37] and conflicting findings exist in recent studies, such as the Islamic bank in Bangladesh increasing spending on CSR in 2007–2011 without its financial performance benefitting [38]. On the other hand, in the manufacturing industry in Indonesia, CSR has been shown to have a positive impact on firm performance [39] and CSR has demonstrated a positive relationship with organizational performance [40,41].
Ducassy [34] notes that CFP/CSR connectivity research mostly focuses on the short term. However, Godfrey [12] and Gardberg [42] believe that short-term research is unsuitable for any financial performance associated with CFP/CSR. Our study takes a different angle and utilizes seven years (from 2011 to 2017) of secondary documents from the Reputation Institute database as the topic of discussion in order to provide the new approach. Do companies increase CSR due to good business reputations? After the increase, the business reputation to gain financial target (e.g., financial ability) does not matter if it has come from the heart or the stakeholders’ expectation (e.g., customers, shareholders).
Friedman [18] states that moral responsibility drives those companies willing to execute CSR. Whatever you take from the society; use them for the society. Those corporations making more profit will have a greater ability to help out the community. They will also frequently exceed the need when contributing to social welfare [43,44].
2.4. Corporate Reputation and CSR: The Mediating Role of Corporate Financial Performance
Park et al. [29] believe that consumers are affected by information related to products and/or goodwill and generate feelings of esteem or dismissiveness as a result. Corporate Reputation (CR) is a cumulative measure of how customers evaluate how enterprises meet their needs and expectations [45]. Companies with a relatively high reputation typically enjoy higher sales growth and a greater return on assets (ROA); several studies have shown a positive correlation between reputation and corporate financial performance (CFP) [46,47,48,49]. A company’s performance depends upon its reputation and deliberate strategies can help to maintain and improve this reputation. In consumers’ eyes, companies with a higher reputation are considered to be less risky than competitors, even if their financial performance is similar [50,51].
2.5. Hypotheses
Vidaver-Cohen and Brønn [52] state that if one wants to clarify the relationship between CR and CSR, you need to have a better understanding of stakeholders’ intentions to participate and support a corporation’s behavior. Both scholars and managers note that in this “Information Age,” reputation has a larger effect on an organization’s survival ability. A strong CR can increase public confidence, reduce stakeholders’ uncertainty, improve the firm’s position to compete and also protect the organization when in danger or threatened [28]. In contrast, reputation damage to a corporation might be higher than any other risk [53]. Scholars have been paying attention to the improvement of the establishment of CR and the maintenance on CSR, noticing that there are many risks on CR in this global economy. There thus should be a more detailed perspective on how different cultures and traditions affect the CR-CSR nexus [54]. From these discussions, this research infers the following hypothesis.
Hypothesis 1 (H1).
A higher CR rating implies a higher CSR rating.
As seen from the past literature, not all research believes that CSR can directly increase CFP. Its relationship is complicated and might not have a direct cause and effect [55,56]. Previous literature also proves that the relationship between CFP and CSR might be circular. A company with good CFP can afford CSR and CSR can bring about more success to the company but might not be an instant return [44]. Under competitive dynamic circumstances, to use CSR as a strategy, a corporation needs to provide methods of problem-solving constantly, which is called the contingency perspective. Dressel [57] notes that since a corporation will choose to produce the most beneficial product and CSR can provide many advantages, CSR should be a primary investment project. Margolis & Walsh [43] pointed out that there is a connection between a firm with strong CFP and increased CSR. By integrating the above-mentioned, we present Hypothesis 2.
Hypothesis 2 (H2).
A higher CFP implies a better CSR rating.
Corporate reputation is a company’s intangible asset. A company’s overall reputation will directly or indirectly affect its financial performance [58]. Conversely, a company’s financial performance may also affect its reputation. Previous research has led us to understand that companies must first gain profit before they can improve their performance by enhancing their CR. This means that they should fulfill their commitments to shareholders and investors first, in order to create sufficient resources to support non-economic activities (e.g., charity) for CSR objectives. The operation of economic and/or non-economic CSR activities can be a strategic tool to increase CR [27,59]. From the previous discussion, we can rationalize that CR is an important factor linking CSR to financial performance. Previous studies have also shown that CR has a mediating effect on the relationship between CSR and CFP but these studies all employed subjective questionnaire data. To remedy this limitation, our research uses secondary data from an objective perspective to examine the relevance among the three variables. Thus, we propose Hypothesis 3.
Hypothesis 3 (H3).
A higher CR rating implies better CFP.
Barnett [35] points out that not all companies use CSR to increase reputation and CFP. More companies are achieving good economic achievement targets by having a good reputation (including good quality products, proper credit and innovation) and then they are willing to provide more resources back to society to achieve CSR. From this point of view, CSR might be the result and not the cause. The corporations we use in this study could not support CSR when they were first established. They may have even refused to execute CSR due to the cost at maintaining the survival of the company. During their operations, firms work hard to build up an excellent reputation at having good assets and financial performances and then they can have the ability to give back to society and to initiate CSR (voluntarily or under society’s expectations). Microsoft and Google are these kinds of big corporations. Empirical studies point out that CSR might have adverse effects, especially during an economic crisis [60,61]. Therefore, this study believes running CSR with an excellent reputation and with good financial status can help firms reach stakeholders’ expectation. By integrating the above-mentioned, we present Hypothesis 4.
Hypothesis 4 (H4).
In the relationship between a CR rating and CSR, CFP acts as a mediating factor by positively affecting the relationship.
3. Methodology
3.1. Sample and Data Collection
3.1.1. Corporate Reputation (CR) and Corporate Social Responsibility (CSR)
For this study, we selected one of the world’s most credible data sources with samples from 15 countries. Reputation Institute, founded in 1997, is the gold standard in reputation measurement and management, providing a specialized measurement of how stakeholders—the general public, investors and employees—perceive major brands. Thus, we employ it as our source of information for CSR and CR. Their database includes more than 150,000 respondents, all taken according to the consumer’s point of view. The data include a scorecard analysis that includes information regarding products/services, innovation, workplace, governance, citizenship, leadership and performance. This information helps to ensure that CR has relevance to competitive advantages and CSR. The designers use emotion-based measures and signaling theory to convert trust in a company into a conceptual measurement of CR. Qualitative research is also conducted for U.S. respondents to ensure content validity. Quantitative research is conducted similarly and responses are verified in multiple samples and different geographical areas so that different stakeholder groups and viewpoints confirm the data. Specifically, the authors investigate the general public awareness of these companies, such as how Canadian doctors judge pharmaceutical companies or how Danish transportation employees judge themselves in the industry. In order to confirm cross-cultural validity, the authors take data from 15 countries on six different continents. The authors report their findings in the analysis section and a brief description of the scale with reliability, internal validity, nomological validity and cross-cultural validity is included. While the survey is conducted through online questionnaires and interviews, the objective angle taken in this study using RepTrak® data may promote further cross-cultural research.
Casado & Peláez [32] state that monitoring tools can be divided into those that measure hard variables (economic variables, financial and commercial offerings, etc.) and soft variables (CSR, emotional appeal, work surroundings, etc.). Ideally, a balance exists between the two types of variables, which allows companies to maintain both economic and social expectations and responsibilities. Prior to the introduction to social expectations, the best enterprises are often criticized for focusing too much attention on financial performance above all else. RepTrak® provides data on the hard and soft variables using a balanced framework and CSR is studied independently in a feature called CSR RepTrak®. This feature investigates three facets of CSR: citizenship, governance and workplace. Reputation Institute’s data provide strong evidence for enterprises engaged in planning CSR and sustainable development and realizing it in operations and strategies. If an enterprise can improve its CR, then it can enhance consumer support goals, including increased product sales, active recommendations and referrals and trust in the enterprise when it is facing difficulties and crisis.
3.1.2. Corporate Financial Performance (CFP)
The most commonly used objective indicators for research on performance in recent years included ROA, ROE and Tobin’s Q [7]. Sami et al. [62] use listed companies on Shanghai Stock Exchange and Shenzhen Stock Exchange as samples, along with ROA, ROE and Tobin’s Q as performance indicators; they conduct a comprehensive study on CFP and an evaluation of the management of China firms. When Battaglia and Gallo [63] study the profitability of banks, they also use ROA and ROE as indicators. Brammer and Pavelin [9] look at the correlations among CSR, CR and CFP and use ROA and ROE as facets for CFP as well. The results of their study show that ROA and ROE explain nearly 70% of the variance reported in factor analysis and detection. In addition to the fact that ROA positively correlates with stock price, greater ROA and ROE indicate that a company has created more value for its investors [64,65]. Therefore, this research selects ROA and ROE as objective indicators that represent CFP. We also collect Tobin’s Q, ROA, quick ratio, operating cycle and debt to tangible assets ratio as CFP targets.
ROA and ROE
ROA means how a company is employing all its assets to make money. ROA does not see financial leverage as a bonus point or a deduction. It only sees how much money the company can make with the assets it owns. Returning other assets back to shareholders (capital reduction or cash dividends) can help maintain the same amount of profits. In this case, shareholders can take back this money and use it for other investments, making it a win-win situation for them and the firm.
ROE means how a company can earn money through its equity capital. The assets that a company actually possesses come from two sources: shareholder equity and liability. If a company uses assets to pay off debts, then the remaining money belongs to the shareholders and it is called shareholder equity (shareholder equity = assets − debts). A higher ROE level means the company is using the same equity to make more money. To achieve a high ROE, a firm needs to have high net profit and lower shareholder equity. Less shareholder equity may involve two explanations. First, it is a small company and second the company is not small but most of its funds are loans. There is no problem with the first scenario but the second one denotes a company is running under greater debt in order to get a higher ROE.
A more reasonable way to get a high ROE should be through increased profit and not decreased shareholder equity. However, we are unable to tell if a company is good at making money or borrowing money through high ROE. As a result, this study believes that ROA is a more suitable measurement to analyze a firm.
To get more thoughtful considerations on financial targets, this study not only uses Tobin’s Q as a CFP indicator but also adds three more measures. The quick ratio represents the ability of realization, the operating cycle to serve asset management and debt to tangible assets ratio to represent the percentage of debts. We now present their definitions and the reasons for choosing these three.
Tobin’s Q
Tobin’s Q is defined initially as a company’s market value and replacement cost percentage. A higher Tobin’s Q means investors place higher valuations on the company value. The standard for Q is set as 1 and thus a company with Q higher than one implies that the company value in the future will be higher. This study uses the simplified Tobin’s Q as a market value evaluation indicator [66].
Quick Ratio
Quick ratio = (total current asset − inventory)/total current liability
Conservative quick ratio = (currency capital + short-term investments + notes receivable + net accounts receivable)/current liability. The quick ratio can better reflect the ability of a firm to repay short-term debts as a current percentage. Current assets include some inventories that are slow to the market and might be devalued. A quick ratio below one is normally considered as a firm having low ability to repay short-term debts.
Operating Cycle
Operating cycle = inventory turnover days + account receivable turnover days = {[(beginning period inventory + period end inventory)/2] × 360}/product cost of sales + {[(beginning period account receivable + period end account receivable)/2] × 360}/product sales income. Under a common circumstance, a short operation period tells a fast capital turnover, a long operation period tells a slow capital turnover. Normally it should include analysis all together with both inventory turnover status and account receivable turnover. The duration of operation period not only shows the level of corporation assets management but also affects the ability to repaying liability and the ability to profit.
Debt to Tangible Assets Ratio
Debt to tangible assets ratio = [Total liability/(shareholders’ equity − net worth of intangible assets)] × 100%. This is the extension of the property percentage indicator. It is carefully and conservatively shown on the level of protection on creditors’ money by shareholders’ equity protection level when a corporation is settling the account. Intangible assets include goodwill, trademarks, patent rights and non-patent technologies. From the perspective of long-term solvency, the lower ratio indicates that the company has excellent stability and the scale of borrowing is normal.
3.1.3. Data Collection
We use data on the top 100 ranked companies in the two reports published by Reptrak® and CSR RepTrak® from 2011 to 2017 provided by the Reputation Institute as the primary samples. Firms in these reports are ranked with scores ranging from 0 to 100. We first filter out the 66 companies listed in both reports and delete invalid samples (companies are determined to be invalid if they were not included in the report for four consecutive years), leaving us with 39 companies. The final RepTrak® sample spans 15 countries and includes companies in Australia, Brazil, Canada, China, France, Germany, India, Italy, Japan, Mexico, the Netherlands, South Korea, Spain, the UK and the U.S. We collect Tobin’s Q, ROA, quick ratio, operating cycle and debt to tangible assets ratio of these 39 companies for the period 2011–2017. In total, this study analyzes 273 sample data points.
3.2. Descriptive Statistics
Table 1 shows the descriptive statistics of this research. In this research, all variables are significant, which means that none of them have a normal distribution. Thus, it is necessary for the subsequent intervening variable analysis to use bootstrapping.
3.3. Research Framework
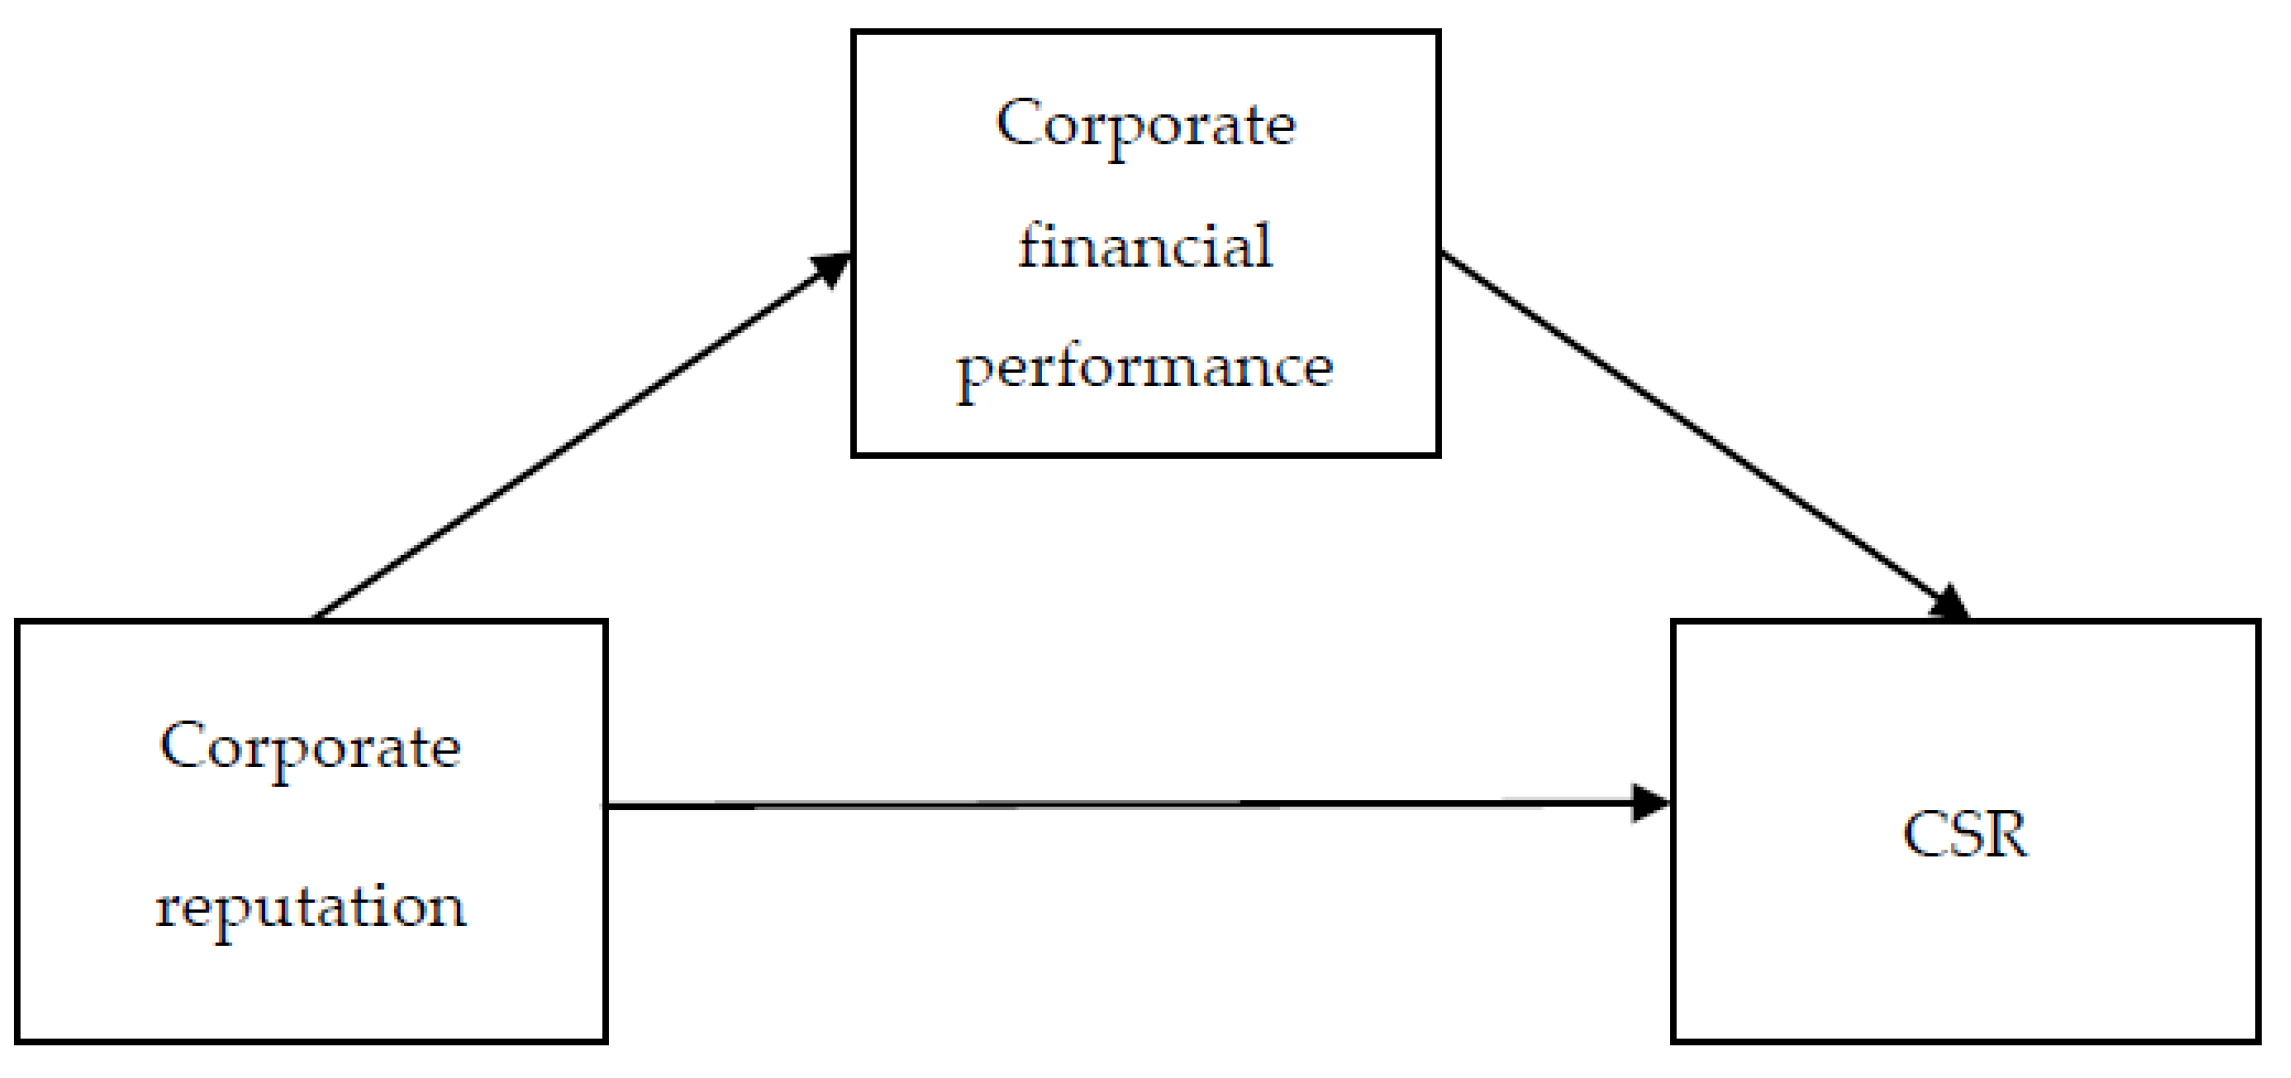
This study explores the relationships among corporate reputation (CR), corporate financial performance (CFP) and CSR. In view of the previous literature, we discuss how CR affects CFP and CSR and also analyze how CR has a mediating effect on CSR through CFP. In addition, we use CR as an independent variable, CFP as a mediating variable and CSR as a dependent variable to determine the causal relationship of these important variables and to set up a linear structural equation model. Figure 1 illustrates our research framework.
3.4. Research Method
This research focuses on the variables of CR, CFP, CSR, Tobin’s Q, ROA, quick ratio, operating cycle and debt to tangible assets ratio for each company from 2011 to 2017. We use CR as an independent variable, three CFP indicators (Tobin’s Q, ROA, quick ratio, operating cycle and debt to tangible assets ratio) as mediating variables and CSR as a dependent variable. The control variables are sales growth rate, firm size, age, interest coverage ratio and industry. There are 39 companies and 273 data points included in the study.
The methodology employed by this research consists of descriptive statistics analysis, Pearson Correlation analysis, path analysis and testing for mediation. Descriptive statistics characterize the basic statistical parameters of the twelve variables, including the average and standard deviation; a Kolmogorov–Smirnov normality test is used to analyze each variant item to determine whether a variable assignment is normal. Correlation analysis is used to investigate the associations among the variables in order to choose the correct variables to build the model.
The evaluation method used in this study on the mediating effect is from Baron and Kenny’s study [66]. The following conditions must be met. Condition 1: Independent variable makes an apparent impact on the intervening variable. Condition 2: Intervening variable creates a noticeable effect on a dependent variable. Condition 3: Independent variable causes an apparent effect on a dependent variable. Condition 4: The original correlation between an independent variable and a dependent variable does not affect any mediating variable added; it is denoted as “Complete mediating effect.” If there is still an obvious correlation that does not decrease, then it is “Partial mediating effect.” The Sobel test can more directly evaluate a mediating effect that does not need to meet those four conditions. It is also better on statistical analysis but requires one to assume the mediating effect’s sampling distribution as a normal distribution.
Control Variable
Based on previous researchers, the control variables in this study include firm size, sales growth rate, interest coverage ratio, age and industry, which we individually present as follows.
(1). Firm size
Previous scholars believe the company scale has a great impact on its innovation. A large company possesses more resources, has an incentive to innovate and the advantage to compete and therefore exhibits better performance [67]. Some scholars note that a small company with better cohesiveness can effectively develop and provide the latest products that suit the market to gain a greater competitive advantage, thus presenting better performance. Therefore, this study uses Lin’s study [68] as a reference to take total assets’ natural logarithm as a measure for company scale.
(2). Sales growth rate
A company with good sales growth means it has developmental potential to make better profit. Therefore, this study uses the sales growth rate to evaluate a company’s growth rate.
(3). Interest coverage ratio
The liability percentage affects a company’s financial structure and also affects the success of innovation activities [69]. At the same time, it also impacts investors’ assessment of the company.
(4). Age
For a company that has been established longer, its operational status is more stable [70]. It builds upon previous operation experiences to make future operations better. Therefore, this study includes the age of the company as a variable.
(5). Industry
The business nature of the high-tech sector covers a wide range and there are many different ways to create value added. Therefore, this study includes industry as a variable.
4. Empirical Results
4.1. Confirmatory Factor Analysis
We test the validity and reliability of this study below through confirmatory factor analysis and use Cronbach’s α coefficient to check for validity and reliability.
4.1.1. Reliability analysis
In society and behavioral science studies, credit evaluation can be divided into four indices: test-retest reliability, alternative-form reliability, split-half reliability and internal consistency reliability. The first three can be called as internal consistency reliability. Cronbach’s α in internal consistency reliability is the most commonly used credit indicator. As Table 2 shows, each dimension’s intermediate value of Cronbach’s α is between 0.872 and 0.961 in the questionnaire. This fits the standard threshold value (α value bigger than 0.7) and in fact all are over 0.80 [71]. Therefore, this study determines the threshold values have an individual level of credibility.
4.1.2. Validity Analysis
Invalidity examination, this study uses the Maximum Likelihood Estimation in CFA to proceed investigation that is suitable for Measurement Model in various constructs.
Convergent Validity Analysis
This study follows Anderson and Gerbing [72]—who suggested a concurrent validity analysis standard; Bagozzi and Yi [73]—who proposed a verification factor analysis evaluation standard; and Gefen [74]—who separated fitness index data into four evaluation criteria: (1) Goodness of Fit Index (GFI); Normed Fit Index (NFI); and Comparative Fit Index (CFI); CFI greater than 0.9; and Root Mean Square Residual (RMSR); RMSR less than 0.05. (2) The factor capacity of each standard is significant. (3) Each dimension’s Composite Reliability (CR) is greater than 0.7. (4) Average Variance Extracted (AVE) is greater than 0.5. We use AMOS 18.0 to proceed with the data analysis of each dimension and use Maximum Likelihood Estimation (MLE) to estimate the parameter and to calculate composite reliability and average extract variation of each dimension.
CR
In the CR measurement model, RMR = 0.021, which is below 0.05. GFI, NFI and CFI are respectively 0.874, 0.948 and 0.962, or all higher than 0.8. The factor capacity of each evaluation standard is significant and higher than 0.7. The composite reliability and average extract variation are respectively 0.9192, 0.9607, 0.9588 and 0.9424 and 0.7399, 0.8303, 0.8231 and 0.7659. The composite reliability and average extract variation are all higher than 0.7 and 0.5. Therefore, the convergent validity is in an acceptable area.
CFP
In the CFP measurement model, RMR = 0.037, which is below 0.05. GFI, NFI and CFI are respectively 0.849, 0.909 and 0.926, or all higher than 0.8. The factor capacity of each evaluation standard is significant and higher than 0.7. The composite reliability and average extract variation scores are, respectively, 0.917, 0.9414, 0.9131, 0.9183 and 0.8807 and 0.7347, 0.8009, 0.6775, 0.7382 and 0.7124. The composite reliability and average extract variation are all higher than 0.7 and 0.5. Therefore, the convergent validity of CFP is in an acceptable area.
CSR
In the CSR measurement model, RMR = 0.029, which is lower than 0.05. GFI, NFI and CFI are respectively 0.89, 0.924 and 0.929, or all higher than 0.8. The factor capacity of each evaluation standard is significant and higher than 0.6. The composite reliability and average extract variation are respectively 0.9298 and 0.6557. The composite reliability and average extract variation are respectively higher than 0.7 and 0.5.
4.1.3. Discriminant Validity Analysis
This study follows Gaski and Nevin [75] in proposing two standards of examination discriminant validity. (1) The correlation coefficient between two dimensions is below 1. (2) The correlation coefficient between two dimensions being lower than Cronbach’s α individual coefficient of reliability means these two dimensions possess discriminant validity. Fornell and Larcker [76] proposed the third criterion for verification of discriminant validity. (3) The correlation coefficient of two facets is less than the square root of AVE, which means that the two facets have discriminant validity. This study uses SPSS 18.0 and AMOS 18.0 to proceed with the correlation coefficient matrix examination of each variable term. The analysis data of CR and CFP are consistent with the criteria as above, showing that the discriminant validity of each dimension is excellent. We present the results in Table 3 and Table 4.
4.2. Structural Equation Model Analysis
For further verifying the relationship of conception structure among various dimensions, we employ structural equation modelling (SEM). The integral structural equation model combines factor analysis from traditional statistics and path analysis and also includes simultaneous equations from econometrics, which can process the relationship in a series of dependent variables at the same time. Regarding the analysis procedure of SEM, Anderson and Gerbing [72] and Williams and Hazer [77] advise to proceed with a two-stage method structural equation model analysis. (1) The first stage focuses on various research dimension and its subjects to continue with CFA and Cronbach’s α coefficient analysis. (2) In the second stage, the number of measurement items was reduced to a few measurement indicators and the structural model was used to verify the hypotheses of this study. The benefit of using the two-stage method is to separate the measurement mode and structure mode.
4.2.1. Overall Mode Description
The first-phase analysis is already described as the factors of validation in this chapter and will be analyzed from the second phase now. Therefore, we theoretically measure CR, CFP and CSR with the data of the second level of each construction. After clarifying the questions and constructional sides of the whole theoretical patterns of each item, we employ AMOS. Generally, when analyzing constructional trends, the standard sample size will be at least 100, 200 or more samples. We have 273 samples available for analyzing and the software to be used is AMOS 18.0.
4.2.2. Result
This research will be presented from the measuring of theoretical pattern and the verification of the hypothesis.
Theoretical Measures
When analyzing the adaption of the pattern, this research is based on three aspects according to the opinion of Bagozzi and Yi: (1) Preliminary Fit Criteria; (2) Overall Model Fit; and (3) Fit of Internal Structure of Model. We describe each one as follows.
Preliminary Fit Criteria
Three standard items need to be known for sure. (1) Error variance cannot be negative. (2) Standard factor loading cannot be lower than 0.50 or over 0.95 and should be apparent. (3) There cannot be too much of standard error tolerance. Table 5 shows the whole theoretical pattern measuring result. The result indicates that the error variance has no negative numbers, common factor loading is not lower than 0.50 or over 0.95 and is apparent and no higher standard error tolerance is found. Overall, the essential adaption of this research model is acceptable.
Overall Model Fit
This is used to analyze the whole model and observation method’s adaptation. This research utilizes advice from [78], choosing three indices to analyze the whole model and observation data, which are (1) Absolute Fit Measures; (2) Incremental Fit Measures; and (3) Parsimonious Fit Measures.
We now describe the details of each index as follows. (1) Absolute Fit Measures are used to make sure that the whole model can be used to predict the common variation or levels of related matrices, including Chi-square value, GFI, RMSR, Root Mean Square Error of Approximation, RMSEA, Adjusted Goodness of Fix Index and AGFI. Table 5 shows the model of this research’s absolute adaption indices has χ2 = 66.9, d.f. = 15, χ2/d.f. = 4.46, GFI = 0.853, RMR = 0.033, RMSEA = 0.092 and AGFI = 0.81; except for AGFI being slightly higher than standard, all other data are in the range of the rule. (2) Incremental Fit Measures are used to compare the theoretical model and void mode. Measuring items include NFI and CFI. As shown in Table 5, the increasing adaption indices of this research are NFI = 0.921 and CFI = 0.938, both of which are in acceptable range. (3) Parsimonious Fit Measures are used to adjust the adaption measurements. So it can include different estimates in the model to decide what the adaption level of each estimated number is. The PNFI = 0.795 and PGFI = 0.659 are both in the acceptable range (>0.500). According to each result, the adaptation of this theoretical model is suitable.
Fit of Internal Structure of Model
The apparent estimate numbers, each index and potential variation’s reliability can be analyzed from whether CR is over 0.70, the potential variation AVE is above 0.5 and 0.7 and the individual item reliability is over 0.70. Each constructional aspect’s CR is over 0.70 and AVE is over 0.50. CR, CFP and CSR are also higher than the lowest acceptable standard. In general, this research’s interior structure is adjusted well.
4.3. Hypothesis Relationship Verification
After confirming that each facet has a certain degree of validity and reliability, the next step is to further examine the research hypothesis established by the research model and analyze the relationship between variables such as CR, CFP and CSR.
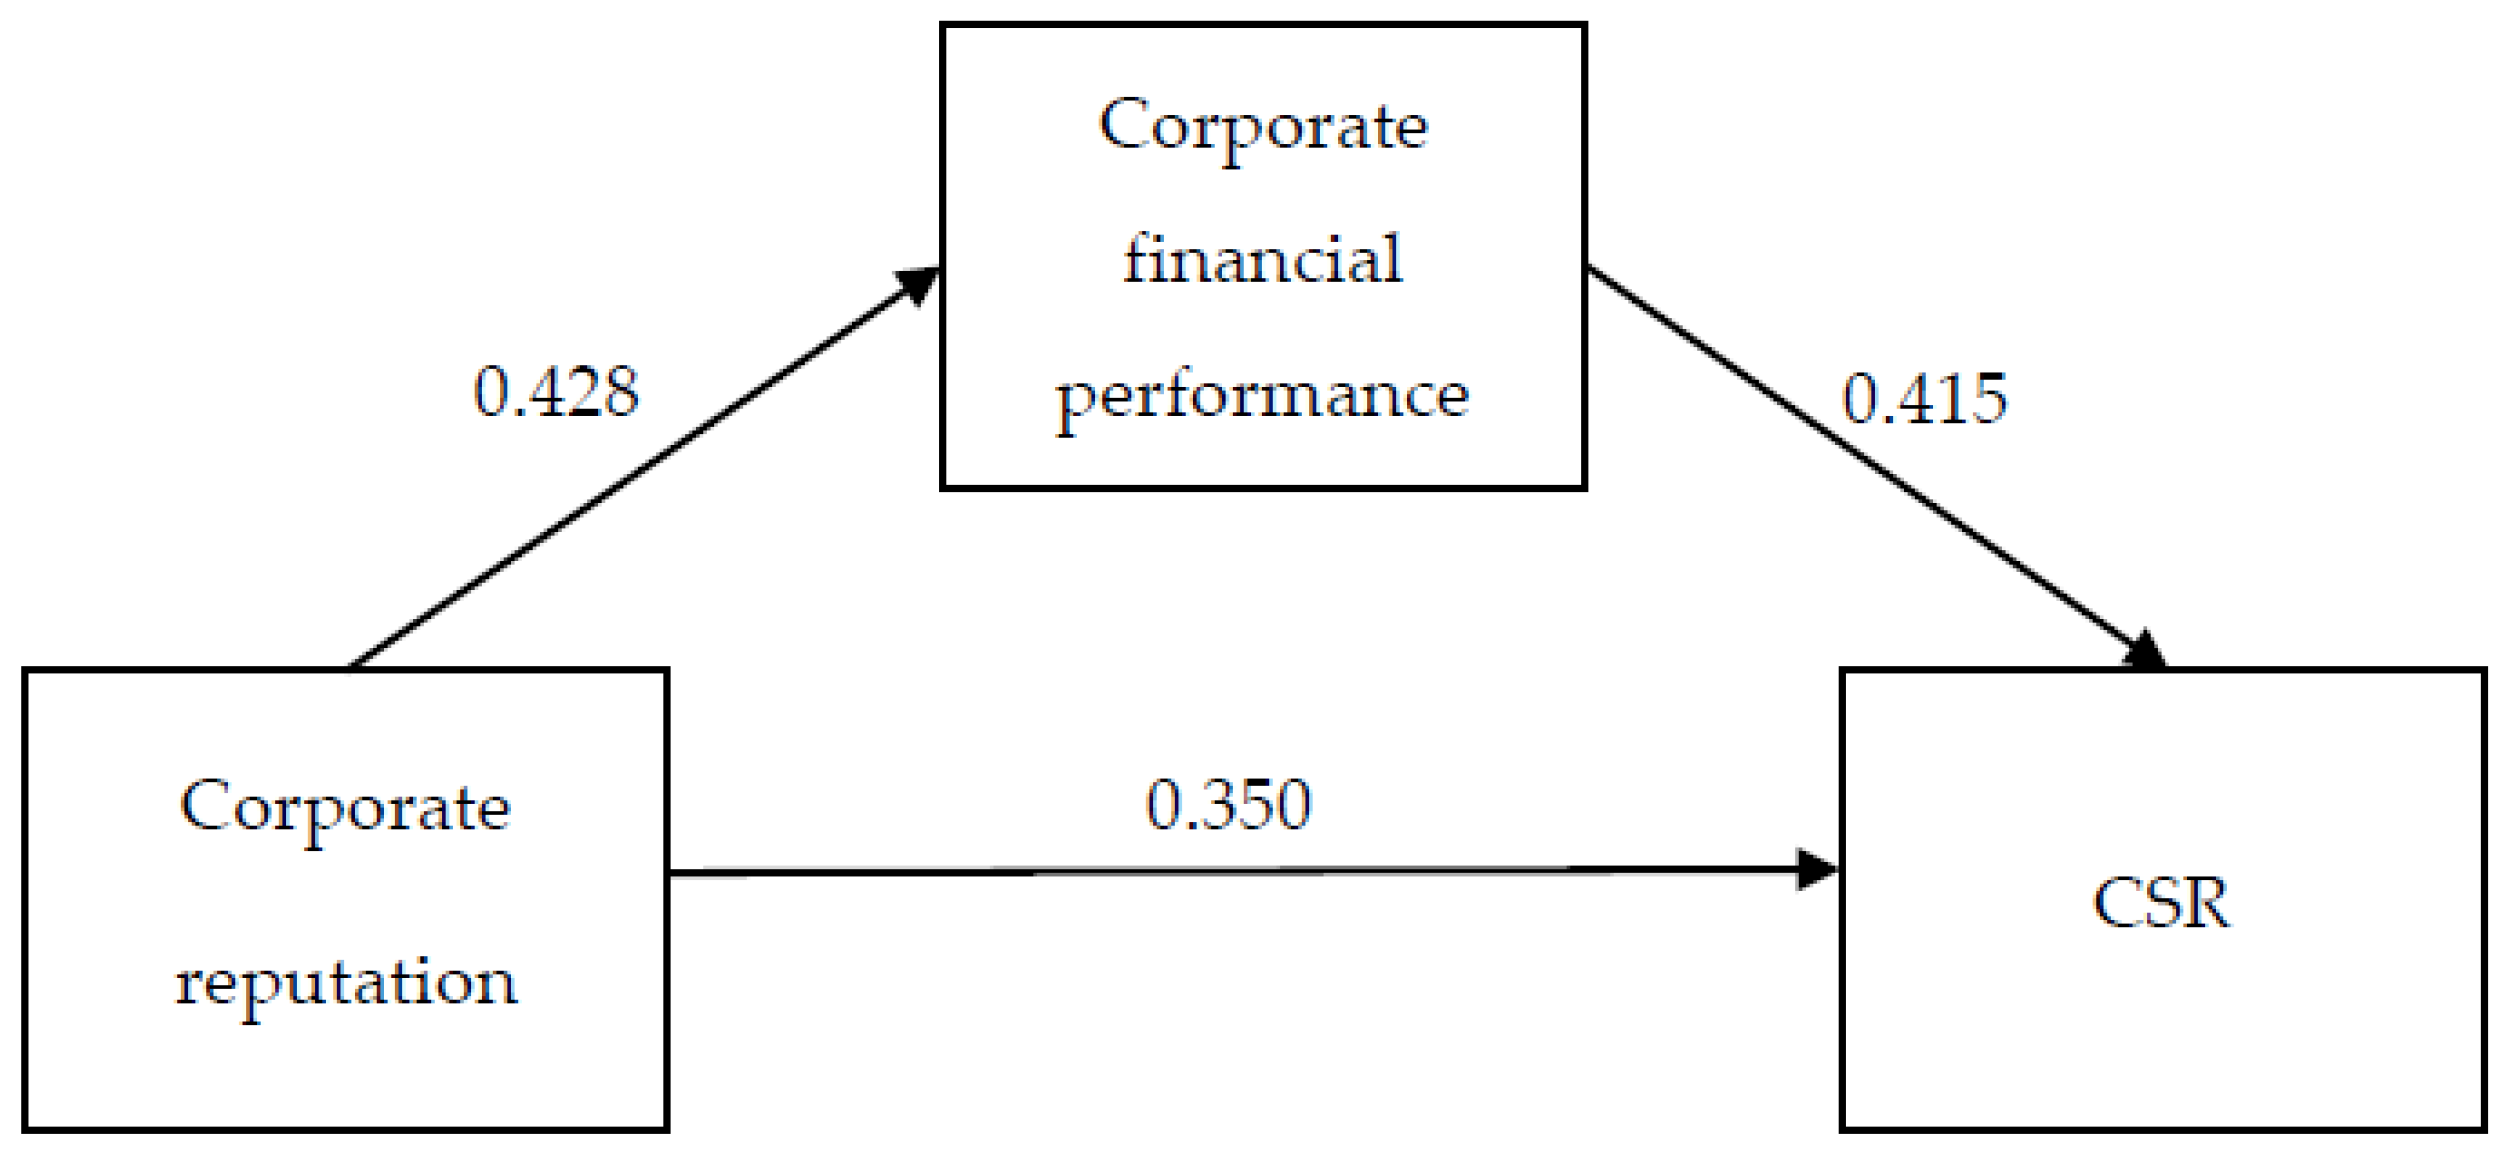
We perform hypothesis testing according to the regression analysis of the overall path analysis. The results of the report show that the three hypotheses of this study are all supported. The values reach a significant level of 0.05. The path coefficients of the theoretical structure model and the hypothesis verification are shown in Table 6 and Figure 2.
4.3.1. Mediation Test
This study uses the Sobel test to input the non-standardized path coefficients from CR to CFP (Beta = 0.428, unstandardized Beta = 0.428) and the un-normalized path coefficients from CFP to CSR (Beta = 0.415, unstandardized Beta = 0.321). The resulting Sobel test value is 5.933 (p-value = 0.000 < 0.05) and is significant, indicating that there is an intermediate effect. Thus, H4 is supported.
4.3.2. Control Variable
According to the above results of the variance analysis, we see that the overall regression model does not reach a significant level (F = 0.672, p = 0.645 > 0.05), indicating that the whole regression model has no statistical significance and represents five population backgrounds. The control variables firm size, age, industry, interest coverage ratio and sales growth rate do not affect the dependent variables, indicating that these five control variables do not change.
After the general verification of the above regression model (F test) and by achieving a statistically significant level, the interpretation of the regression coefficients of the predictor variables is performed. We find that the standardized regression coefficient (β) of CR reaches a significant level of .420 (t = 9.240, p = 0.000 < 0.05).
5. Discussion
5.1. Verification of Hypotheses and Results
The findings support the four hypotheses of this research: (1) A higher CR rating implies a higher CSR rating. (2) A higher CFP implies a better CSR rating. (3) A higher CR rating implies better CFP. (4) In the relationship between a CR rating and CSR, CFP acts as a mediating factor by positively affecting the relationship. Therefore, our research suggests that if enterprises are willing to pursue CR objectives and establish sustainability, then there will be a positive impact on CFP and CSR.
It is worth emphasizing that the CFP’s mediating role in the relationship between CR and CSR is supported, which is different from previous CSR-related studies and may be used as a basis for investors’ decision-making process. Most of them regard CFP as an important variable can offer a proactive role, indicating that good financial competence can support CSR. This also proves why in recent years when the global economy is sluggish, companies’ CSR activities decrease or even stop, echoing the traditional CSR viewpoint of Friedman [18]. Logically, CR takes precedence and compliance with CSR is consistent with stakeholder expectations. CR is fundamental to a company, as Volkswagen’s 2015 fraudulent event caused damage to 600,000 vehicle owners. The firm’s trust collapsed overnight and total compensation paid to the U.S. government and owners hit US$14.7 billion. Summarizing the above, when CR is high, efforts to strengthen corporate social responsibility and sustainability may increase financial indicators by increasing CFP, including ROA (the company’s ability to make money with all assets), Tobin’s Q (market value, quick ratio, operating cycle and debt to tangible assets ratio.
5.2. Research Limitations
This research has several limitations. First, by using structural equation modeling, we are committed to the establishment of a structured model and to the same extent as many other measured hypothesis models, the actual data do not explain the pros and cons of this architecture. Furthermore, because we only sample the top 100 companies of Reptrak® and CSR RepTrak® provided by Reputation Institute, our sample is limited. This research also did not differentiate between industries nor cover a broad cross-section of companies. Since the particular characteristics of different industries were not analyzed, other companies worth studying may have been ignored. Finally, because we had to select companies within a seven-year period and within the rankings for our sample, only 39 companies and 273 samples were used for analysis in this research. Although the research results indicate a positive relationship between CFP and CSR, it is limited to 39 companies in this study.
6. Conclusions
6.1. Research Contribution and Policy Implications
Because today’s business environment is fast-paced and uncertain, from the standpoint of contingency, corporate organizations should be able to adapt society’s expectations and respond to changes in globalization and rapid technological advances [15,19,20]. Therefore, it is proven that CFP has a mediating effect on the relationship between CR and CSR and structuring it is an essential academic contribution to this study. The results strengthen and establish the status of CR’s influence on CFP and CSR.
The results not only herein should help to clarify some related topics and become a reference for future CR/CSR research but also can be provided to companies and investors for the decision-making process. In the past, the relationship between CSR and CFP was considered different in the management literature and various schools of thought provided many different viewpoints [6]. In addition to supporting the positive relationship between CR and CSR, the results of this study indicate that this is not only a direct relationship but may also be affected by the mediating effect of CFP.
Different from most previous CR/CSR-related studies, this study uses seven-year interim (2011–2017) secondary data and collects relevant seven-year financial indicators (2011–2017) to verify the structured pattern through SEM analysis. The Reputak® and CSR RepTrak® reports provided by the Reputation Institute included subjective questionnaire surveys and the actual CR/CSR scores presented in their studies. Together with the objective CFP indicators, they formed a method for the integration of objective and objective data, thus providing a new integration method and perspective for the sustainable development of enterprises and opening another door for follow-up CR-CFP-CSR research.
This study also contributes to management and corporate planning strategies. Since CR’s role in improving CFP and CSR may not appear in the short term, it means that CR/CSR is the overall evaluation of a company’s stakeholders over the long run. This assessment is based on the direct communication experience between stakeholders and the company, as well as the comparison between the company and its competitors [22]. An enterprise can have the proper CR and ensure that CFP can be promoted and thus carry out CSR planning. Companies should spend money on cutting-edge methods that can directly improve CR, such as improving product quality and customer satisfaction, building customer trust, etc. to enhance related financial affairs. After accumulating sufficient financial ability, CSR will be performed. This will not only satisfy the satisfaction of the shareholders (good CFP) but also fulfill the social expectation of CSR provided that there is a reasonable CR. CSR can have better results. Through this study we hope to increase the willingness of companies to contribute to the mission and responsibilities of CSR. To operate CSR through the correct CR, many companies perform seemingly charitable and selfless behaviors [18] but they may deliberately put their company name or related products into CSR activities, or even put products into place. Philip Kotler states “Marketing 3.0” put forward in 2011 was “human-oriented and uses social responsibility to counter the pursuit of profit,” while consumers, employees, access and shareholders are all corporate spokespersons. Companies must be able to share brand usage, vision and value with these stakeholders before they can profit. However, as the times change, stakeholders (including shareholders and consumers) have already seen the proliferation and roughness of operational CSR, already deviated from the original intention, must have good CR and CFP as support, there are the significance and value of CSR.
There is no doubt that companies should protect shareholders rights and satisfy stakeholders. This study also provides a way for companies to strategically operate CSR in order to give back to society, as well as constructs new integrated approaches for business sustainability.
6.2. Future Research Directions
This research has analyzed the seven-year results from Reptrak® and CSR RepTrak® data provided by Reputation Institute as a form of secondary data analysis. However, this sample size is inadequate. We hope that we can conduct additional observations and research to establish the validity of our model structure. Future research may be able to identify different characteristics if it considers different industries. Future cross-industry comparative analysis may prove to be particularly interesting. Furthermore, future research could study the impact of the dynamic processes within CSR strategy adjustments and the relationship between CR and CFP within this dynamic process. Such work could capture the implementation effects of CSR and highlight how the pace of adjustment affects CR and CFP.
Author Contributions
Conceptualization, J.-L.H. and Y.-M.L.; Methodology, J.-L.H. and Y.-M.L.; Software, Y.-M.L.; Validation, Y.-M.L. and J.-L.H.; Formal Analysis, Y.-M.L. and J.-L.H.; Data Curation, Y.-M.L.; Writing-Original Draft Preparation, Y.-M.L.; Writing-Review & Editing, J.-L.H.; Visualization, Y.-M.L.; Supervision, J.-L.H.; Project Administration, Y.-M.L. and J.-L.H.; Funding Acquisition, J.-L.H.
Funding
The funding source from Taiwan’s Ministry of Science and Technology (MOST106-2410-H-009-047).
Acknowledgments
The authors thank three anonymous referees of this journal for their valuable comments. The usual disclaimer applies. The second author gratefully acknowledges partial financial support from Taiwan’s Ministry of Science and Technology (MOST106-2410-H-009-047).
Conflicts of Interest
The authors declare no conflict of interest.
References
- Schaltegger, S.; Burritt, R. Business Cases and Corporate Engagement with Sustainability: Differentiating Ethical Motivations. J. Bus. Ethics 2018, 140, 241–259. [Google Scholar] [CrossRef]
- Da Cruz, N.F.; Marques, R.C. Revisiting the determinants of local government performance. Omega 2014, 44, 91–103. [Google Scholar] [CrossRef]
- Jones, G.; Jones, B.; Little, P. Reputation as reservoir: Buffering against loss in times of economic crisis. Corp. Reput. Rev. 2000, 3, 21–29. [Google Scholar] [CrossRef]
- Schnietz, K.; Epstein, M. Exploring the financial value of a reputation for corporate social responsibility during a crisis. Corp. Reput. Rev. 2005, 7, 327–345. [Google Scholar] [CrossRef]
- Duthler, G.; Dhanesh, S. The role of corporate social responsibility (CSR) and internal CSR communication in predicting employee engagement: Perspectives from the United Arab Emirates (UAE). Public Relat. Rev. 2018, in press. [Google Scholar] [CrossRef]
- Saeidi, S.P.; Sofian, S.; Saeidi, P.; Saeidi, S.P.; Saaeidi, S.A. How does corporate social responsibility contribute to firm financial performance? The mediating role of competitive advantage, corporate reputation and customer satisfaction. J. Bus. Res. 2015, 68, 341–350. [Google Scholar] [CrossRef]
- Sun, K.A.; Kim, D.Y. Does customer satisfaction increase corporate financial performance? An application of American Customer Satisfaction Index (ACSI). Int. J. Hosp. Manag. 2013, 35, 68–77. [Google Scholar] [CrossRef]
- Ali, R.; Lynch, R.; Melewar, T.; Jin, Z. The moderating influences on the relationship of corporate reputation with its antecedents and consequences: A meta-analytic review. J. Bus. Res. 2015, 68, 1105–1117. [Google Scholar] [CrossRef]
- Brammer, S.J.; Pavelin, S. Corporate reputation and social performance: The importance of fit. J. Manag. Stud. 2006, 43, 435–455. [Google Scholar] [CrossRef]
- Niap, D.T.F.; Taylor, D. CEO personal corporate reputation: Does it affect remuneration during times of economic turbulence? Procedia Econ. Financ. 2012, 2, 125–134. [Google Scholar] [CrossRef]
- Tang, A.K.; Lai, K.H.; Cheng, T. Environmental governance of enterprises and their economic upshot through corporate reputation and customer satisfaction. Bus. Strateg. Environ. 2012, 21, 401–411. [Google Scholar] [CrossRef]
- Godfrey, P.C. The relation between corporate philanthropy and shareholder wealth: A risk management perspective. Acad. Manag. Rev. 2005, 30, 777–798. [Google Scholar] [CrossRef]
- Fombrun, C.J.; Fombrun, L.J.; Ponzi, W.N. Stakeholder tracking and analysis: The RepTrak® system for measuring corporate reputation. Corp. Reput. Rev. 2015, 18, 3–24. [Google Scholar] [CrossRef]
- Fatma, M.; Rahman, Z. The CSR’s influence on customer responses in Indian banking sector. J. Retail. Consum. Serv. 2016, 29, 49–57. [Google Scholar] [CrossRef]
- Van Beurden, P.; Gössling, T. The worth of values—A literature review on the relation between corporate social and financial performance. J. Bus. Ethics 2008, 82, 407–424. [Google Scholar] [CrossRef]
- Holme, R.; Watts, P. Corporate Social Responsibility; World Business Council for Sustainable Development: Geneva, Switzerland, 1999. [Google Scholar]
- Carroll, A.B. A three-dimensional conceptual model of corporate performance. Acad. Manag. Rev. 1979, 4, 497–505. [Google Scholar] [CrossRef]
- Friedman, M. The Social Responsibility of Business is to Increase Its Profits. New York Times Magazin. 13 September 1970; reprint in Donaldson, T. In Ethical Issues in Business. A Philosophical Approach; Werhane, P.H., Ed.; Prentice Hall: Englewood Cliffs, NJ, USA, 1970; pp. 217–223. [Google Scholar]
- Gössling, T.; Vocht, C. Social role conceptions and CSR policy success. J. Bus. Ethics 2007, 74, 363–372. [Google Scholar] [CrossRef]
- Lee, Y.M.; Yang, C. The relationships among network ties, organizational agility and organizational performance: A study of the flat glass industry in Taiwan. J. Manag. Organ. 2014, 20, 206–226. [Google Scholar] [CrossRef]
- Nejati, M.; Ghasemi, S. Corporate social responsibility in Iran from the perspective of employees. Soc. Responsib. J. 2012, 8, 578–588. [Google Scholar] [CrossRef]
- Gotsi, M.; Wilson, A.M. Corporate reputation: Seeking a definition. Corp. Commun. 2001, 6, 24–30. [Google Scholar] [CrossRef]
- Sen, S.; Bhattacharya, C.B. Does doing good always lead to doing better? Consumer reactions to corporate social responsibility. J. Mark. Res. 2001, 38, 225–243. [Google Scholar] [CrossRef]
- Mutch, N.; Aitken, R. Being fair and being seen to be fair: Corporate reputation and CSR partnerships. Australas. Mark. J. 2009, 17, 92–98. [Google Scholar] [CrossRef]
- Docherty, S.; Hibbert, S. Examining company experiences of a UK cause-related marketing campaign. Int. J. Nonprofit Volunt. Sect. Mark. 2003, 8, 378–389. [Google Scholar] [CrossRef]
- Marx, J.D. Corporate philanthropy: What is the strategy? Nonprofit Volunt. Sect. Q. 1999, 28, 185–198. [Google Scholar] [CrossRef]
- Porter, M.E.; Kramer, M.R. The competitive advantage of corporate philanthropy. Harv. Bus. Rev. 2002, 80, 56–68. [Google Scholar] [PubMed]
- Fombrun, C.J. Corporate Reputation: Realizing Value from the Corporate Image; Harvard Business School Press: Boston, MA, USA, 1996. [Google Scholar]
- Park, J.; Lee, H.; Kim, C. Corporate social responsibilities, consumer trust and corporate reputation: South Korean consumers’ perspectives. J. Bus. Res. 2014, 67, 295–302. [Google Scholar] [CrossRef]
- Bendixen, M.; Abratt, R. Corporate identity, ethics and corporate reputation in supplier–buyer relationships. J. Bus. Ethics 2007, 76, 69–82. [Google Scholar] [CrossRef]
- Lange, D.; Lee, P.M.; Dai, Y. Organizational corporate reputation: A review. J. Manag. 2011, 37, 153–184. [Google Scholar]
- Casado, A.; Peláez, J. Intangible management monitors and tools: Reviews. Expert Syst. Appl. 2014, 41, 1509–1529. [Google Scholar] [CrossRef]
- Ponzi, L.J.; Fombrun, C.J.; Gardberg, N.A. RepTrak™ pulse: Conceptualizing and validating a short-form measure of corporate reputation. Corp. Reput. Rev. 2011, 14, 15–35. [Google Scholar] [CrossRef]
- Ducassy, I. Does Corporate Social Responsibility Pay Off in Times of Crisis? An Alternate Perspective on the Relationship between Financial and Corporate Social Performance. Corp. Soc. Responsib. Environ. Manag. 2013, 20, 157–167. [Google Scholar] [CrossRef]
- Barnett, M.L. Stakeholder influence capacity and the variability of financial returns to corporate social responsibility. Acad. Manag. Rev. 2007, 32, 794–816. [Google Scholar] [CrossRef]
- Da Cruz, N.F.; Marques, R.C. Structuring composite local governance indicators. Policy Stud. 2017, 38, 109–129. [Google Scholar] [CrossRef] [Green Version]
- Simpson, W.G.; Kohers, T. The link between corporate social and financial performance: Evidence from the banking industry. J. Bus. Ethics 2002, 35, 97–109. [Google Scholar] [CrossRef]
- Tuhin, M.H. Does Corporate Social Responsibility Expenditure Affect Financial Performance of Islamic Banks in Bangladesh? Middle East J. Bus. 2014, 9, 44–50. [Google Scholar] [CrossRef]
- Hasanudin, A.I.; Budianto, R. The implications of corporate social responsibility and corporate financial performance with corporate reputation as intervening variable empirical study in the manufacturing company in Indonesia. J. Bus. Rev. 2014, 2, 106–109. [Google Scholar]
- Huang, C.F.; Lien, H.C. An empirical analysis of the influences of corporate social responsibility on organizational performance of Taiwan’s construction industry: using corporate image as a mediator. Constr. Manag. Econ. 2012, 30, 263–275. [Google Scholar] [CrossRef]
- Vong, F.; Wong, I.A. Corporate and social performance links in the gaming industry. J. Bus. Res. 2013, 66, 1674–1681. [Google Scholar] [CrossRef]
- Gardberg, N.A.; Fombrun, C.J. Corporate Citizenship: Creating Intangible Assets across Institutional Environments. Acad. Manag. Rev. 2006, 31, 329–346. [Google Scholar] [CrossRef]
- Margolis, J.D.; Walsh, J.P. Misery loves companies: Rethinking social initiatives by business. Adm. Sci. Q. 2003, 48, 268–305. [Google Scholar] [CrossRef]
- Orlitzky, M.; Schmidt, F.L.; Rynes, S.L. Corporate social and financial performance: A meta-analysis. Organ. Stud. 2003, 24, 403–441. [Google Scholar] [CrossRef]
- Abimbola, T.; Trueman, M.; Iglesias, O.; Abratt, R.; Kleyn, N. Corporate identity, corporate branding and corporate reputations: Reconciliation and integration. Eur. J. Mark. 2012, 46, 1048–1063. [Google Scholar]
- Fombrun, C.; Shanley, M. What’s in a name? Corporate reputation building and corporate strategy. Acad. Manag. J. 1990, 33, 233–258. [Google Scholar]
- Kotha, S.; Rindova, V.P.; Rothaermel, F.T. Assets and actions: Firm-specific factors in the internationalization of US Internet firms. J. Int. Bus. Stud. 2001, 32, 769–791. [Google Scholar] [CrossRef]
- Roberts, P.W.; Dowling, G.R. Corporate reputation and sustained superior financial performance. Strateg. Manag. J. 2002, 23, 1077–1093. [Google Scholar] [CrossRef] [Green Version]
- Shamsie, J. The context of dominance: An industry-driven framework for exploiting corporate reputation. Strateg. Manag. J. 2003, 24, 199–215. [Google Scholar] [CrossRef]
- Cabral, L. Living Up to Expectations: Corporate Reputation and Sustainable Competitive Advantage; New York University: New York, NY, USA, 2012. [Google Scholar]
- Helm, S. The role of corporate reputation in determining investor satisfaction and loyalty. Corp. Reput. Rev. 2007, 10, 22–37. [Google Scholar] [CrossRef]
- Vidaver-Cohen, D.; Simcic Broon, D. Reputation, Responsibility and Stakeholder Support in Scandinavian Firms: A Comparative Analysis. J. Bus. Ethics 2013, 127, 49–64. [Google Scholar] [CrossRef]
- Jackson, K. Building Reputational Capital; Oxford University Press: New York, NY, USA, 2004. [Google Scholar]
- Mirvis, P.H. Building Reputation Here, There and Everywhere Worldwide Views on Local Impact of Corporate Responsibility; Boston College Center for Corporate Citizenship: Chestnut Hill, MA, USA, 2009. [Google Scholar]
- Hull, C.E.; Rothenberg, S. Firm performance: The interactions of corporate social performance with innovation and industry differentiation. Strateg. Manag. J. 2008, 29, 781–789. [Google Scholar] [CrossRef]
- Wang, H.; Qian, C. Corporate philanthropy and corporate financial performance: The roles of stakeholder response and political access. Acad. Manag. J. 2011, 54, 1159–1181. [Google Scholar] [CrossRef]
- Dressel, C. For effective CSR campaigns, sincerity starts at home. PR News, 18 August 2003; 1–3. [Google Scholar]
- Rose, C.; Thomsen, S. The Impact of Corporate reputation on Performance: Some Danish Evidence. Eur. Manag. J. 2004, 22, 201–210. [Google Scholar] [CrossRef]
- Walsh, G.; Mitchell, V.W.; Jackson, P.R.; Beatty, S.E. Examining the antecedents and consequences of corporate reputation: A customer perspective. Br. J. Manag. 2009, 20, 187–203. [Google Scholar] [CrossRef]
- Godfrey, P.; Merrill, C.; Hansen, J. The relationship between corporate social responsibility and shareholder value: an empirical test of the risk management hypothesis. Strateg. Manag. J. 2009, 30, 425–445. [Google Scholar] [CrossRef] [Green Version]
- Minor, D. Corporate Social Responsibility as Reputation Insurance: Theory and Evidence; Working Paper; Haas School of Business: UC Berkeley, CA, USA, 2010. [Google Scholar]
- Sami, H.; Wang, J.; Zhou, H. Corporate governance and operating performance of Chinese listed firms. J. Int. Account. Audit. Tax. 2011, 20, 106–114. [Google Scholar] [CrossRef]
- Battaglia, F.; Gallo, A. Risk governance and Asian bank performance: An empirical investigation over the financial crisis. Emerg. Mark. Rev. 2015, 25, 53–68. [Google Scholar] [CrossRef]
- Berman, S.L.; Wicks, A.C.; Kotha, S.; Jones, T.M. Does stakeholder orientation matter? The relationship between stakeholder management models and firm financial performance. Acad. Manag. J. 1999, 42, 488–506. [Google Scholar]
- McGuire, J.B.; Sundgren, A.; Schneeweis, T. Corporate social responsibility and firm financial performance. Acad. Manag. J. 1988, 31, 854–872. [Google Scholar]
- Baron, R.M.; Kenny, D.A. The moderator–mediator variable distinction in social psychological research: Conceptual, strategic and statistical considerations. J. Personal. Soc. Psychol. 1986, 51, 1173–1182. [Google Scholar] [CrossRef]
- Huang, C.J. The Determinants and Performance of R&D Cooperation: Evidence from Taiwan’s High-Technology Industries. Ph.D. Thesis, Department of Accounting National Chengchi University, Taipei, Taiwan, 2007. [Google Scholar]
- Lin, B.W.; Lee, Y.; Hung, S.C. R&D intensity and commercialization orientation effects on financial performance. J. Bus. Res. 2006, 59, 679–685. [Google Scholar]
- Nagaoka, S. Assessing the R&D management of a firm in terms of speed and science linkage: Evidence from the U.S. patents. J. Econ. Manag. Strateg. 2007, 16, 129–156. [Google Scholar]
- Calantone, R.J.; Cavusgil, S.T.; Zhao, Y. Learning orientation, firm innovation capability and firm performance. Ind. Mark. Manag. 2002, 31, 515–524. [Google Scholar] [CrossRef]
- Nunnally, C.J. Psychometric Methods; Harper and Row: New York, NY, USA, 1978. [Google Scholar]
- Anderson, J.C.; Gerbing, D.W. Structural equation modeling in practice: A review and recommended two-step approach. Psychol. Bull. 1988, 103, 411–423. [Google Scholar] [CrossRef]
- Bagozzi, R.P.; Yi, Y. On the Evaluation of Structural Equation Models. J. Acad. Mark. Sci. 1988, 16, 74–94. [Google Scholar] [CrossRef]
- Gefen, D.; Straub, D.W.; Boudreau, M.C. Structural equation modelling and regression: Guidelines for research practice. Commun. Assoc. Inf. Syst. 2000, 4, 1–78. [Google Scholar]
- Gaski, J.F.; Nevin, J.R. The differential effects of exercised and unexercised power sources in a marketing channel. J. Mark. Res. 1985, 22, 130–142. [Google Scholar] [CrossRef]
- Fornell, C.; Larcker, D.F. Evaluating structural equation models with unobservable variables and measurement error. J. Mark. Res. 1981, 18, 39–50. [Google Scholar] [CrossRef]
- Williams, L.J.; Hazer, J.T. Antecedents and consequences of satisfaction and commitment in turnover models: A reanalysis using latent variable structural equation methods. J. Appl. Psychol. 1986, 71, 219–231. [Google Scholar] [CrossRef]
- Hair, J.F.J.; Black, W.C.; Babin, B.J.; Anderson, R.E.; Tatham, R.L. Multivariate Data Analysis; Pearson Education: London, UK, 2006. [Google Scholar]
Figure 1.
Research Framework.

Figure 2.
Path Analysis Model.


Table 1.
Descriptive Statistics.
| Variables | Average | Unit | Standard Deviation | Min | Max | K–S | Distinctiveness |
|---|---|---|---|---|---|---|---|
| CSR | 70.67 | Score | 4.63 | 60.22 | 81.40 | 0.151 | <0.001 * |
| CR | 73.13 | Score | 4.18 | 63.22 | 84.36 | 0.075 | <0.001 * |
| Tobin’s Q | 1.16 | Ratio | 0.73 | 0.06 | 5.01 | 0.148 | <0.001 * |
| ROA | 7.32 | Ratio | 6.14 | −13.20 | 30.76 | 0.081 | <0.001 * |
| Quick ratio | 2.25 | Ratio | 0.84 | 0.33 | 3.68 | 0.102 | <0.001 * |
| Operating cycle | 189.42 | Days | 26.71 | 113.83 | 299.57 | 0.074 | <0.001 * |
| Debt to tangible assets ratio | 1.58 | Ratio | 0.53 | 0.67 | 3.66 | 0.139 | <0.001 * |
| Sales growth rate | 20.38 | Percentage | 8.26 | 5.42 | 43.99 | 0.228 | <0.001 * |
| Firm size | 90.51 | Ratio | 119.88 | 5.91 | 781.90 | 0.240 | <0.001 * |
| Age | 88.52 | Years | 46.51 | 10.00 | 208.00 | 0.082 | <0.001 * |
| Interest coverage ratio | 4.47 | Ratio | 1.31 | 1.98 | 7.64 | 0.113 | <0.001 * |
* p < 0.001.
Table 2.
Reliability Analysis.
| Construct | Sub-Construct | Cronbach’s α |
|---|---|---|
| Corporate Reputation (CR) | Admiration and respect (AR) | 0.918 |
| Recognized reputation (RR) | 0.961 | |
| Good feeling (CF) | 0.958 | |
| Trust | 0.942 | |
| Corporate Financial Performance (CFP) | ROA | 0.915 |
| Tobin’s Q (TQ) | 0.939 | |
| Quick ratio (QR) | 0.912 | |
| Debt to tangible assets ratio (DT) | 0.917 | |
| Operating cycle (OC) | 0.872 | |
| CSR | 0.929 |
Table 3.
Discriminant Validity Analysis and Variable Correlation Coefficient.
| AR | RR | GF | Trust | Correlation Coefficient | AVE | |
|---|---|---|---|---|---|---|
| AR | 0.860 | 0.9192 | 0.7399 | |||
| RR | 0.757 ** | 0.911 | 0.9607 | 0.8303 | ||
| GF | 0.874 ** | 0.828 ** | 0.907 | 0.9588 | 0.8231 | |
| Trust | 0.885 ** | 0.818 ** | 0.924 ** | 0.875 | 0.9424 | 0.7659 |
| Cronbach’s α | 0.918 | 0.961 | 0.958 | 0.942 |
** p < 0.01.
Table 4.
Discriminant Validity Analysis and Variable Correlation Coefficients (CFP).
| ROA | TQ | QR | DT | OC | Correlation Coefficient | AVE | |
|---|---|---|---|---|---|---|---|
| ROA | 0.857 | 0.9170 | 0.7347 | ||||
| TQ | 0.695 ** | 0.895 | 0.9414 | 0.8009 | |||
| QR | 0.791 ** | 0.722 ** | 0.823 | 0.9131 | 0.6775 | ||
| DT | 0.704 ** | 0.739 ** | 0.804 ** | 0.859 | 0.9183 | 0.7382 | |
| OC | 0.738 ** | 0.799 ** | 0.748 ** | 0.749 ** | 0.844 | 0.8807 | 0.7124 |
| Cronbach’s α | 0.915 | 0.939 | 0.912 | 0.917 | 0.872 |
** p < 0.01.
Table 5.
Overall Mode of Fit.
| Evaluation Items | Standard Value or Result |
|---|---|
| Preliminary Fit Criteria: Detection errors, identification problems, or incorrect input | |
| Is there any negative error variation? | Yes |
| Has the error variation reached a significant level? | Yes |
| Is the absolute value of the correlation between the parameters not too close? | Yes |
| Factor loading is between 0.5 ~ 0.95 | Yes |
| There is no tremendous standard error | Yes |
| Overall Model Fit: Assessing the fit of the entire pattern and observation data | |
| 1. Model Fit→CMIN: Significant level of χ2; p > 0.05 | A smaller chi-square value is better |
| 2. Model Fit→CMIN→CMIN/DF: χ2/d.f. | <5 |
| 3. Model Fit→RMR, GFI→RMR (<0.05) | <0.05 |
| 4. Model Fit→RMR, GFI→GFI (>0.9) | >0.8 |
| 5. Model Fit→RMR, GFI→AGFI (>0.9) | >0.9 |
| 6. Model Fit→Baseline Comparisons→NFI (>0.9) | >0.9 |
| 7. Model Fit→Baseline Comparisons→TLI (>0.90) | >0.9 |
| 8. Model Fit→Baseline Comparisons→CFI (>0.9) | >0.9 |
| 9. Model Fit→RMSEA (<0.05) | <0.08 |
| Intrinsic quality of the model | |
| Reliability of individual items (reliability analysis) | >0.5 |
| Potential variable CR (measurement model) | >0.7 |
| AVE of potential variables (measurement model) | >0.5 |
Table 6.
Path Coefficients and Hypothesis Verification of the Theoretical Structural Model.
| Relationship between Constructs | Path Coefficient | t-Value | Hypothesis | Testing Result | ||
|---|---|---|---|---|---|---|
| CR | → | CFP | 0.428 *** | 8.604 | H1 | Accepted |
| CFP | → | CSR | 0.415 *** | 8.174 | H2 | Accepted |
| CR | → | CSR | 0.350 *** | 7.387 | H3 | Accepted |
*** p < 0.001.
© 2018 by the authors. Licensee MDPI, Basel, Switzerland. This article is an open access article distributed under the terms and conditions of the Creative Commons Attribution (CC BY) license (http://creativecommons.org/licenses/by/4.0/).
Share and Cite
MDPI and ACS Style
Lee, Y.-M.; Hu, J.-L. Integrated Approaches for Business Sustainability: The Perspective of Corporate Social Responsibility. Sustainability 2018, 10, 2318. https://doi.org/10.3390/su10072318
AMA Style
Lee Y-M, Hu J-L. Integrated Approaches for Business Sustainability: The Perspective of Corporate Social Responsibility. Sustainability. 2018; 10(7):2318. https://doi.org/10.3390/su10072318
Chicago/Turabian StyleLee, Yu-Muo, and Jin-Li Hu. 2018. "Integrated Approaches for Business Sustainability: The Perspective of Corporate Social Responsibility" Sustainability 10, no. 7: 2318. https://doi.org/10.3390/su10072318
Note that from the first issue of 2016, this journal uses article numbers instead of page numbers. See further details here.