Modeling Enablers of Environmentally Conscious Manufacturing Strategy: An Integrated Method

1
School of Economics and Management, Beihang University, Beijing 100191, China
2
Beijing Key Laboratory of Emergency Support Simulation Technologies for City Operations, Beihang University, Beijing 100191, China
*
Author to whom correspondence should be addressed.
Sustainability 2018, 10(7), 2284; https://doi.org/10.3390/su10072284
Submission received: 21 May 2018
/
Revised: 27 June 2018
/
Accepted: 29 June 2018
/
Published: 2 July 2018
(This article belongs to the Section Economic and Business Aspects of Sustainability)
Abstract
:Environmentally conscious manufacturing (ECM) has become an ever-more important strategy for most manufacturing companies to enhance the sustainability of their business. The successful adoption of environmentally conscious manufacturing strategy (ECMS) requires identifying a variety of crucial enablers and understanding their relationships of ECM strategy. However, most previous studies do not consider the interrelationships between enablers, and lack the mechanism of manipulating the vagueness in the decision-making process, which leads to the inaccurate identification of enablers. Thus, to solve these problems, an integrated method based on DEMATEL (Decision-Making Trial and Evaluation Laboratory) and rough set theory is developed in this paper. The method integrates the strength of DEMATEL in dealing with interactions between factors and the ability of rough set theory to manipulate uncertainty. Finally, the method is applied to analyze the enablers of ECMS in an equipment manufacturing company to reveal the feasibility and effectiveness of the proposed approach. The “corporate social responsibility motivation” is identified as the most critical enabler for the case company in implementing ECMS, and it is influenced by other ECMS enablers including “environmental protection equipment” and “environmental design technology”.
1. Introduction
In the last few decades, industrial production has brought about many serious global problems, such as the excessive consumption of natural resources, the pollution of water resources, climate change caused by greenhouse gas emissions, land resources depletion, and so on. The economic success in China has come at the expense of the overexploitation of natural resources and huge impacts on the environment in recent decades [1]. Environmental issues are increasingly serious concerns faced by the government, non-governmental organizations, scholars, and practitioners [2]. Although some Chinese manufacturing companies have begun to implement internal environmental strategies, no more than one-third of companies can successfully implement these strategies [3]. It is undeniable that industrial production has played a crucial role in promoting economic development. Still, the series of economic, environmental, and social issues arising from the production process cannot be ignored [4]. These issues have to be taken into account for future development. In recent years, most industries have begun moving toward manufacturing environmentally friendly products [5], which has promoted the development of environmental conscious manufacturing (ECM).
ECM is a new way of thinking about manufacturing which focuses on the most efficient and effective use of raw materials and natural resources, as well as minimizes the adverse impacts on workers and the environment. ECM is also known by different names: green manufacturing, clean manufacturing, environmentally responsible manufacturing, and sustainable manufacturing. Environmental and green attempts in manufacturing have begun to change from an environmental management method to a strategy. Environmentally conscious manufacturing strategy (ECMS) has a variety of different definitions ranging from small programs to large strategic programs. Sarkis [6] defined ECMS in the context of organizational corporate environmental management. The concept of ECMS has been discussed by many scholars, but there are fewer considerations of it at the strategic level, and its active adoption and popularity are not as extensive as expected. Active adoption usually means the non-mandatory implementation of various aspects of ECMS [7]. Even though ECMS has many advantages in achieving possible win-win results, improving competitive advantage and long-term environmental benefits, there are still many obstacles to its implementation, such as a lack of top management team members’ support, the lack of suitable ways to employ the concept, or the resistance of organization changes, etc.
Therefore, in order to help enterprises implement ECMS better, the most critical issue is how to promote ECMS implementation clearly, that is, to find the enablers of ECMS. This study aims to identify the critical enablers and interdependences with an integrated method.
With the continued growth of awareness of ECMS, there is a significant need to identify and to analyze enablers which provide critical inputs for policy design. However, an analysis of critical enablers, by identifying their causal interactions to encourage the implementation of environmentally conscious manufacturing strategy in China, remains untouched. Moreover, the evaluation of ECMS enablers involves much ambiguous human judgments and subjective information, which may lead to inaccurate ECMS enabler identification. Therefore, we seek to develop an integrated evaluation method for ECMS enabler identification under vague conditions. The proposed method is used to identify and assess crucial enablers by understanding the causal interactions between and among them, in order to motivate the implementation of environmentally conscious manufacturing strategy. The proposed methodology integrates the merit of the DEMATEL (Decision-Making Trial and Evaluation Laboratory) in dealing with complex and intertwined enablers with less information, and the rough number’s advantages in flexibly manipulating vague information. It can help to elucidate the causal interactions among ECMS enablers by using the method of rough DEMATEL.
The rest of the paper is structured as follows. Section 2 presents a literature review of ECMS enablers and enabler modeling methods. Section 3 proposes an integrated rough DEMATEL method for the identification of key ECMS enablers. In Section 4, a case study and a comparative analysis are conducted to show the feasibility and effectiveness of the method. Discussions of the research findings with theoretical and practical implications are provided in Section 5. Conclusions and suggestions for future research are made in Section 6.
2. Literature Review
2.1. Enablers of ECMS
The enablers of ECMS may include the comprehensive consideration of economy, policy, organization, environment, and society [8]. Therefore, identifying these factors is significant for ECMS transmission in industrial production, and is key for ECMS implementation. This paper aims to identify the enablers of ECMS, using the rough DEMATEL method to develop a model that can reflect prominence and causality.
In recent years, some scholars have discussed the enablers of ECMS. Singh et al. identified 14 drivers of green manufacturing based on the data collection of Indian industries, including employee motivation, health and safety, global climatic pressure and ecological benefits, social and environmental responsibility, and so on [9]. Luken and Rompaey summarized 10 drivers and assessed their importance in four manufacturing sub-sectors [10]. It was found that high cost, current environmental regulation, and anticipated future environmental regulation were the three most important drivers [10]. Mittal et al. identified ECMS drivers in India and Germany and compared these drivers with independent sample testing methods [11]. Florida examined the innovative approaches to explore ECMS drivers and their importance [12]. Based on the literature review, this paper comprehensively considers the enablers of ECMS from three aspects (economic, environmental, and social perspectives), as shown in Table 1.
2.2. Evaluation of Enablers
In reality, the enablers of ECMS are often interrelated. For example, the improvement of resource utilization can reduce the waste discharge to a certain extent, and thus reduce the damage to the living environment. Therefore, the interdependence between the enablers of ECMS may affect the priority decision. Scholars have also used different methods to analyze the enablers. For example, Mittal and Sangwan used a structural equation modeling (SEM) technique to verify that ECMS has three types of drivers: internal, policy, and economic [8]. There are also some scholars who have adopted analytic hierarchy process (AHP). Pineda-Henson and Culaba used AHP to develop a diagnostic model for evaluating the productivity of ECMS [35]. Madu et al. applied environmentally friendly design to production through AHP [36]. AHP is a structured and hierarchical decision-making method, which combines quantitative analysis and qualitative judgment to transform complex relationships in social life into quantitative analysis. However, it does not apply to the interdependence between various factors.
There are also some scholars that have adopted methods that could explore the interaction relationships between different drivers, such as analytic network process (ANP) and decision-making trail and evaluation laboratory (DEMATEL) methods. For instance, Sarkis used the combination of ANP and DEA to explore environmentally conscious manufacturing programs [7]. ANP has evolved from AHP and is a more general form. ANP not only inherits the advantages of AHP, but also considers the interdependence between factors [37]. The DEMATEL method is a tool to describe the complex causal relationship of the structure using a direct-relation matrix or vector diagram. It depicts the relationship between system elements [38]. Parag et al. used DEMATEL to construct the interdependence relationship of environmentally conscious manufacturing indicators [25]. DEMATEL is also used to explore the influential criteria for carbon management in green supply chain, thus improving supplier’s overall performance in carbon management. However, both ANP and DEMATEL do not take into account the subjectivity and uncertainty in the process of expert decision-making. In order to manipulate the subjective of oral assessment, fuzzy DEMATEL can be applied to identify the enablers of ECMS. Previous studies have applied fuzzy DEMATEL to other fields, such as green suppliers evaluation [39], green supply chain management [40], and environment performance [41].
Previous studies have provided valuable insights into the enablers of ECMS. Even considering the subjectivity and interaction, the previous approaches also lack flexibility (such as fuzzy DEMATEL). The purpose of this study is to identify the enablers of ECMS and their interrelationships with a proposed DEMATEL method. Using the rough numbers derived from rough set theory to deal with imprecise information [42], we start by constructing the direct-relation matrix between those enablers through a pair-wise comparison. Then, we use the proposed method to calculate the total-relation matrix that can reflect the complex relationship between various factors. Finally, we find the causality and critical factors based on the overall influence of each enabler. The contribution of this study includes (a) taking into account the interactions between various enablers and establishing a framework of relationships among those factors; (b) adopting flexible and rough numbers to manipulate the ambiguity and subjectivity in the decision-making process; (c) providing more theoretical support for a deeper understanding of the relationship between ECMS enablers and helping companies implement ECMS programs.
3. Method
DEMATEL (Decision-Making Trial and Evaluation Laboratory) is used to visualize the structure of complicated causal relationships [43]. It is an approach used to analyze a structural model involving causal relationships between complex factors. DEMATEL can clearly show the cause-effect interactions of factors when evaluating a problem. It describes a basic concept of the contextual relationship between the elements in a system, in which the numeral represents the strength of the influence. However, DEMATEL alone cannot flexibly deal with the vague information in the decision-making process. On the contrary, rough set theory can effectively manipulate the vagueness and subjectivity in decision-makers’ judgments without any auxiliary information or additional subjective judgment (e.g., membership functions and distribution forms) [44]. It requires only the information provided. The details of the DEMATEL and rough set theory are not provided, because they are not the focus of this research. Interested readers are encouraged to obtain a more detailed description of the DEMATEL and rough set theory in References [43,44]. In order to identify the interdependence among those factors under conditions of vagueness, this paper adopts an integrated DEMATEL method. The proposed method applies a flexible rough interval to the traditional DEMATEL method. The flow diagram of the proposed method is shown in Figure 1.
3.1. Establish the Direct-Relation Matrix
Step 1.1. Assess influence between enablers to construct the direct-relation matrix
There are n sustainable development experts that participated in the assessment of the direct influences between the d enablers through a five-point scale in Table 2 (0 = No influence, 1 = Low influence, 2 = Medium influence, 3 = High influence, 4 = Very high influence).
The direct-relation matrix of the eth expert is obtained as follows:
where represents the eth expert’ evaluation for the influence of the ith enabler () on the jth enabler (), n is the number of experts, and d is the number of enablers.
The value of will be zero (0) while i = j, which means that an enabler has no effect on itself.
Step 1.2. Transform the direct-relation matrix into the rough interval form
From Step 1.1, d direct-relation matrices of enablers are obtained. Therefore, synthesizing in the e direct-relation matrices can obtain in the group direct-relation matrix .
where , and .
The pair-comparison assessment of the direct-relation between those enablers is a complex task because of the large amount of information and expert experience and knowledge that needs to be involved. However, the process is usually ambiguous and subjective. Furthermore, decision-makers may use vague linguistic terms to evaluate the interactions between different enablers; thus, each degree of evaluation is given a rough value to quantify such imprecise information.
After obtaining , where is the eth expert’s evaluation of the ith enabler’s influence on the jth factors, n is the number of experts, and d is the number of enablers.
Assuming that there is a group of n experts in M, those elements in M are ordered as . D is the universe containing all the objects. I is an arbitrary object of D, then the lower approximation and the upper approximation can be described as:
The judgment could be represented by a rough interval formed by the lower limit and upper limit :
where and represent the elements in the lower approximation and upper approximation of . and are the number of objects that are included in the calculation of the lower approximation and upper approximation.
According to Equations (3) and (4), in M can be transformed into rough numbers as:
represents the lower limit while is the upper limit of rough number .
With Equations (3)–(5), the evaluation from the eth expert of the ith enabler’s influence on the jth enabler can be obtained as:
where is the lower limit and is the upper limit of the rough number .
According to Equations (3)–(5), the eth rough direct-relation matrix can be obtained as follows:
where and respectively represent the lower limit and upper limit of the rough interval form from the eth expert.
Step 1.3. Construct the integrated rough direct-relation matrix
The upper limit and lower limit of the rough interval form are calculated by arithmetic weighted averaging from n experts. Then, the individual rough direct-relation matrices are integrated into the group rough direct-relation matrix as follows:
where [] in is obtained from:
where is the lower limit, is the upper limit, and n is the number of experts.
3.2. Construct the Total-Relation Matrix
Step 2.1. Normalize the group direct-relation matrix
After determining the group direct-relation matrix, it needs to be converted into a normalized matrix, and its form is shown as:
, and and are the lower and upper limit of the rough interval number , respectively.
Step 2.2. Determine the total-relation matrix
Then, the normalized matrix can be divided into two sub-matrices according to the lower limit and upper limit, i.e., and :
The total-relation matrix is (s = L, U), which can be obtained as follows:
consists of all of the relations including direct and indirect relations between alternatives.
The total-relation matrix can be represented as:
represents the rating of the ith ECMS enabler’s overall influence resulted from the jth factor, where and represent the lower limit and upper limit of each rough interval in the W matrix.
3.3. Identification of Critical Enablers
Step 3.1. Transform the rough interval into concrete values
The sum of rows and columns in the matrices and are respectively calculated as follows:
is the sum of all of the elements in the ith row of the matrix W, which represents the ith enabler’s () total influence on all other enablers. is the sum of all elements in the ith column, representing the total influence of all other factors affecting the ith enabler.
To better measure the value of the relation between each alternative (Prominence) and the severity of the influence (Relation), and need to be transformed into crisp forms [45] as follows:
(1) Normalization list
where . Here, is the lower limit while is the upper limit of . Similarly, is the lower limit and is the upper limit of . and are the normalized forms of and , while and are the normalized forms of and , respectively.
(2) Determination of a normalized precise value
(3) Computation of the final crisp form for and for
Step 3.2. Calculate “Prominence”/“Relation” and prioritize enablers
Adding to could obtain the vector , and subtracting from gives the vector .
represents the overall influence exerted by the ith factor on all other enablers and the influence caused by all other factors. It shows the importance of the ith factor. The larger the value of , the more important and prominent the overall significance of . In turn, the value of can be used to determine the importance rank of enablers.
represents the difference of the ith enabler exerted and received influence, and it is the foundation for all enablers categorized. When is greater than 0, it is a causal factor. If is less than 0, it belongs to an effect factor.
Step 3.3. Identify the causes and consequences of enablers
The impact-relation map of the ith factor can be determined by the “Prominence” and “Relation” obtained in step 3.2. In the impact-relation map, represents the importance of the ith factor, while indicates the cause or result of the ith factor. In order to describe the relationship between those factors of ECMS more vividly, a relationship diagram based on the total-relation matrix can be drawn to identify the most influential enablers. The W matrix is based on rough interval values; therefore, it needs to convert these into crisp values according to Equations (15)–(17). The crisp total-relation matrix can be obtained as:
However, because the interrelationships between those factors include all kinds of possibilities, it is necessary to set an appropriate threshold for drawing impact-relation maps. When τ is too low, the diagram will be too complex to show more crucial and necessary information. Conversely, when the value of τ is too high, some factors may be presented as factors that are independent of other factors. The threshold can be obtained by adding the mean to the standard deviation of the matrix . All values of the matrix that exceed will be retained and shown in the final diagram.
4. Result and Discussion
4.1. Case Background
In order to verify the effectiveness and flexibility of the proposed method, 12 ECMS experts were invited to participate in the survey, including three ECMS researchers and nine managers (four production managers, two technical managers, three senior managers) who are all from an equipment manufacturing company. The nine managers have at least three years of relevant work experience. The 12 enablers were discussed by the three experts and affirmed by the nine managers, which promoted the implementation of ECMS.
4.2. Implementation
4.2.1. Construct the Direct-Relation Matrix
Step 1.1. Assess the influences between enablers by pair-wise comparison to construct the direct-relation matrix
The 12 experts evaluated the direct relationships between the 12 ECMS enablers (Ei, i = 1, 2, 3, …, 12) based on the five points in Table 2. The detailed information of the 12 enablers is as follows: E1 (Environmental protection equipment), E2 (Environmental design technology), E3 (Environmental protection willingness), E4 (Managerial support), E5 (Company image), E6 (Environmental protection expenditure), E7 (Resource efficiency), E8 (Greenhouse gas), E9 (Solid waste), E10 (Employee’s health), E11 (Living environment), and E12 (Corporate social responsibility motivation). Different direct-relation matrices of enablers can be acquired according to Equation (1). The evaluation direct-relation matrix of the 12 experts is shown in Table 3. The final evaluation result of the 12th expert is shown in the Table 4. The similar scoring formats of other experts are not listed in Table 4 due to space limitations.
Step 1.2. Transform the direct-relation matrix into the rough interval form
The direct-relation matrix of personal assessment needs to be integrated into the group one. Considering the ambiguity during the pair-wise comparison decision-making process, the rough interval form can be used instead of the exact numerical value to obtain the direct-relation matrix of different experts according to Equations (2)–(7).
Step 1.3. Construct the integrated rough direct-relation matrix
According to Equations (8) and (9), the group direct-relation matrix is shown as in Table 5.
4.2.2. Determine the Total-Relation Matrix
Step 2.1. Normalize the group direct-relation matrix
We converted the interaction scales of enablers into comparable scales by ensuring the existence of the direct and indirect relative severity matrix W. The group direct-relation matrix A is normalized according to Equation (10).
Step 2.2. Determine the total-relation matrix
Obtaining the total-relation matrix W according to Equations (11)–(13), each element in Table 6 represents the overall influence of enabler against enabler .
4.2.3. Identification of Critical Enablers
Step 3.1. Transform the rough interval into concrete values
We then calculated the sum of each row () and each column () in matrix W according to Equation (14) (see Table 7). Then, and can be transformed into the final crisp values and , respectively, which are provided in Table 7.
Step 3.2. Calculate “Prominence”/“Relation” and prioritize enablers
To analyze the cause-effect relations between those enablers, “Prominence” () and “Relation” () could be calculated using Equation (18). indicates the degree of relationship between the ith enabler and other factors. The ith factor will be the cause if , while it will the effect if . In addition, the impact-relation map of enablers can be drawn according to the value of the abscissa , as shown in Figure 2. Based on the final result of , (Corporate social responsibility motivation) is the most critical factor with . Moreover, all of the enablers can be prioritized as follows: . Six important factors, (Corporate social responsibility motivation), (Living environment), (Environment protection willingness), (Employee’s health), (Company image), and (Solid waste), are marked in green circles in Figure 2.
“Relation” is calculated using Equation (18), following which all enablers can be divided into two categories, as shown in Figure 1. The cause group includes E1 (Environmental protection equipment), E2 (Environmental design technology), E3 (Environmental protection willingness), E4 (Managerial support), E6 (Environmental protection expenditure), and E7 (Resource efficiency), while the effect group consists of E5 (Company image), E8 (Emission of air pollutants), E9 (Solid waste), E10 (Employee’s health), E11 (Living environment), and E12 (Corporate social responsibility motivation).
Step 3.3. Identify the causes and consequences of enablers
In order to further explore the interaction between those enablers, it is necessary to convert the rough interval form of the total-relation matrix into crisp values using Equation (20), and then draw a relationship digraph.
The threshold value of the total-relation matrix is obtained by calculating the mean (0.221) and the standard deviation (0.083) according to Equation (20). All of the relationships that exceed the threshold are presented in Figure 3. As can be seen from Figure 3, the upgrading of environmental protection equipment (E1) and environmental design technology (E2) will help to improve the company image (E5), while it also can influence the emission of air pollutants (E8), the living environment (E11), and employees’ health (E10). The improvement of resource efficiency (E7) can reduce the damage to the residents’ living environment (E11) to some extent. In addition, the results show that environmental protection willingness (E3) has a direct influence on the company image (E5).
4.3. Comparisons and Discussion
To further verify the effectiveness and advantages of the method proposed in this paper, the other two comparative methods were used to try solving the same problem. The DEMATEL-based method [46] and the fuzzy DEMATEL-based method [47] were included. The ranking orders of the 12 ECMS enablers were calculated by these three methods, as shown in Table 8. Figure 4 shows the bar graph of the 12 factors ranking with different methods.
The first method is the traditional DEMATEL. According to Table 8, the ranking result of traditional DEMATEL has a certain degree of similarity compared with the proposed method in this paper. Moreover, the ranking result of E1, E2, E4, E7, and E9 is slightly different. The critical relationships between the enablers in DEMATEL and the proposed method are different. The influence of E1 on E10 (), E2 on E11 (), and E3 on E10 () are the most critical relationships in the proposed method (Figure 5c), but none of them appear in the DEMATEL method (Figure 5a). The proposed method adopts a mechanism to manipulate uncertainty in the pair-wise comparison process. Considering that the experts express some uncertainty when making their judgments, the enabler decision-making information is transformed into a rough interval number. Therefore, the judgments of 12 experts on the relation between E2 and E1, expressed as {LI,NI,HI,HI,MI,HI,VHI,LI,VHI,HI,NI,HI}, were transformed into verbal scores of [0.000,2.250], [0.500,2.700], [0.800,3.125], [1.900,3.286], and [2.250,4.000]. However, the DEMATEL just converts the judgment information {LI,NI,HI,HI,MI,HI,VHI,LI,VHI,HI,NI,HI} into crisp values {1,0,3,3,2,3,4,1,4,3,0,3}. Consequently, the proposed DEMATEL method can provide more valuable information than traditional DEMATEL method.
The second comparison method is the fuzzy DEMATEL method. The ranking results of the fuzzy DEMATEL are different from the proposed method except for E1, E2, E8, and E12. The fuzzy DEMATEL method also takes into account uncertainty manipulation. This method adopts the fuzzy numbers based on the fuzzy set theory, which is different from the proposed method. In this way, the proposed method has better flexibility in dealing with uncertain values. Similarly, the relationship between E2 and E1, evaluated by 12 experts as {3,3,4,3,3,2,3,2,4,3,3,3}, can be converted into {[2.800,3.200], [2.800,3.200], [3.000,4.000], [2.800,3.200], [2.800,3.200], [2.000,3.000], [2.800,3.200], [2.000,3.000], [3.000,4.000], [2.800,3.200], [2.800,3.200], [2.800,3.200]}, and aggregates the rough intervals into [2.700,3.300]. In contrast, the fuzzy DEMATEL transformed it into {[2,4], [2,4], [3,5], [2,4], [2,4], [1,3], [2,4], [1,3], [3,5], [2,4], [2,4], [2,4]}, and aggregated the intervals into [2,4]. Naturally, the proposed method is more reasonable and flexible than the fuzzy DEMATEL method. The most critical relationships obtained from fuzzy DEMATEL are almost different from those of the proposed method. For example, the critical relationships of “” and “” were identified in the proposed method (Figure 5c), while they did not appear in the fuzzy DEMATEL (Figure 5b). The qualitative comparison results of the three different methods are summarized in Table 9.
5. Theoretical and Practical Implications
Identifying enablers is significant in both academia and in practice, and further promotes the development of ECMS. Based on this perspective, corporate managers could better identify the enablers of ECMS and adopt more appropriate measures to promote ECMS.
From the theoretical point of view, this study takes into account the influence of enablers of ECMS, which is omitted in previous literature, e.g., Govindan et al. (2013) [20]. Some previous studies identified the drivers of ECM, but few explored the causal relationships between ECMS enablers. This paper fills this gap by developing an interaction map of ECMS enablers and examining the complex interrelationship among them. Our findings develop the ECMS literature not only by classifying the enablers into different categories, but also identifying the critical relationships between ECMS enablers. This paper will help decision-makers to better understand the relationships between various factors. Moreover, compared with the previous methods, the proposed approach adopts a more flexible rough interval to manipulate the vague and subjective information, which does not require much prior information, such as fuzzy membership and data distribution. Thus, it will help managers understand the accurate interrelationships between different enablers and make more appropriate decisions in promoting ECMS.
From a practical point of view, ECMS has great potential in the green manufacturing industry. Manufacturing companies can reduce pollution in the production process and achieve long-term benefits by implementing ECMS. The practical implications of this study are as follows. First of all, the most critical enabler is “CSR motivation” (E12) for the case company in implementing ECMS, which includes instrumental motives, relational motives, and moral motives. CSR motivation is also the driver of some other ECM enablers. The improvement of environmental equipment and design technology will influence corporate profits in the long run, which will promote the sustainable development of enterprises. Adopting environmental friendly behaviors to increase resource utilization and lowering pollution levels will also help to establish an ethical image for enterprises. At the same time, it will help to attract environmentally conscious customers. Hence, those factors motivate manufacturing organizations to adopt ECM programs. In addition, the enabler “environment protection willingness” (E3) can influence other ECM enablers. In other words, the attitude and commitment to environment protection in the case company is crucial for implementing the ECM project. Besides, when the case company wants to reduce “solid waste” (E9), it can improve “environmental protection equipment” (E1) and “environmental design technology” (E2) to achieve this objective. Similarly, the “living environment” (E11) of residents can also be improved by enhancing “resource efficiency” (E7). In addition, organizational support cannot be ignored. When managers have a high awareness of the environmental protection and support ECMS (E4), they will be more motivated to undertake corporate social responsibility (E12). The classification of the cause group and the effect group helps the enterprise to better and more effectively implement the ECMS. The effect group of enablers is often influenced by the cause group, so the strategic adjustment of the cause group will be effective and efficient with limited resources.
6. Conclusions and Suggestions
In order to effectively identify the enablers of ECMS, this paper adopts an integrated rough DEMATEL method. A case study of an equipment manufacturing company shows that the proposed approach is feasible and effective. To sum up, the proposed approach to effectively identify the enablers of ECMS reveals the following features:
The proposed method takes into account the interaction relationships among factors, so that it can better establish the relationship framework among enablers discovered, identify critical factors, and determine the causes and effects. At the same time, vague information is transformed into rough intervals to represent the uncertainty of judgments. The proposed method has a lower requirement for prior information compared to fuzzy approaches, which greatly reduces the difficulty of the decision-making process. For practitioners, the proposed approach can help to elucidate the relationships among ECMS enablers, as well as to identify the key factors in the process of implementation for ECMS to aid in better decision-making.
Although the proposed approach shows potential in identifying the enablers of ECMS, it still has some more limitations. One is that the proposed approach does not differentiate between positive and negative relationships among enablers of ECMS. This study only classifies ECMS enablers into the cause group or the effect group, which does not differentiate between positive and negative relationships among enablers of ECMS. Furthermore, finding the critical path of influence is also a problem to be further explored. Thus, future research will consider both positive and negative relationships in the method to make it more accurate in identifying the enablers of ECMS. In addition, this study was conducted only for one company. Consequently, more case studies are necessary to verify the external validity of the approach.
Author Contributions
Conceptualization, L.M.; data curation, Y.Z.; methodology, W.S.
Acknowledgments
The work described in this paper was supported by the National Natural Science Foundation of China (Grant No. 71502009 and 71501006), the Technical Research Foundation (JSZL2016601A004), the Open Project of Henan Key Laboratory of Intelligent Manufacturing of Mechanical Equipment, Zhengzhou University of Light Industry (No. IM201801), and the Fundamental Research Funds for the Central Universities. The authors also would like to thank the editor and the anonymous reviewers for their helpful comments and suggestions on the drafts of this paper.
Conflicts of Interest
The authors declare no conflict of interest.
References
- Guan, D.; Hubacek, K. Assessment of regional trade and virtual water flows in China. Ecol. Econ. 2007, 61, 159–170. [Google Scholar] [CrossRef] [Green Version]
- Mccurry, L.; Humphreys, P.; Mcaleer, E.; Mcivor, R. What multinational corporations with manufacturing plants in Northern Ireland and the Republic of Ireland are demanding from their suppliers. J. Small Bus. Enterp. Dev. 2000, 7, 363–373. [Google Scholar]
- Zhu, Q.; Sarkis, J. Relationships between operational practices and performance among early adopters of green supply chain management practices in Chinese manufacturing enterprises. J. Oper. Manag. 2004, 22, 265–289. [Google Scholar] [CrossRef]
- Sangwan, K.S. Development of a multi criteria decision model for justification of green manufacturing systems. Int. J. Green Econ. 2011, 5, 285–305. [Google Scholar] [CrossRef]
- Laroche, M.; Bergeron, J.; Barbaro-Forleo, G. Targeting consumers who are willing to pay more for environmentally friendly products. J. Consum. Mark. 2001, 18, 503–520. [Google Scholar] [CrossRef]
- Sarkis, J. Manufacturing’s role in corporate environmental sustainability. Int. J. Oper. Prod. Manag. 2011, 21, 666–686. [Google Scholar] [CrossRef]
- Sarkis, J. Evaluating environmentally conscious manufacturing barriers with interpretive structural modeling. Proc. SPIE Int. Soc. Opt. Eng. 2007, 8, 505–520. [Google Scholar] [CrossRef]
- Mittal, V.K.; Sangwan, K.S. Development of a structural model of environmentally conscious manufacturing drivers. J. Manuf. Technol. Manag. 2014, 25, 1195–1208. [Google Scholar] [CrossRef]
- Singh, A.; Singh, B.; Dhingra, A.K. Drivers and barriers of green manufacturing practices: A survey of Indian industries. IJMRS Int. J. Eng. Sci. 2012, 1, 5–19. [Google Scholar]
- Luken, R.; Rompaey, F.V. Drivers for and barriers to environmentally sound technology adoption by manufacturing plants in nine developing countries. J. Clean. Prod. 2008, 16, 67–77. [Google Scholar] [CrossRef]
- Mittal, V.K.; Sangwan, K.S. Development of an interpretive structural model of obstacles to environmentally conscious technology adoption in Indian industry. In Glocalized Solutions for Sustainability in Manufacturing; Hesselbach, J.E.A.E., Ed.; Springer: Berlin/Heidelberg, Germany, 2011; pp. 383–388. [Google Scholar]
- Florida, R. Lean and green: The move to environmentally conscious manufacturing. Calif. Manag. Rev. 1996, 39, 80–105. [Google Scholar] [CrossRef]
- Singh, P.J.; Sangwan, K.S. Management commitment and employee empowerment in environmentally conscious manufacturing implementation. Lect. Notes Eng. Comput. Sci. 2011, 2190, 644–649. [Google Scholar]
- Gungor, A.; Grupta, S.M. Issues in environmentally conscious manufacturing and product recovery: Survey. Comput. Ind. Eng. 1999, 36, 811–853. [Google Scholar] [CrossRef]
- Mittal, V.K.; Sangwan, K.S. Modeling drivers for successful adoption of environmentally conscious manufacturing. J. Model. Manag. 2014, 9, 127–140. [Google Scholar] [CrossRef]
- Law, K.; Gunasekaran, A. Sustainability development in high-tech manufacturing firms in Hong Kong: Motivators and readiness. Int. J. Prod. Econ. 2012, 137, 116–125. [Google Scholar] [CrossRef]
- Abdulrahman, M.D.; Subramanian, N.; Liu, C.; Shu, C. Viability of remanufacturing practice: A strategic decision making framework for Chinese auto-parts companies. J. Clean. Prod. 2015, 105, 311–323. [Google Scholar] [CrossRef]
- Hambrick, D.C. Upper echelons theory: An update. Acad. Manag. Rev. 2007, 32, 334–343. [Google Scholar] [CrossRef]
- Agan, Y.; Acar, M.F.; Borodin, A. Drivers of environmental processes and their impact on performance: A study of Turkish SMEs. J. Clean. Prod. 2013, 51, 23–33. [Google Scholar] [CrossRef]
- Govindan, K.; Diabat, A.; Shankar, K.M. Analyzing the drivers of green manufacturing with fuzzy approach. J. Clean. Prod. 2015, 96, 182–193. [Google Scholar] [CrossRef]
- Jasch, C. The use of Environmental Management Accounting (EMA) for identifying environmental costs. J. Clean. Prod. 2003, 11, 667–676. [Google Scholar] [CrossRef]
- Ilgin, M.A.; Gupta, S.M. Environmentally conscious manufacturing and product recovery (ECMPRO): A review of the state of the art. J. Environ. Manag. 2010, 91, 563–591. [Google Scholar] [CrossRef] [PubMed]
- Wong, C.W.Y.; Lai, K.H.; Shang, K.C.; Lu, C.S.; Leung, T.K.P. Green operations and the moderating role of environmental management capability of suppliers on manufacturing firm performance. Int. J. Prod. Econ. 2012, 140, 283–294. [Google Scholar] [CrossRef]
- Sinha, A.K.; Anand, A. Towards fuzzy preference relationship based on decision making approach to access the performance of suppliers in environmental conscious manufacturing domain. Comput. Ind. Eng. 2017, 105, 39–54. [Google Scholar] [CrossRef]
- Sen, P.; Roy, M.; Pal, P. Evaluation of environmentally conscious manufacturing programs using a three-hybrid multi-criteria decision analysis method. Ecol. Indic. 2017, 73, 264–273. [Google Scholar] [CrossRef]
- Sundarakani, B.; Souza, R.D.; Goh, M.; Wagner, S.M.; Manikandan, S. Modeling carbon footprints across the supply chain. Int. J. Prod. Econ. 2010, 128, 43–50. [Google Scholar] [CrossRef]
- Gupta, S.; Dangayach, G.S.; Singh, A.K.; Rao, P.N. Analytic hierarchy process (AHP) model for evaluating sustainable manufacturing practices in Indian electrical panel industries. Soc. Behav. Sci. 2015, 189, 208–216. [Google Scholar] [CrossRef]
- Dangayach, G.S. Advanced manufacturing technologies: Evidences from Indian automobile companies. Int. J. Manuf. Technol. Manag. 2004, 6, 426–433. [Google Scholar] [CrossRef]
- Sangwan, K.S. Stakeholders for environmentally conscious technology adoption: An empirical study of Indian micro, small and medium enterprises. Int. J. Manag. Decis. Mak. 2012, 12, 36–49. [Google Scholar] [CrossRef]
- Mclellan, B.C. Streamlining the use of legislated reporting to move to ‘life of project’ sustainability reporting. Int. J. Min. Miner. Eng. 2014, 5, 19–37. [Google Scholar] [CrossRef]
- Vinodh, S.; Rathod, G. Integration of ECQFD and LCA for sustainable product design. J. Clean. Prod. 2010, 18, 833–842. [Google Scholar] [CrossRef]
- Nee, A.Y.C.; Ong, S.K.; Kumaran, D.S.; Tan, R.B.H. Environmental life cycle cost analysis of products. Environ. Manag. Health 2001, 12, 260–276. [Google Scholar]
- Dare, J. Will the truth set us free? An exploration of CSR motive and commitment. Bus. Soc. Rev. 2016, 121, 85–122. [Google Scholar] [CrossRef]
- Ağan, Y.; Kuzey, C.; Acar, M.F.; Açıkgöz, A. The relationships between corporate social responsibility, environmental supplier development, and firm performance. J. Clean. Prod. 2016, 112, 1872–1881. [Google Scholar] [CrossRef]
- Pineda-Henson, R.; Culaba, A.B. A diagnostic model for green productivity assessment of manufacturing processes. Int. J. Life Cycle Assess. 2004, 9, 379–386. [Google Scholar] [CrossRef]
- Madu, C.N.; Kuei, C.; Madu, I.E. A hierarchic metric approach for integration of green issues in manufacturing: A paper recycling application. J. Environ. Manag. 2002, 64, 261–272. [Google Scholar] [CrossRef]
- Agarwal, A.; Shankar, R.; Tiwari, M.K. Modeling the metrics of lean, agile and leagile supply chain: An ANP-based approach. Eur. J. Oper. Res. 2006, 173, 211–225. [Google Scholar] [CrossRef]
- Li, Y.; Mathiyazhagan, K. Application of DEMATEL approach to identify the influential indicators towards sustainable supply chain adoption in the auto components manufacturing sector. J. Clean. Prod. 2018, 172, 2931–2941. [Google Scholar] [CrossRef]
- Büyüközkan, G.; Çifçi, G. A novel hybrid MCDM approach based on fuzzy DEMATEL, fuzzy ANP and fuzzy TOPSIS to evaluate green suppliers. Expert Syst. Appl. 2012, 39, 3000–3011. [Google Scholar] [CrossRef]
- Lin, R.J. Using fuzzy DEMATEL to evaluate the green supply chain management practices. J. Clean. Prod. 2013, 40, 32–39. [Google Scholar] [CrossRef]
- Tsai, S.B.; Chien, M.F.; Xue, Y.; Li, L.; Jiang, X.; Chen, Q.; Zhou, J.; Wang, L. Using the fuzzy DEMATEL to determine environmental performance: A case of printed circuit board industry in Taiwan. PLoS ONE 2015, 10, e129153. [Google Scholar] [CrossRef] [PubMed]
- Zhai, L.Y.; Khoo, L.P.; Zhong, Z.W. A rough set based QFD approach to the management of imprecise design information in product development. Adv. Eng. Inform. 2009, 23, 222–228. [Google Scholar] [CrossRef]
- Tzeng, G.H.; Chiang, C.H.; Li, C.W. Evaluating intertwined effects in e-learning programs: A novel hybrid MCDM model based on factor analysis and DEMATEL. Expert Syst. Appl. 2007, 32, 1028–1044. [Google Scholar] [CrossRef]
- Ziarko, W. Variable precision rough set model. J. Comput. Syst. Sci. 1993, 46, 39–59. [Google Scholar] [CrossRef]
- Song, W.; Ming, X.; Liu, H.C. Identifying critical risk factors of sustainable supply chain management: A rough strength-relation analysis method. J. Clean. Prod. 2017, 143, 100–115. [Google Scholar] [CrossRef]
- Kaur, J.; Sidhu, R.; Awasthi, A.; Chauhan, S.; Goyal, S. A DEMATEL based approach for investigating barriers in green supply chain management in Canadian manufacturing firms. Int. J. Prod. Res. 2018, 56, 312–332. [Google Scholar] [CrossRef]
- Asan, U.; Kadaifci, C.; Bozdag, E.; Soyer, A.; Serdarasan, S. A new approach to DEMATEL based on interval-valued hesitant fuzzy sets. Appl. Soft Comput. 2018, 66, 34–49. [Google Scholar] [CrossRef]
Figure 1.
The proposed integrated Decision-Making Trial and Evaluation Laboratory (DEMATEL) method.
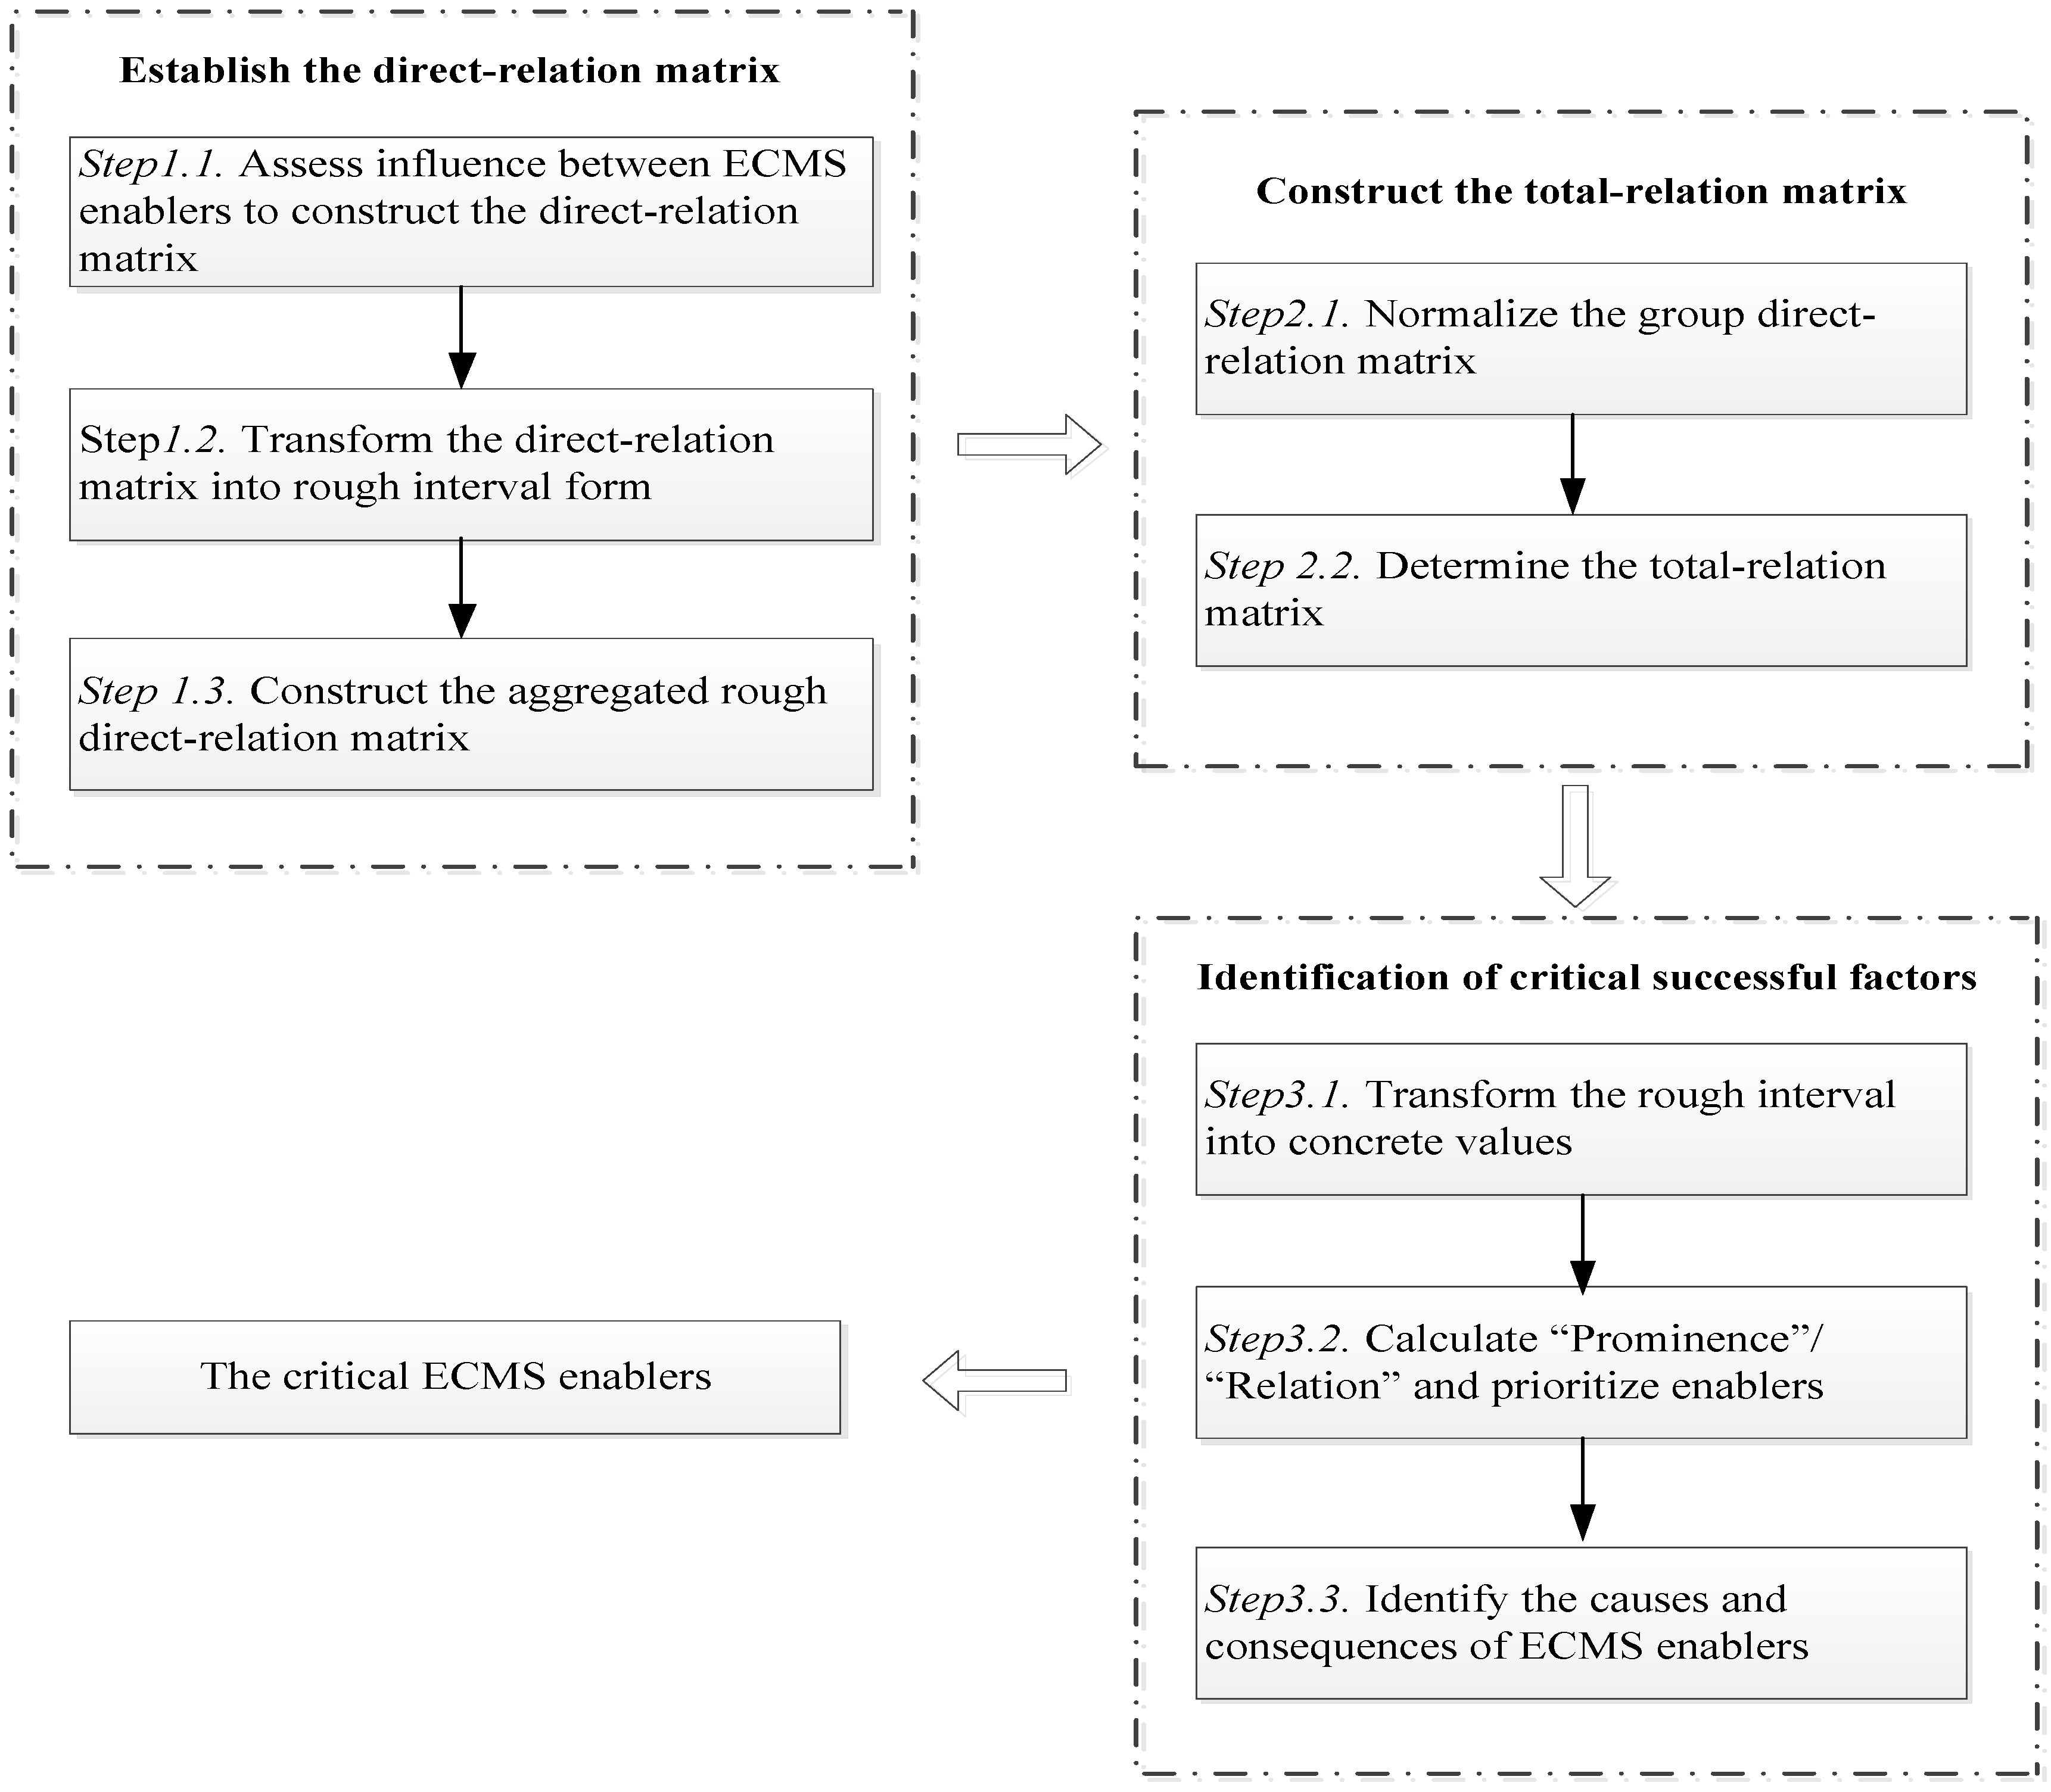
Figure 2.
The impact-relation map of ECMS enablers. Note: Green circles in Figure 2 represent the cause group of ECMS enablers; orange circles represent the effect group of ECMS enablers.
Figure 2.
The impact-relation map of ECMS enablers. Note: Green circles in Figure 2 represent the cause group of ECMS enablers; orange circles represent the effect group of ECMS enablers.
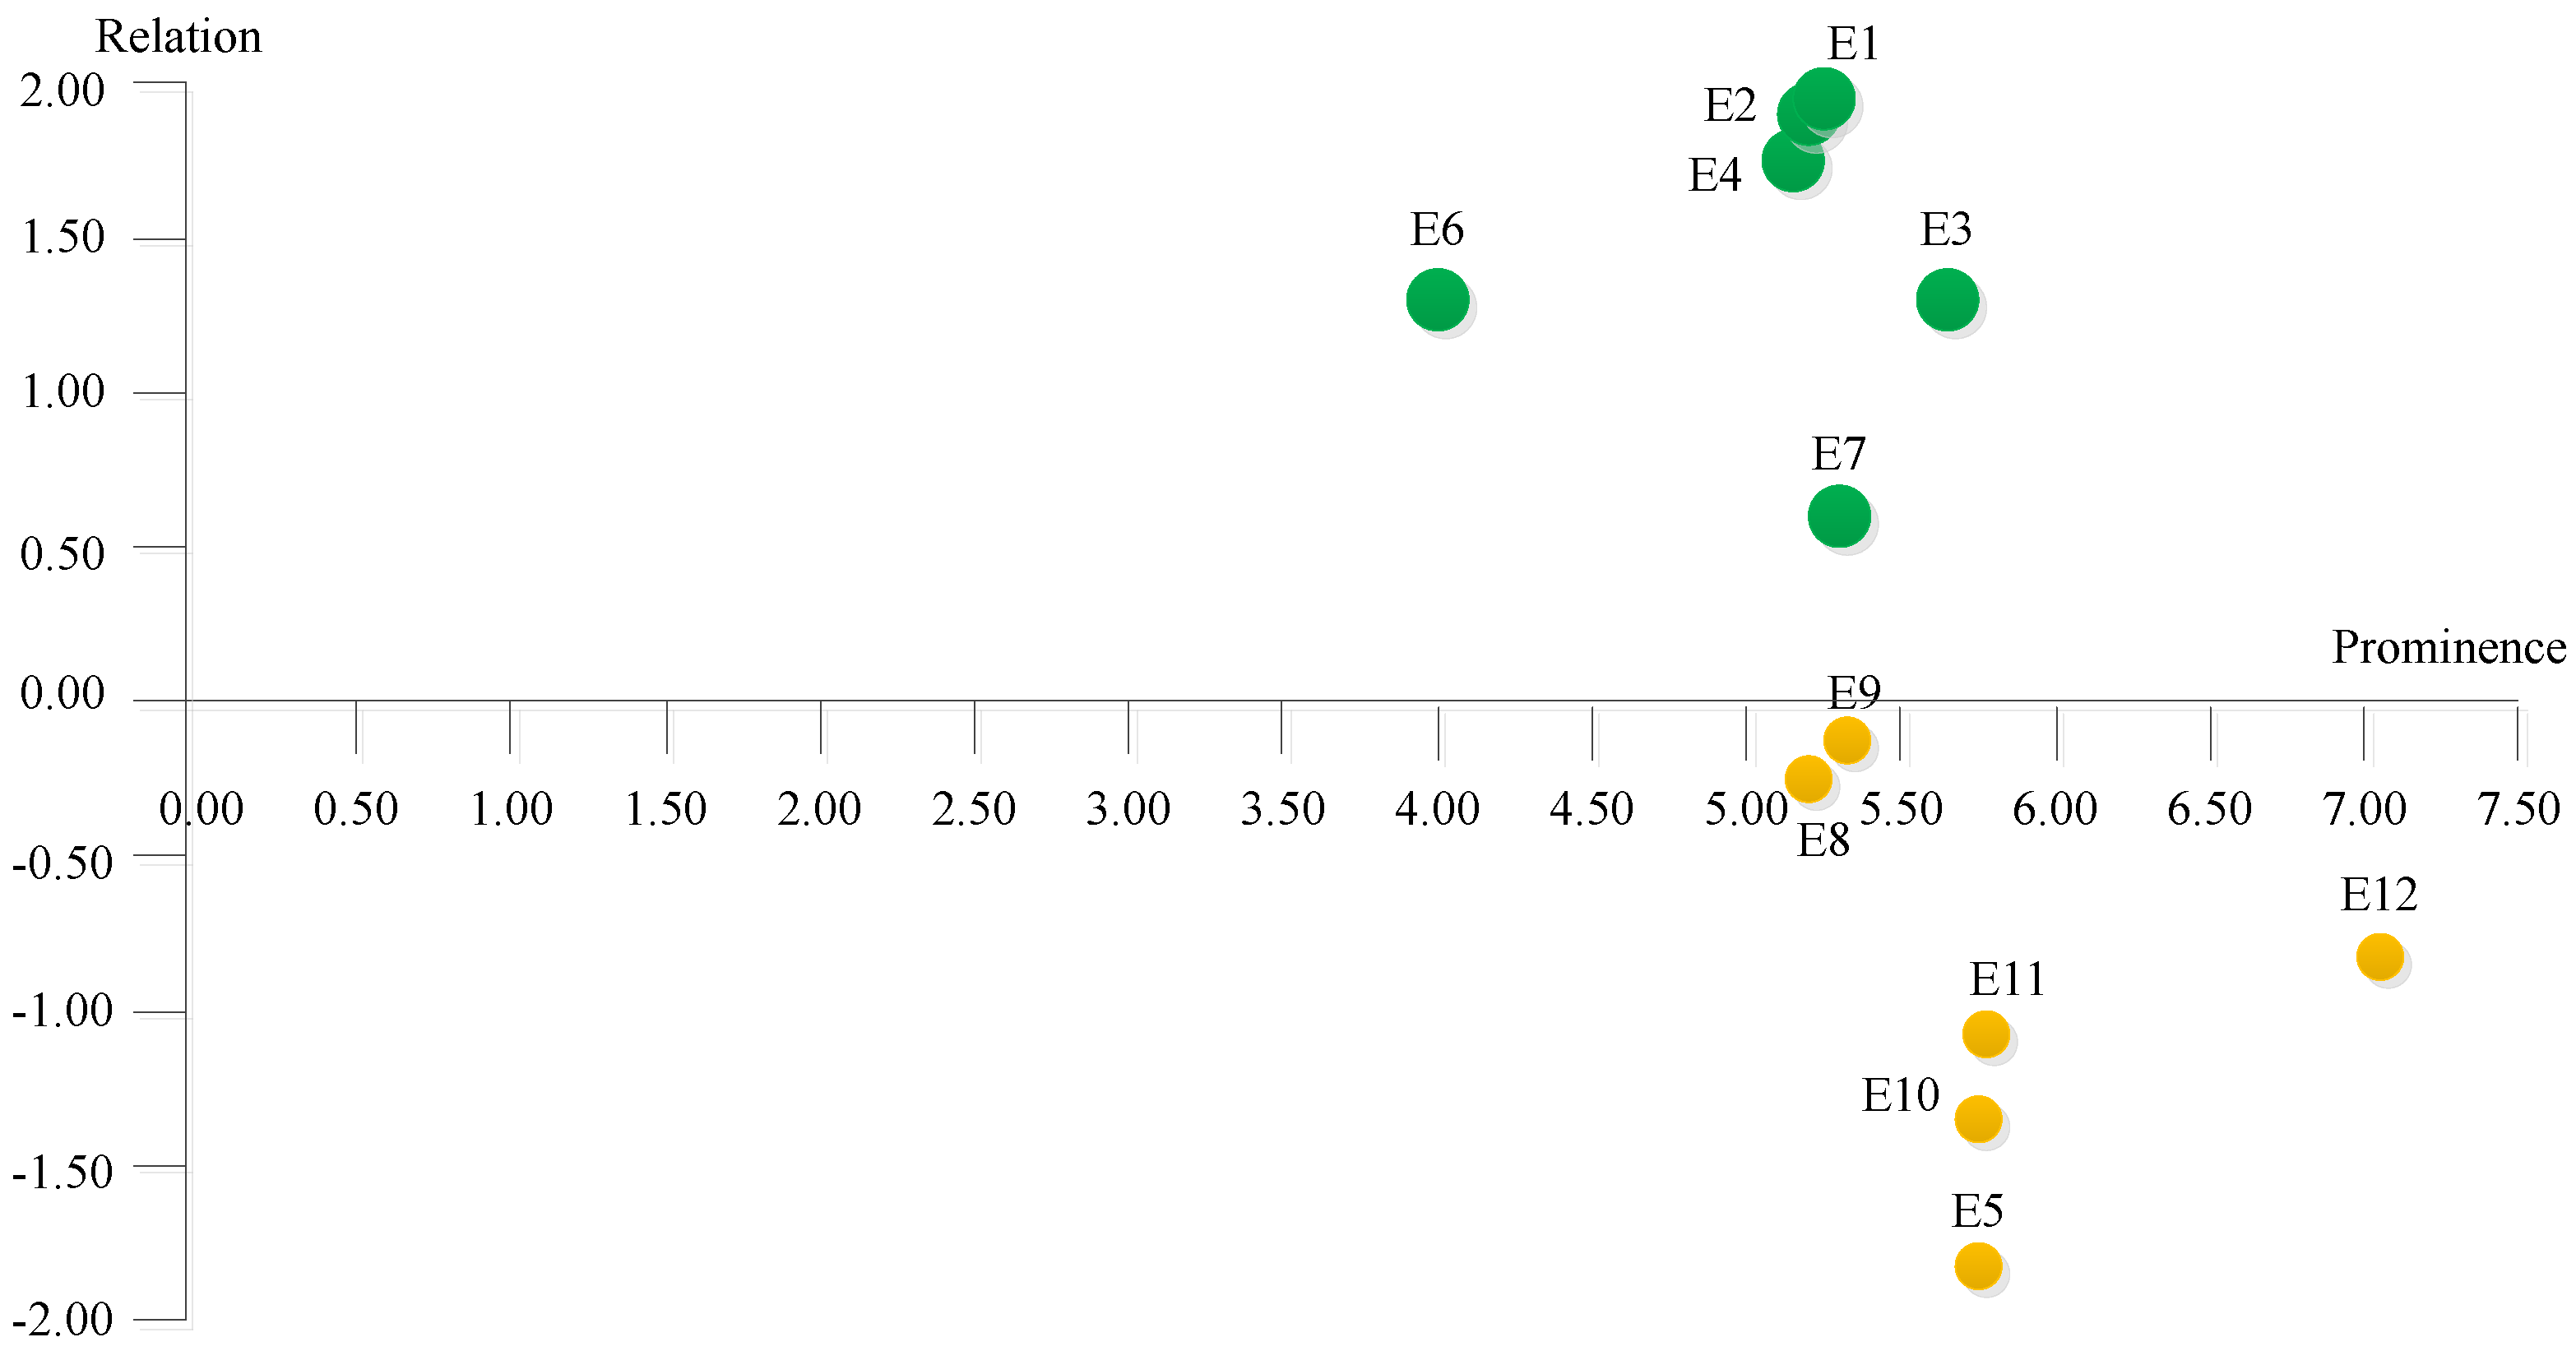
Figure 3.
The interaction map of ECMS enablers. Note: Green squares in Figure 3 represent the cause group, orange squares represent the effect group; the size of squares represents the degree of importance of the factors; the size of lines denotes the relation intensity of the connected enablers.
Figure 3.
The interaction map of ECMS enablers. Note: Green squares in Figure 3 represent the cause group, orange squares represent the effect group; the size of squares represents the degree of importance of the factors; the size of lines denotes the relation intensity of the connected enablers.
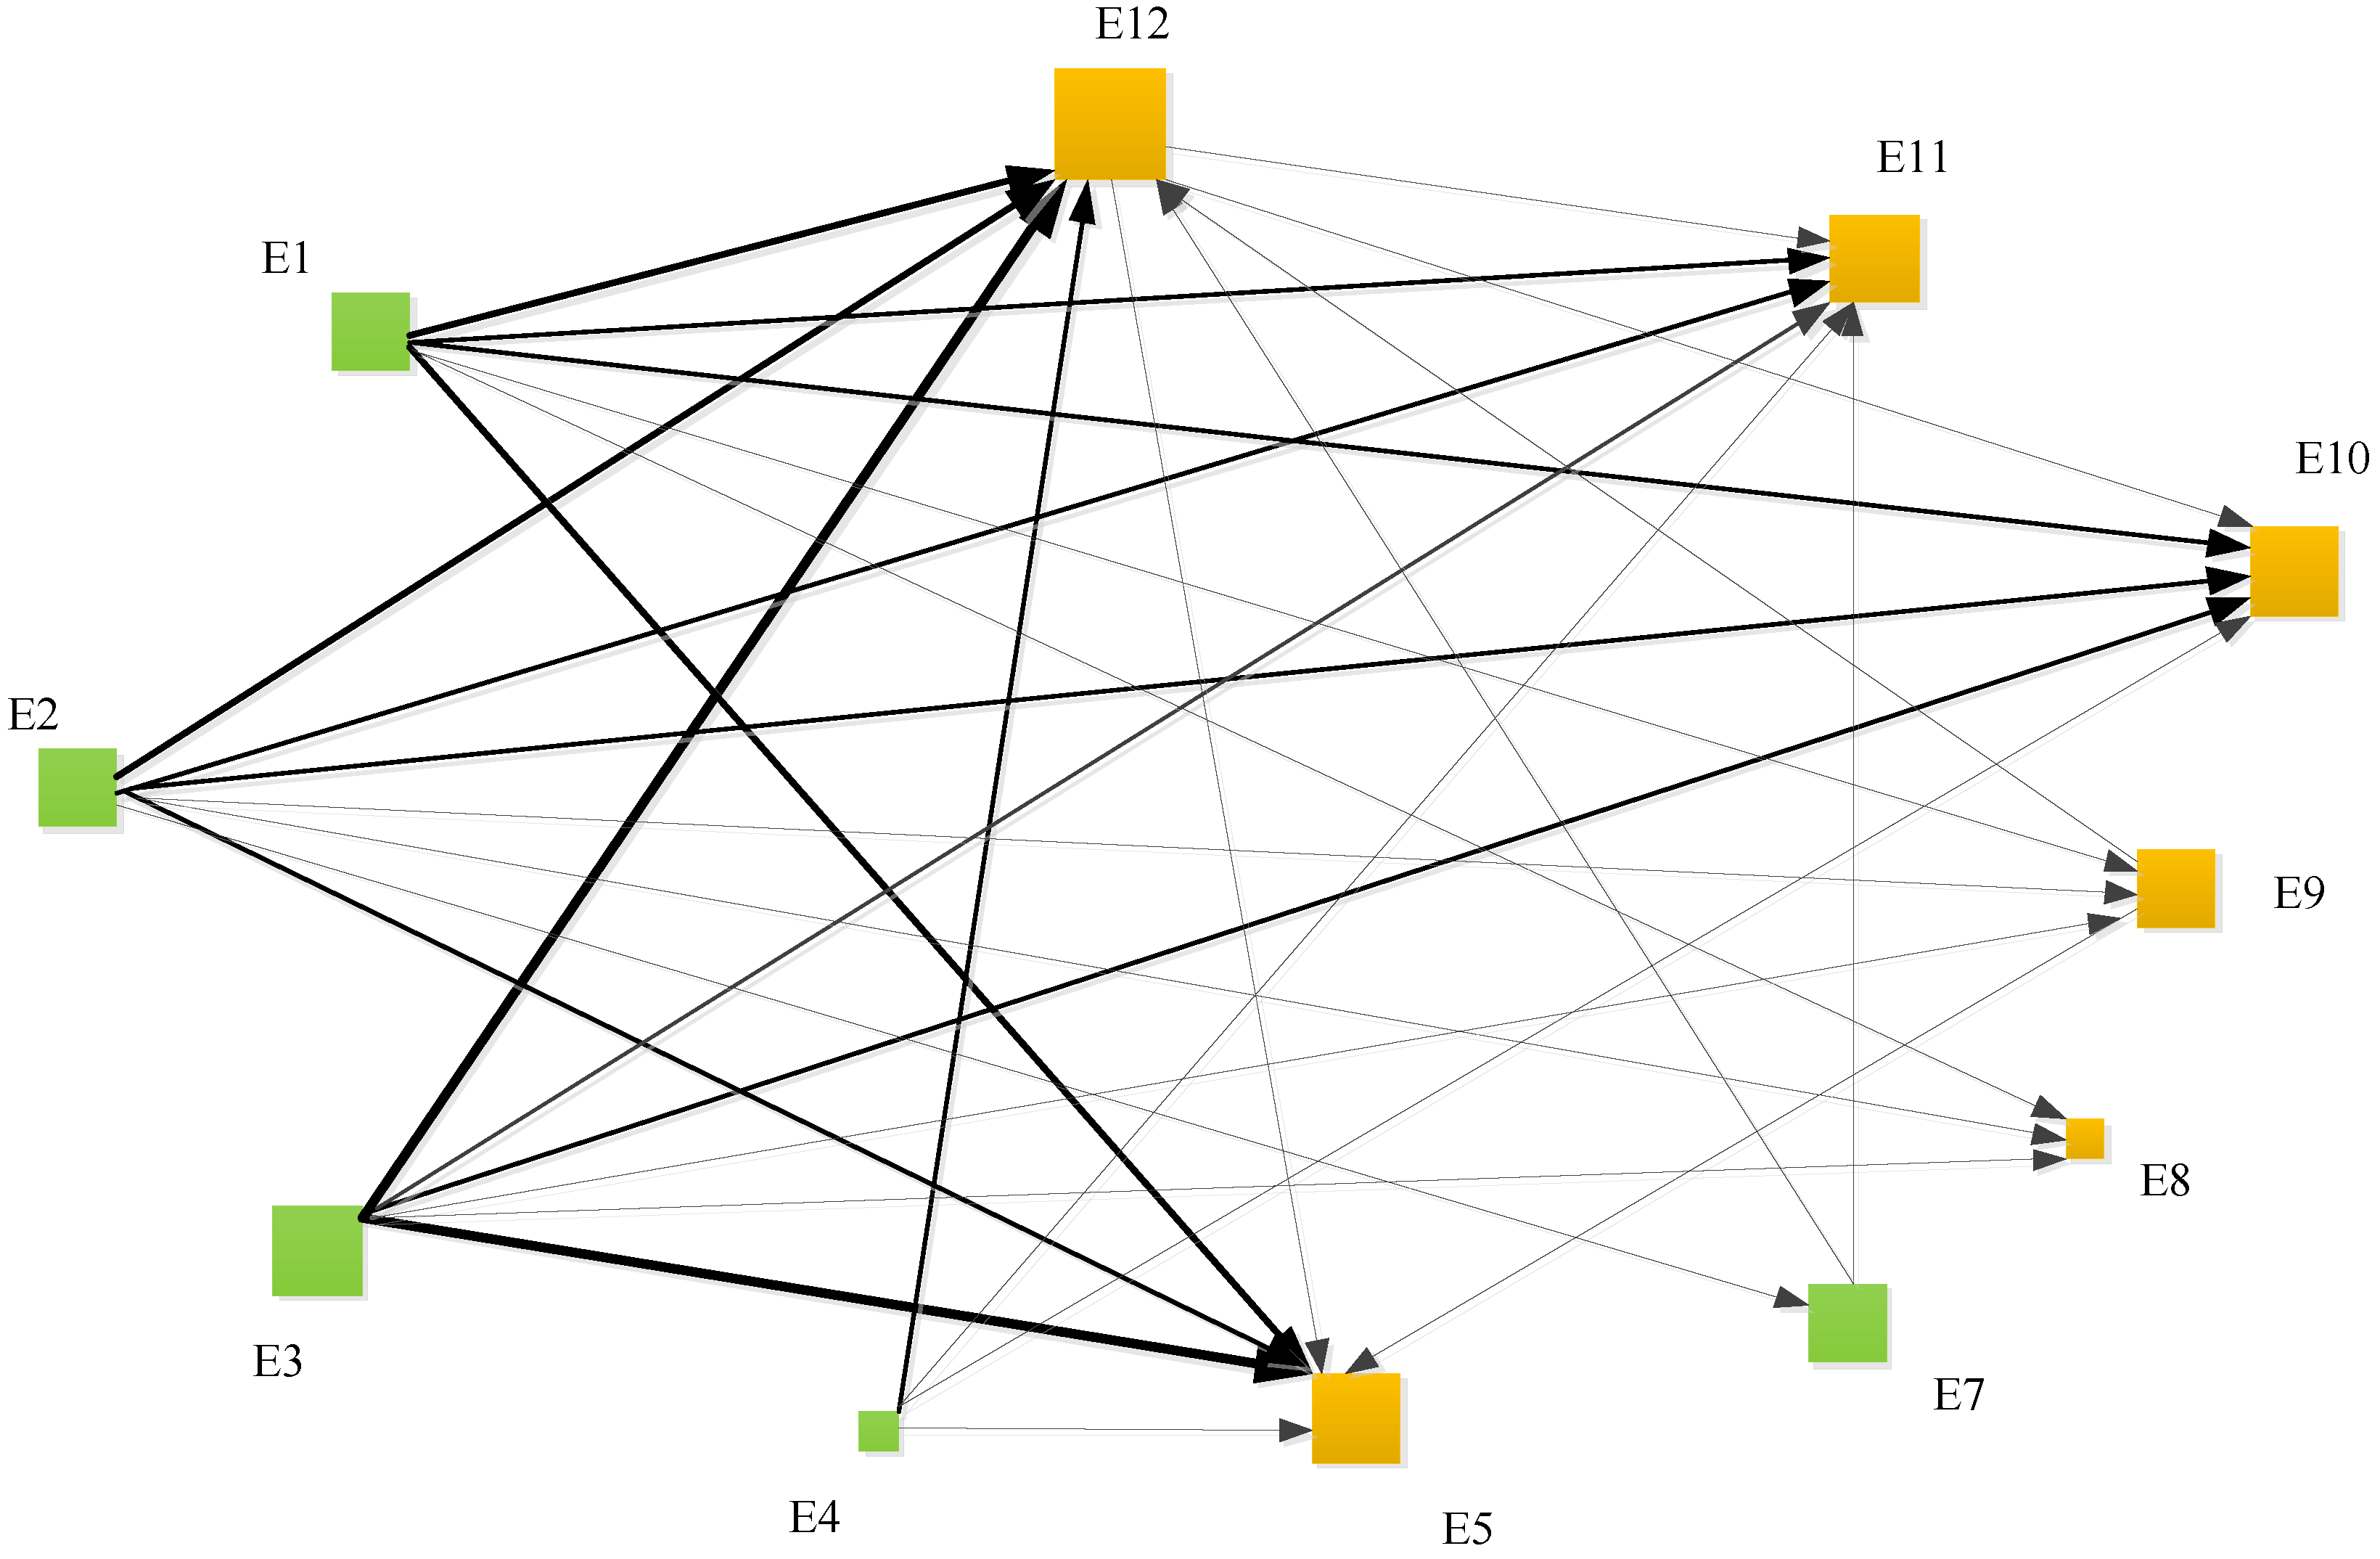
Figure 4.
Comparative ranking of enablers.
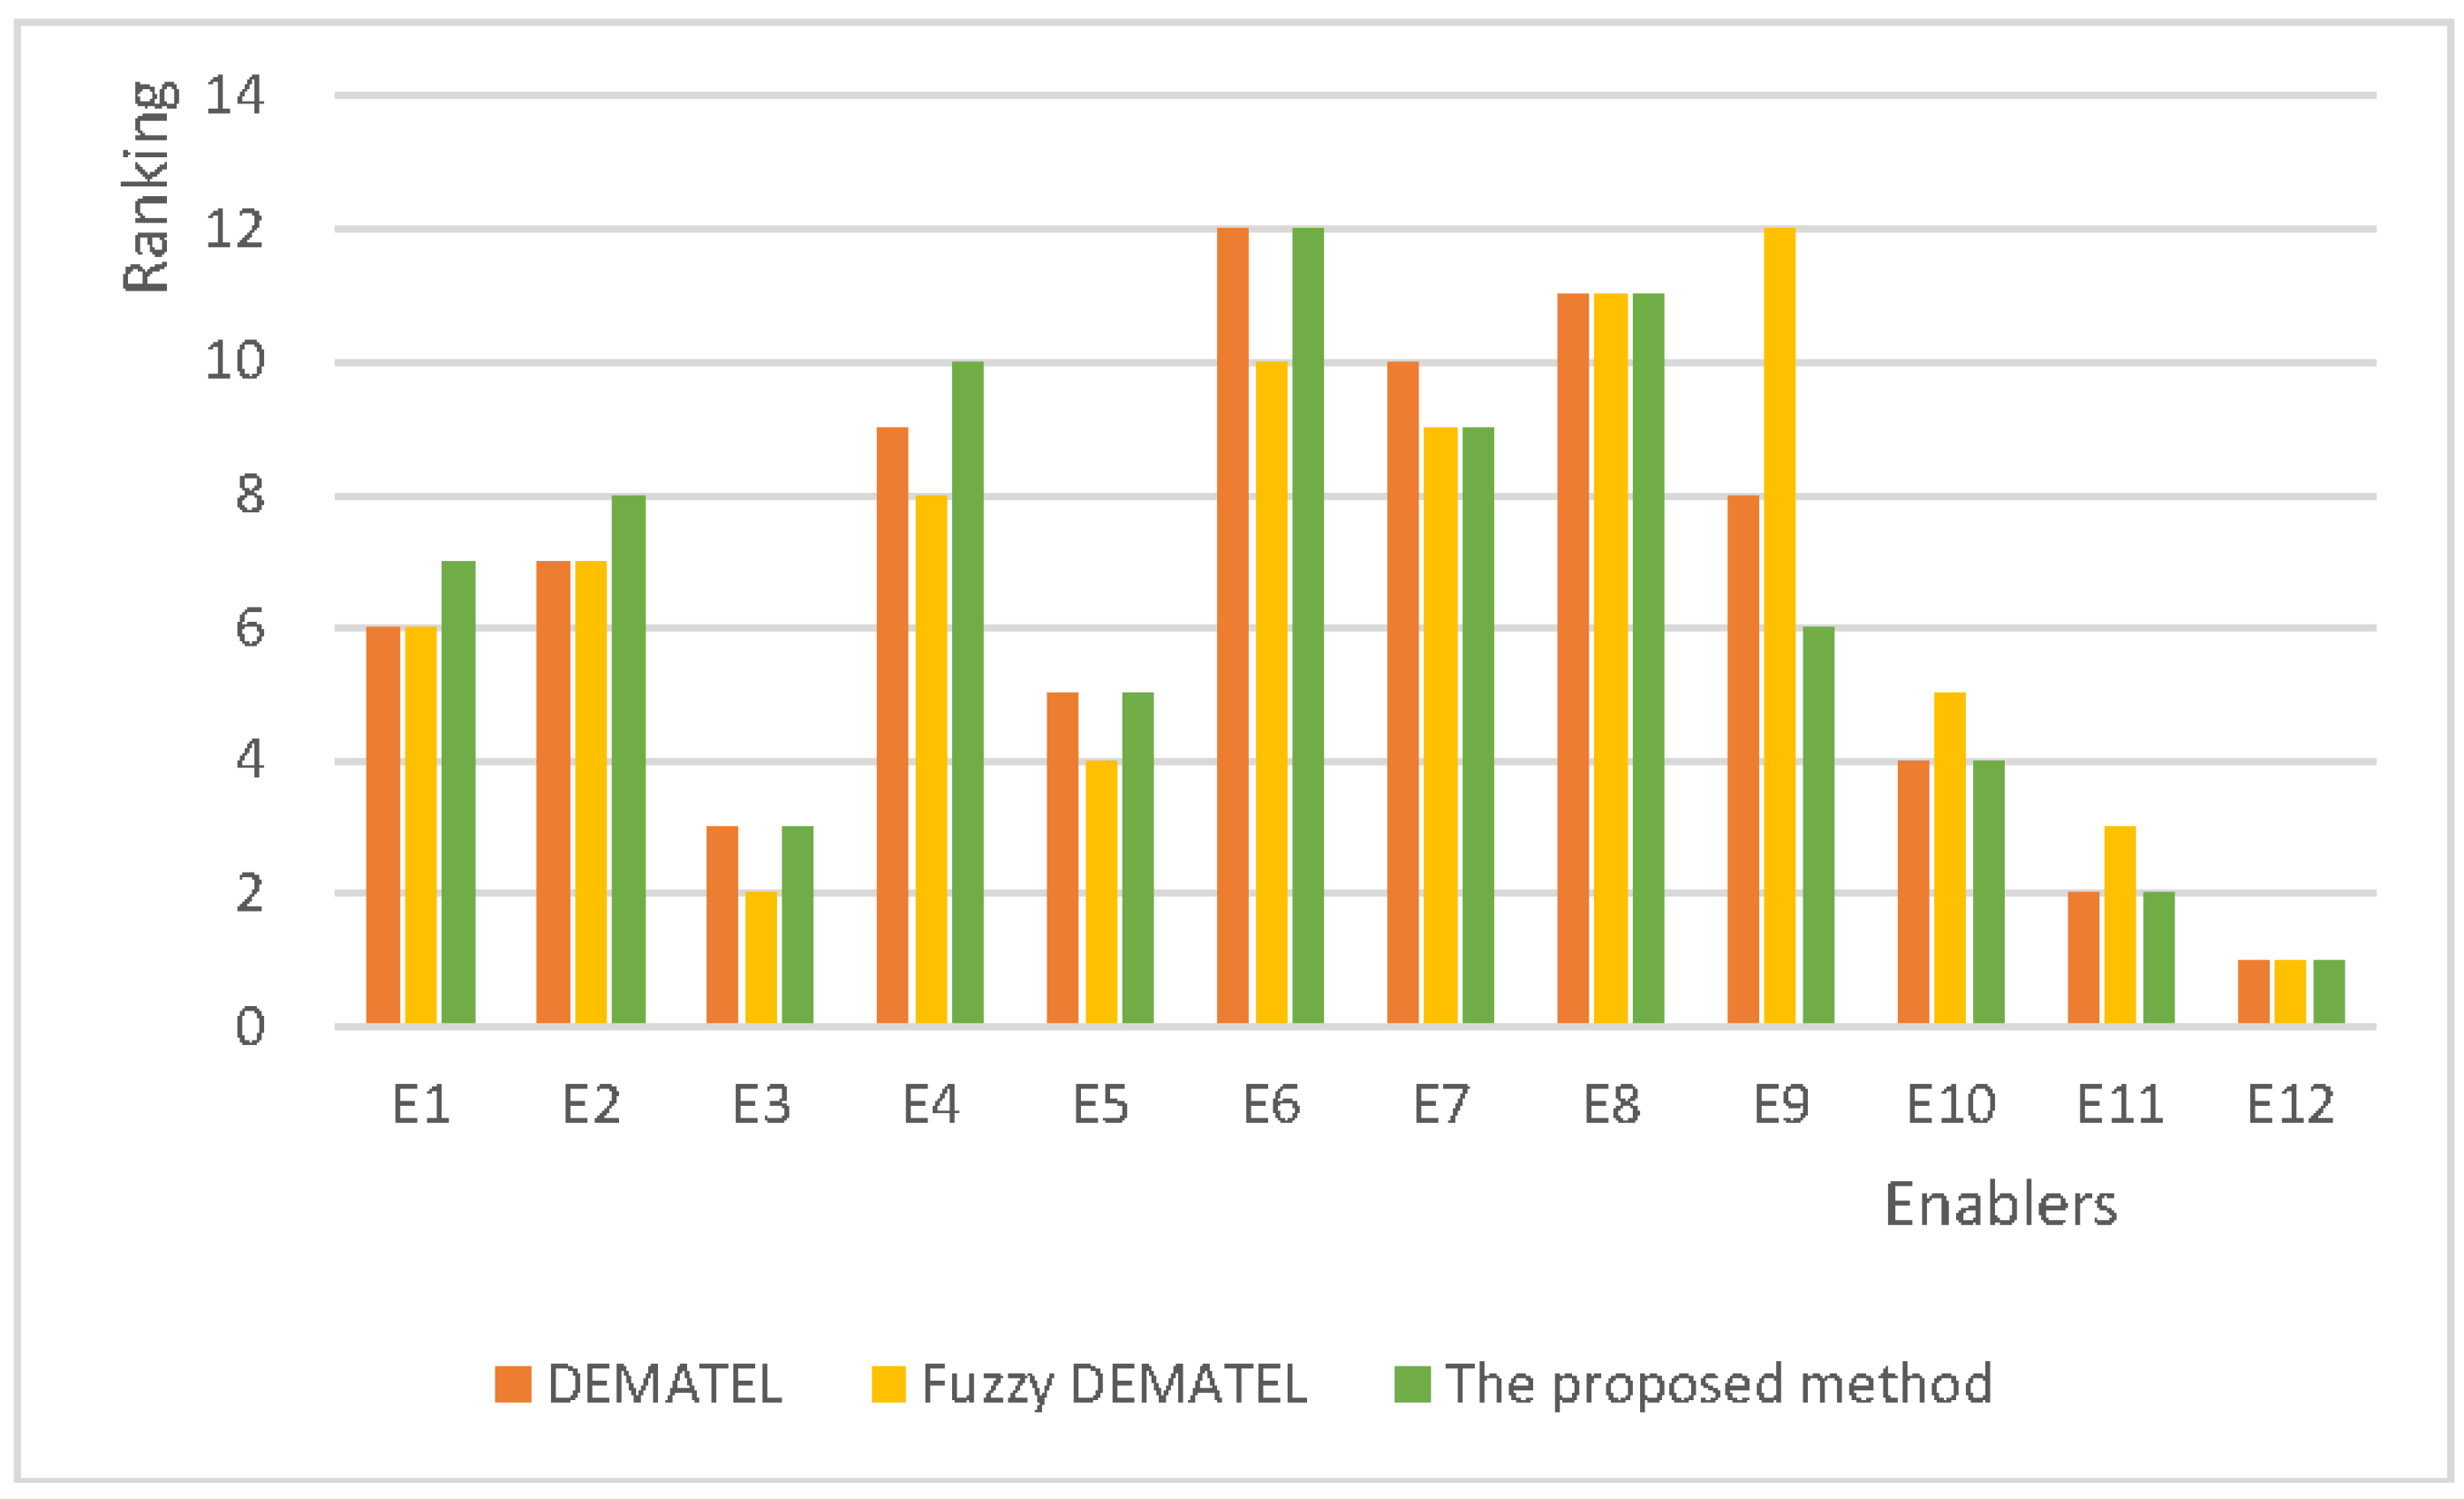
Figure 5.
Comparative of the top six crucial relations according to different methods. Note: Green squares in Figure 5 represent the cause group; orange squares represent the effect group.
Figure 5.
Comparative of the top six crucial relations according to different methods. Note: Green squares in Figure 5 represent the cause group; orange squares represent the effect group.


Table 1.
Enablers of environmentally conscious manufacturing strategy (ECMS).
| Enablers | Description |
|---|---|
| Economic Enablers | |
| Environmental protection equipment [13,14] | Improve environmental protection equipment (by installing flue gas desulphurization equipment in a power station or a wastewater-treatment plant in a factory or adding catalytic converters for cars) to increase resource efficiency and avoid environmental pollution. |
| Environmental design technology [12,15] | Technologies that limit or reduce the negative effects of products or services on the natural environment in the early design and development phase, such as eco-design technology, life-cycle design technology, and design for environment, etc. |
| Environmental protection willingness [8,16] | The attitude towards a cleaner environment and the commitment and willingness to force changes for a better environment and a better quality of life. |
| Managerial support [17,18] | Managers should fully understand and ensure that they have the capability and/or means of overcoming each challenge before engaging their firms in the complex process of remanufacturing. |
| Company image [19,20] | Reputation plays a vital role in any firm’s growth, so it is mandatory to implement green manufacturing. |
| Environmental protection expenditure [21,22] | Total corporate environmental costs are waste disposal and emission treatment, environmental management and pollution prevention, including the cost of wasted materials and the cost of capital and labor waste. |
| Environmental Enablers | |
| Resource efficiency [23,24] | Manufacturing processes should be designed to minimize energy and resource consumption. |
| Emission of air pollutants [25,26] | Emission of air pollutants includes flue gas (gas exiting to the atmosphere via a flue), exhaust gas (flue gas generated by fuel combustion), and the emission of greenhouse gases that absorb and emit radiation in the thermal infrared range. |
| Solid waste [27,28] | Manufacturing processes should be designed to minimize the generation of solid wastes (mining waste rock, smelting waste, etc.). |
| Social Enablers | |
| Employee’s health [29,30] | Enterprises adopt environmental practices to improve employee health and safety as a societal cause. |
| Living environment [31,32] | The waste products created cause excessive damage to our living environment. |
| Corporate social responsibility (CSR) motivation [33,34] | CSR motivation includes instrumental motives (managers engage in CSR to maximize profits), relational motives (managers participate in CSR to build, maintain, and restore legitimacy), and moral motive (managers aim at a higher level for the benefit of humanity). |
Table 2.
Evaluation criteria of the relationship between enablers.
| Linguistic Terms | Corresponding Scores |
|---|---|
| No influence (NI) | 0 |
| Low influence (LI) | 1 |
| Medium influence (MI) | 2 |
| High influence (HI) | 3 |
| Very high influence (VHI) | 4 |
Table 3.
The scores of the direct relations between ECMS enablers.
| Enablers | E1 | E2 | E12 | |
|---|---|---|---|---|
| E1 | {0,0,0,0,0,0,0,0,0,0,0,0} | {3,0,2,1,3,4,4,3,4,4,0,3} | {3,3,4,2,2,3,4,4,4,0,3,4} | |
| E2 | {1,0,3,3,2,3,4,1,4,3,0,3} | {0,0,0,0,0,0,0,0,0,0,0,0} | {3,3,4,2,2,3,4,4,4,0,3,4} | |
| E3 | {3,3,2,3,1,3,4,4,4,0,3,1} | {3,3,3,1,1,3,4,2,4,0,3,0} | {4,4,4,4,4,3,4,4,4,4,3,4} | |
| E4 | {3,1,4,2,3,2,4,3,4,3,3,3} | {3,1,4,3,3,2,4,3,4,4,3,3} | {4,3,4,2,3,2,4,2,4,4,2,3} | |
| E5 | {1,0,3,3,2,4,0,0,0,0,1,0} | {1,2,2,2,2,0,0,0,0,0,1,0} | {3,0,1,4,2,3,4,2,4,0,3,1} | |
| E6 | {3,3,4,3,3,2,3,2,4,3,3,3} | {3,0,3,1,2,4,3,1,4,4,3,3} | {2,3,2,2,4,3,0,0,4,1,0,3} | |
| E7 | {1,0,2,2,1,2,3,0,0,0,0,2} | {3,0,3,1,1,3,3,0,2,0,2,2} | {3,3,4,4,3,4,4,4,4,1,3,3} | |
| E8 | {1,0,1,2,2,0,0,0,0,0,0,0} | {1,0,4,2,1,0,0,0,0,0,0,0} | {4,3,4,4,3,4,4,4,4,0,3,4} | |
| E9 | {1,0,1,3,3,0,0,0,0,0,0,0} | {1,0,4,2,2,0,0,0,0,0,0,0} | {4,4,4,4,3,4,4,4,4,4,3,4} | |
| E10 | {1,0,3,3,2,0,0,0,0,0,0,0} | {1,0,3,1,2,0,0,0,0,0,0,0} | {4,3,4,4,4,4,4,4,4,4,3,4} | |
| E11 | {1,0,3,3,3,0,0,0,0,0,0,0} | {1,0,3,2,3,0,0,0,0,0,0,0} | {4,3,4,4,4,4,4,4,4,4,3,4} | |
| E12 | {3,3,2,3,2,0,4,3,4,0,4,0} | {1,3,2,1,2,4,4,3,0,0,4,1} | {0,0,0,0,0,0,0,0,0,0,0,0} |
Note: (0 = No influence, 1 = Low influence, 2 = Medium influence, 3 = High influence, 4 = Very influence). Only partial data is provided due to limited space.
Table 4.
The final evaluation result of the 12th expert.
| Enablers | E1 | E2 | E3 | E4 | E5 | E6 | E7 | E8 | E9 | E10 | E11 | E12 |
|---|---|---|---|---|---|---|---|---|---|---|---|---|
| E1 | 0 | 3 | 3 | 0 | 3 | 4 | 3 | 4 | 4 | 3 | 3 | 4 |
| E2 | 3 | 0 | 3 | 0 | 3 | 4 | 3 | 4 | 4 | 3 | 3 | 4 |
| E3 | 1 | 0 | 0 | 0 | 4 | 1 | 1 | 3 | 3 | 4 | 3 | 4 |
| E4 | 3 | 3 | 2 | 0 | 1 | 2 | 3 | 2 | 2 | 2 | 2 | 3 |
| E5 | 0 | 0 | 1 | 3 | 0 | 1 | 1 | 0 | 0 | 0 | 2 | 1 |
| E6 | 3 | 3 | 2 | 3 | 2 | 0 | 2 | 2 | 2 | 1 | 2 | 3 |
| E7 | 2 | 2 | 4 | 0 | 2 | 3 | 0 | 3 | 3 | 3 | 3 | 3 |
| E8 | 0 | 0 | 0 | 0 | 4 | 0 | 1 | 0 | 2 | 4 | 4 | 4 |
| E9 | 0 | 0 | 0 | 0 | 4 | 0 | 1 | 3 | 0 | 4 | 4 | 4 |
| E10 | 0 | 0 | 0 | 0 | 4 | 0 | 0 | 0 | 0 | 0 | 4 | 4 |
| E11 | 0 | 0 | 0 | 0 | 4 | 0 | 0 | 0 | 0 | 4 | 0 | 4 |
| E12 | 0 | 1 | 0 | 1 | 4 | 0 | 0 | 0 | 0 | 3 | 1 | 0 |
Note: Only partial data is provided due to limited space.
Table 5.
The group direct-relation matrix.
| Enablers | E1 | E2 | E3 | E4 | E12 | |
|---|---|---|---|---|---|---|
| E1 | [0.000,0.000] | [1.576,3.467] | [1.553,3.520] | [0.444,1.667] | [2.234,3.647] | |
| E2 | [1.317,3.121] | [0.000,0.000] | [1.793,3.585] | [0.461,1.378] | [2.234,3.647] | |
| E3 | [1.720,2.949] | [1.317,3.121] | [0.000,0.000] | [0.491,1.931] | [3.694,3.972] | |
| E4 | [2.368,3.425] | [2.549,3.563] | [3.142,3.837] | [0.000,0.000] | [2.559,3.601] | |
| E5 | [0.327,2.111] | [0.319,1.361] | [0.658,2.722] | [0.928,2.789] | [1.229,3.221] | |
| E6 | [2.700,3.300] | [1.720,3.360] | [1.872,3.128] | [1.581,2.875] | [1.004,2.958] | |
| E7 | [0.441,1.744] | [0.872,2.430] | [1.001,2.859] | [0.828,2.185] | [2.861,3.755] | |
| E8 | [0.117,0.917] | [0.119,1.361] | [0.360,2.053] | [0.559,1.601] | [2.840,3.883] | |
| E9 | [0.144,1.278] | [0.148,1.465] | [0.246,1.676] | [0.399,1.441] | [3.694,3.972] | |
| E10 | [0.159,1.410] | [0.112,1.139] | [0.238,1.867] | [0.734,2.479] | [3.694,3.972] | |
| E11 | [0.218,1.514] | [0.159,1.410] | [0.238,1.867] | [0.723,2.333] | [3.694,3.972] | |
| E12 | [1.309,3.245] | [1.078,3.096] | [1.229,3.188] | [2.229,3.248] | [0.000,0.000] |
Note: Only partial data is provided due to limited space.
Table 6.
The total-relation matrix.
| Enablers | E1 | E2 | E3 | E4 | E12 | |
|---|---|---|---|---|---|---|
| E1 | [0.019,0.302] | [0.058,0.390] | [0.062,0.448] | [0.037,0.347] | [0.134,0.580] | |
| E2 | [0.053,0.375] | [0.018,0.304] | [0.069,0.446] | [0.038,0.338] | [0.136,0.576] | |
| E3 | [0.062,0.360] | [0.051,0.368] | [0.023,0.347] | [0.039,0.341] | [0.167,0.567] | |
| E4 | [0.082,0.377] | [0.085,0.385] | [0.105,0.445] | [0.024,0.295] | [0.138,0.563] | |
| E5 | [0.016,0.256] | [0.015,0.242] | [0.025,0.310] | [0.031,0.273] | [0.051,0.406] | |
| E6 | [0.085,0.329] | [0.060,0.336] | [0.067,0.375] | [0.055,0.318] | [0.072,0.473] | |
| E7 | [0.027,0.307] | [0.036,0.326] | [0.043,0.385] | [0.041,0.320] | [0.129,0.519] | |
| E8 | [0.014,0.252] | [0.013,0.264] | [0.023,0.324] | [0.032,0.273] | [0.116,0.465] | |
| E9 | [0.016,0.265] | [0.015,0.272] | [0.021,0.322] | [0.031,0.275] | [0.144,0.476] | |
| E10 | [0.014,0.246] | [0.012,0.242] | [0.018,0.299] | [0.033,0.275] | [0.122,0.435] | |
| E11 | [0.017,0.255] | [0.014,0.254] | [0.019,0.306] | [0.035,0.278] | [0.128,0.445] | |
| E12 | [0.049,0.354] | [0.043,0.354] | [0.051,0.408] | [0.074,0.356] | [0.054,0.448] |
Note: Only partial data is provided due to limited space.
Table 7.
The sum of rows, the sum of columns, “Prominence” and “Relation”.
| Enablers | Ranking | ||||||
|---|---|---|---|---|---|---|---|
| E1 | [1.114,5.528] | 3.676 | [0.454,3.678] | 1.695 | 5.371 | 1.980 | 7 |
| E2 | [1.138,5.482] | 3.660 | [0.421,3.737] | 1.707 | 5.367 | 1.953 | 8 |
| E3 | [1.105,5.298] | 3.513 | [0.527,4.415] | 2.219 | 5.732 | 1.294 | 3 |
| E4 | [1.076,5.353] | 3.532 | [0.469,3.689] | 1.714 | 5.245 | 1.818 | 10 |
| E5 | [0.303,3.686] | 1.958 | [1.390,5.676] | 3.721 | 5.679 | −1.763 | 5 |
| E6 | [0.682,4.505] | 2.714 | [0.235,3.423] | 1.376 | 4.090 | 1.338 | 12 |
| E7 | [0.833,4.811] | 3.011 | [0.613,4.524] | 2.355 | 5.366 | 0.656 | 9 |
| E8 | [0.662,4.174] | 2.495 | [0.834,4.827] | 2.722 | 5.217 | −0.228 | 11 |
| E9 | [0.769,4.280] | 2.632 | [0.841,4.878] | 2.762 | 5.394 | −0.130 | 6 |
| E10 | [0.496,3.824] | 2.173 | [1.202,5.580] | 3.520 | 5.693 | −1.347 | 4 |
| E11 | [0.568,3.936] | 2.288 | [1.176,5.522] | 3.460 | 5.747 | −1.172 | 2 |
| E12 | [0.806,5.025] | 3.134 | [1.390,5.952] | 3.928 | 7.062 | −0.794 | 1 |
Table 8.
Comparison of the ranking results for enablers.
| Successive Factor | DEMATEL | Fuzzy DEMATEL | Proposed Method | |||
|---|---|---|---|---|---|---|
| Ranking | Pi | Ranking | Pi | Ranking | ||
| E1 | 6.123 | 6 | 3.835 | 6 | 5.371 | 7 |
| E2 | 6.081 | 7 | 3.820 | 7 | 5.367 | 8 |
| E3 | 6.419 | 3 | 4.064 | 2 | 5.732 | 3 |
| E4 | 6.035 | 9 | 3.803 | 8 | 5.245 | 10 |
| E5 | 6.357 | 5 | 4.005 | 4 | 5.679 | 5 |
| E6 | 4.660 | 12 | 2.624 | 10 | 4.090 | 12 |
| E7 | 5.972 | 10 | 3.681 | 9 | 5.366 | 9 |
| E8 | 5.849 | 11 | 3.535 | 11 | 5.217 | 11 |
| E9 | 6.070 | 8 | 3.695 | 12 | 5.394 | 6 |
| E10 | 6.359 | 4 | 3.957 | 5 | 5.693 | 4 |
| E11 | 6.421 | 2 | 4.012 | 3 | 5.747 | 2 |
| E12 | 7.787 | 1 | 5.207 | 1 | 7.062 | 1 |
Table 9.
Differences between the proposed method and others.
| Methods | Consideration of Risk Factor Influence | Cause and Effect Analysis | Manipulation of Uncertainty | Reliance on Much Prior Information | Flexibility |
|---|---|---|---|---|---|
| DEMATEL | Yes | Yes | No | No | Low |
| Fuzzy DEMATEL | Yes | Yes | Partial | Yes | Low |
| The proposed method | Yes | Yes | Yes | No | High |
© 2018 by the authors. Licensee MDPI, Basel, Switzerland. This article is an open access article distributed under the terms and conditions of the Creative Commons Attribution (CC BY) license (http://creativecommons.org/licenses/by/4.0/).
Share and Cite
MDPI and ACS Style
Ma, L.; Song, W.; Zhou, Y. Modeling Enablers of Environmentally Conscious Manufacturing Strategy: An Integrated Method. Sustainability 2018, 10, 2284. https://doi.org/10.3390/su10072284
AMA Style
Ma L, Song W, Zhou Y. Modeling Enablers of Environmentally Conscious Manufacturing Strategy: An Integrated Method. Sustainability. 2018; 10(7):2284. https://doi.org/10.3390/su10072284
Chicago/Turabian StyleMa, Lin, Wenyan Song, and Yanru Zhou. 2018. "Modeling Enablers of Environmentally Conscious Manufacturing Strategy: An Integrated Method" Sustainability 10, no. 7: 2284. https://doi.org/10.3390/su10072284
Note that from the first issue of 2016, this journal uses article numbers instead of page numbers. See further details here.