Article

Decarbonization Pathways for International Maritime Transport: A Model-Based Policy Impact Assessment

International Transport Forum/OECD, 2 rue André Pascal, 75775 Paris CEDEX 16, France
*
Author to whom correspondence should be addressed.
Sustainability 2018, 10(7), 2243; https://doi.org/10.3390/su10072243
Submission received: 1 May 2018 / Revised: 21 June 2018 / Accepted: 25 June 2018 / Published: 29 June 2018
(This article belongs to the Special Issue Sustainable Freight Transport)

Abstract

:
International shipping has finally set a target to reduce its CO2 emission by at least 50% by 2050. Despite this positive progress, this target is still not sufficient to reach Paris Agreement goals since CO2 emissions from international shipping could reach 17% of global emissions by 2050 if no measures are taken. A key factor that hampers the achievement of Paris goals is the knowledge gap in terms of what level of decarbonization it is possible to achieve using all the available technologies. This paper examines the technical possibility of achieving the 1.5° goal of the Paris Agreement and the required supporting policy measures. We project the transport demand for 6 ship types (dry bulk, container, oil tanker, gas, wet product and chemical, and general cargo) based on the Organization for Economic Co-operation and Development’s (OECD’s) global trade projection of 25 commodities. Subsequently, we test the impact of mitigation measures on CO2 emissions until 2035 using an international freight transport and emission model. We present four possible decarbonization pathways which combine all the technologies available today. We found that an 82–95% reduction in CO2 emissions could be possible by 2035. Finally, we examine the barriers and the relevant policy measures to advance the decarbonization of international maritime transport.

1. Introduction

International maritime transport has been the main mode of transport for global trade over the past century and one of the cornerstones of globalization. There have been significant improvements in the efficiency of international shipping in the past couple of decades. Ever since the industry introduced containerization and ultra-large container vessels, the unit cost of maritime transport has declined substantially due to the major improvement in economies of scale.
The Paris Climate Agreement of 2015, which, by far, has been the most successful agreement in advancing global commitments to reduce CO2 emissions, does not include any targets for the shipping sector. The political dynamics that are shaped by differing interests in the shipping industry have left it to be the last sector to establish any CO2 reduction goals. Recognizing the international character of the sector and the diverse regulatory challenges for different countries, governments expect the International Maritime Organization (IMO) to lead the advancement in decarbonizing the sector. Without a contribution from the shipping sector, the goals of the Paris Agreement in limiting the rise in global temperature to 1.5 °C–2 °C will be under threat. Shipping currently contributes to approximately 2% of the total CO2 emissions, yet emissions from shipping are estimated to grow between 50 and 250% by 2050 [1], which would potentially increase shipping’s emissions to up to 17% of the total greenhouse gas (GHG) emissions if no measures are taken [2].
Decarbonization of international shipping has progressed rather slowly due to fragmented and diverse ambitions and interests of stakeholders in the sector. Until recently, debates at the IMO were characterized by major disagreement as to how and whether the sector should align to the goals of the Paris Agreement. The current IMO GHG reduction roadmap indicates a decision-making process that is sluggish in implementing the necessary measures and regulations [3]. An important milestone of the roadmap is the adoption of a strategy to reduce GHG emissions, including a level of ambition and candidate short-, medium-, and long-term measures, which were announced at the 72nd IMO Marine Environment Protection Committee (MEPC) meeting in April 2018. The strategy mandates a reduction in total annual GHG emissions from shipping by at least 50% by 2050 compared to the 2008 level while pursuing efforts towards phasing them out entirely. The strategy also includes a reference to “a pathway of CO2 emissions reduction consistent with the Paris Agreement temperature goals”. The initial strategy will be revised in 2023 and reviewed again 5 years thereafter.
Without a concrete, ambitious, and enforceable target, there will be little incentive for the industry to invest in low-carbon technologies on a sufficient scale. We argue that one reason for this is the high risks and uncertainties associated with investments in the generally more costly low-carbon technologies. These policy uncertainties could, hence, also stifle innovation in low-carbon technologies and fuels. One of the key factors that has hampered progress in defining an ambitious target is the lack of thorough studies that assess the technical possibility of decarbonizing international maritime transport, especially according to the more ambitious goal of the Paris Agreement—i.e., the 1.5 °C temperature limit.
Most of the previous studies focus on above-1.5 °C scenarios, such as in [4,5,6], with a longer decarbonization time horizon up to 2050. A notable exception is in [7] which also includes a 1.5 °C scenario in which shipping emissions are close to zero by 2035. Some studies focus on zero-carbon shipping in a shorter term, but only for new ships. For example, a recent study by Lloyd’s Register assesses the requirements for a transition to zero-emission vessels by 2030 [8].
Moreover, there are also very few studies that assess the required policy measures to support the realization of the decarbonization target. An ambitious target will generally require massive and rapid changes, often involving capital investments that might not have clear prospects for profitability. This could bring considerable economical disruptions (i.e., loss of profit) to industry stakeholders, notably ship-owners, shipbuilders, shipping service providers, and national governments. Without appropriate national and supra-national policies that can provide strong incentives and mechanisms that favor the adoption of low-carbon technologies, ambitious targets and strict regulations might face strong resistance by relevant industry stakeholders. Therefore, it is important that any targets and mitigation measures that are imposed to the industry are accompanied by incentives and supporting policies if they are to be effective and widely accepted by the stakeholders.
This paper presents a systematic assessment of the technical feasibility of decarbonizing maritime transport by 2035, and its implications for the required supporting policy measures. Specifically, we study the possible decarbonization pathways that could conform to the 1.5 °C goal, where CO2 emissions would need to reach almost zero by 2035. This more ambitious goal is chosen since it would represent the most disruptive scale of adaptation by the industry, which also poses the biggest policy challenges. We establish a modeling framework that consists of international freight transport and emission models to study the impact of technological, operational, and alternative fuels measures on CO2 emissions. We project the transport demand for the global trade of 25 commodities based on the Organization for Economic Co-operation and Development’s (OECD’s) forecast and assign it to 6 major ship types that represent the global shipping fleets (dry bulk, container, oil tanker, gas, wet product and chemical, and general cargo). Next, we test the impact of technical, operational, alternative fuels, and market-based measures on CO2 emissions until 2035.
The contribution of this paper is twofold. First, it examines the possibility to decarbonize international maritime transport by 2035 using today’s technologies. Second, it provides recommendations to the policy-makers on the combination of measures and incentives that can help to achieve the decarbonization of the shipping sector. The remaining of this paper is structured as follows. In Section 2, we review the available emission reduction measures. Section 3 presents the model-based assessment of the CO2 reduction potential of the combination of different measures. In Section 4, we assess the barriers and market failures in decarbonizing international shipping. Section 5 highlights the implications for effective policy instruments. Finally, Section 6 concludes on the study’s results, as well as their market and policy implications.

2. Review of Technical and Market-Based Measures

This section gives an overview of possible measures to achieve decarbonization of shipping by 2035. We distinguish between three types of measures: technological measures, operational measures, and alternative fuels and energy (Table 1). We use the findings from existing research to inform our modelling of possible emission reductions. The respective emission reduction potentials presented in each of the subsections are assessed individually and cannot be cumulated without considering their possible interactions.

2.1. Technological Measures

Improving energy efficiency through technological measures is the aim of the global regulation of the energy efficiency of ships. This regulation requires ships built after 1 January 2013 to comply with a minimum energy efficiency level, the Energy Efficiency Design Index (EEDI) included in the International Convention for the Prevention of Pollution from Ships (MARPOL) Annex VI, which measures the CO2 emitted (g/tonne mile) based on ship design and engine performance data. The EEDI level is tightened incrementally every five years with an initial CO2 reduction level of 10% for the first phase (2015–2020), 20% for the second phase (2020–2025), and a 30% reduction mandated from 2025 to 2030.
There are various concerns related to the effectiveness of the EEDI. Since the EEDI regulation affects only newbuild ships, it takes time for the regulation to cover the global fleet. The average age of the shipping fleet is approximately 25 years, which means that the large majority of ships will be covered by EEDI only by 2040. Insofar as the EEDI acts as a target, it cannot be considered to be a very challenging target: the attained EEDIs of newbuild ships largely exceed the currently required EEDIs including Phase 3 requirements even though they are not mandatory before 2025—in particular, those of containerships and general cargo ships [9,10]. The attained scores often do not reflect the use of innovative electrical or mechanical technology, but they can be simply achieved through optimization of conventional machinery or through a change the hull design [10]. The impact of EEDI on emission reductions in shipping are estimated to be small: only a marginal difference has been found in CO2 emissions between EEDI and non-EEDI scenarios [7]. For the EEDI regulation to have a larger impact, the mandated reductions or reference years would need to become more ambitious.
Technological measures cover technologies applied to ships that help to increase their energy efficiency beyond EEDI. Covered by a large body of literature, measures listed in Table 2 are generally considered the major technological measures to increase the energy efficiency of ships. All of these technologies are available on the market, but not all options can be applied as a retrofit. It should be noted that the reduction potentials are variable throughout different ship types, weather or engine conditions, and operational profiles. Moreover, estimations from industry sources may be exceedingly optimistic and should be taken with caution.

2.2. Operational Measures

We cover four different operational measures: speed, ship size, ship–port interface, and onshore power (Table 3). Both slower speed and increase in ship size have contributed to a decrease in shipping emissions over the last years. The measure “ship–port interface” is related to a reduction in ship waiting time before entering a port. Ship size developments refer to ship capacity utilization. Shore power facilities are considered part of a larger set of port measures that could reduce emissions of ship operations.
A review of operational measures shows that slow steaming yields significant CO2 emission reductions, e.g., a speed reduction of 10% translates into an engine power reduction of 27% [19]. Lower speeds are more effective if design speeds of ships are brought down as well [22]. Drawbacks of these measures include the potential need for additional vessels to maintain service frequency, longer lead times, and the risk of modal shift of time-sensitive shipments to rail or road transport.
The largest vessels of all ship types emit less CO2 per tonne kilometer under conditions of full capacity utilization. CO2 emissions could be reduced by as much as 30% at a negative abatement cost by replacing the existing fleet with larger vessels, according to [23]. The relationship between ship size and emissions is not linear, but reflects a power-law relationship with diminishing marginal emission reductions as vessel size increases. However, as the newer (and more energy-efficient) ships are often larger ships, the size effect of larger ships could be overestimated [26].
Further reductions can be achieved by smoother ship–port interfaces and onshore power supply (cold-ironing). Approximately 5% of shipping’s CO2 emissions are currently generated in ports [27]. If improved ship–port interfaces reduced ship waiting times—and their use of auxiliary engines in ports—to zero, the carbon emission reductions might amount to approximately 1% of total shipping emissions [28]. Optimized voyage planning, collaboration, and real-time data exchange can further contribute to improved berth planning. Onshore power supply (OPS) facilities in ports allow ships to turn off their engines and connect to the electricity grid to serve auxiliary power demand. However, the use of OPS requires retrofits on the ship.

2.3. Alternative Fuels and Energy

Although a range of alternative fuels and energy have lower or zero ship emissions when used for ship propulsion, upstream emissions may arise in the production process. In Table 4, we cover a range of alternative fuels and energy sources. Not all of these options have reached market maturity yet.
The emission reduction potential of biofuels and synthetic fuels depends to a great extent on their production methods. Advanced biofuels from both the second and third generations could, in theory, reduce potential adverse social and environmental effects by using degraded land or residual biomass. Yet, more knowledge on their performance and physical properties, as well as more testing and standardization, would be required for broader use by the shipping industry [32]. Synthetic fuels can be produced via electrolysis powered by wind, hydro, or solar energy to avoid lifecycle emissions arising from production [30]. Production of synthetic fuels could hence easily develop where renewable energy sources are abundant or where they can produce a large excess output [6]. Although liquid natural gas has been shown to reduce CO2 emissions to some extent, some doubts persist regarding its overall environmental benefits vis-à-vis heavy fuel oil (HFO), considering its methane emissions [35]. Further emission reductions could be reaped by using hybrid systems involving fuel cells and batteries. The efficiency of fuel cells greatly depends on the fuel cell type and the fuel used [36]. All-electric propulsion is currently used in short-range passenger shipping (i.e., Norway) or short-range river transport (i.e., China or Netherlands). Hybrid electric systems may provide an interesting option for longer distances, yielding potential fuel savings of 10–40% and payback times as low as one [31]. In addition, wind power applications further decrease a ship’s fuel demand, combined either with other wind technologies, with slow steaming and other incremental efficiency improvements, or with photovoltaic technology [33,37]. Drawbacks include their potential interference with cargo handling. An extensive review of these measures and their potentials and disadvantages is included in [28].

2.4. Market-Based Measures

Currently, no market-based measure has been applied on an international level. As one of the first market-based solutions, the European Union (EU) implemented the world’s first emissions trading scheme (ETS) in 2005. Other comparable existing ETSs can be found in Australia, New Zealand, the United States (northeast states Regional Greenhouse Gas Initiative (RGGI)), California, Quebec, Japan, and a pilot in China [38]. Shanghai is so far the only pilot region that includes the aviation and port sectors in its ETS. The EU adopted a Monitoring, Reporting, and Verification (MRV) regulation for ships larger than 5000 gross tonnage calling at European Union ports and ports within the European Free Trade Area (EFTA), which entered into force in July 2015. Data collection started on 1 January 2018 on a per-voyage basis and is managed by the European Maritime Safety Agency (EMSA) [39]. In the case that there would be no global agreement at the International Maritime Organization (IMO) until 2023, the EU considered covering the shipping sector under an EU Maritime Climate Fund, to be set up under the ETS [40]. Contributions would be based on reported emissions under the MRV regulation and the ETS carbon price. The EU ETS approach shares a number of characteristics with other proposals at the IMO, namely, those of Norway, the UK, France, and Germany. A total carbon emissions ceiling would be coupled with monitoring of the real energy performance of ships. In an ETS covering the shipping and ports sector, stakeholders could gain or purchase quotas based on their emissions, and trade this quota within or outside the sector. Auction revenues generated from the sale of emission allowances would be used in a climate change fund supporting mitigation efforts. Beside emissions trading systems (ETS) or “cap and trade”, direct carbon taxes are also a form of carbon pricing. A carbon tax directly determines a price for carbon by setting a tax rate on GHG emissions [41].

3. Impact Assessment of CO2 Mitigation Measures

3.1. Framework to Assess the Impact of Mitigation Measures to Reduce Global Shipping Emissions

We estimate the future CO2 emission from international shipping using the International Transport Forum’s International freight model (IFM) and the “ASIF” (Activity, Structure, Intensity, Emission Factor) method [42].
The ITF’s International freight model is designed to project international freight transport activities (in tonne kilometers) for 19 commodities for all major transport modes and routes while taking into account different transport and economic policy measures (e.g., the development of new infrastructure networks, or the alleviation of trade barriers). The model is built on the four-steps freight transportation modelling approach and it takes the OECD trade projection as an input. The IFM is designed to be able to estimate the weight of commodities traded between countries, the choice between modes and transport routes used to transport these commodities based on transport networks characteristics, and relevant socio-economic variables such as transport costs and time. The model consists of the following components:
  • Trade flow disaggregation model;
  • Value-to-weight model;
  • Mode choice model; and
  • Route choice model.

3.1.1. OECD International Trade Model

The OECD’s trade projection is produced using a Computable General Equilibrium (CGE) model called the ENV-Linkages model [43]. The model is designed to estimate the dynamic evolution of international trade, in terms of both spatial patterns and commodity composition due to the changes in the global production and consumption of commodities. It is calibrated based on the macroeconomic trends of the OECD@100’s baseline scenario for the period 2013–2060 at sectorial and regional levels. As such, it projects international trade flows in values (US$) for 26 regions and 25 commodities until 2060.

3.1.2. Trade Disaggregation Model

The underlying trade projections are disaggregated into 26 world regions. This level of resolution does not allow estimating transport flows with precision as it does not allow a proper discretization of the travel path used for different types of products. Therefore, we disaggregate the regional origin–destination (OD) trade flows into a larger number of production/consumption centroids. These centroids were calculated using an adapted p-median procedure for all the cities around the world classified by United Nations in 2010 relative to their population (2539 cities). The objective function for this aggregation is based on the minimization of a distance function which includes two components: GDP density and geographical distance. The selection was also constrained by allowing one centroid within a 500 km radius in a country. This resulted in 333 centroids globally, with spatially balanced results also for all continents.
T o d k y = T V L k y G D P o y v = 1 V G D P k y G D P d y l = 1 L G D P l y
In Equation (1),
T o d k y = trade values from centroid o to centroid d in year y for commodity k,
T V L k y = trade values from origin region V to destination region L,
o, d = origin and destination centroids,
k = commodity k,
y = year of analysis,
k = centroid that belongs to the origin region V,
l = centroid that belongs to the destination region L.

3.1.3. Value-to-Weight Model

We used a Poisson regression model to estimate the rate of conversion of value units (dollars) into weight units of cargo (tonnes) by mode, calibrated using datasets from Eurostat and Economic Commission for Latin America and the Caribbean (ECLAC) data on value/weight ratios for different commodities.
We use the natural logarithm of the trade value in millions of dollars as the offset variable, with panel terms by commodity, a transport cost proxy variable (logsum calculation for maritime, road, rail, and air transport costs per ton between each pair of centroids), and geographical and cultural variables: binary variables for trade agreements and land borders used above and a binary variable identifying if two countries have the same official language. Moreover, economic profile variables were included to describe the trade relation between countries with different types of production sophistication and scale of trade intensity. We validate the output of the value-to-weight model using the UN Comtrade database that provides values and weights of all commodities traded between any countries worldwide. Table A1 provides validation of the total values and weights of global trade produced by the model.
w o d k y = T o d k y   e r s o d k y
r s o d k y = a + b 1   e g d p % o y + b 2   e g d p % d y + b 3   e g d p c % o y +   b 4   e g d p c % d y + b 5 ln ( g d p c o y g d p c d y ) +   b 6   c o n t i g o d +   b 7   l a n g o d + b 8   r t a o d + l g s k e l o g s u m ( c o s t o d )
In Equations (2) and (3),
w o d k y = weight of commodity k that is traded between origin o and destination d for year y (in tonnes),
T o d k y = value of trade for commodity k between origin o and destination d for year y (in US$),
r s o d k y = value-to-weight conversion factor for commodity k, between origin o and destination d for year y (in tonnes/US$),
g d p % o y = GDP percentile of origin in year y,
g d p % d y = GDP percentile of destination in year y,
g d p c % o y = GDP per capita percentile of origin in year y,
g d p c % d y = GDP per capita percentile of destination in year y,
ln ( g d p c o y g d p c d y ) = natural logarithm of the ratio between GDP per capita of origin and GDP per capita of destination in year y,
c o n t i g o d = land contiguity between origin o and destination d, contig = (0, 1),
langod = shared language between origin o and destination d, lang = (0, 1),
rtaod = trade agreement between origin o and destination d, rta = (0,1),
logsum(costod) = logsum variable of transport costs using different modes between origin o and destination d, d
lgsk = logsum coefficient/panel term for commodity k.

3.1.4. Mode Choice Model

The mode share model (in weight) for international freight flows assigns the transport mode used for trade between any origin–destination pair of centroids. The mode attributed to each trade connection represents the longest transport section. All freight will require intermodal transport both at the origin and destination. This domestic component of international freight is usually not accounted for in the literature, but is included in our model. The model is estimated using a standard multinomial logit estimator including commodity type panel terms on travel times and cost. Both Eurostat and ECLAC datasets are used as sources of observation data for the volume of commodities and its mode of transport. Transport costs and travel times are estimated using the network model and observed data whenever available. Two geographical and economic context binary variables are added, one describing if the OD pair has a trade agreement and the other for the existence of a land border between trading partners. The mode choice model is validated by ensuring the mode share of the volume of goods transported is similar to the observed mode share for international transport in 2011 by weight. Additionally, the total tonne kilometers for all 4 major modes of transport (air, road, rail, sea) are also validated against the observed data. These observed data are obtained from reports of various organizations such as the International Maritime Organization (IMO), the International Civil Aviation Organization (ICAO), and the World Bank. Table A1 and Table A2 provide detailed descriptions of the validation result.
u o d k m = a s c m + C F k   T C o d m + T F k   T T o d m + C t m   c o n t i g o d + R t   r t a o d
P m = e u o d k m m = 1 M e u o d k m
In Equations (4) and (5),
Pm = the choice probability of mode m,
u o d k m = the choice utility of mode m for commodity k between origin o and destination d,
ascm = alternative specific constant for mode m,
CFk = transport cost coefficient for commodity k,
T C o d m = transport cost for mode m between origin o and destination d,
TFk = travel time coefficient for commodity k,
C t m = contiguity coefficient for mode m,
contigod = contiguity variable between origin o and destination d, contig = (0, 1),
Rt = trade agreement coefficient,
rtaod = trade agreement variable between origin o and destination d, rta = (0, 1).

3.1.5. Route Choice Model

We used a path size logit model in combination with a path generation method to assign the volume of freight transport across all possible international shipping routes between all origins and destinations. The model does this using a shortest path algorithm and choice set creation algorithm to identify the subsegments of the complete shortest route for each port-to-port segment of a shipping line. The model accounts both for maritime connections between two countries and for overland connections between the centroids. The route and port choice algorithms use a path size logit model which takes overlaps between the alternative routes into account and distinguishes the transport costs associated with these alternatives properly. The basis of this model can be found in [44]. The model is calibrated by minimizing the difference between observed and modelled port throughputs for more than 400 major ports in the world. A detailed description on the model can be found in [45] or in [46]. The formal definition of the cost model is delineated below:
C r = p r A p + l r c l +   α ( p r T p + l r t l )
In Equation (6):
Cr = unit cost of route r from origin centroid to destination centroid (US$/Twenty-equivalent unit, TEU),
p = ports used by the route,
l = links used by the route,
Ap = unit cost of transhipment at port p (US$/TEU),
cl = unit cost of transportation over link l (US$/TEU),
Tp = time spent during transhipment at port p (days/TEU),
tl = time spent during transportation over link l (days/TEU),
α = value of transport time (US$/day).
The model accounts both for maritime connections between two countries and for overland connections between these countries. The route and port choice algorithms use a path size logit model which takes overlaps between the alternative routes into account and distinguishes the transport costs associated with these alternatives properly. The basis of this model can be found in [44]. The following is the formal definition of the route choice model. The route probabilities are given by
P r = e μ   ( C r + ln S r ) h = 1 H   e μ   ( C h + ln S h )
while the path size overlap variable S is defined as
S r = a     L K r Z a Z r 1 N a h
In Equations (7) and (8):
Pr = the choice probability of route r,
Cr = generalized costs of route r,
Ch = generalized costs of route h within the choice set,
CS = the choice set with multiple routes,
h = path indicator/index, h   C S ,
μ = logit scale parameter,
a = link in route r,
Sr = degree of path overlap,
Lkr = set of links in route r,
Za = length of link a,
Zr = length of route r,
Nah = number of times link a is found in alternative routes.

3.1.6. CO2 Mitigation Impact Assessment Model

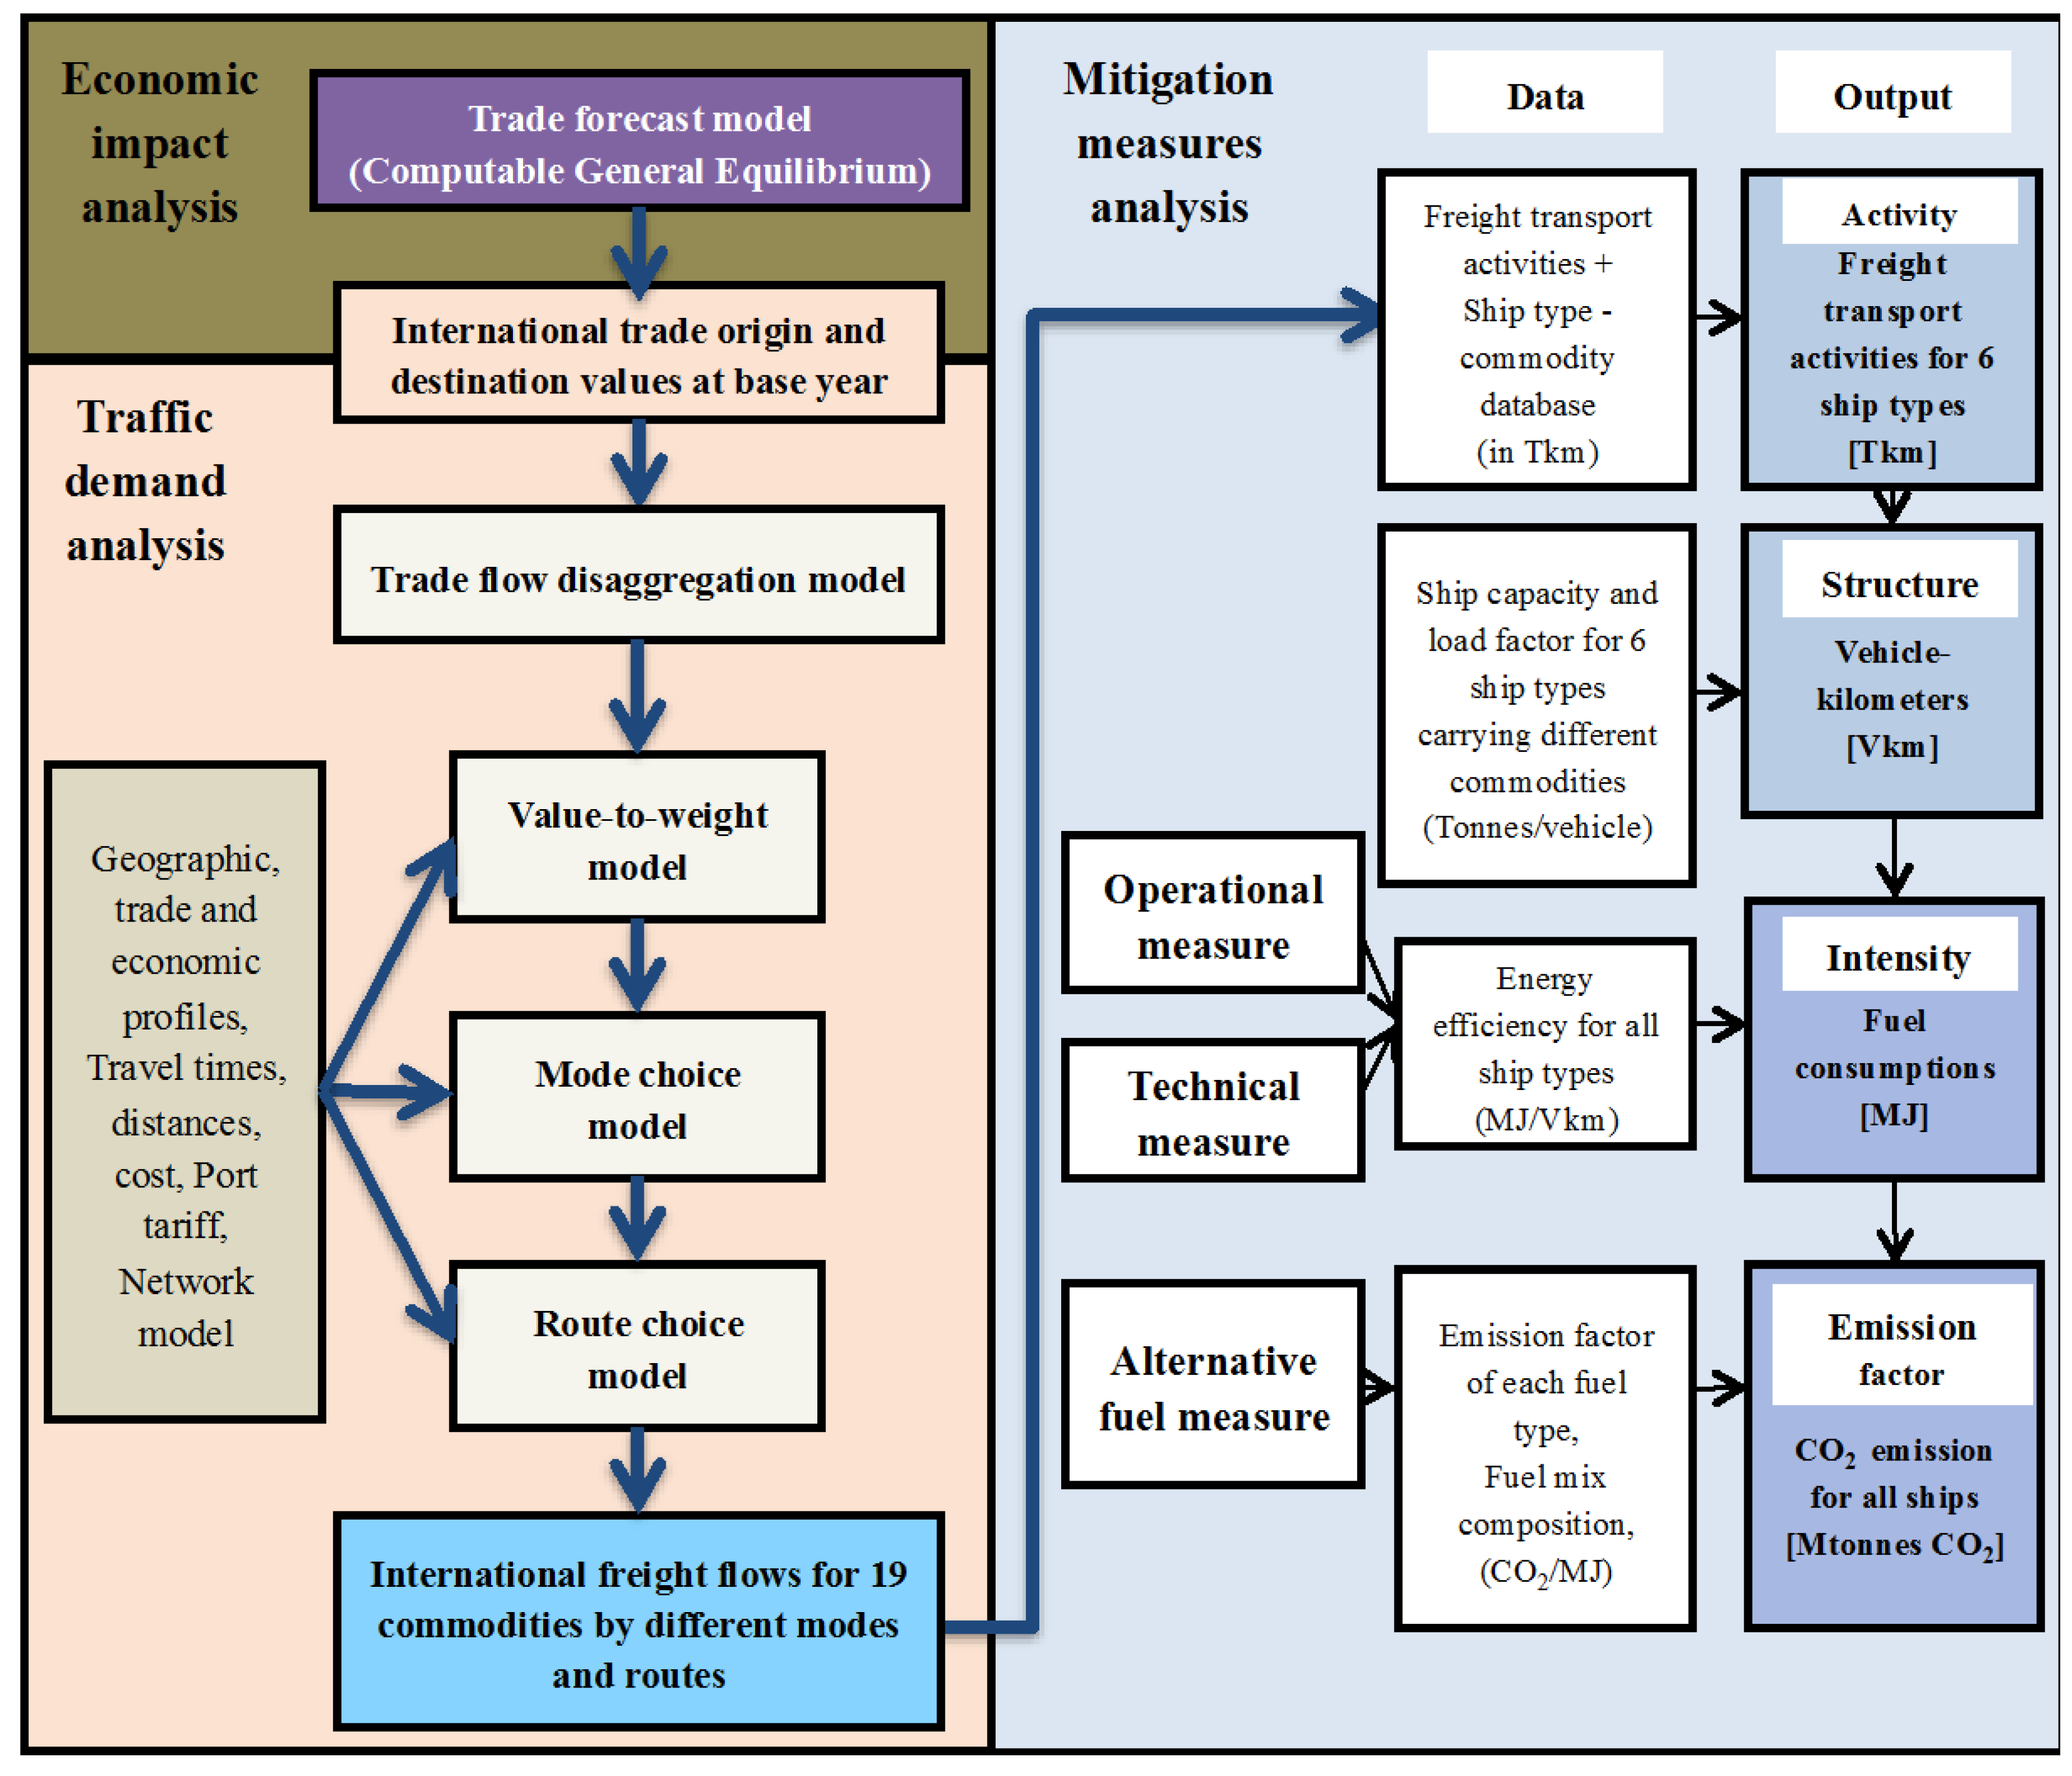
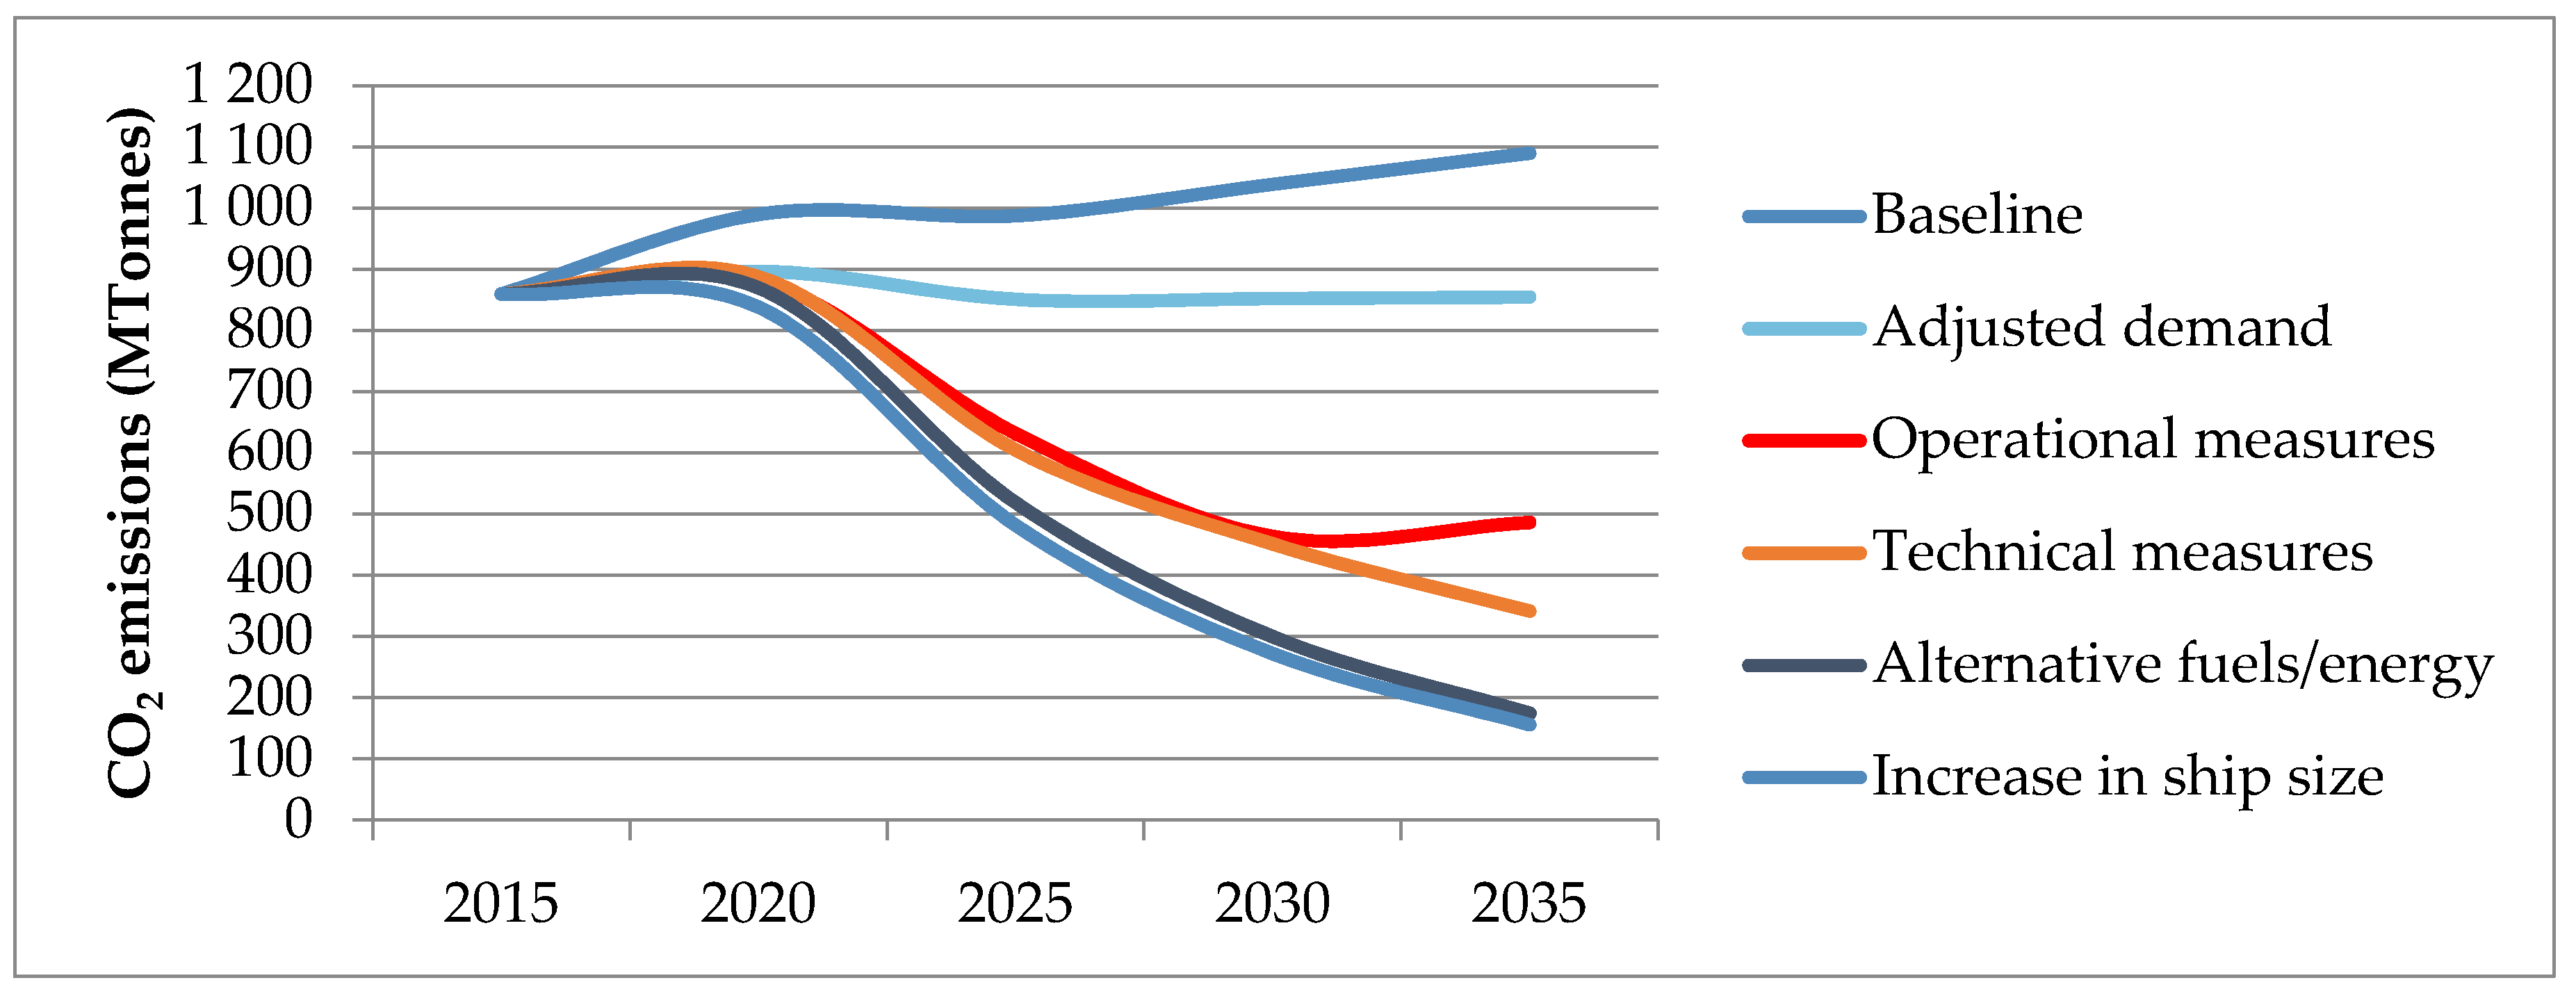
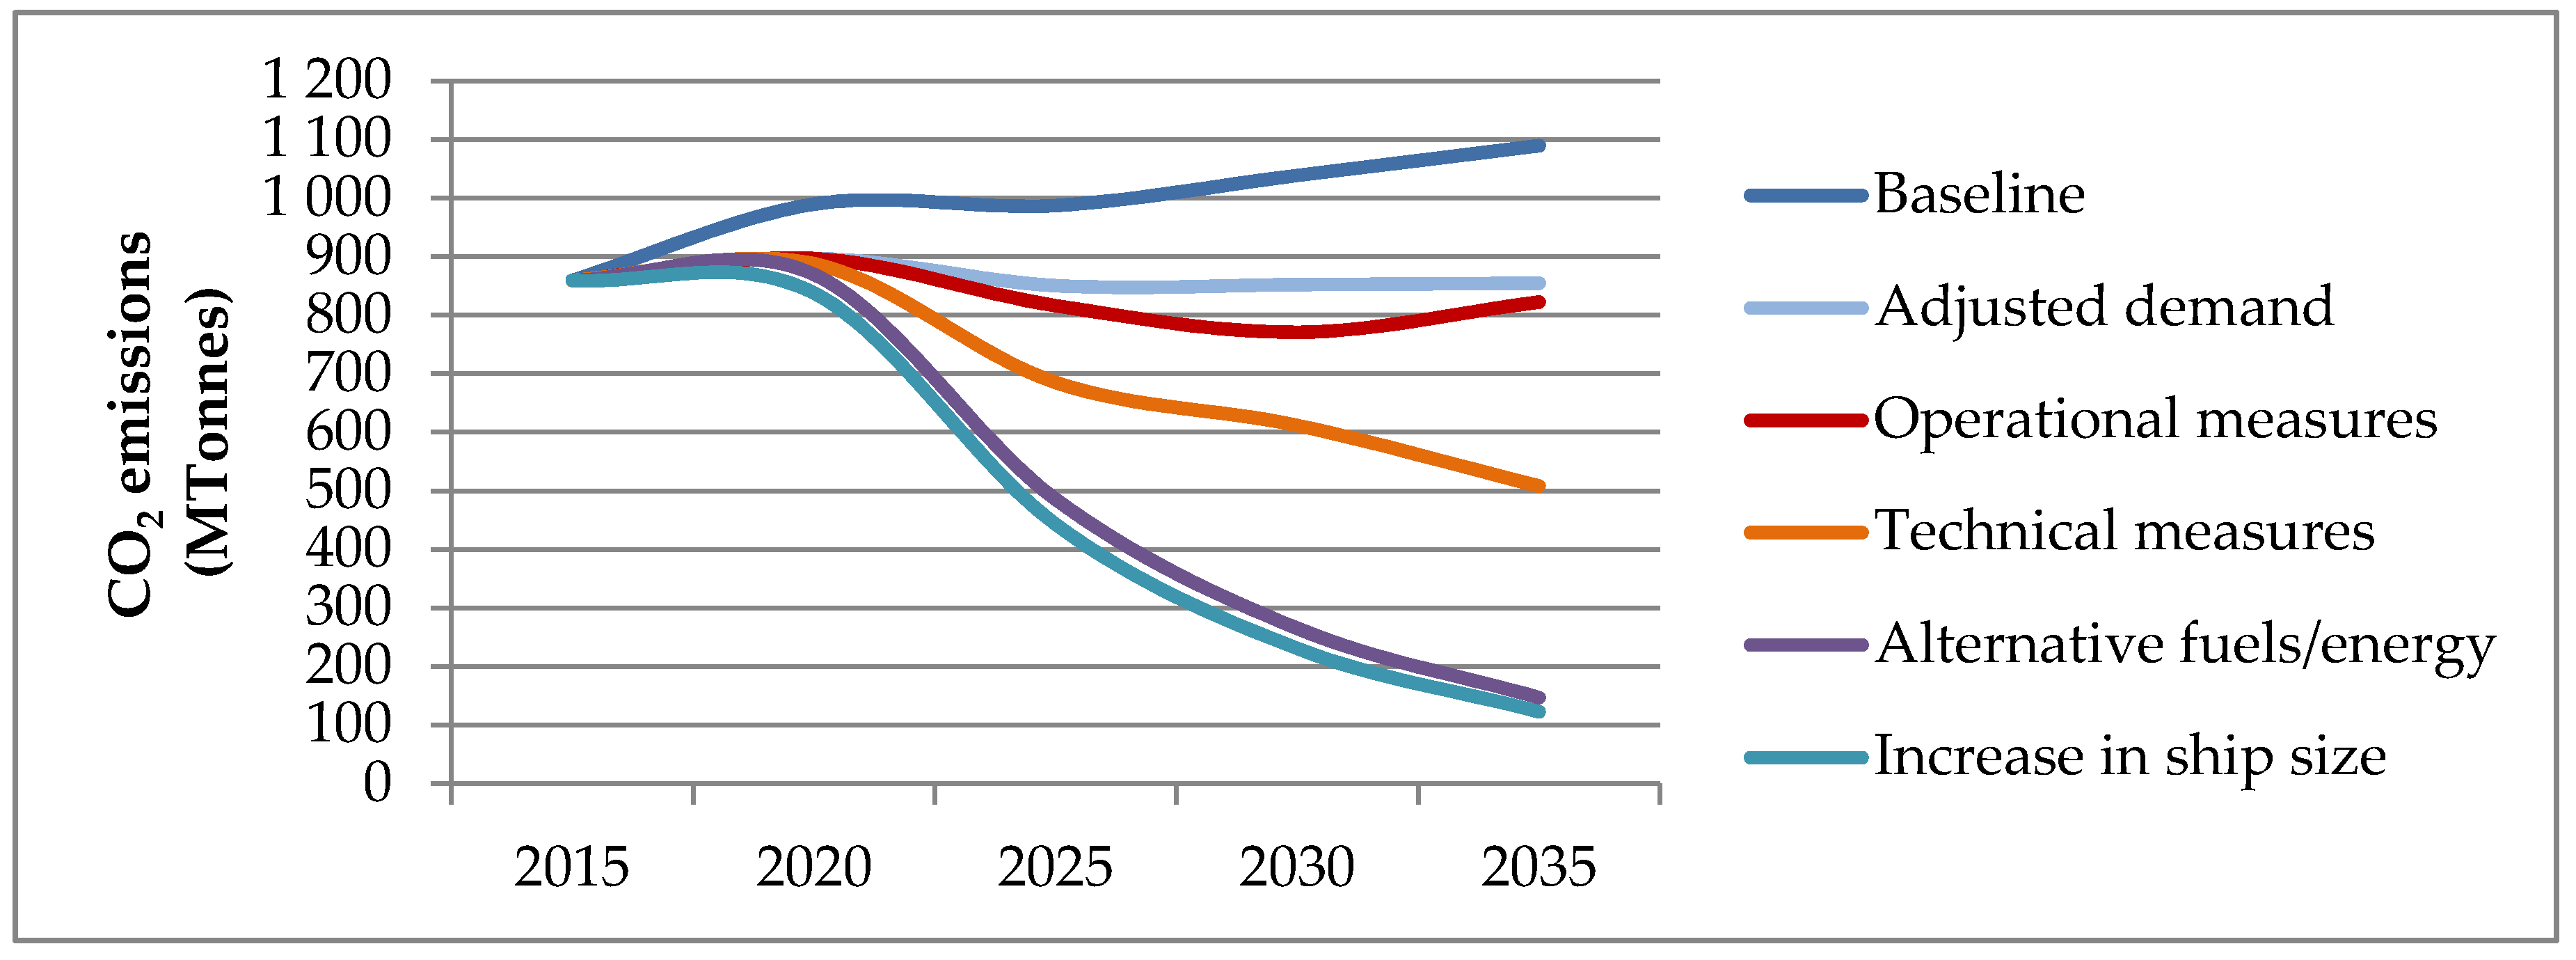
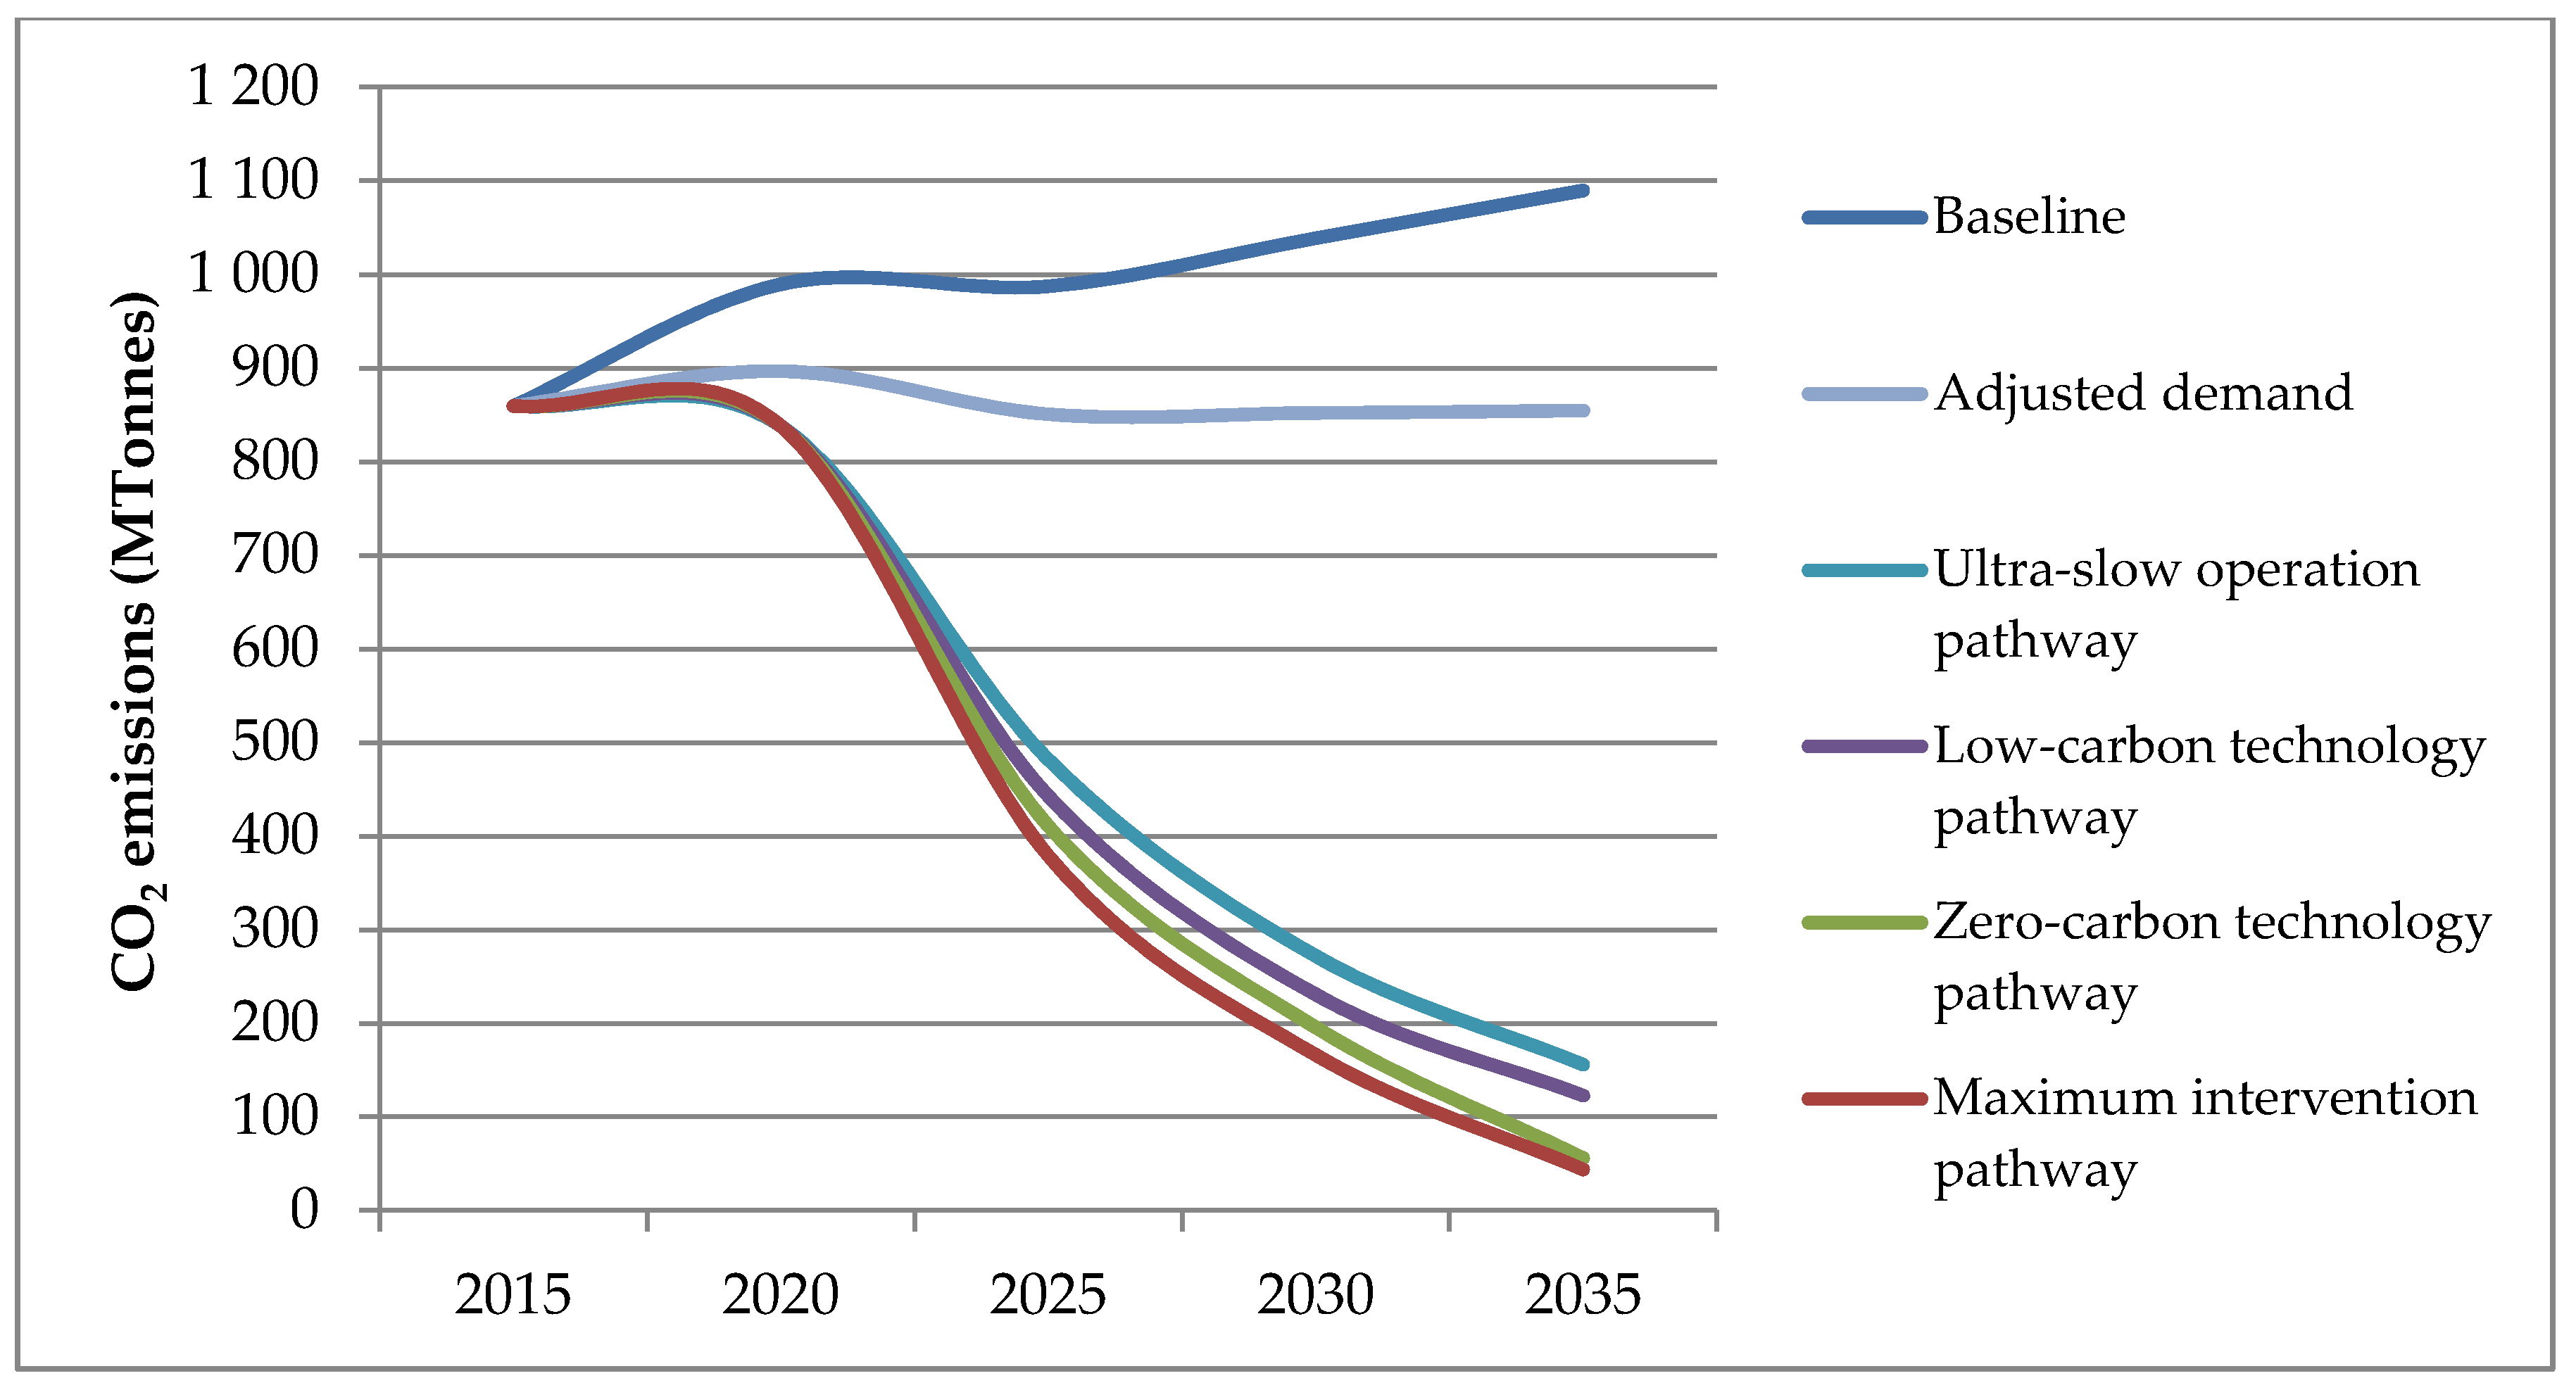
The ASIF framework is used to assess the impact of the maximum possible technical, operational, and alternative fuels measures on the total CO2 emissions of international shipping (Figure 1). The output of IFM provides the tonne kilometers for different commodities (“Activity”) and the projections for future transport demand scenarios which we assign to possible ship types to estimate the activities for each ship type. We consider 6 ship types in our model: dry bulk, container, oil tanker, gas, wet product and chemical, and general cargo. We estimate the vehicle kilometers for each ship type using the ship’s load factor data and the projection for the changes in ship size until 2035 (“Structure”). Furthermore, we compute the fuel consumptions of all ship types using engine efficiency improvement pathways together with the distribution of fuel types across different ship types (“Intensity”). The resulting fuel consumption for each ship type is then used to estimate the total CO2 emissions using carbon factor and energy content data for different fuel types (“Emission factor”).
E q f = A q S q f I q F f
S q f = S h q f L F q
T C O 2 = q = 1 Q f = 1 F E q f .
In Equations (9)–(11),
TCO2 = total CO2 emissions from international shipping,
Eqf = total CO2 emissions from ship type q using fuel type f (in tonnes CO2),
Aq = total annual activity for ship q (in tonne kilometers),
Sqf = total vehicle kilometers for ship type q which uses fuel type f (in vkm),
SHqf = share of ship type q which uses fuel type f (in %),
LFq = load factor of ship type q (in tonnes/vehicle),
Iq = engine intensity of ship type q (in MJ/vkm),
Ff = emission factor of fuel type f (in tonnes CO2/MJ).

3.2. Data

We use data from various datasets to estimate each component of the model and produce the baseline CO2 emissions for each ship type until 2035 using the ASIF framework.
The weight-to-value model and the mode choice model are estimated using observed international trade flows from Eurostat and ECLAC datasets. The Eurostat dataset registers trade flows between Europe and the rest of the world that are obtained from the customs of each EU country, and the ECLAC dataset records trade data between Latin American countries and countries worldwide. These datasets combined provide more than 17,427 observed trade flows in values (US$) and weights (tonnes) and their modes of transport. We use the UN Comtrade data that record trade flow data for all commodities, grouped in more than 97 product types (chapters) both in value and weight, to validate the output of the model. It is necessary to aggregate the trade flows both in values and weights at the country-to-country level for all commodities in the Harmonized Commodity Description and Coding Systems (HS) to enable a comparison with the output of our model. The GDP and population data, including their projection until 2050, were obtained from the environment directorate of the OECD.
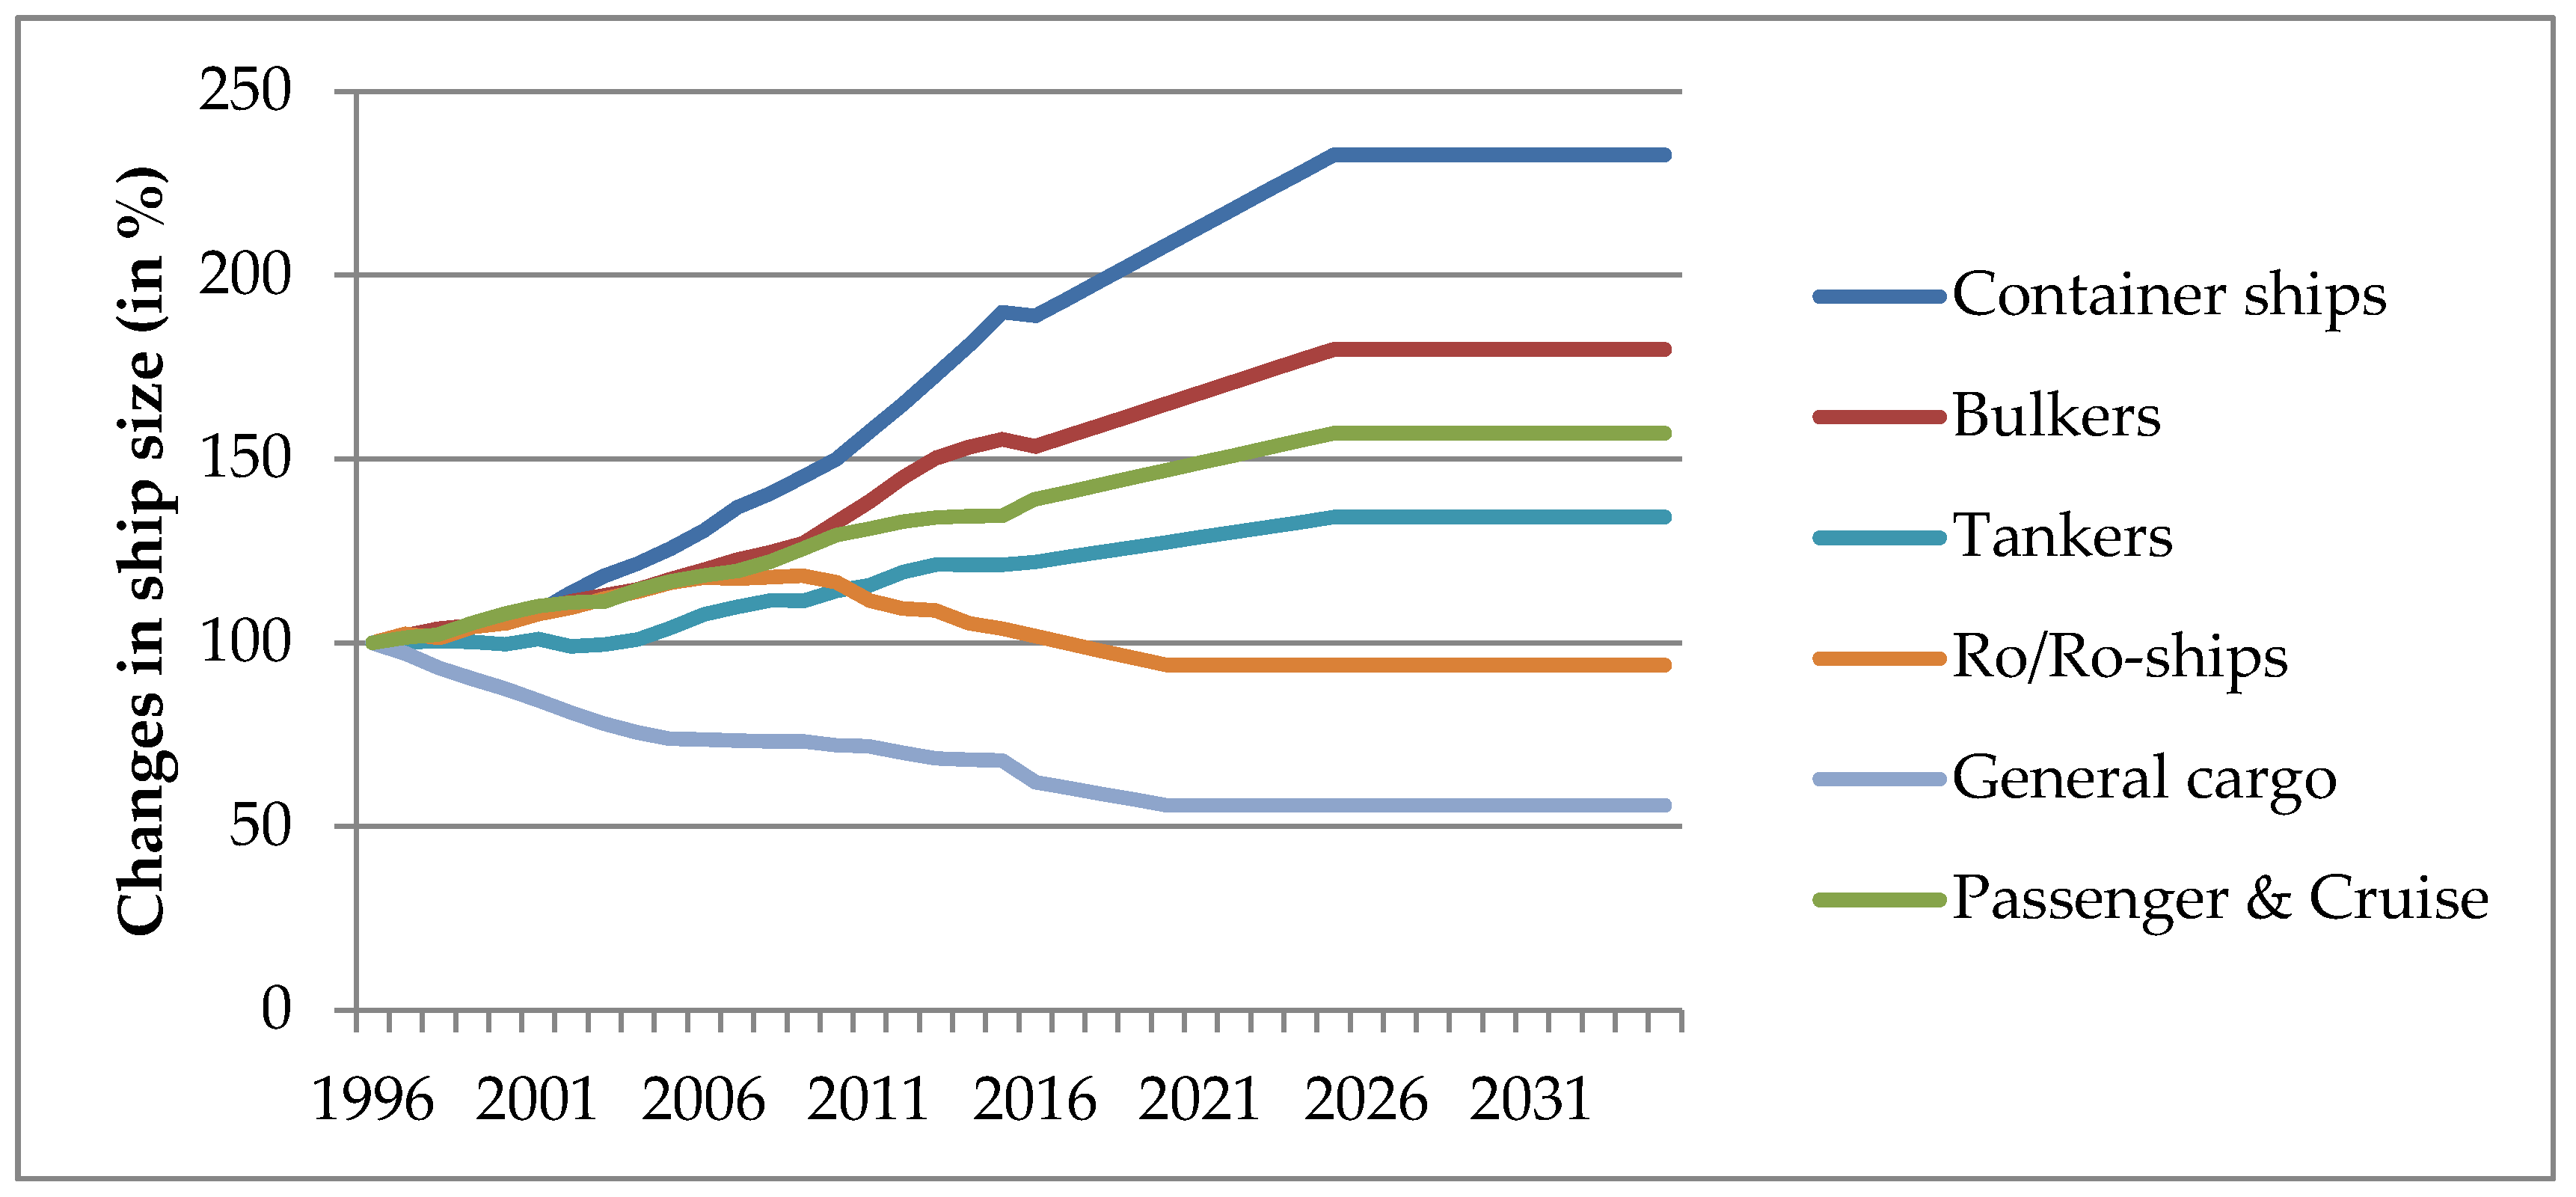
Given the baseline transport demand projection for 6 ship types, the ships’ vehicle kilometers are estimated using load factor data for each ship type. The load factor data for each ship type are estimated by multiplying the average freight capacity and average utilization rate of each ship type. We obtained average freight capacity data from the UNCTAD Review of Maritime Transport 2013 [47] and ships’ utilization rate data from the 3rd IMO GHG study [1]. We estimated the evolution in ships’ load factor by taking into account the future evolution in ship size (
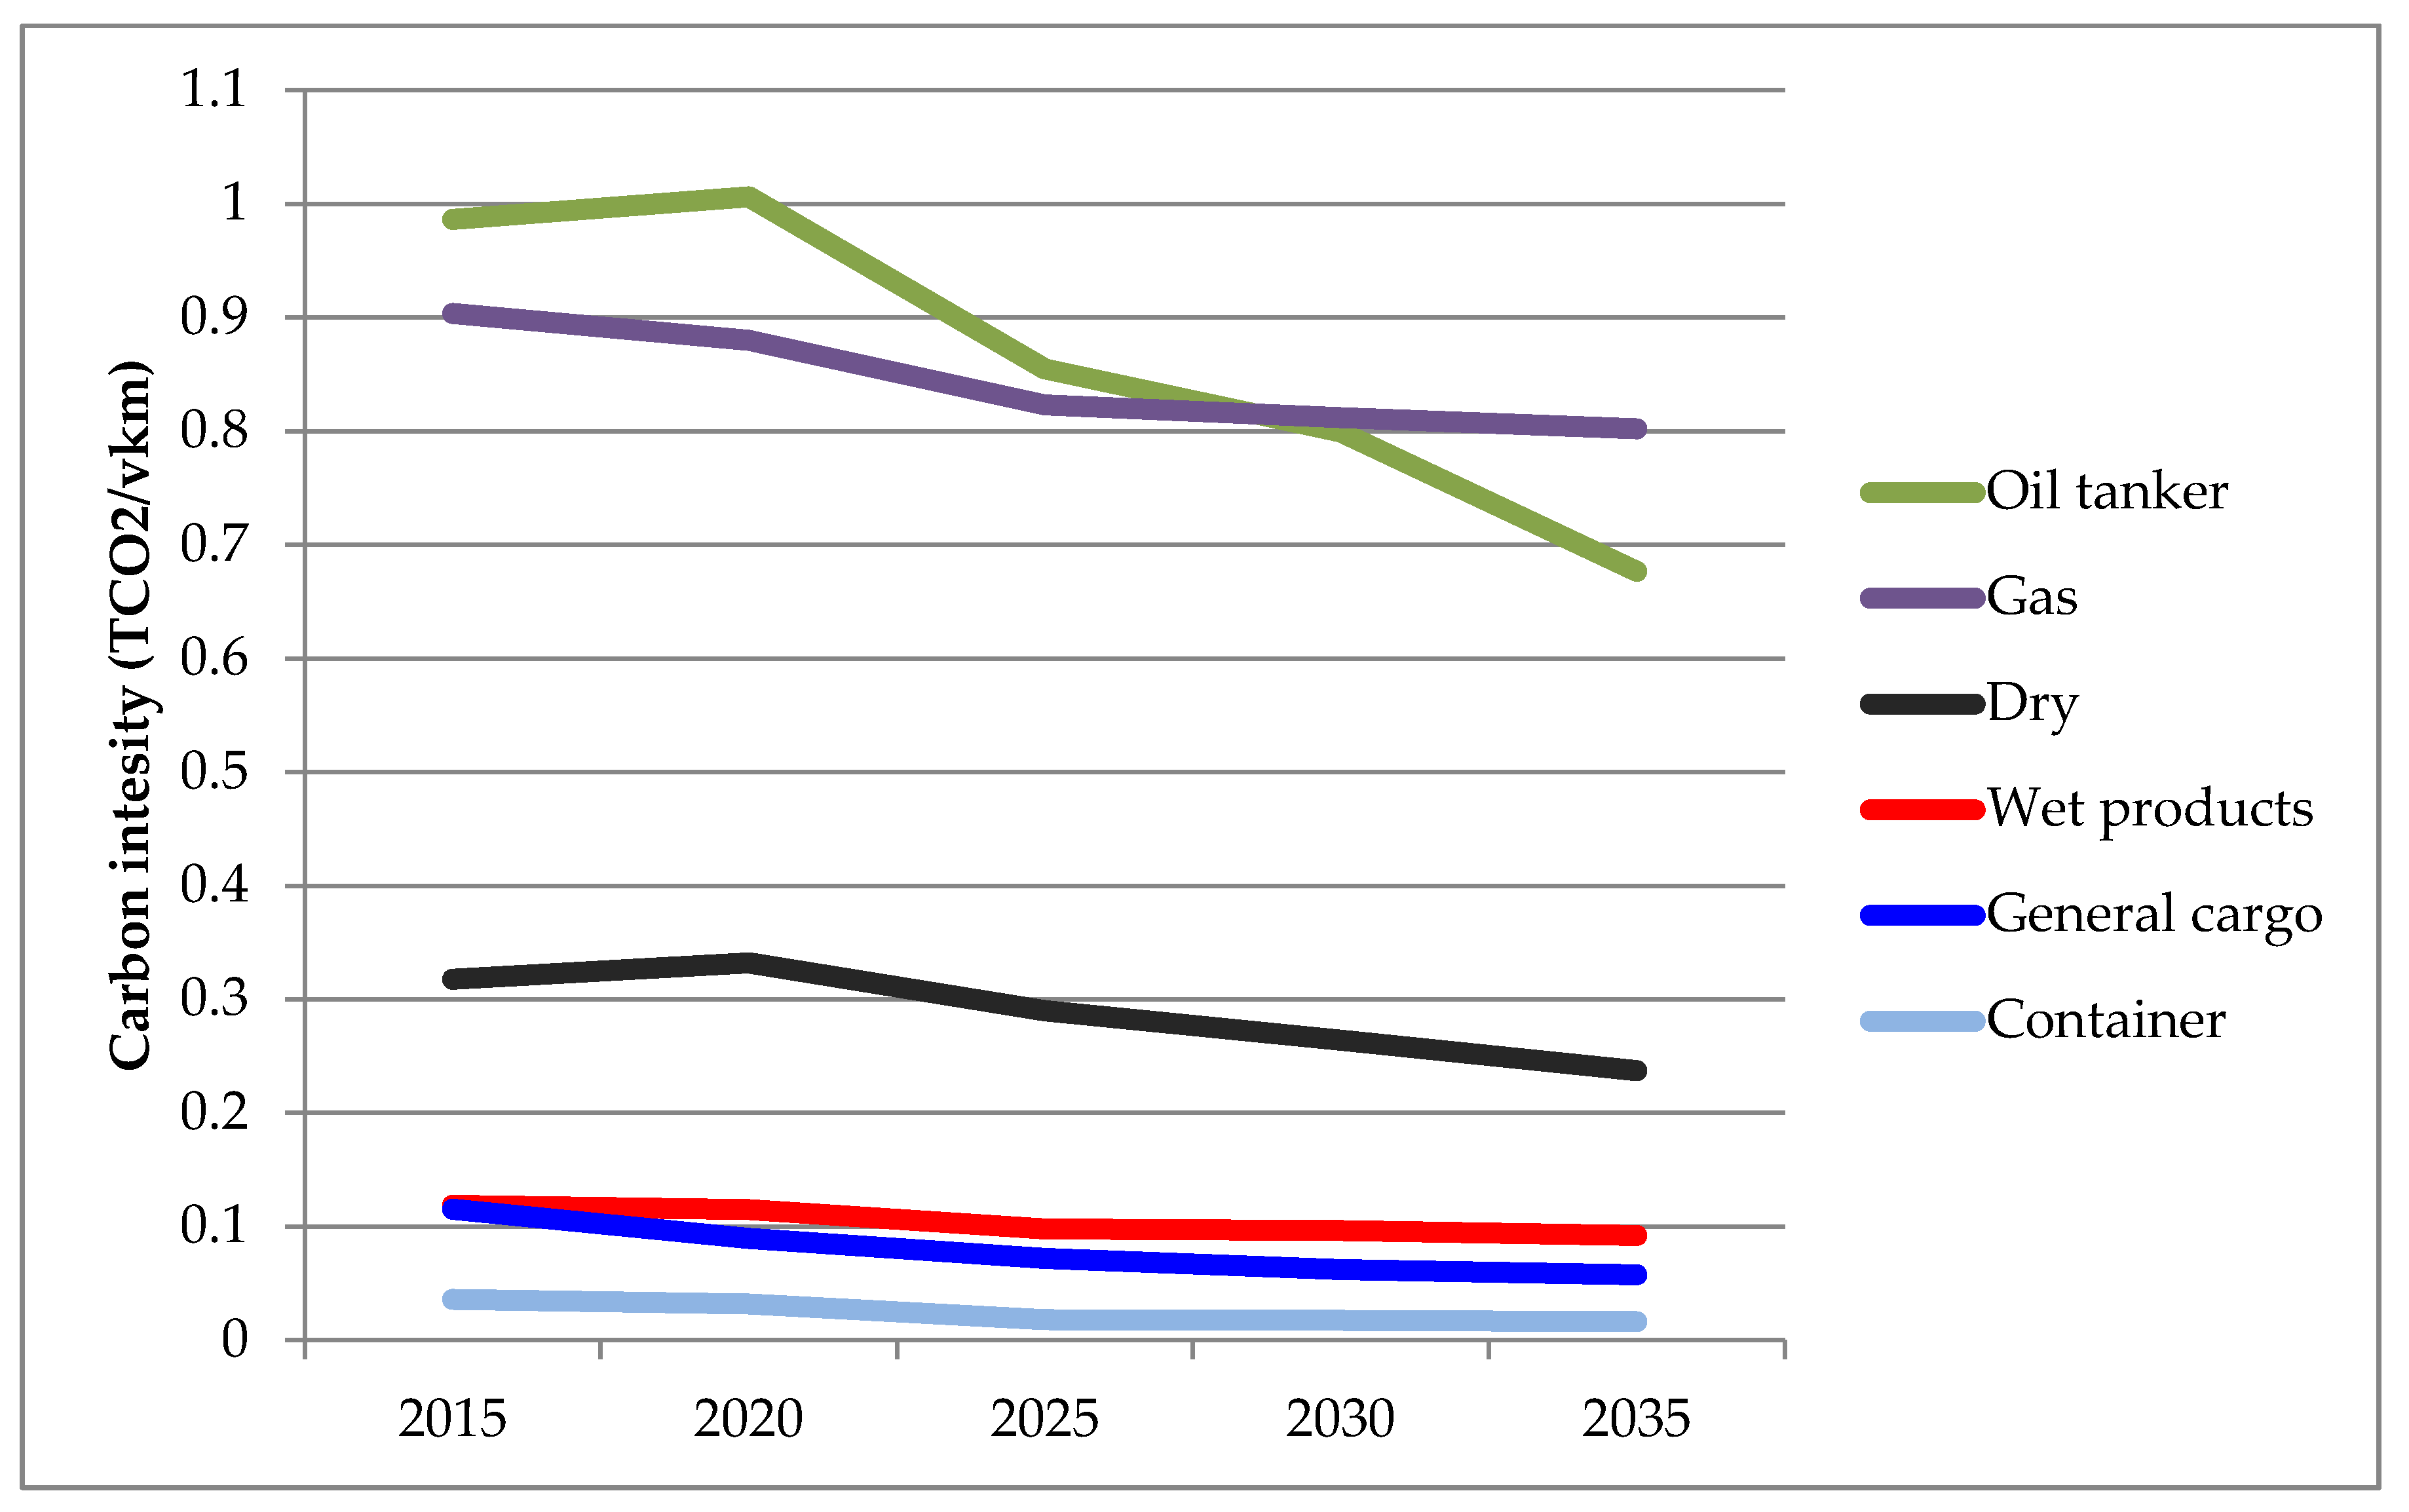
Figure A1). This projection of ship size is based on the observed historical pattern of ship sizes from 1996 to 2015. The pathways for ships’ engine efficiency for each ship type for the baseline scenario were obtained from a UMAS study [7,48]. Furthermore, the emission factor data for different fuel types were obtained from the International Energy Agency’s Mobility Model [49] (Table A3). By multiplying the engine efficiency (in MJ/vkm) with the emission factor for different fuel types (in CO2/MJ), we obtain the carbon intensity of each ship type (Figure 2).

4. Results

4.1. Baseline Emission Scenario: The Impact of Less Fossil Fuel Trade and the Rise of Trade Regionalization

Carbon emissions from global shipping are projected to reach approximately 1090 million tonnes by 2035 in a baseline scenario without additional policy measures. This would represent a 23% growth of emissions by 2035 compared with 2015. The baseline scenario incorporates the impact of existing international regulations, including that on the energy efficiency of ships. A geographical representation of shipping emissions and their evolution shows that a large share of carbon emissions in the baseline scenario is generated along main East–West trade lanes (Figure 3). In our study, we incorporate two possible developments in the baseline scenario: a strong reduction of trade in fossil fuels and further regionalization of trade. We will show that this results in a downward adjustment of shipping emissions when these developments are taken into account.
One of the impacts of the Paris Agreement is the rise in commitments by countries and various subnational governments to reduce the use of fossil fuel commodities such as coal and oil. This development is reflected in certain scenarios for global energy demand. For instance, the sustainable development scenario in the World Energy Outlook 2017 of the International Energy Agency (IEA) projects that global energy demand from coal will decline up to 41% by 2040, and oil up to 22% [50]. The declining use of fossil fuels would have a significant impact on maritime trade due to the quantities of coal, oil, and gas shipped over long distances. The decrease of worldwide coal production of about 2.9% in 2015 translated to a decline in seaborne coal trade of 4.3%, which represents around 50 million tonnes of cargo by sea transport [51]. We assume that a reduction in global coal and oil trade will take place gradually from 2015 onwards and could lead to 50% and 33% reductions of coal and oil trade volume, respectively, by 2035. This reduction factor is similar to one of the sustainable pathways in IMO scenario RCP 2.6, which projects a decline of about 48% in transport demand for coal trade and 28% for liquid bulk trade, including oil.
Furthermore, global outsourcing has driven much of the trade growth of the last decades, but current developments might indicate a more regionalized trade system in the future. Emerging economies have gained a larger share in global trade and increasingly trade with each other. One of the major trends in trade policy is the continuous increase in preferential trade agreements at a regional level. In Asia, intra-regional trade has increased in relative and absolute terms [52]. The share of Chinese exports directed to emerging and developing Asian countries has grown considerably in the last decade. Such shifts in trade patterns could significantly alter the global demand for seaborne transport. In addition, maritime cost increases related to the 2020 sulphur cap might have effects on regionalization of trade. This cap will reduce the allowed sulphur content in ship fuel from 3.50% to 0.50% and could translate into increases in import prices. These changes might be substantial enough to lead to changes in trade flows. Depending on price elasticities—most of which are unknown—one could assume that these cost increases lead to a shortening of certain supply chains, considering that the increase in maritime transport costs makes nearby sourcing more attractive. Taking into account the potential impact of the rise in intra-regional trade and in transport cost due to the sulphur cap, we assume a 20% rise in intra-regional trade flows by 2035 replacing intercontinental trade flows, and thus resulting in a reduction of tonne kilometers as compared to the baseline scenario. Figure 4 presents the adjusted transport demand projection for 2035 if a reduction in fossil fuel trade and trade regionalization are taken into account.
More intra-regional trade, combined with a further reduction of trade in fossil fuels, could reduce baseline CO2 emissions to around 850 million tonnes by 2035. This adjusted level of emissions will be used in the remaining parts of the paper as benchmark for the CO2 emissions that would need to be reduced in order to reach full decarbonization of shipping by 2035 (Figure 5).

4.2. Combination of CO2 Mitigation Measures

Table 5 provides an overview of different technologies, operational measures, and alternative fuels that are included in our modeling framework. We use the measures that are assessed in the UMAS study [7] as the base input for our modelling framework and add several relevant additional measures, such as ship size and port–ship interface. The technological measures listed in the table do not represent an exhaustive set of measures. The implementation of one measure might be incompatible with the application of other measures. We therefore used the detailed assessment of these measures, as well as a compatibility matrix, as provided in the appendix of the study by UMAS [7]. Beside technological and operational measures and fuels, we also assume an implementation of a market-based measure in the form of carbon pricing that is applied to both global and sectorial markets such as shipping.
While the individual measures can deliver a significant reduction in CO2 emissions, it is unlikely that one single measure on its own would be the most efficient and cost-effective way to achieve decarbonization of shipping by 2035: a combination of measures would be needed, which generate different decarbonization pathways. This section sets out these possible pathways to decarbonize international shipping by 2035.
The implementation of one measure might be incompatible with other measures. This is especially the case for the possible technologies that can be combined on a single ship, for instance combining different wind and solar technologies. Furthermore, certain technical measures will also not allow certain operational measures to be implemented. More detailed information on the possible combination of technologies that can be installed on a ship is provided in a compatibility matrix in [7].
The projections for the possible decarbonization pathways are based on the results of the Whole Ship Model used in [7].As the starting point for our modelling exercise, we use their data on reduction levels of ships’ carbon intensity associated with the application of operational, technological, and alternative fuel measures. Furthermore, we studied the impact of additional operational and alternative fuels measures such as those listed in Table 5 above on the possible further reduction of ships’ carbon intensity. We focus on the reduction in carbon intensity levels (EEOI) that can be achieved by combining all possible technical, operational, and alternative fuel measures without explicitly considering the cost-effectiveness of the measures. Furthermore, we do not include the dynamic feedback that might exist between measures due to their interactions. This allows us to assess the maximal possible carbon emission reductions by 2035.
Different pathways to reach carbon emission reductions can be constructed by combining the operational and technical measures with the use of alternative fuels at different times and degrees. On the operational side, we consider speed reduction as a key measure to reduce the carbon intensity of ships. We consider two possible alternatives for implementing speed reduction: moderate and maximum speed reduction. “Moderate” speed reduction implies reductions of 6% (for container ships) and 9% (for tankers and bulk carriers) of the standard operational speed for different ship types, which was assumed to be 12.8 knots for bulk carriers and tankers and 18.4 knots for container ships, in line with the study by Smith et al. (2016).
In the case of “maximum” speed reduction, we consider strong speed reductions of 26% (for container ships), 30% (for tankers), and 65% (for bulk carriers) of the standard operational speed. Even though it is technically possible to attain such low operating speeds, navigators will prioritize safety, stability, and maneuverability of the ship, especially when operating in difficult weather conditions. Another operational measure that has been integrated in this modelling framework is optimized ship berth planning. This relatively low-cost measure is aimed at reducing the waiting time of ships at port before berthing. According to our estimation, this measure could deliver around a 1% reduction of the total CO2 emissions. We assume that the operational measures, especially speed reductions, could be implemented from 2020 onwards to yield maximum potential by 2030, which would require decision-making by 2018.
In terms of technical measures, we apply maximum ship design specifications that can lead to the highest reduction in a ship’s carbon intensity, taking into account the speed reduction measures described above. This maximum specification entails the implementation of a series of technologies encompassing ship engine design and hydrodynamic improvements that can increase a ship’s energy efficiency as described in Smith et al. (2016). This pathway includes a range of technological measures such as wind assistance and block coefficient improvements to reduce resistance which can help to deliver additional CO2 reductions (up to 30%). When speed reduction is implemented, the energy efficiency savings gained from measures such as an improved block coefficient and wind assistance will diminish. We take this interaction into account and assume that the increase in energy efficiency will take place gradually (in a linear fashion) between 2020 and 2035.
Furthermore, we apply two additional measures: the uptake of electric ships and Onshore Power Supply (OPS). We include a scenario in which the pace of innovation in battery technology will sharply reduce battery costs (according to various projections such as Bloomberg New Energy Finance [53]), which could drive electrification of around 10% by 2035. We assume that most of these electric ships will be used to serve international short-distance shipments between countries. In such a scenario, the penetration rate of electric ships is assumed to see a gradual increase from 1% in 2025 to 10% in 2035. The second additional measure is Onshore Power Supply (OPS) which can help to reduce the carbon emissions from ships at berth during the loading and unloading process. OPS is already fairly widely used and is likely to be expanded due to favorable regulation, e.g., in the European Union where it will become mandatory by 2025 for European “core ports”. As OPS could also be used as a charging facility for electric ships, we assume that uptake of electric ships and OPS will coincide. The implementation of these measures would be facilitated by a market-based mechanism introduced in 2025.
Three different levels of fuel carbon factor reduction are considered as possible pathways: 50%, 75%, and 80%. While the first two are taken from Smith et al. (2016), the third reduction level is estimated by assuming the uptake of alternative fuels such as ammonia. The level of carbon factor reduction presented here indicates the average reduction in carbon content of the fuel (gram of carbon dioxide per megajoule of energy) compared with the baseline that can be achieved by the use of alternative fuels. Here, high carbon factor reduction is used to indicate high uptake of alternative fuels such as advanced biofuels, hydrogen, and ammonia. In the case of 80% carbon factor reduction, it is assumed that hydrogen and ammonia will form around 70% of the fuel mix in ship propulsion. This, along with an assumed increase in the uptake of biofuels (22%) and LNG (5%), could significantly diminish the use of oil-based fossil fuels to around 3% by 2035 (Figure 6). While the gradual uptake of these fuels starts from 2015, zero-carbon alternative fuels such as hydrogen and ammonia are expected to see a stronger uptake after 2025, when we assume the start of a market-based measure such as carbon pricing. In this scenario, we assume the adoption of a carbon price based on Lloyd’s Register study [8] where carbon emissions are priced at around 500 US$/tonne by 2035 in order to make zero-carbon fuels competitive. For simplicity’s sake, we assume that the increase in price is linear over the 2025–2035 period.
Another measure that is included in this pathway is the increase in ship size that will lead to higher ship capacity. Unlike other measures which might require additional incentives and stimuli, the changes in ship size already form part of the shipping industry’s strategy to seize economies of scale. We assume that the trend of ship size increases over 1996–2015 (per different ship types) and can be extrapolated towards 2035.

4.3. Four Possible Pathways to Decarbonize Maritime Transport

We consider four different pathways based on possible combinations of the measures considered in this study (Table 6). All pathways assume maximum application of the possible technical measures. The main differences between the pathways are related to speed reductions (moderate or maximum) and the application of zero-carbon fuels and electric ships, ranging from very high to more moderate assumptions.
The “maximum intervention” pathway represents the most ambitious reduction trajectory to reach zero emissions, where maximum speed reduction will be implemented starting from 2020 and reach its maximum reduction level by 2030, while the other measures such as energy efficiency improvements and zero-carbon fuels are implemented gradually (Figure 7). If we ignore the possible negative impact on international trade (such as increased transport time), drastic speed reduction could reduce CO2 emissions by 43% by 2030. However, the effect of speed reduction alone will not be sufficient to reach zero carbon emissions by 2035. The estimated growth in international trade will offset the reduction impact of this measure starting by 2030. On the other hand, the application of technical measures will help to maintain a downward trend in the emissions between 2030 and 2035. The additional reduction that can be delivered by energy-saving technologies will be relatively low when the ship is operating at ultra-low speed. The increase in ship size together with the application of zero-carbon fuels, especially from 2025 onward, will help to reduce CO2 emissions further by 95% from the adjusted demand level, which leads to remaining emissions of 44 million tonnes by 2035. However, to achieve this level of decarbonization by 2035, zero-carbon fuels such as hydrogen and ammonia would have to see a rapid uptake and should constitute the majority of the fuel mix by 2035 (more than 70%). Additionally, we assume that electric ships could constitute around 10% of the global ship fleet by 2035, which contributes to the reduction in total CO2 emissions.
The “zero-carbon technology” pathway is as ambitious as the previous scenario with regards to zero-carbon technologies but assumes only a moderate speed reduction that helps to reduce emissions in the short run (Figure 8). Reducing speed will lower emissions by 4% in the short term and the implementation of technical measures can help reduce emissions in the medium to long term by 46%. Similar to the “maximum intervention” pathway, the use of electric ships and zero-carbon fuels will be the key measure to reach a 92% emission reduction by 2035. The combination of these measures will help to bring CO2 emission levels down to 56 million tonnes, which is equivalent to a 93% emissions reduction from the adjusted demand level. Both the “maximum intervention” pathway and the “zero-carbon technology” pathway would allow a strong reduction in CO2 emissions by 2035.
The “ultra-slow operation” pathway represents a scenario that relies heavily on speed reduction and sets a less ambitious target for energy-saving technologies and zero-carbon fuel adoption (Figure 9). The overall pattern of this pathway is similar to the “maximum intervention” pathway where most of the reduction comes from a drastic speed reduction, followed by the gradual implementation of other measures. In this pathway, we assume that electric ships will fail to penetrate the global ship fleet and might serve only domestic purposes. The uptake of zero-carbon fuels in this scenario is also foreseen to be less strong than in the other pathways, which could reflect insufficient investments in infrastructure and commitments to ensure sufficient availability of biofuels, hydrogen, and ammonia to replace the conventional fuels. This pathway would lead to an 82% emissions reduction from the adjusted demand level to reach around 156 million tonnes in 2035.
The “low-carbon technology” pathway represents a scenario that aims to balance moderate speed reductions with the use of zero-carbon fuels. This scenario reflects a strong uptake in zero-carbon fuels in the medium to long term, but with a less optimistic view on the penetration rate of electric ships and the uptake of ammonia. With the application of moderate speed reductions, the overall trajectory of this pathway resembles that of the “zero-carbon technologies” pathway, with a less rapid emissions decline to 2035 (Figure 10). This pathway will result in an 86% reduction of CO2 emissions from the adjusted demand level, reaching 123 million tonnes by 2035.
We have presented four different pathways that could lead to the decarbonization of maritime transport with CO2 emissions approaching zero by 2035, with remaining shipping emissions ranging from 44 to 156 million tonnes by 2035 (Figure 11). These pathways demonstrate that targeted interventions using a combination of possible measures can reduce CO2 emissions from international shipping between 82% (“ultra-slow operation”) and 95% (“maximum intervention”) from the adjusted demand level. Table 7 presents the total CO2 emission reductions for the four pathways by 2035. At the aggregate level, it is observable that two similar initial trajectories can be distinguished based on the application of speed reduction measures in the short term. The “maximum intervention” and “ultra-slow operation” pathways represent an extreme reduction in speed, while the “zero-carbon” and “low-carbon technology” pathways represent a more moderate speed reduction. Furthermore, the level of decarbonization in these pathways by 2035 depends on the extent to which zero-carbon fuels and technologies are applied. As demonstrated by the nearly-zero-carbon pathways (“maximum intervention” and “zero-carbon technology”), the use of zero-carbon fuels and technology is indispensable to achieving full decarbonization.

4.4. Impact of Increase in Maritime Transport Cost on Modal Share and CO2 Emissions

The implementation of CO2 mitigation measures as detailed in Table 6 is very likely going to increase transport costs for international shipping due to higher fuel costs, and increase capital expenditures to retrofit the ships and to install other low-carbon technologies. Furthermore, when slow steaming measures are applied extensively, this can cause transport costs to increase further due to longer shipping times, which escalate time-related costs. In such a case, shippers might consider other modes that offer lower travel times and transport costs to be more attractive, especially for highly time-sensitive goods such as fashion, electronics, car parts, and perishable goods, such as food.
This section provides an analysis of the potential impact of the increase in transport costs for international shipping on maritime transport demand. While the increase in transport costs might impact the modal share of international transport, a drastic increase of such a cost for the longer term could also induce changes in global trade patterns (e.g., increase in intra-regional trade, or reduction in total global trade volume). Our analysis does not cover the impact of increase in transport costs on global trade, as it requires a comprehensive study that should take into account the dynamic feedback between trade and transport model. For simplicity’s sake, we assume that the values of international trade will remain the same as in the baseline scenario.
The exact increase in transport cost will be difficult to estimate since it depends on uncertain factors such as investments and commitments in establishing the infrastructure needed to ensure an adequate supply of green technologies and zero-carbon fuels, and the implementation of market-based measures such as carbon pricing. In order to analyze the impact of an increase in transport cost on the demand for maritime transport, we test a scenario where there is a 100% increase in unit transport cost for sea transport by 2030. Specifically, we assume that sea transport cost will increase from 0.0016 $/tonne km to 0.0032 $/tonne km and we apply a 25–65% speed reduction on the sea transport mode based on the maximum intervention scenario.
We focus our analysis on trades between China and Europe and global trade. China–Europe trade represents one of the major global trade flows which can potentially see a shift in its mode share when sea transport becomes a lot slower due to slow steaming. Furthermore, since the launch of China’s Belt and Road initiative, rail cargo transport between China and Europe has gathered political momentum to undergo a major capacity expansion. One of the most rapidly developing rail corridors between China and Europe is the Trans-Siberian railways via Kazakhstan’s rail system. Compared with sea transport, this railway connection can reduce travel time up to 42%. To reflect this potential development, we incorporate a 50% reduction in transport cost and time for the rail mode between China and Europe. Table 8 presents the modal share of China–Europe transport by 2030 under baseline and increased cost scenarios. The result shows that a 100% increase in sea transport cost causes a slight reduction in the mode share of maritime transport (1.4%), which represents 8.7 MTonnes of freight volume. The majority of this volume is estimated to shift to rail transport (7.8 MTonnes), which is projected to see an increase of 1.23% in its share. Although the reduction in share of maritime transport is relatively small, the shift to rail mode represents a roughly 15% increase in the total volume of rail transport.
On a global scale, the impact of higher sea transport cost on the modal share is less significant compared with China–Europe transport (Table 9). The share of sea transport could decline around 0.16%; this represents approximately 34 Mtonnes of freight volume. The majority of the shifts are from sea mode to both road mode (13 MTonnes) and rail mode (18 MTonnes). One of the reasons for this is that sea transport remains the cheapest transport mode that serves major trade lanes such as those between Europe and Asia and between the U.S. and Europe.
Next, we estimate the impact of a shift in modal share on the total transport demand for maritime transport. In the scenario where transport cost will increase gradually (19% annually) from 2020 until 2035, a slight reduction (0.10–0.14%) in maritime transport activity is foreseen. Table 10 presents the estimated changes in transport activities (Tkm) due to an increase in transport cost and its associated CO2 emissions. By 2035, reduced sea transport demand could lead to a reduction of approximately 1.2 MTonnes of CO2 emissions from international shipping, which is equivalent to approximately 2.3% of the projected CO2 emissions under the maximum intervention scenario.
In conclusion, the impact of a major increase in sea transport cost on CO2 emissions for international shipping is going to be likely marginal. However, the small shift from sea mode to other modes such as rail, road, and air could increase the transport demand for these modes considerably (as exemplified by rail mode for China–Europe trade). In the case where there are no sufficient CO2 mitigation measures implemented for the other modes, the total CO2 emissions from international transport might increase since maritime transport is generally less carbon-intensive than rail and road transport. This result underlines the importance of minimizing the shift from maritime transport to other modes that are more carbon-intensive such as air, road, and rail, especially if there are not adequate CO2 mitigation measures being implemented for these modes.

5. Barriers and Market Failures in Decarbonizing International Shipping

Prevailing conditions and incentive systems in the shipping sector prevent firms from making optimal environmental choices. In this section, we highlight the main barriers and market failures that lead to a delay in adoption of technologies and fuels with higher environmental performance.

5.1. Sunk Costs and Path Dependence in the Shipping Sector

The average life of a ship is approximately 25 years, which means that a significant share of current ships will still be in operation by 2035. Even if all ship owners would from now on order zero-emission vessels, there would still be a considerable share of ships that would not be zero-carbon. Decarbonization of the sector will depend to an important extent on the level of fleet renewal that is possible, which depends on the extent of scrappage of old vessels and the capacity to retrofit existing vessels. This causes important sunk costs. The potential for fleet renewal is larger if maritime trade is expanding and could also be subject to policy interventions to speed up the process and mitigate excessive economic harm that sudden changes could cause.
Significant use of CO2 mitigation measures also assumes sufficient adaptation of infrastructure and production capabilities to future demand for alternative fuels and energy that might not take place immediately, considering the path dependence in the shipping sector. Choices made on the basis of temporary conditions can persist long after these conditions change, especially when the capital has a high life span. This durability of invested capital makes major changes particularly impractical and costly. Examples of far-reaching adaptations that might be needed include the wider energy infrastructure and production capabilities related to advanced biofuels, hydrogen, ammonia, and other zero-carbon fuels. In addition, ships would require the relevant facilities for bunkering and energy provision, e.g., charging systems for electric ships. There might be two distinctive concerns in this respect: first, concerns about the maximum supply potential within a given time period (e.g., of advanced biofuels); and second, how to reach sufficient scale for measures to become commercially viable, e.g., with regards to synthetic fuels, wind technology, and ship batteries.

5.2. Carbon Emissions as Negative Externality: The Climate as Unpriced Public Good

A negative externality arises when an individual or a firm takes an action but does not bear the costs imposed on a third party. In the case of the shipping industry, pollution imposes health, environmental, and economic costs on the whole of society without bearing the cost of it. Since costs are never borne entirely by the emitters and they are not obliged to compensate those who lose out because of climate change, they face little or no economic incentive to reduce emissions. Human-induced climate change and associated GHG emissions have been described as the greatest market failure in history [54]. A particular challenge with this “market failure” is the uncertainty about the exact size, timing, and location of the effects on environment, society, and the economy. Furthermore, climate change is a global phenomenon in both its causes and consequences and is therefore politically extremely challenging to address.
Climate change risks are not internalized in the price of maritime transport, especially since ship fuel is not taxed, in contrast, for example, to fuels for the road sector. Taxing fuels would be a way to internalize part of the externalities of carbon emissions. This lack of taxation is also hampering the uptake of alternative options for ship propulsion: heavy fuel oil for ships is not taxed but generates sizable negative externalities, whereas some of the alternative energy sources (e.g., electricity) with much less of these externalities are actually taxed. This complicates the transition from HFO to alternative technologies and fuels.

5.3. Split Incentives

Split incentives represent a type of principal–agent problem and occur when participants in an economic transaction do not have the same priorities and incentives. A classic example is the split incentive between charterer and ship owner in the time charter market, where the ship owner provides a vessel, but the fuel costs are borne by the charterer as part of the operational costs [55]. The difference between the actual level of energy efficiency and the higher level that would be cost-effective from the firm’s point of view is often referred to as the efficiency gap (IEA, 2007). Usually, minimizing the capital cost of the vessel, the ship owner does not have an incentive to choose the most energy efficient technology, which often leads to suboptimal investment choices in environmental terms.
Whether time charter is used depends on the shipping segment. They are most prevalent in the container and dry bulk sectors where about 70% and 60% of ships, respectively, are run under time charter agreements whose duration mostly does not exceed one year, which is too short to amortize green investments [55]. However, charterers may also decide to reward owners for their investments in clean technologies or engage in longer charter contracts to allow for a sufficient payback time for these technologies. For example, the purchase of LNG bunkering vessel Coralius from Sirius Shipping was facilitated by Skangas (part of the Finnish state-owned Gasum Group) who agreed to a 15-year charter agreement. Preem and ST1 were willing to engage in long-term charters, making it possible for Terntankers to order LNG-powered vessels. Similarly, some shippers accepted paying higher charter rates to compensate for higher costs related to more environmentally friendly vessels [56].

5.4. Imperfect Information and Information Asymmetry

Imperfect, insufficient, or false information can cause firms to make suboptimal investments in energy efficiency. This type of market failure is particularly relevant in this case, as it contributes to preventing the uptake of greener technologies. Previous research has shown that the quality of knowledge and the level of technological know-how acquired through R&D activities are vital for the diffusion of technologies [57]. There is, however, a shortage of detailed and audited performance data of new technical measures with low market maturity, which acts as a barrier to their uptake [15]. The lack of reliable information on performance in actual operating conditions then leads to a typical chicken-and-egg problem in which no firm is ready to adopt a technology—or no financier ready to finance a zero-carbon ship—because there is a lack of strong proof of its efficiency and commercial viability.
This deficiency can be explained by the wide array of factors that influence fuel consumption of ships, namely, weather conditions, draught, machinery conditions, or operational aspects, which lead to highly variable performance data even for a single ship. In some cases, ship owners may have an incentive to make overly optimistic efficiency claims towards the charterer. Finally, the quality of measurement might also vary, although the industry is gradually shifting towards more frequent and reliable data collection methods, including continuous monitoring systems, which could potentially also discourage misrepresenting performance data [15]. The shortage of fuel efficiency data under real operating conditions also highlights the considerable market failure of a suboptimal level of resources allocated to technological and scientific knowledge. Subsidies to R&D or partnerships between government, research, and industry would be a possible solution to produce more evidence supporting or discarding a certain technology, or to develop alternative, nonincremental options.

5.5. Access to Finance

Currently, there is a risk premium to implementing innovative technologies and ship owners therefore face high barriers to upgrading to a more energy-efficient fleet. Ship owners need to effectively convince financiers that the additional costs of greener technology will be recovered. A study by UMAS and Carbon War Room [4] looked at implications of climate mitigation policies for ship owners and financiers under different market conditions and identified several actions that would need to be taken to both understand and manage these risks. This could include, for example, integrating risks associated with evolving climate regulations into financing decisions and identifying opportunities that environmentally responsible investments represent for financiers, such as the substantial expected demand for capital for vessel modifications. Although the general awareness amongst shipping financiers of climate-related stranded asset risks is rising, only very few are actively managing those risks [58]. In the longer term, however, the conditions for loans for zero-carbon ships could become more favorable than for ships powered on fossil fuels, considering their risk to become stranded carbon assets once stricter environmental regulation is enforced.

6. Implications in Designing Effective Policy Instruments

Although the vision of a trade-off between environment and competitiveness has been blurred over the recent years, government intervention remains indispensable for the broader adoption of low-carbon technologies and fuels in shipping. Greater policy certainty due to the target that has been set at the recent IMO 72nd MEPC meeting will encourage investment and can stimulate innovation [59]. In this context, the target would send an important signal to industry and research that investing in decarbonization will be profitable. It is likely that there will be future regulations on an international level aimed at achieving an at least 50% reduction of CO2 emissions by 2050 compared with the 2008 level. It is also noteworthy that the second goal of the third initial strategy is aimed at phasing out CO2 emission as soon as possible, consistent with the Paris Agreement goal. This development has helped to create the much-needed certainty for the industry and opened ways for stronger CO2 mitigation policies to be adopted as part of the strategy that will be announced in 2023.
Decisions in the coming years at the IMO could include the adoption of a carbon pricing scheme for global shipping, thus leaving it to the market to allocate resources optimally. A carbon price has the potential to reduce the price gap between conventional and more sustainable fuel options. Using the example of wind assistance, calculations by Lloyd’s Register show that technologies with a 10% fuel savings potential would become commercially viable only at higher fuel prices from 1000 USD/metric ton [60]. For instance, with the adoption of a carbon price, wind assistance could become an interesting option, especially if prices of alternative fuels are high. Receipts from a carbon-pricing scheme could fund further research and development in green shipping or ship retrofitting programs. Many countries still lack the economic and institutional resources to face radical decarbonization and implement and enforce new regulations effectively. Therefore, such a fund could also assist in transposing regulations and mitigating adverse impacts of decarbonization on trade in least-developed countries and small island developing states, for example, through compensation or technical assistance. Finally, the nature and function of the target are also important characteristics that will shape how decarbonization will progress considering uncertain future developments. Some research has highlighted that a floating target would have the necessary flexibility to encompass uncertainties in future maritime trade volumes, thereby mitigating quota volatility [3].
Although a large number of measures that could increase energy efficiency are available at negative net costs, available options often require high upfront investments [61]. A possible way to overcome high upfront investments and long payback times of technologies is the “savings as a service” model in which technology is rented and paid for entirely out of fuel savings [62]. Furthermore, with the recent adoption of the IMO target, companies that were delaying their investments in low-carbon technologies will have to adapt their business strategies to ensure sustainability and profitability in the longer term. They can start joining other companies which have proactively engaged in the development of greener technologies and identified a clear business case for doing so [56]. For instance, cargo owners have increasingly demanded higher transparency on environmental performance from carriers. A type of emerging technology push has also been observed in the LNG and biofuels sector that manifests itself in joint initiatives by governments and industry in order to develop new revenue streams [28]. On the financial side, initiatives such as the Task Force on Climate-related Financial Disclosures (TCFD) have provided additional transparency and company information on climate-related issues that investors and asset managers use for their investment decisions in order to avoid risks of stranded carbon assets. Split incentives between charterers and ship owners could be mitigated by longer charter contracts.
The barriers that prevent the market from spontaneously moving towards decarbonization might also require additional incentives and fiscal instruments. National or regional incentive schemes could complement carbon pricing at a global level. Applying stricter targets at a national or regional level first (patchwork approach) has been argued to play a catalytic role for progress on a global level and should not be despised as “illegitimate unilateralism” [3]. Governments could provide financial incentives for green shipping, e.g., via public procurement and temporary exemptions of electricity taxes for electric ships, or reduce trade tariffs for energy-efficient technologies [63]. In turn, electricity (either directly used for ship propulsion or for synthetic fuel production) could be bound to renewable portfolio standards found, for instance, in Germany and Chile [41]. Government action might also entail collaboration with financial institutions such as domestic or international development banks to create targeted financial instruments for green shipping, similar to existing schemes of the European Investment Bank. To improve access to finance for companies willing to adopt low-carbon technology, governments also have the possibility to create favorable conditions for financial instruments such as “Blue Bonds” that aim to channel private finance towards “green” shipping. If carefully designed, supplementary policies can be helpful in addressing market barriers and the burden of a potential carbon price. Given the high upfront costs to adapt to increasingly stringent environmental objectives, transitional assistance for some industries may be appropriate. This can include, for instance, support for technological research and development and implementation, as well as delivering the necessary low-carbon infrastructure (i.e., for sustainable biofuels and synthetic fuels). Furthermore, actions taken should be decided in close consultation with industry stakeholders and ports in order to avoid undesired and unforeseen economic effects. This should, however, take into account eventual risks of regulatory capture.
Transition towards a low-carbon shipping sector also implies developing adequate regulations and standards for technological measures and fuels, which could be the result of joint efforts by governments, as well as the naval and fuel industries. The need for carbon pricing would be less imminent if strong standards would be developed. For example, low-carbon fuel standards could be developed for the shipping sector, similar to the fuel standards that have been developed for road transport in many countries [28]. For example, this could also encompass wider adoption of more reliable fuel consumption and CO2 emissions monitoring systems, which—if harmonized on an international level—can better inform performance evaluations of certain technologies and subsequent investment decisions [55]. However, while sensor technologies used on ships generate a vast array of data, these operational and technical insights are not often publicly available for investors, analysts, or researchers. This could be solved by developing a protocol to pool data on a platform without compromising business secrets [3], which nonetheless would require a great amount of collective action. A similar effort has already been made in the manufacturing sector [64].
Many new technologies and alternative fuels still require research and development, particularly to develop their commercial viability. Moreover, operational procedures would need to become streamlined and harmonized to ensure safety and interoperability. For instance, there is no standardized design and fueling procedure for hydrogen-powered ships and its bunkering infrastructure and remaining safety design issues with regards to the volatility of the fuel need to be resolved [14,36]. The low energy density of hydrogen requires very sizeable fuel tanks, which increase the capital cost and may reduce cargo space in commercial shipping. In addition, if relevant volumes of synthetic fuels, such as hydrogen and ammonia, are used by 2035, it would be essential to ensure that production processes are based on renewable electricity generation. Otherwise, no improvement in CO2 emissions compared to conventional HFO could be guaranteed.

7. Conclusions

This paper examines the technical possibility of achieving the ambitious 1.5° goal of the Paris Agreement and the required supporting policy measures. We found that maximum deployment of technologies that are currently available could make it possible to reach almost full decarbonization by 2035. We formulated four possible decarbonization pathways for shipping, which foresee remaining carbon emissions ranging from 44 to 156 million tonnes by 2035 with CO2 emission reduction ranging from 82 to 95% of the projected 2035 level. A major part of the required reductions could be realized via alternative fuels and renewable energy. Technological measures are available to increase the energy efficiency of ships and could yield a substantial part of emission reductions. Finally, operational measures could also achieve an important share of the required emission reductions.
Government intervention can help to accelerate the commercial viability and technical feasibility of certain measures. Various policies or regulations could support the shift to zero-carbon operations, including more stringent energy efficiency targets, a speed limit, and a low-carbon fuel standard. These policies could be introduced globally and by IMO member states. Governments and ports could provide necessary infrastructure, e.g., for shore power facilities, electric charging systems, and bunkering facilities for alternative fuels. Governments could also encourage green shipping domestically, stimulate research and development on zero-carbon technologies, and design programmes to increase commercial viability of these technologies. Financial institutions could develop green finance programmes to stimulate sustainable shipping. Shippers could be further encouraged to assess the carbon footprint of their supply chain and target zero-carbon shipping options.
Financial incentives are essential to reducing the price gap between conventional and more sustainable fuel options. These incentives could include adopting a carbon price for global shipping, leaving it to the market to allocate resources to maximum effect. Receipts from such a scheme could also be used (in part) for further decarbonization of the sector, e.g., to facilitate research and development in green shipping, facilitate ship retrofit programmes, and compensate for potential adverse trade impacts in least-developed countries and small island developing states. Carbon pricing at a global level could be complemented with incentive schemes at the national or regional level. Governments could also provide financial incentives for green shipping, e.g., greening the procurement of maritime transport falling under public service agreements, temporary exemptions of electricity taxes for electric ships, etc. Ports could also provide financial incentives for green shipping via differentiation of their port fee tariffs based on environmental criteria. Governments might partner with financial institutions or encourage domestic development banks to develop targeted financial instruments for green shipping.

Author Contributions

R.A.H. led the drafting and quantitative analysis of the article. He conceptualized the analytical framework used to assess the impact of CO2 mitigation measures, and implemented and validated the model. Furthermore, he also analyzed different scenarios presented in this article. L.M.M. developed the earlier version of the ITF International Freight Model and supervised the methodology used in this article. L.K., R.A.H., O.M. conducted a literature review and collected data used for policy analysis. The original draft was prepared and written by R.A.H., L.K., and O.M. L.M., L.K. and O.M. reviewed and edited the article. Finally, O.M. acquired the funding of the project, and provided supervision for the project.

Funding

This research was made possible by the European Climate Foundation through a voluntary contribution to the International Transport Forum.

Acknowledgments

Valuable comments on a draft version of the article were provided by Stephen Perkins, Jari Kauppila (ITF), Tristan Smith (UCL Energy Institute), and Renske Schuitmaker (International Energy Agency). Francisco Furtado contributed to the validation of the model.

Conflicts of Interest

The authors declare no conflict of interest. The funding sponsors had no role in the design of the study; in the collection, analyses, or interpretation of data; and in the decision to publish the results.

Appendix A. Model Validation

Table A1. Validation of mode share by weights.
WeightModel Output for 2011 (Million Tones)Available Statistics (Million Tones)Source
Air31.9331.8ICAO report 2010
Sea85798784UNCTAD Review of Maritime Transport 2011
Road1352-
Rail289-
Sources: [65,66].
Table A2. Validation of transport demand by modes.
International Transport DemandModel Output 2011 (Billion Tonne km)Reference (Billion Tonne km)SourceMode Share (%)
Maritime75 55175 022UNCTAD review of Maritime Transport 201690
Air155146ICAO, WB0.3
Road6 642- 7.8
Rail1 875- 2.2
Sources: [67,68].

Appendix B. Supplementary Data

Figure A1. Historical (1996–2015) and estimated (2016–2035) changes in ship size.
Sustainability 10 02243 g0a1
Table A3. Emission factors of different fuel types.
Fuel TypeEmission Factors (kgCO2/MJ)
HFO0.081
MDO/MFO0.072
LNG0.810
Hydrogen0
Biodiesel0.522
Ammonia0
Sources: IEA.

References

  1. Smith, T.; Jalkanen, J.; Anderson, B.; Corbett, J.; Faber, J.; Hanayama, S.; Pandey, A. Third Imo Greenhouse Gas Study 2014. 2014, p. 327. Available online: http://www.imo.org/en/OurWork/Environment/PollutionPrevention/AirPollution/Documents/Third%20Greenhouse%20Gas%20Study/GHG3%20Executive%20Summary%20and%20Report.pdf. [PubMed]
  2. Cames, M.; Graichen, J.; Siemons, A.; Cook, V. Emission reduction targets for international aviation and shipping. In Directorate General for Internal Policies; European Parliament—Policy Department A; Economic and Scientific Policy: Bruxelles, Belgium, 2015. [Google Scholar]
  3. Wan, Z.; el Makhloufi, A.; Chen, Y.; Tang, J. Decarbonizing the international shipping industry: Solutions and policy recommendations. Mar. Pollut. Bull. 2018, 126, 428–435. [Google Scholar] [CrossRef] [PubMed] [Green Version]
  4. Raucci, C.; Prakash, V.; Rojon, I.; Smith, T.; Rehmatulla, N.; Mitchell, J. Navigating Decarbonisation: An Approach to Evaluate Shipping’s Risks and Opportunities Associated with Climate Change Mitigation Policy; UMAS: London, UK, 2017. [Google Scholar]
  5. GL, D. Low Carbon Shipping Towards 2050. Available online: www.dnvgl.com/publications/low-carbon-shipping-towards-2050-93579 (accessed on 20 February 2018).
  6. IEA. Energy Technology Perspectives 2017; IEA: Paris, Farnce, 2017. [Google Scholar]
  7. Smith, T.; Raucci, C.; Hosseinloo, S.H.; Rojon, I.; Calleya, I.; De La Fuente, S.; Wu, P.; Palmer, K. CO2 Emissions from International Shipping: Possible Reduction Targets and Their Associated Pathways; UMAS: London, UK, 2016. [Google Scholar]
  8. LR/UMAS. Zero-Emission Vessels 2030. How Do We Get There? UMAS/Lloyd’s Register: London, UK, 2018. [Google Scholar]
  9. Environment, T. Statistical Analysis of the Energy Efficiency Performance (EEDI) of New Ships; Transport and Environment: Brussel, Belgium, 2017. [Google Scholar]
  10. Hoen, M.; Faber, J. Estimated Index Values of Ships 2009–2016: Analysis of the Design Efficiency of Ships that Have Entered the Fleet Since 2009; CE Delft: Delft, The Netherlands, 2017. [Google Scholar]
  11. Bouman, E.A.; Lindstad, E.; Rialland, A.I.; Strømman, A.H. State-of-the-art technologies, measures, and potential for reducing GHG emissions from shipping—A review. Transp. Res. Part D Transp. Environ. 2017, 52, 408–421. [Google Scholar] [CrossRef]
  12. Gilbert, P.; Bows-Larkin, A.; Mander, S.; Walsh, C. Technologies for the high seas: Meeting the climate challenge. Carbon Manag. 2015, 5, 447–461. [Google Scholar] [CrossRef]
  13. IMarEST. Marginal Abatement Costs and Cost Effectiveness of Energy-Efficiency Measures; IMO Document MEPC 62/INF.7: London, UK, 2011. [Google Scholar]
  14. Lindstad, H.; Eskeland, G.S. Low carbon maritime transport: How speed, size and slenderness amounts to substantial capital energy substitution. Transp. Res. Part D Transp. Environ. 2015, 41, 244–256. [Google Scholar] [CrossRef]
  15. Rehmatulla, N.; Calleya, J.; Smith, T. The implementation of technical energy efficiency and CO2 emission reduction measures in shipping. Ocean Eng. 2017, 139, 184–197. [Google Scholar] [CrossRef]
  16. Carlton, J.; Aldwinkle, J.; Anderson, J. Future Ship Powering Options: Exploring Alternative Methods of Ship Propulsion; Royal Academy of Engineering: London, UK, 2013. [Google Scholar]
  17. Tillig, F.; Mao, W.; Ringsberg, J. Systems Modelling for Energy-Efficient Shipping; Chalmers University of Technology: Gothenburg, Sweden, 2015. [Google Scholar]
  18. Van Kluijven, P.C.; Kwakernaak, L.; Zoetmulder, F. Contra-Rotating Propellers; Rotterdam Mainport University of Applied Sciences RMU: Rotterdam, The Netherlands, 2013. [Google Scholar]
  19. Faber, J.; Huigen, T.; Nelissen, D. Regulating Speed: A Short-Term Measure to Reduce Maritime GHG Emissions; CE Delft: Delft, The Netherlands, 2017. [Google Scholar]
  20. Golias, M.M.; Saharidis, G.K.; Boile, M.; Theofanis, S.; Ierapetritou, M.G. The berth allocation problem: Optimizing vessel arrival time. Marit. Econ. Logist. 2009, 11, 358–377. [Google Scholar] [CrossRef]
  21. Kiani, M.; Bonsall, S.; Wang, J.; Wall, A. A break-even model for evaluating the cost of container ships waiting times and berth unproductive times in automated quayside operations. WMU J. Marit. Aff. 2006, 5, 153–179. [Google Scholar] [CrossRef]
  22. Lindstad, H.; Asbjørnslett, B.E.; Strømman, A.H. Reductions in greenhouse gas emissions and cost by shipping at lower speeds. Energy Policy 2011, 39, 3456–3464. [Google Scholar] [CrossRef]
  23. Lindstad, H.; Asbjørnslett, B.E.; Strømman, A.H. The Importance of economies of scale for reductions in greenhouse gas emissions from shipping. Energy Policy 2012, 46, 386–398. [Google Scholar] [CrossRef]
  24. Lindstad, H. Strategies and Measures for Reducing Maritime CO2 Emissions; NTNU: Trondheim, Norway, 2013. [Google Scholar]
  25. Psaraftis, H.N.; Kontovas, C.A. Ship speed optimization: Concepts, models and combined speed-routing scenarios. Transp. Res. Part C Emerg. Technol. 2014, 44, 52–69. [Google Scholar] [CrossRef] [Green Version]
  26. ITF. The Impact of Mega-Ships; ITF/OECD: Paris, France, 2015. [Google Scholar]
  27. Merk, O. Shipping Emissions in Ports; ITF/OECD: Paris, France, 2014. [Google Scholar]
  28. ITF. Decarbonising Maritime Transport: Pathways to Zero-Carbon Shipping by 2035; ITF/OECD: Paris, France, 2018. [Google Scholar]
  29. Anderson, M.; Salo, K.; Fridell, E. Particle-and gaseous emissions from an LNG powered ship. Environ. Sci. Technol. 2015, 49, 12568–12575. [Google Scholar] [CrossRef] [PubMed]
  30. Bicer, Y.; Dincer, I. Clean fuel options with hydrogen for sea transportation: A life cycle approach. Int. J. Hydrog. Energy 2018, 43, 1179–1193. [Google Scholar] [CrossRef]
  31. GL, D. DNV GL Handbook for Maritime and Offshore Battery Systems; DNV GL: Oslo, Norway, 2016. [Google Scholar]
  32. Hsieh, C.; Felby, C. Biofuels for the Marine Shipping Sector, An Overview and Analysis of Sector Infrastructure, Fuel Technologies and Regulations; IEA Bioenergy: Paris, France, 2017. [Google Scholar]
  33. Traut, M.; Gilbert, P.; Walsh, C.; Bows, A.; Filippone, A.; Stansby, P.; Wood, R. Propulsive power contribution of a kite and a Flettner rotor on selected shipping routes. Appl. Energy 2014, 113, 362–372. [Google Scholar] [CrossRef]
  34. Veerbeek, R.; Ligterink, N.; Meulenbrugge, J.; Koornneef, G.; Kroon, P.; de Wilde, H.; Kampman, B.; Croezen, H.; Aarnink, S. Natural Gas in Transport: An Assessment of Different Routes; CE Delft: Delft, The Netherlands, 2013. [Google Scholar]
  35. Smith, T. Why LNG as the Ship Fuel of the Future is a Massive Red Herring. Available online: http://splash247.com/lng-ship-fuel-future-massive-red-herring/ (accessed on 28 March 2017).
  36. GL, D. Study on the Use of Fuel Cells in Shipping; Study Commissioned by the European Maritime Safety Agency: Lisbon, Portugal, 2017. [Google Scholar]
  37. Teeter, J.L.; Cleary, S.A. Decentralized Oceans: Sail—Solar Shipping for Sustainable Development in Sids; Natural Resources Forum; Wiley Online Library: New York, NY, USA, 2014; pp. 182–192. [Google Scholar]
  38. Swartz, J. China’s national emissions trading system. In ICTSD Series on Climate Change Architecture; ICTSD: Geneva, Switzerland, 2016; pp. 20–23. [Google Scholar]
  39. GL, D. EU MRV Regulation. Available online: www.dnvgl.com/maritime/eu-mrv-regulation/index.html (accessed on 28 March 2018).
  40. Environment, T. Decarbonising Shipping Sector in EU: ETS Maritime Climate Fund and 2030 Targets; Transport & Environment: Brussel, Belgium, 2017. [Google Scholar]
  41. CPLP. What is Carbon Pricing? Available online: https://www.carbonpricingleadership.org/what/ (accessed on 28 March 2018).
  42. Schipper, L.; Marie-Lilliu, C.; Gorham, R. Flexing the Link between Transport and Greenhouse Gas Emissions—A Path for the World Bank; International Energy Agency: Paris, France, 2000. [Google Scholar]
  43. Chateau, J.; Dellink, R.; Lanzi, E. An Overview of the OECD ENV-Linkages Model; OECD: Paris, France, 2014. [Google Scholar]
  44. Ben-Akiva, M.; Bierlaire, M. Discrete Choice Methods and their Applications to Short Term Travel Decisions. In Handbook of Transportation Science; Hall, R., Ed.; Springer: New York, NY, USA, 1999; Volume 23, pp. 5–33. [Google Scholar]
  45. Halim, R.; Kwakkel, J.; Tavasszy, L.A. A scenario discovery study of the impact of uncertainties in the global container transport system on European ports. Futures 2016, 81, 148–160. [Google Scholar] [CrossRef] [Green Version]
  46. Tavasszy, L.A.; Minderhoud, M.; Perrin, J.-F.; Notteboom, T. A Strategic Network Choice Model for Global Container Flows: Specification, Estimation and Application. J. Transp. Geogr. 2011, 19, 1163–1172. [Google Scholar] [CrossRef]
  47. UNCTAD. Review of Maritime Transport 2013; UNCTAD: Geneva, Switzerland, 2013. [Google Scholar]
  48. LR/UMAS. Global Marine Technology Trends 2030; Lloyd’s Register: London, UK, 2017. [Google Scholar]
  49. International Energy Agency. Momo ETP 2014; IEA Energy Technology Policy Division: Paris, France, 2014. [Google Scholar]
  50. IEA. World Energy Outlook 2017; International Energy Agency: Paris, France, 2017. [Google Scholar]
  51. VDKi. First estimation of World trade, consumption and import of hard coal in 2015. In Press Release No. 02/2016; VDKi: Hamburg, Germany, 2016. [Google Scholar]
  52. IMF. Direction of Trade Statistics (DOTS). Available online: www.data.imf.org/?sk=9D6028D4-F14A-464C-A2F2-59B2CD424B85 (accessed on 22 January 2018).
  53. Finance, B.N.E. Lithium-Ion Battery Costs and Market: Squeezed Margins Seek Technology Improvements and New Business Models. Available online: https://data.bloomberglp.com/bnef/sites/14/2017/07/BNEF-Lithium-ion-battery-costs-and-market.pdf (accessed on 5 March 2018).
  54. Stern, N. Stern Review on the Economics of Climate Change; HM Treasury: London, UK, 2006; Volume 30. [Google Scholar]
  55. Rehmatulla, N.; Parker, S.; Smith, T.; Stulgis, V. Wind technologies: Opportunities and barriers to a low carbon shipping industry. Mar. Policy 2017, 75, 217–226. [Google Scholar] [CrossRef]
  56. ITF. Reducing Shipping GHG Emissions: Lessons from Port-Based Incentives; ITF/OECD: Paris, France, 2018. [Google Scholar]
  57. Costantini, V.; Crespi, F.; Martini, C.; Pennacchio, L. Demand-pull and technology-push public support for eco-innovation: The case of the biofuels sector. Res. Policy 2015, 44, 577–595. [Google Scholar] [CrossRef]
  58. Mitchell; Rehmatulla, N. Dead in the Water. In Proceedings of the Shipping in Changing Climates (SCC) Conference, London, UK, 24 November 2015. [Google Scholar]
  59. Porter, M.E.; Van der Linde, C. Toward a new conception of the environment-competitiveness relationship. J. Econ. Perspect. 1995, 9, 97–118. [Google Scholar] [CrossRef]
  60. LR. Wind-Powered Shipping: A Review of the Commercial, Regulatory and Technical Factors Affecting Uptake of Wind-Assisted Propulsion; Lloyd’s Register Marine: London, UK, 2015. [Google Scholar]
  61. Buhaug, Ø.; Corbett, J.; Endresen, Ø.; Eyring, V.; Faber, J.; Hanayama, S.; Lee, D.; Lee, D.; Lindstad, H.; Markowska, A. Second IMO GHG Study 2009; IMO: London, UK, 2009. [Google Scholar]
  62. Alliance, S.G.S. Shipping Systems Fit for the Future. Available online: https://www.smartgreenshippingalliance.com/ (accessed on 29 March 2018).
  63. Rehmatulla, N.; Smith, T.; Tibbles, L. The relationship between EU’s public procurement policies and energy efficiency of ferries in the EU. Mar. Policy 2017, 75, 278–289. [Google Scholar] [CrossRef]
  64. Kusiak, A. Smart manufacturing. Int. J. Prod. Res. 2018, 56, 508–517. [Google Scholar] [CrossRef]
  65. UNCTAD. Review of Maritime Transport 2011; UNCTAD: Geneva, Switzerland, 2011. [Google Scholar]
  66. ICAO. Annual Report of the Council; ICAO: Montreal, QC, Canada, 2011. [Google Scholar]
  67. UNCTAD. Review of Maritime Transport 2016; UNCTAD: Geneva, Switzerland, 2016. [Google Scholar]
  68. Bank, T.W. Air Transport, Freight. Available online: https://data.worldbank.org/indicator/IS.AIR.GOOD.MT.K1 (accessed on 2 February 2018).
Figure 1. Modeling framework used to estimate international shipping CO2 emissions.
Sustainability 10 02243 g001
Figure 2. Evolution of ships’ carbon intensity in the baseline scenario.
Sustainability 10 02243 g002
Figure 3. Visualization of CO2 emission across global shipping routes in 2015 (a) and 2035 (b).
Sustainability 10 02243 g003
Figure 4. Transport demand scenarios estimated using the ITF international freight model.
Sustainability 10 02243 g004
Figure 5. Impact of reduction in fossil fuel trade by 2035.
Sustainability 10 02243 g005
Figure 6. Fuel mix evolution between 2015 and 2035 for 80% carbon factor reduction.
Sustainability 10 02243 g006
Figure 7. “Maximum intervention” pathway.
Sustainability 10 02243 g007
Figure 8. “Zero-carbon technology” pathway.
Sustainability 10 02243 g008
Figure 9. “Ultra-slow operation” pathway.
Sustainability 10 02243 g009
Figure 10. “Low-carbon technology” pathway.
Sustainability 10 02243 g010
Figure 11. Four different decarbonization pathways for shipping.
Sustainability 10 02243 g011
Table 1. Overview of principal measures to reduce shipping’s carbon emissions.
Type of MeasuresMain Measures
TechnologicalLight materials, slender design, friction reduction, waste heat recovery
OperationalLower speeds, ship size, ship–port interface
Alternative fuels/energySustainable biofuels, hydrogen, ammonia, fuel cells, electric ships, wind assistance, solar energy
Table 2. Main technological measures and associated fuel savings potential.
MeasuresPotential Fuel Savings
Lightweight materials0–10%
Slender hull design10–15%
Propulsion improvement devices1–25%
Bulbous bow2–7%
Air lubrication and hull surface2–9%
Heat recovery0–4%
Note: Emission reduction potentials are assessed individually. Ranges roughly indicate possible fuel savings depending on varying conditions such as vessel size, segment, operational profile, route, etc., hence limiting the possibilities for comparison. Numbers cannot be cumulated without considering potential interactions between the measures. Sources: [7,11,12,13,14,15,16,17,18].
Table 3. Main operational measures and whole-fleet CO2 reduction potential.
MeasuresCO2 Emissions Reduction Potential
Speed0–60%
Ship size and capacity utilization0–30%
Ship–port interface0–1%
Onshore power0–3%
Note: Emission reduction potentials concern the cumulative reduction potential for the entire ship fleet. Numbers cannot be cumulated without considering potential interactions between the measures. Sources: [1,7,19,20,21,22,23,24,25].
Table 4. Main alternative fuels and energy, and associated fuel savings potential.
MeasuresPotential Fuel Savings
Advanced biofuels25–100%
Synthetic fuels (hydrogen and ammonia)0–100%
Liquid natural gas (LNG)0–20%
Fuel cells2–20%
Electricity and hybrid propulsion10–100%
Wind assistance1–32%
Note: Emission reduction potentials are assessed individually. Ranges roughly indicate possible fuel savings depending on varying conditions such as vessel size, segment, operational profile, route, weather conditions, etc., hence limiting the possibilities for comparison. Numbers cannot be cumulated without considering potential interactions between the measures. Considering upstream emissions of synthetic fuels and electricity, an almost 100% emission reduction can be reached only if generated from renewable energy sources. Sources: [7,11,29,30,31,32,33,34].
Table 5. Main types of measures to reduce shipping’s carbon emissions.
Type of MeasuresMain Measures
Technological (based on Smith et al., 2016)Contra rotating propeller, air lubrication, main engine turbo compounding propeller, aux turbo compounding series, Organic Rankine Cycle waste heat recovery, Flettner rotors, kites, engine derating, speed control of pumps and fans, block coefficient improvement
OperationalLower speeds, ship size increase, ship–port interface
Alternative fuels/energyLiquefied natural gas (LNG), advanced biofuels, hydrogen, ammonia, electric ships, wind assistance
Table 6. Four potential decarbonization pathways and their components.
PathwayOperational MeasuresTechnical MeasuresCarbon Factor Reduction Due to Alternative FuelsElectric Ship Penetration
“Maximum intervention”MaximumMaximum80%10%
“Zero-carbon technology”ModerateMaximum80%10%
“Ultra-slow operation”MaximumMaximum50%-
“Low-carbon technology”ModerateMaximum75%-
Table 7. Total CO2 emission reductions by 2035 for the four decarbonization pathways.
PathwaysCO2 Reduction (in Million Tonnes)Reduction Percentage (%)
Maximum intervention81095
Zero-carbon technology79893
Ultra-slow operation69882
Low-carbon technology73186
Table 8. Impact of increased sea transport cost on modal share of China–Europe transport.
Baseline 2030 (MTonnes)Share (%)100% Increase in Maritime Transport Cost (MTonnes) Share (%)Difference in Share (%)Differences in Weights (MTonnes)
Air 2.590.412.820.440.040.22
Rail 51.258.0759.059.301.237.80
Road13.232.0813.902.190.110.67
Sea567.8089.44559.1088.07−1.37−8.70
Table 9. Impact of increased sea transport cost on modal share of international freight transport.
Baseline 2030 (MTonnes)Share (%)100% Increase in Maritime Transport Cost (MTonnes)Share (%)Difference in Share (%)Differences in Weights (MTonnes)
Air 700.33720.340.012.60
Rail 5982.846112.900.0613.17
Road253912.06255712.150.0917.92
Sea17,81384.6517,78084.49−0.16−33.70
Waterways220.11220.110.000.01
Table 10. Impact of increased sea transport cost on maritime transport activities and CO2 emissions.
2020202520302035
Baseline (Billion Tkm)91,187.14105,690.92122,416.98142,131.47
Increased maritime transport (Billion Tkm)91,095.96105,574.66122,257.83141,932.49
Difference (Billion Tkm)91.19116.26159.14198.98
CO2 emission (Ktonnes)89793611081196

