The Relationship between Tourism, Carbon Dioxide Emissions, and Economic Growth in the Yangtze River Delta, China


1
Department of Tourism Management, Jinling Institute of Technology, Nanjing 210038, China
2
Department of Tourism, Recreation & Sport Management, University of Florida, Gainesville, FL 32611-8208, USA
*
Author to whom correspondence should be addressed.
Sustainability 2018, 10(7), 2118; https://doi.org/10.3390/su10072118
Submission received: 23 May 2018
/
Revised: 15 June 2018
/
Accepted: 17 June 2018
/
Published: 21 June 2018
Abstract
:Quantifying the dynamics of regional tourism in a low-carbon economy context is a pivotal issue to develop energy policies, and to decompose the national carbon abatement. Based on a case study approach for the Yangtze River Delta (YRD), China, the relationship between tourism, carbon dioxide (CO2) emissions, and economic growth were examined. The bottom-up approach, decoupling analysis, and Logarithmic Mean Divisia Index (LMDI) decomposition were integrated and applied. The results from 2001 to 2015 indicated that tourism-induced energy consumption and CO2 emissions in YRD increased from 896.90 × 10⁸ MJ to 3207.40 × 108 MJ, and 673.55 × 10⁴ t to 2152.27 × 104 t, respectively. Tourism-related transport from Shanghai was the major contributor towards emissions. The decoupling relation between CO2 emissions and economic growth, in general, were desirable in YRD’s tourism, except in 2004. However, the situation in Shanghai was complicated. Additionally, industry size and expenditure size effect were principal factors to promote carbon emissions growth, whereas energy intensity, spatial structure, and sectorial structure had negative effects. Key issues for policymakers have been highlighted and discussed.
1. Introduction
Tourism has been one of the key drivers to the anthropogenic component of global warming [1,2], which is predicted to contribute about 7.5% of global CO2 emissions in 2035 [3]. Given the goal of 50% mitigation of greenhouse gases by 2050 that was established during the G8 (Group of Eight countries) summit [4], the tourism industry must substantially reduce carbon emissions and adopt a low-carbon economy approach [5,6]. However, this requires a concerted effort from all countries, and is dependent on the linkage between tourism, energy-related CO2 emissions, and economic growth [7,8,9].
The momentum towards a low-carbon economy has become an emergent topic in tourism [10,11,12,13,14], as evident via numerous research focused on the following: (i) total amount of tourism-induced energy consumption and CO2 emissions [15,16]; (ii) energy-related CO2 emissions from tourism at different spatial scales [17,18]; (iii) assessment methods of CO2 emissions from tourism [19,20,21,22]; (iv) relationships between tourism, carbon emissions, and economic development [8,23,24]; and (v) policies and counter-measures in energy savings and emissions reduction from the tourism sector and its subsectors [25,26,27,28]. While there is burgeoning research during the past decade, most studies have been limited to a singular focus within a prescribed year(s) in time, and apply survey data [9,29]. Hence, additional research is needed due to the limited quantitative understanding associated with low-carbon economy and tourism, such as:
- (i)
- Relative relationship between tourism-induced CO2 emissions and economic growth. This can be measured by the decoupling of carbon emissions to reveal the status of tourism development within a low-carbon economy approach. Decoupling index was proposed to evaluate the connection between economic change and environmental pressures [30,31], which can also be extended to determine the link between economic development and environmental changes induced by tourism growth.
- (ii)
- Separate effects of tourism on CO2 emissions to highlight the underlying factors to influence emissions, which can be investigated by the Logarithmic Mean Divisia Index (LMDI) decomposition method. This method has been preferred to explore the key factors that contribute to changes caused due to economic growth, environment pressures, and social development [29,32,33]. Collectively, these two issues provide a comprehensively quantitative basis to assess the linkage of tourism, carbon emissions, and economic growth. Furthermore, there is still very limited application in the use of decoupling analysis and LMDI decomposition within the tourism sector and subsectors [24,33].
The importance of energy consumption, carbon emissions and economic development in the tourism sector is currently being emphasized in large economies such as China. In 2016, the number of Chinese inbound, outbound, and on domestic routes were 138 million, 122 million, and 4.44 billion [34], which were 1.65, 11.65, and 5.96 times more than in 2000, respectively [35]. Such large-scale and continuous growth in tourism inevitably leads to substantial energy use and carbon emissions [9]. As one of the key contributors to global carbon emissions, China is faced with a major conundrum between rapid development versus emissions reduction in the quest for a low-carbon tourism economy [6,36,37,38].
Additionally, there is a paucity of research along with reliable findings to comprehensively assess the low-carbon tourism economy in China. More specifically, the relationships between tourism, carbon emissions, and economic growth have not been well recognized [25,39]. While recent studies on carbon emissions from the tourism sector exist at the national scale [16,39], longitudinal time-series data across various provinces, municipalities, and autonomous regions are limited [18,32,40]. Therefore, there exists a need to evaluate the low-carbon tourism economy on a regional basis in order to align towards national energy savings and emissions reduction targets [18].
Accordingly, based on a regional case study of the Yangtze River Delta (YRD), China, the purpose of this research is to explore the relationship between tourism, CO2 emissions, and economic growth. Based on the integrated application of a bottom-up approach, decoupling analysis and LMDI decomposition, three main aspects are analyzed: (i) dynamics of tourism-induced energy consumption and CO2 emissions; (ii) decoupling relation between CO2 emissions and economic growth in tourism; and (iii) separate effects of tourism on CO2 emissions. The objective is to assist in the formulation of specific and effective policies that will reduce carbon emissions due to tourism.
2. Literature Review
2.1. Tourism-Induced CO2 Emissions: Scale and Method
Studies on tourism-induced CO2 emissions have received academic attention over the past decade and have been examined at different spatial scales. Peeters and Dubois [41] found total CO2 emissions in 2005 from tourism was 1302 Mt, which accounted for 4.95% of global emissions. UNWTO-UNEP-WMO [3] estimated that tourism-related CO2 emissions contributed a range of 3.9% to 6.0% of the global emissions in 2005 (with an average of 5%). From the tourism sectors, most emissions were attributed to the travel segment, especially air transport [41,42,43]. At the national and regional scales, results have been determined based on different methods [16,44,45]. For example, in Cyprus, Katircioglu et al. [44] suggested that tourism had a direct and statistically significant effect on the level of energy consumption and CO2 emissions for the long-term economy. In New Zealand, although top-down and bottom-up methods were based on macroeconomic data and activity-based data respectively, by using both methods, Becken and Patterson [46] identified that the tourism sector contributed to similar annual energy use (between 25 and 28 PJ) and CO2 emissions (between 1400 and 1600 kt).
Likewise, in Australia, the production approach estimated total greenhouse gas emissions to be 54.4 Mt, but an expenditure-based approach yielded 61.5 Mt [20]. In addition, in Wales, an extended tourism environmental satellite account approach found that 3.28 Mt greenhouse gas emissions were generated by the tourism sector, with tourist transportation responsible for 58.5% of the total emissions [45]. In Chengdu, western China, Liu et al. [32] used an input-output approach to calculate CO2 emissions that showed 1.7–2.1 Mt. This approach was also adopted to assess tourism-induced CO2 emissions in Romania [19]. Moreover, by means of a life-cycle assessment of Penghu Island in Taiwan, Kuo and Chen [22] identified that airplanes, star hotel lodging, and motorized water activity were the greatest sources of CO2. Similarly, in Iceland, by means of an input/output-based hybrid life-cycle assessment method, the total tourism GHG emissions tripled from 2010 to 2015, with air travel that accounted for 50–82% of the impact [47].
Overall, specific statistics on tourism-induced CO2 emissions are missing at a country-level [44]. Further, there is still a lack of consensus among researchers as to the best method to measure tourism-induced CO2 emissions [22]. Hence, the system boundaries for tourism cannot be clearly identified. However, top-down and bottom-up approaches have been extensively applied in the assessment of carbon emissions from tourism largely due to availability of data [15,18].
2.2. Tourism-Induced CO2 Emissions in China
Several approaches have been employed to assess the CO2 emissions in China’s tourism industry. A preliminary attempt via a bottom-up approach was applied in 2008 [16], along with an input-output analysis [48]. Recently, a top-down approach was used to calculate the national tourism CO2 emissions for 2002, 2005, 2007, and 2010 based on a combination of Tourism Satellite Account and Input-Output model [49]. Research has also been conducted at a regional level and smaller scales [50,51], such as in Jiangsu province [52] and Chengdu city [32]. Overall, while studies have evolved from the macro-scale (national) to the meso-scale (regional) and micro-scale (individual destination), additional research is needed given the need for emissions reduction in China.
Furthermore, with respect to data and methods, China has not established a complete tourism satellite account. Also, the China Energy Statistics Yearbook does not include any specific energy use items that relate to tourism [24]. This creates challenges to use a top-bottom approach as a tool for estimation. To overcome this issue, the bottom-up analysis explores detailed information on energy use and CO2 emissions (for example, specific driving forces to promote emissions). This approach is able to meet the estimation requirements at the meso- or micro-scale, and is valuable in the development of energy conservation and emissions reduction strategies based on targeted industries [15].
2.3. Decoupling Relation between CO2 Emissions and Economic Growth in Tourism
Decoupling was introduced to the environmental sciences discipline to measure the de-linking relationship between economic growth and resource consumption. When economic growth is achieved with steady or even decreased resource consumption, it relates to the general discourse of delinking from increased environmental problems [30,53]. The Organization for Economic Co-operation and Development [54] first proposed the decoupling indicator to block the connection between economic change and environmental pollution. Since then, decoupling has been redefined and has been distinguished as eight types [30,55], but indicators lack uniformity with respect to the best method [56].
Currently, the European Union has adopted the decoupling of resource use from economic growth as a policy goal [57]. This has been widely applied to assess the relationship between economy, energy use, and environment [31,58,59]. In the tourism discipline, it has been noted that a long-run equilibrium linkage exists between tourism, carbon emissions, and economic development [44]. However, as an environmental indicator for sustainable development, there is still limited applications and findings of decoupling linkage between carbon emissions and the tourism economy [24,44,60].
2.4. Decomposition of CO2 Emissions from Tourism Effects
The aim of decomposition is to identify the effects by which CO2 emissions from tourism can be assessed along with its evolution and importance. Besides the relationship between individual tourism sectors, factors, and CO2 emissions, it should also identify the directions for policies with respect to emission reductions for low-carbon development [33]. As to the decomposition methods, based on the decomposition of a differential quantity, LMDI decomposition is proposed [61,62]. The result of this method generates no residuals and accommodates the value zero in the dataset, which can overcome the key limitations with respect to traditional decomposition methods [61,62,63,64]. The LMDI has been regarded as a preferred method, and is widely adopted for the decomposition of CO2 emissions in energy-economic study [65,66,67,68]. Additionally, it can play a role in the analysis to determine the separate effects on CO2 emissions due to energy use by the tourism industry [23,29].
3. Study Area
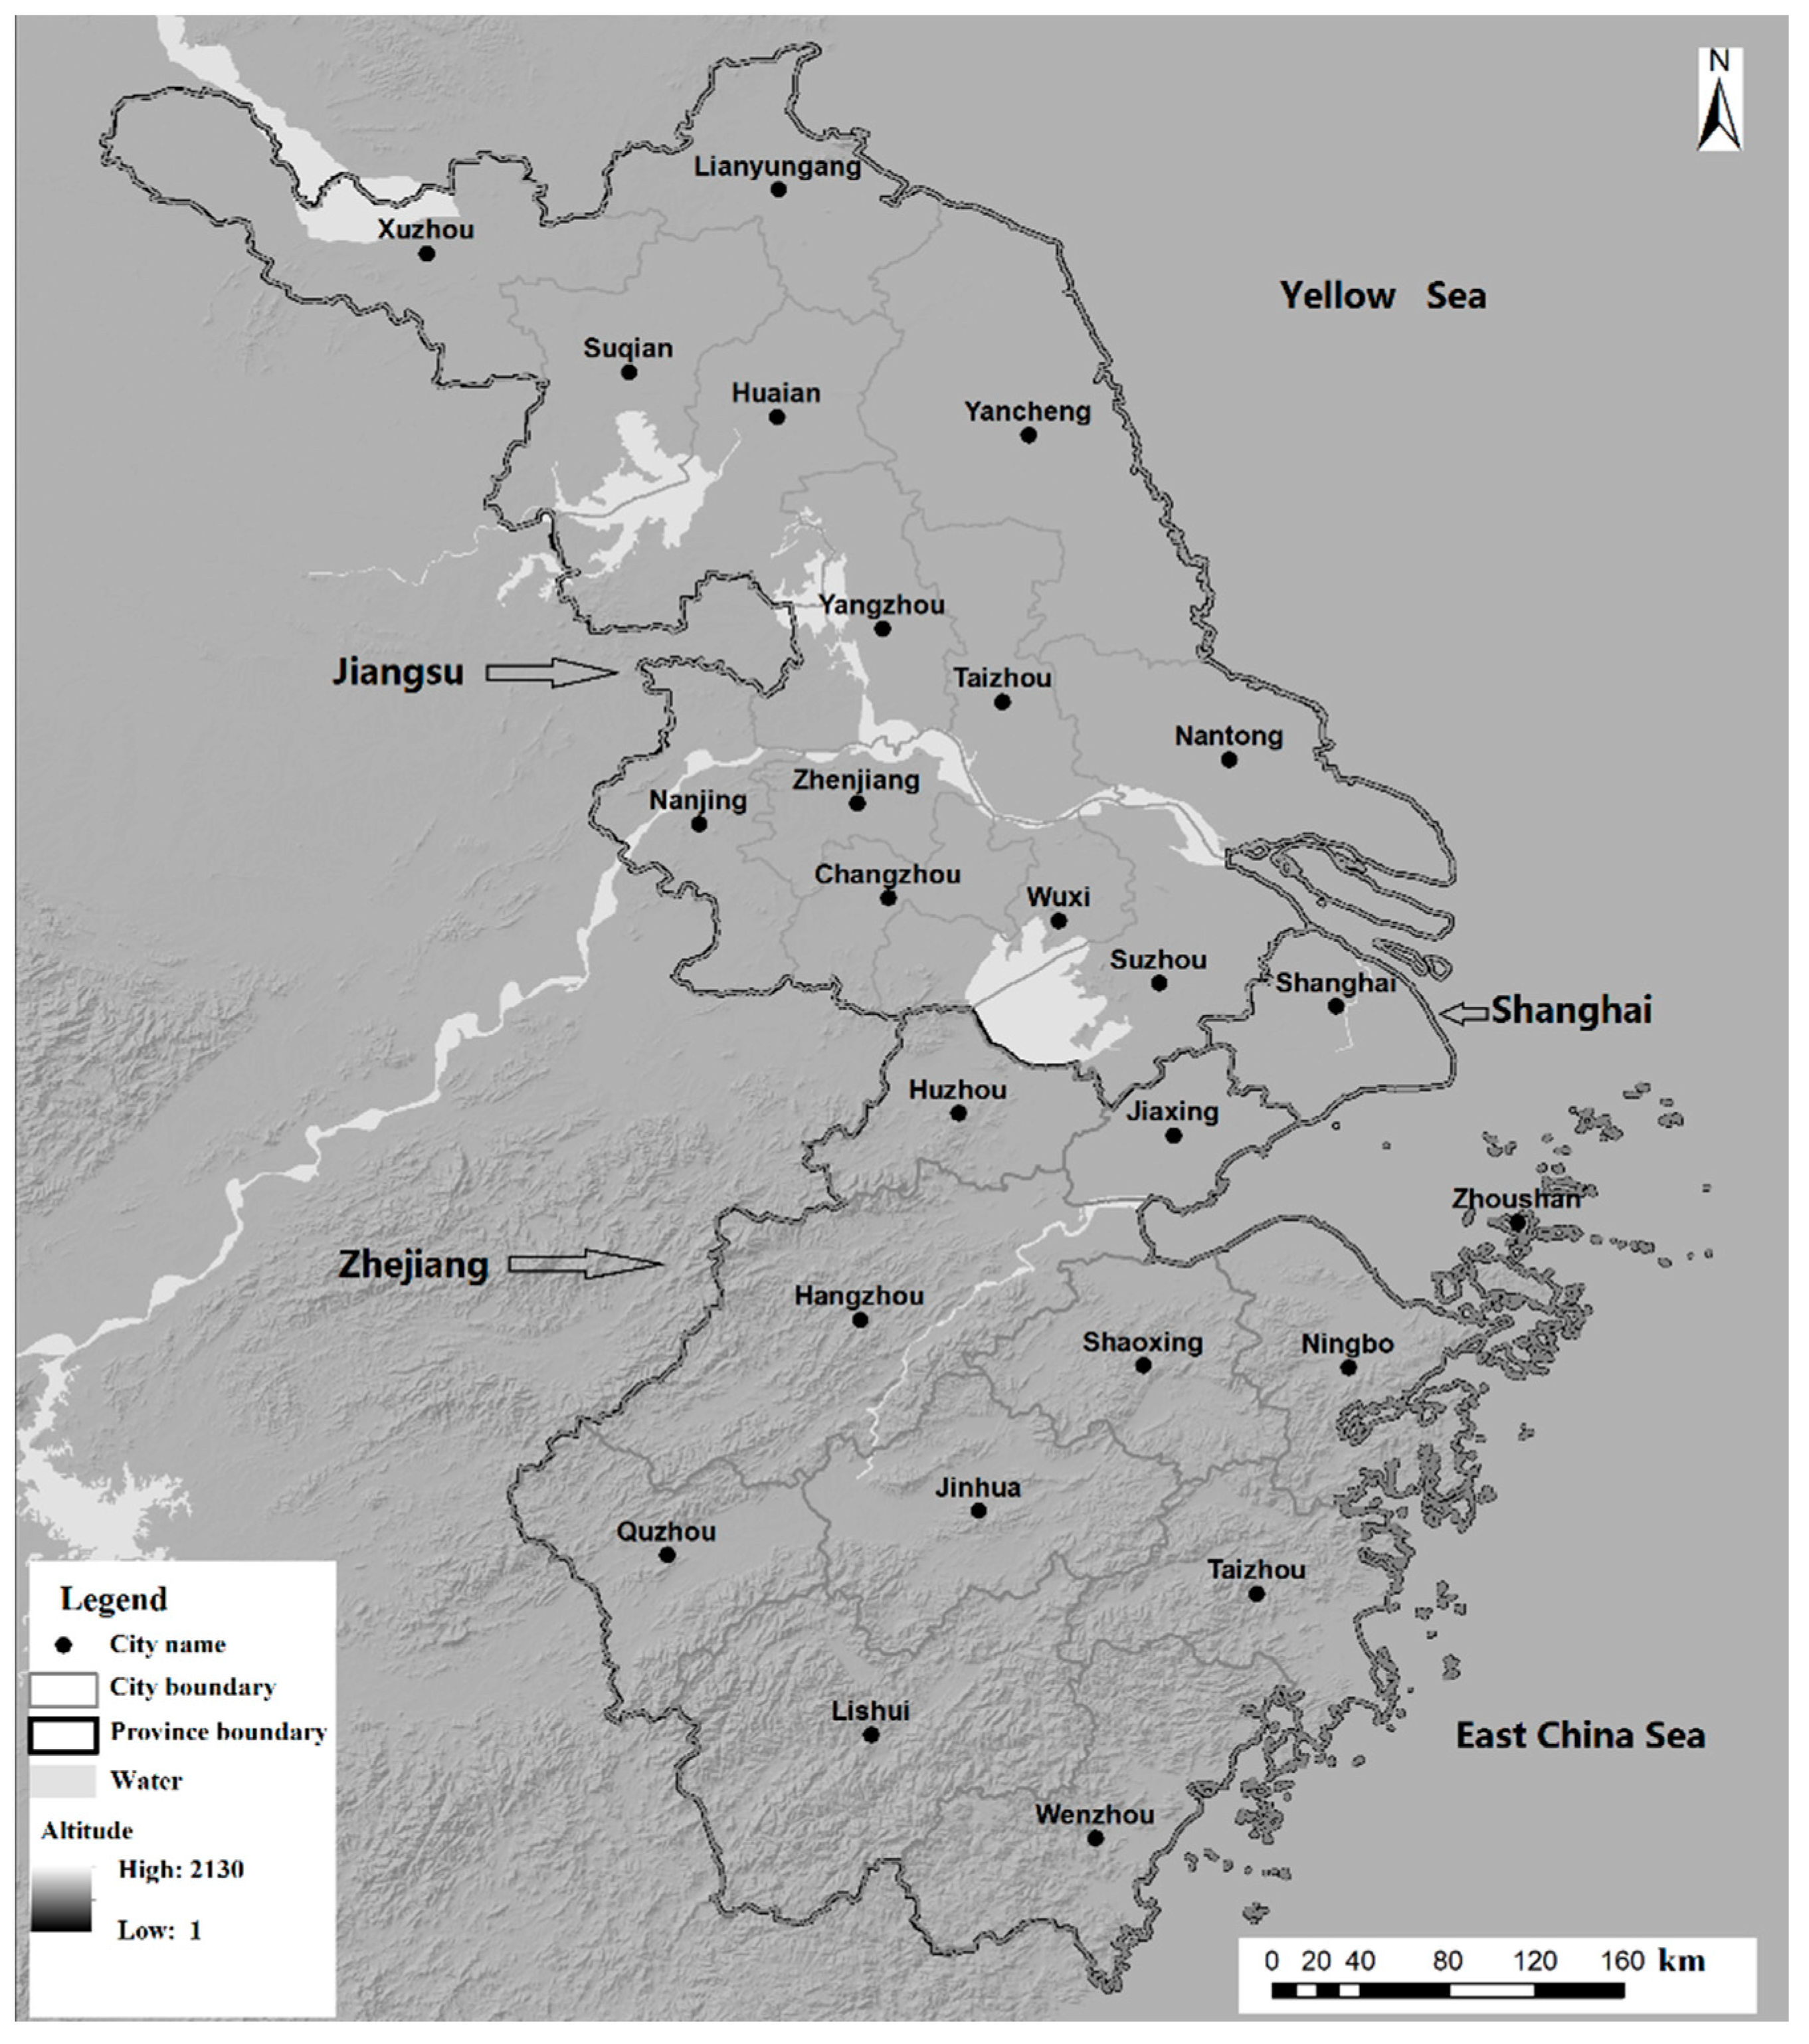
The YRD agglomeration is comprised of the Shanghai municipality and its neighboring provinces of Jiangsu in the northwest and Zhejiang in the southwest. There are 13 cities within the jurisdiction of Jiangsu and 11 cities in Zhejiang (Figure 1). The total area of YRD is more than 21.07 × 10⁴ km2 and accounts for 2.19% of China’s land area [69]. With robust economic development, the YRD region has become one of the most important economic centers, as well as the world’s sixth largest urban agglomeration.
Moreover, the rich cultural, historical, natural and other various tourist attractions have laid an important foundation for rapid tourism development, which is popularly known as the “golden triangle” in China [70]. The number of domestic and inbound tourist arrivals to the YRD has reached 1.42 billion and 21.17 million in 2015 [71], with an annual rate of growth at 13.88% and 10.32% compared with 2001, respectively [72,73,74]. Given the popularity and immense tourism growth, this region was chosen for this study to assess energy savings and emissions reduction from tourism. Moreover, given the region’s important status, achieving a low-carbon economy will offer significant contributions for the whole country.
4. Materials and Methods
4.1. Bottom-Up Approach
The tourism industry encompasses both direct and indirect energy consumption and carbon emissions. Direct energy use is derived from fossil fuels such as coal, oil, and natural gas, while the indirect is rooted in the production of various types of intermediate products for the tourism industry [16,32]. Hence, when accounting for environmental impacts, it is pragmatic to focus on tourism-related industries [16,39,46] as carbon sources mainly originate from three sectors (i.e., transport, accommodation, and activities) [3]. Thus, in this paper, direct energy use and carbon emissions were calculated along with a bottom-up approach as it begins with tourist data at the destination. The formula for direct energy consumption and carbon dioxide emissions from the aforementioned three tourism sectors is expressed as follows:
where Et and Ct indicate the amount of direct energy use and CO2 emissions from tourism in year t from YRD; Ejt is the energy consumption of the three tourism sectors, that is, tourism transport (E1t), accommodation (E2t), and activities (E3t); and Cjt denotes the CO2 emissions generated by tourism transport (C1t), accommodations (C2t), and activities (C3t), respectively.
4.1.1. Tourism Transport
Since China does not have a complete tourism satellite account system or data, previous studies [24,75] led to estimates for Fs to be 64.7% (airlines), 13.8% (highways), 31.6% (railways), and 10.6% (waterways). Based on the academic literature (see Becken et al. [42]; Carlsson-Kanyama and Lindén [76]; Lenzen [77]), energy consumption per unit for the transportation modes (αs) as 2 MJ/pkm for airlines, 1.8 MJ/pkm for highways, 1 MJ/pkm for railways, and 0.9 MJ/pkm for waterways were utlized. Carbon dioxide emissions per unit (βs) were determined based on previous studies, and the actual situation in China relate to 137, 133, 27, and 106 g/pkm for airlines, highways, railways, and waterways, respectively [16,24,41].
4.1.2. Accommodation
4.1.3. Tourism Activities
We set up the energy consumption per unit (ωx) as 8.5, 26.5, 16, 12, and 3.5 MJ/visitor, and CO2 emissions per unit (τx) as 417, 1670, 786, 591, and 172 g/visitor for the above activities, respectively. These were based on Wu and Shi [16] as they first assessed the Chinese energy use and CO2 emissions among different tourism activity purposes. Further, it is important to note that in this study the coefficients of energy use and CO2 emissions were constant. Although technological changes occur continuously with time, these changes were minuscule and can be ignored during the short time period from 2001 to 2015, when compared with the macro-changes in tourism-induced energy use and CO2 emissions.
4.2. Decoupling Index
According to Tapio [30], the decoupling index (LD) of CO2 emissions from the economic development in tourism sector can be assessed as Equation (9):
where %ΔLCO2 and %ΔL are the change rate of CO2 emissions and economic development generated from the tourism sector between a base and target year. The LD classification and its relationship with sustainability are listed in Table 1.
4.3. The Kaya Identity and LMDI Decomposition Model
The Kaya identity [79] is an equation that explores the underlying factors with respect to the impact of human activities on CO2 emissions [32]. This can be extended to explore the effects of tourism on CO2 emissions. The formula is expressed as
where C denotes the total tourism-induced CO2 emissions; Cij represents the CO2 emissions from the region i, tourism sector j; Eij is the energy consumption from the region i, tourism sector j; Ei is the total tourism-induced energy consumption from the region i; Ri is the economic growth from the region i; R is the total tourism economy; P is the total number of tourist arrivals. Let
Six driving factors are noted: emission coefficient effect (Aij); sectorial structure effect (Bij); energy intensity effect (Di); spatial structure effect (Fi); expenditure size effect (I); and industry size effect (k).
The additive LMDI is then applied for the decomposition of tourism-induced CO2 emissions to those driving factors. The change of CO2 emissions can be expressed as Equation (12):
where ΔC is the change between year 0 with year T; C0 and CT are the emissions in year 0 and T, respectively. Then, ΔC can be further illustrated as Equation (13):
Then, based on the LMDI, each factor in Equation (13) can be further expressed as follows [63,80,81]:
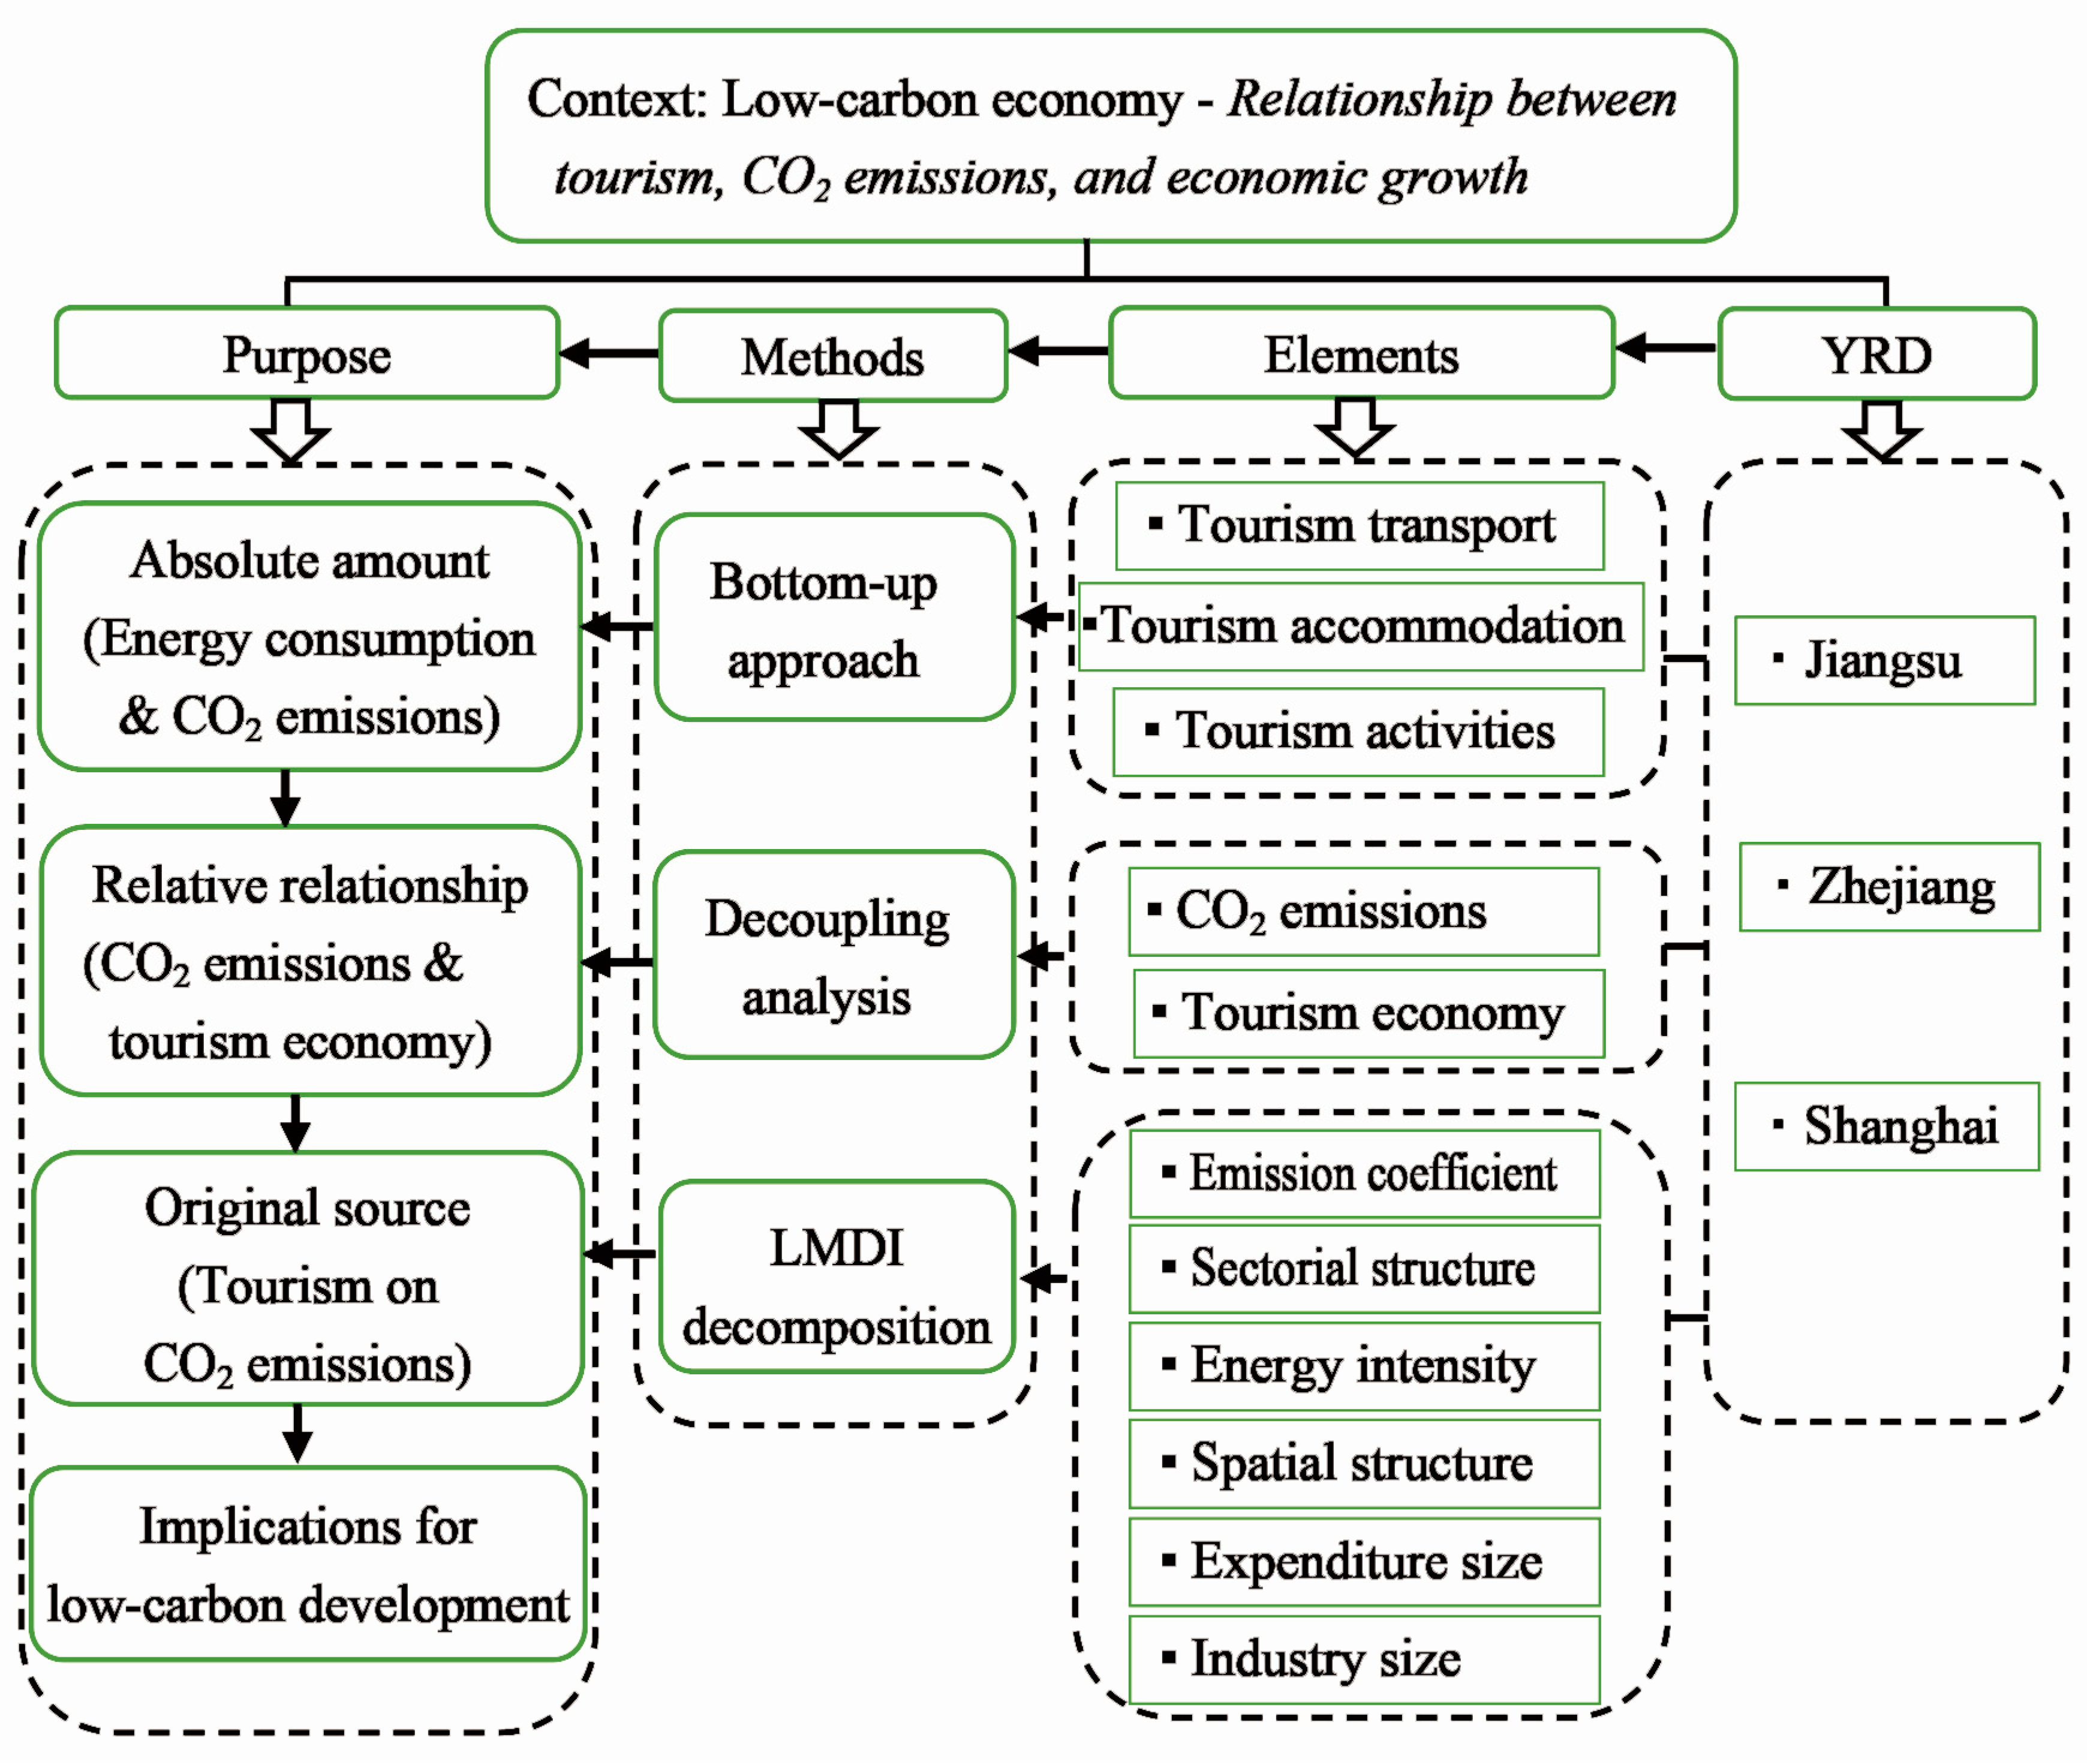
The carbon coefficient is usually constant in practice, therefore, the emission coefficient effect (ΔCAij) is always 0 in the process of decomposition [65], which can be ignored in the analysis. Collectively, a research framework was formulated with the integration of methods for a bottom-up approach, decoupling analysis and LMDI decomposition to measure tourism development towards a low-carbon economy (Figure 2).
4.4. Data Sources
The time series from 2001 to 2015 were selected due to data accessibility. During this time period, three phases of a Five-Year Plan was developed in China from 2001–2005 (10th Five-Year Plan), 2006–2010 (11th Five-Year Plan), and 2011–2015 (12th Five-Year Plan). Such plans are formulated to address national priorities to ensure development of the national economy and society in the country. During the execution of each plan period, the policies are stabilized, and tend to have subsequent impacts for the next plan.
The sources of data for Jiangsu, Zhejiang, and Shanghai (YRD) include the following: (1) tourist passenger turnover volume, tourist arrivals, tourism foreign exchange, and domestic tourism revenues. These were collected from the Statistical Yearbook of Jiangsu, Zhejiang, and Shanghai (2002–2016), and the statistical bulletin on the national economic and social development of Jiangsu, Zhejiang, and Shanghai (2002–2016). The quantity of beds and occupancy rate in star-rated hotels were extracted from the Yearbook of China Tourism Statistics (2002–2016). (2) Data for inbound tourist arrivals and domestic tourist arrivals; percentage of urban/rural tourist arrivals; and activity percentage for leisure vacations, business conferences, visiting relatives/friends, sightseeing, and others of urban/rural tourist arrivals were also compiled. These were obtained from the sample survey information of inbound tourists (2002–2009) [82], tourism sample survey information (2010–2016) [83], Chinese tourism statistical bulletin (2002–2016), and Chinese domestic tourism sample survey information (2002–2016) [84].
5. Results
5.1. Tourism-Induced Energy Consumption and CO2 Emissions in the YRD
5.1.1. Total Amount in YRD
The total tourism-induced energy consumption in the YRD was 896.90 × 10⁸ MJ in 2001, and then illustrated a trend of rapid increase until it reached 3207.40 × 108 MJ in 2015, which was threefold (Table 2). The proportion of energy consumption from tourism transport was the largest and remained above 85% annually, as well as exceeded 90% in 2010 and 2011. Energy consumption from tourism accommodations experienced a remarkable increase; it rose from 106.97 × 10⁸ MJ in 2001 to the peak value of 201.60 × 10⁸ MJ in 2007, and then experienced a continuous decrease to 138.19 × 10⁸ MJ in 2015. In general, the proportion of energy consumed by tourism accommodations decreased from 11.93% in 2001 to 4.31% in 2015. In contrast, the tourism activities consumed more energy from 2001–2015, indicated by its rapid rise from 138.00 × 10⁸ MJ to 258.67 × 10⁸ MJ, consequently resulted in its proportion in the whole energy consumption to exceed tourism accommodations, and increase to 8.06% in 2015.
The trend of CO2 emissions from tourism was similar to energy consumption for the total region. In 2001, tourism emitted 673.55 × 10⁴ t CO2 and reached 2152.27 × 104 t in 2015, with an average annual increase of 8.65%. As for the three tourism sectors, transport was responsible for the greatest proportion of CO2 emissions, with an increase from 72.56% in 2001 to its peak value of 85.00% in 2011, and then a decrease to 82.83% in 2015. The amount of emissions from tourism accommodations experienced fluctuations, but a proportion showed a significant decrease of 14.99% for the research period. Compared with accommodations, although tourism activities contributed the least to CO2 emissions, their share continued to illustrate increases by 4.72% over 15 years.
5.1.2. Comparison within the YRD
Within the YRD, CO2 emissions from tourism in both Jiangsu and Zhejiang increased initially and then declined, while emissions increased rapidly in Shanghai. As illustrated in Figure 3a,b, the proportion of Shanghai’s CO2 emissions from tourism not only increased quickly, but also contributed the most within the whole region, which was mainly from tourism transport. In Shanghai, tourism transport emitted 190.0 × 10⁴ t CO2 in 2001, which increased to 1177.9 × 104 t CO2 in 2015. The key factor was due to the huge turnover volume of tourist arrivals via civil aviation. This led to an increase from 13.02 billion pkm in 2001 to 83.64 billion pkm in 2015, which was 11.22 times and 7.65 times more than for Jiangsu and Zhejiang respectively. Hence, Shanghai emitted the most CO2 through aviation.
Compared with transport, tourism accommodations for Zhejiang and Jiangsu contributed the most CO2 emissions in the whole region largely due to the increase in the scale of accommodations. Since 2008, Zhejiang’s tourism accommodations emitted more CO2 than Jiangsu and Shanghai. With respect to tourism activities, Jiangsu bears the most responsibility for emissions due to its huge number of inbound tourist arrivals, and substantial growth in leisure vacations (Figure 3c,d). According to survey data, the percentage of leisure vacations and business conferences participated by inbound arrivals increased between 2001 and 2015, with an escalation in the percentage of leisure vacations by nearly six times. Additionally, Jiangsu’s inbound tourist arrivals increased rapidly from 80.75 million in 2001 to 619.34 million in 2015, which was significantly more than in Zhejiang and Shanghai.
5.2. Decoupling of CO2 Emissions from YRD’s Tourism Economy
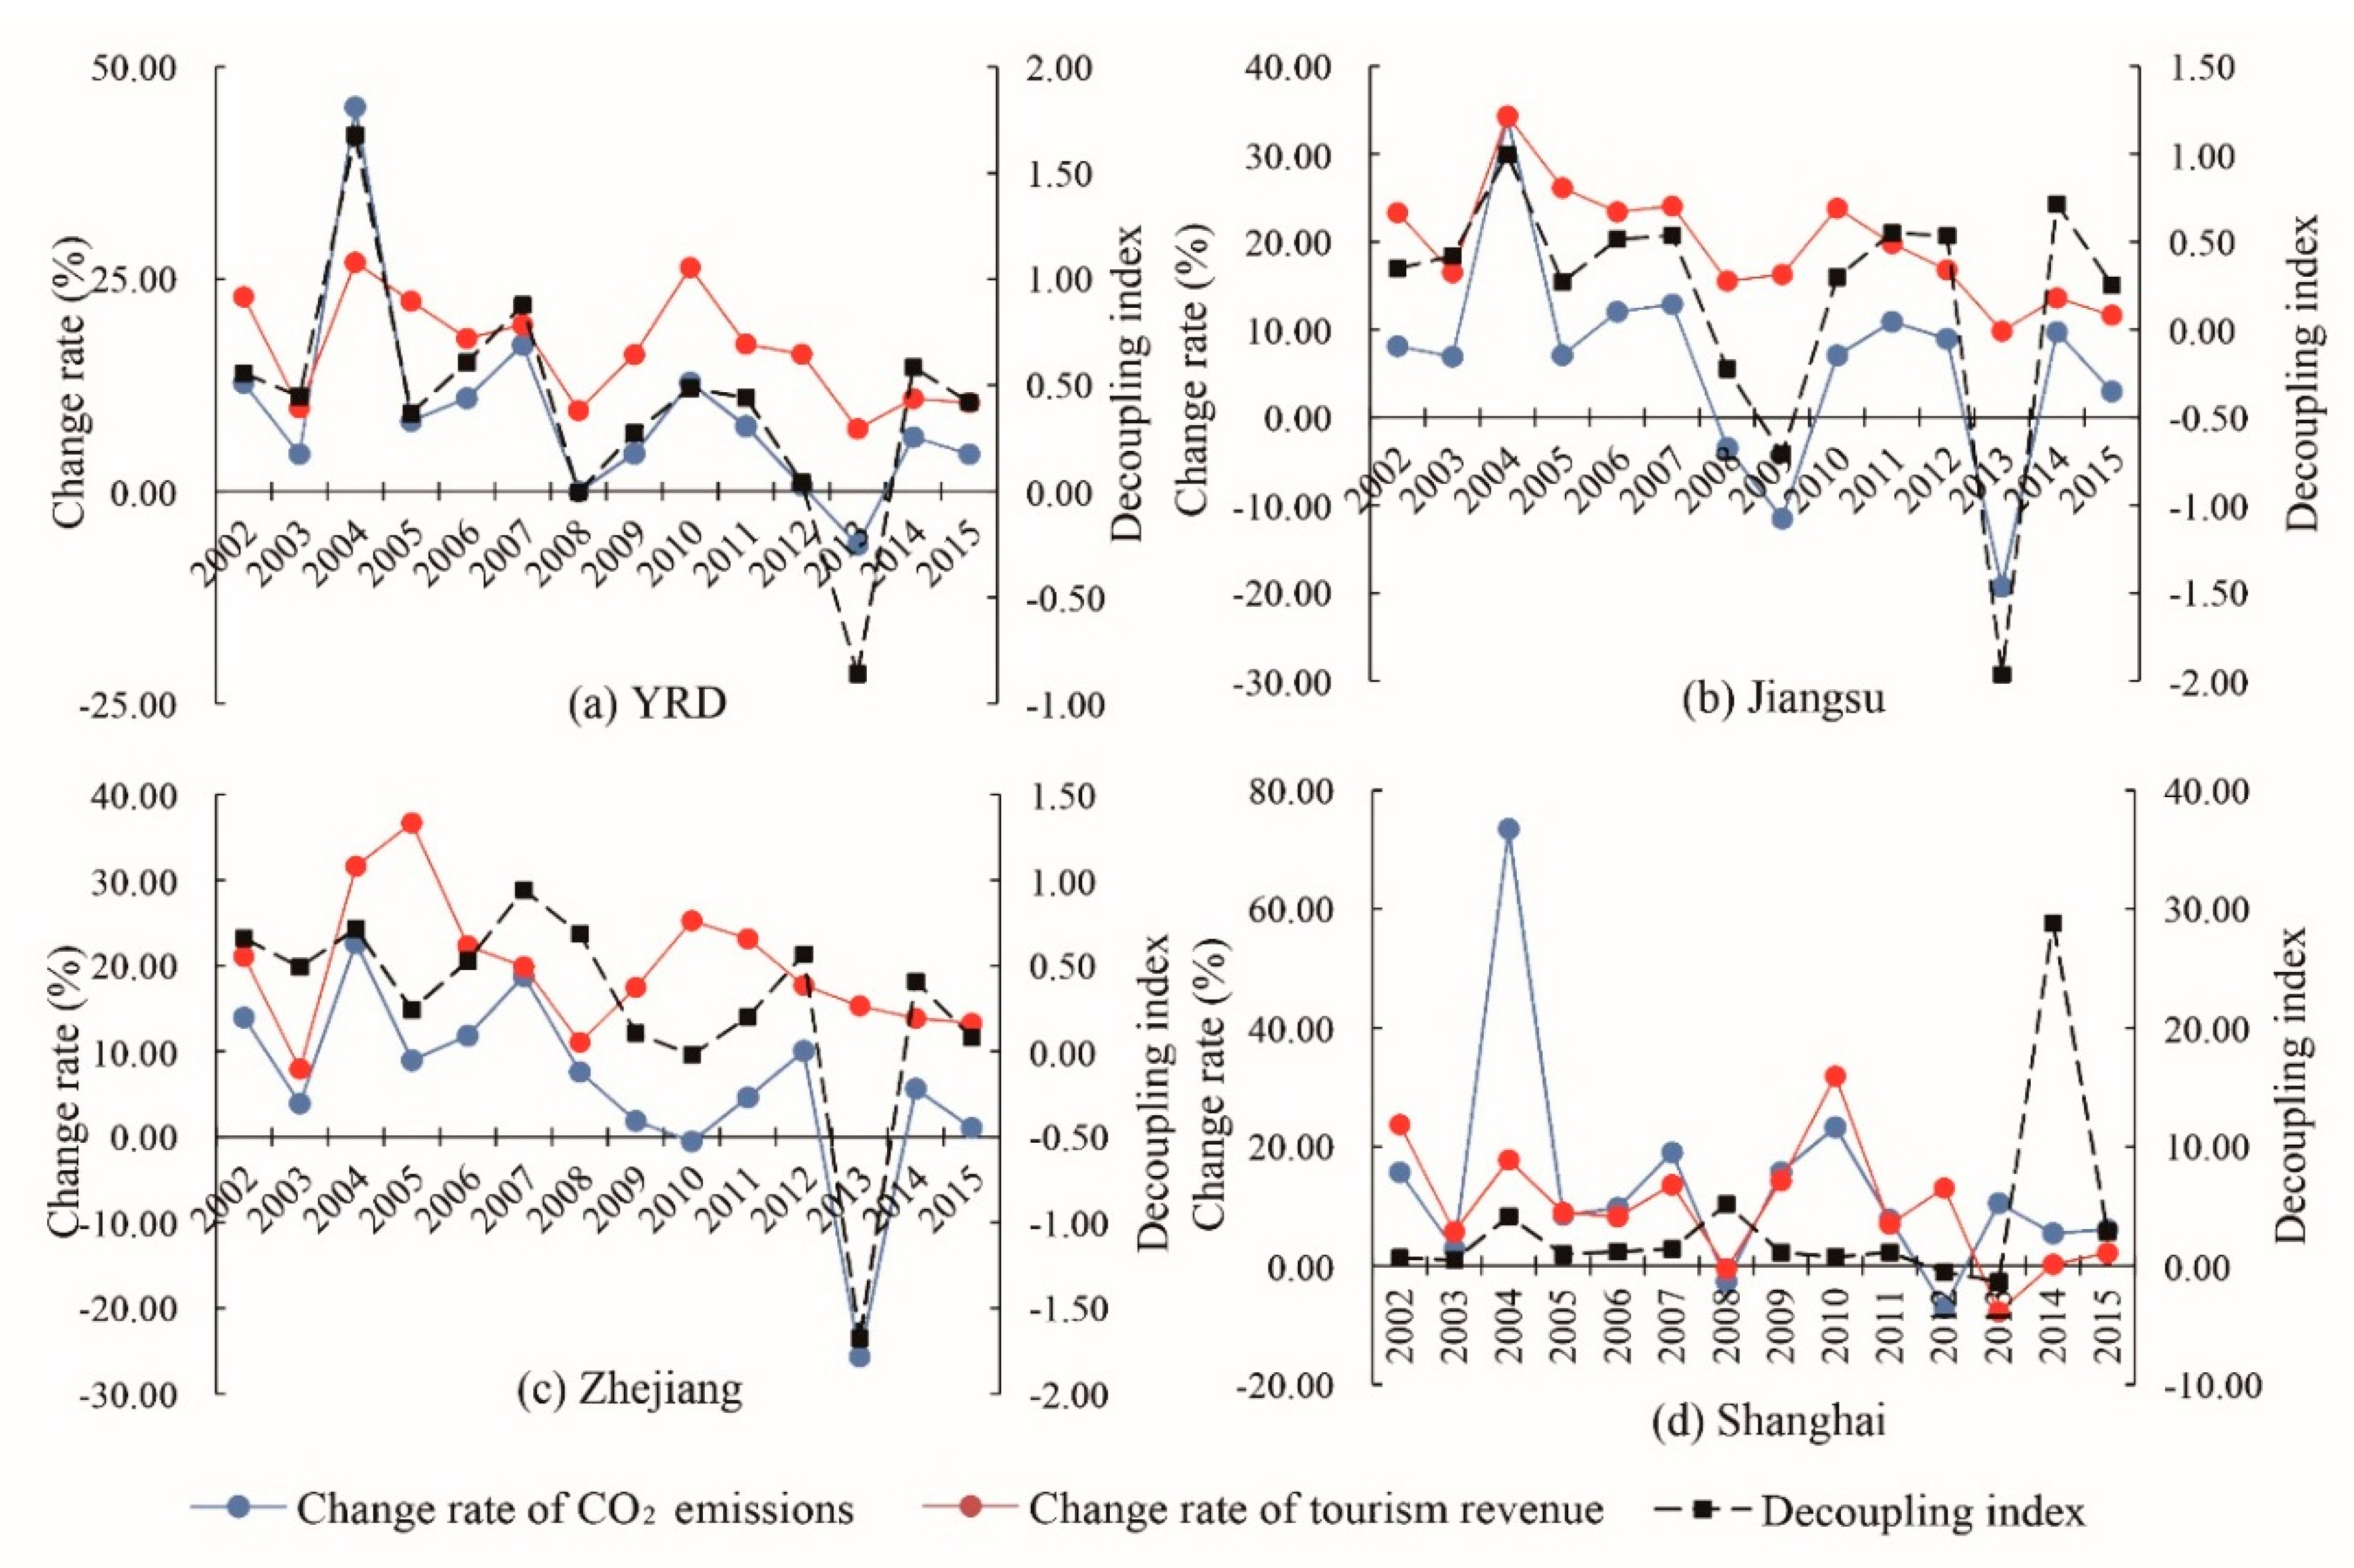
According to Equation (9), the decoupling of CO2 emissions from the YRD’s tourism economy is shown in Figure 4a. For YRD, negative decoupling only existed in 2004, which illustrated a higher growth rate of CO2 emissions and lower tourism economic efficiency. However, weak decoupling occurred in 2002–2003, 2005–2007, 2009–2012, and 2014–2015, which showed that the growth rate of tourism economy was higher than that of CO2 emissions, as decoupling states were desirable. Furthermore, the growth rates of CO2 emissions were negative, while those for tourism economic growth were positive and led to strong decoupling in 2008 and 2013. This was the best state for tourism within the context of a low-carbon economy.
Within the YRD, there was a similar decoupling trend at Jiangsu and Zhejiang. In Jiangsu, the decoupling states rotated between being weak (that is, 2002–2007, 2010–2012, 2014–2015) and strong (that is, 2008–2009, 2013) (Figure 4b). Likewise, in Zhejiang, the decoupling states were largely weak (that is, 2002–2009, 2011–2012, 2013, 2014–2015), and strong in 2010 (Figure 4c). However, the situation in Shanghai was complicated and the results (Figure 4d) show weak decoupling in 2002, 2003, 2005, and 2010; negative decoupling in 2004, 2006, 2007, 2009, 2011, 2014, and 2015; recessive decoupling in 2008; strong decoupling in 2012; and strong negative decoupling in 2013. In general, the decoupling states were desirable in general for tourism sustainability from 2001–2015 under the low-carbon economy in Jiangsu and Zhejiang. Conversely, the situation in Shanghai was scarcely any better, with 64.28% of decoupling states unfavorable for tourism.
5.3. Separate Effects of Tourism on CO2 Emissions
Based on the LMDI decomposition, the separate effects of tourism on CO2 emissions were shown in Table 3 and Table 4. The change in CO2 emissions of tourism from 2001 to 2015 in YRD was 1188.94 × 104 t as the promotion effects of tourism were significantly greater than the inhibitory effects. The tourism industry size was the primary driving force, which caused emissions to improve by 2266.54 × 104 t during the 15-year period; 1.91 times as much as the total emissions change resulted from all the influencing factors. The second contributing factor was expenditure size that enhanced CO2 emissions to 370.10 × 10⁴ t. In contrast, energy intensity, spatial structure, and sectorial structure aided emission reduction with a decrease of 951.90 × 10⁴ t, 396.18 × 10⁴ t, and 99.62 × 10⁴ t, respectively (Table 3).
5.3.1. Industry Size Effect
During China’s three Five-Year Plan periods, due to the industry size effect, CO2 emissions increased to 488.51 × 10⁴ t, 1020.59 × 104 t, and 757.44 × 10⁴ t. In 2015, the YRD hosted 1.44 billion tourists, which was six times as much as in 2001, and represented an annual geometric growth rate of 13.7%. The rapid increase in tourists requires a higher consumption of energy and, thus, more CO2 would be emitted, which corresponds with tourism expansion in the YRD.
The increased CO2 emissions from tourism transport accounted for 73.85%, 80.78%, and 84.05% of the total led by the industry size effect during three periods. Moreover, from the perspective of sub-regions (Table 4), the industry size promoted CO2 emissions for all tourism sectors in each sub-region between 2001 and 2015. Especially, the CO2 emissions of tourism transport in Shanghai accounted for the largest share in changes within the whole industry size effect (34.38%, 45.10%, and 52.66%, in each period).
5.3.2. Expenditure Size Effect
During the three plan periods, the expenditure size effect contributed 196.41 × 10⁴ t, 42.59 × 10⁴ t, and 131.10 × 10⁴ t of CO2, respectively. Accordingly, the average tourist expenditure in the YRD rose from 962 RMB/year in 2001 to 1354 RMB/year in 2015. Although there were some fluctuations during 2008–2010 due to unexpected events such as the Asian financial crisis, overall, the expenditure maintained an annual growth rate of 2.47%. Similarly, the expenditure size had positive effects on CO2 emissions from all tourism sectors. The tourism transport was the most affected, especially Shanghai which had the largest share within the entire expenditure size effect.
5.3.3. Energy Intensity Effect
The tourism energy intensity refers to the energy consumed by unit tourism revenue in a region, and reflects the overall efficiency of energy economic activities [39]. The energy intensity effect has assisted in the reduction of 272.90 × 10⁴ t, 296.50 × 10⁴ t, and 382.50 × 10⁴ t CO2 during the three-year period. Moreover, CO2 emissions from all tourism sectors decreased due to the energy intensity effect in each period, which reflected that the production of unit revenue required less energy, and the efficiency of energy use improved in YRD.
From the sub-regions, reduction in CO2 emissions within the three tourism sectors due to energy intensity effect continually occurred in both Jiangsu and Zhejiang. However, during 2001–2005 and 2011–2015, the energy intensity effect led to increased CO2 emissions for all tourism sectors in Shanghai, instead of any reduction. This illustrated that tourism energy efficiency in Shanghai was not high enough to assist with CO2 reduction.
5.3.4. Spatial Structure Effect
The spatial structure is the proportion of sub-regional tourism revenue in the total tourism revenue, which indicates the spatial distribution of development from the aspect of the tourism economy. It is the second important driving force in favor of the total 396.18 × 10⁴ t CO2 emissions reduction in the YRD. However, it has a negative effect on CO2 emissions from tourism transport with a huge decrease of 415.79 × 10⁴ t, while a positive effect with an increase of 12.14 × 10⁴ t and 7.47 × 10⁴ t CO2 from tourism accommodation and activities. As to the sub-regions, the proportion of tourism revenues of Jiangsu, Zhejiang, and Shanghai changed from 32.53%, 25.68%, and 41.79% in 2001 to 46.08%, 36.61%, and 17.31% in 2015, respectively. This process of spatial structure change resulted in the reduction of CO2 emissions from the three tourism sectors, especially for tourism transport in Shanghai, thus, effectively contributing to the total emissions reduction in YRD.
5.3.5. Sectorial Structure Effect
The negative effect of sectorial structure on CO2 emissions substantially decreased, which reduced CO2 emissions for tourism transport (−18.18 × 10⁴ t) and accommodations (−160.97 × 10⁴ t), but promoted emissions of tourism activities (79.53 × 10⁴ t) during 2001–2015. In fact, China has implemented the energy savings and emissions reduction strategy with adjustment in the industrial structure [85], and the tourism structure also changed over time, which led to the complicated effect on emissions [86]. In each sub-region, there was no uniform effect of sectorial structure on CO2 emissions for different sectors in 2001–2005. During 2006–2010 and 2011–2015, the sectorial structure assisted to contribute towards CO2 emissions in tourism activities, and reduced for accommodations. Moreover, it was evident that the sectorial structure effect demonstrated a decline, and a movement from a positive to a negative role in the CO2 emissions for tourism transport.
6. Discussion
A low-carbon economy is the best alternative for the tourism industry in China to contribute towards energy conservation and emissions reduction at the national and global scale. Additionally, while numerous policies have been implemented in China for low-carbon economy development (for example, 12th Five-year Plan 2011–2015, and China’s Policies and Actions for Addressing Climate Change 2011 [6]), there are major differences in the level and trend among the regional economy and tourism industry due to spatial disequilibrium of development. Thus, it is reasonable and necessary to decompose the national goal of emission reduction and low-carbon development to specific regions.
In this study, a bottom-up method was selected to assess the total amount of energy consumption and CO2 emissions, which was the premise to clarify the relationship between regional tourism development and environmental pressures led by CO2 emissions. Accordingly, tourism-induced energy consumption and CO2 emissions in YRD increased. It is worth noting that tourism transport was the major contributor to the total energy consumption (>85%) and CO2 emissions (>72%) from 2001 to 2015. Although there are differences between regions and countries [45,87,88] due to calculation methods, the ratios of CO2 emissions from the three tourism sectors (i.e., tourism transport, accommodation, and activities) in the YRD were close enough to global tourism rates (see UNWTO-UNEP-WMO [3]). Moreover, due to the tremendous increase in CO2 emitted by tourism transport in Shanghai, the ratio of the three sectors changed to be consistent with the entire Chinese tourism industry (see Tang et al. [24]).
Decoupling analysis has been demonstrated as a proper method to measure the connection between economic activity and CO2 emissions [56]. This was illustrated in this study as the complex dynamics of decoupling states between the tourism economic growth and CO2 emissions in the YRD was noted. Weak decoupling occurred during various years along with fluctuations of negative decoupling and strong decoupling. It reflected that the tourism economic expansion was not always positive with the change of CO2 emissions, which can broaden our vision of the relationship between tourism and CO2 emissions [9,89]. In general, the decoupling state during 2001–2015 was deemed desirable with respect to a low-carbon tourism economy, except in 2004 due to the negative decoupling. Meanwhile, weak decoupling in most years proved that more efficient technology should be applied to further decrease CO2 emissions [57]. Thus, the ideal tourism economic development could be achieved with decreased environmental stress.
To further understand how tourism impacts CO2 emissions, the LMDI decomposition method was used in the final step, which was the most important aspect to assist policy-makers to identify key factors and formulate policies for emission reduction. First, industry size and expenditure size were primary factors to contribute towards tourism-induced CO2 emissions in YRD and its sub-regions, which coincided with other relevant studies [32,39]. While it is impractical to achieve emission reduction through limited development, as tourism is one of the pillar industries in China, the excessive rise of expenditure size should be curbed as it relates to tourism transport, accommodations, catering, and shopping that nets huge CO2 emissions [52]. In view of this, with the process of urban integration in the YRD, local governments should further enhance their collaboration of low-carbon tourism for tourist arrivals. For example, optimization of the public transport system, promotion of high-speed railways network, and production of low-carbon tourist souvenirs. Meanwhile, a low-carbon consumption should be propagated and encouraged, as there is still a substantial gap between the positive perceptions of low-carbon knowledge held by tourists and residents, and the levels of practice in the YRD [52,90].
Second, energy intensity was the main contributor to reduce CO2 emissions in the YRD, which was corroborated by the findings of Tang et al. [24] and Robaina-Alevs et al. [33]. We argue that the energy intensity reduction is the most promising and important factor for emission reduction. This assumption is due to the fact that there will be ample opportunities for energy efficiency improvement via clean energy, as well as low-carbon technology in the tourism sectors. However, the low-carbon technology is limited to tourism operators in the YRD due to high implementation costs. The cost issue is also evident for developed countries [91]. In addition, in 2016, although China passed the new Energy Conservation Law, there are no specific penalties for violations. Moreover, there are no other measures toward the technical standards and threshold of carbon emissions from enterprises. Therefore, energy law should be implemented with corresponding penalties at the legislative level, as well as the formulation of specific technical measures to ensure the improvement of energy efficiency in tourism. Moreover, strong support and greater reliance on clean and renewable energy (for example, hydropower, wind power, solar energy, biomass energy) in the tourism sector in the YRD is needed. Since the tourism transport sector emitted the most CO2, it is prudent to further emphasize the use of new-energy vehicles (for example, electric or plug-in hybrid) for green/sustainable transportation systems [6,68].
Third, the spatial structure effect contributed to the CO2 reduction in the YRD mainly due to the change of the spatial distribution of tourism economic development. Nevertheless, reduction target of CO2 emissions cannot depend on the further adjustment of the spatial structure through policies as tourism economy has grown in importance at each destination. With respect to the sectorial structure, although it had the weakest effect on CO2 emissions reduction, it is still significant to further optimize the tourism sectorial structure for the long term. This would contribute to enhance the quality and level of regional tourism economic development, and lead to favorable carbon emissions reduction [86,92].
There are limitations to this study. First, due to the complexity of the tourism system and data availability, only the direct energy consumption and CO2 emissions from tourism were estimated. Second, with respect to the three tourism sectors, transport data were limited to the main public transport, and accommodations limited to star-rated hotels. However, private/hired cars and homestay accommodation are also popular in the YRD, and were not considered due to the lack of attainable data. This likely leads to an underestimation of CO2 emissions for tourism transport and accommodations. Nevertheless, it is still important to implement strategies to reduce the level of tourism-induced energy consumption and CO2 emissions due to the intra-regional imbalance, and complex decoupling relationship between the environment and the tourism industry in the YRD.
7. Conclusions
Based on the YRD as a case study, this research quantitatively examined the dynamics of regional tourism towards a low-carbon economy in terms of the relationship between tourism, CO2 emissions, and economic development. The bottom-up approach, decoupling analysis, and LMDI decomposition method examined and integrated to explore the relationships. By means of the bottom-up approach, from 2001 to 2015, the amount of tourism-induced energy consumption and CO2 emissions in the YRD increased. Tourism-related transport from Shanghai was the major contributor towards emissions. Decoupling analysis indicated that the decoupling state during 2001–2015 was deemed desirable in the YRD with respect to a low-carbon tourism economy, except in 2004. However, within the YRD, the decoupling situation was more complicated, especially in Shanghai. The separate effects of tourism on CO2 emissions were explored by LMDI decomposition, which provided an in-depth examination of the relationship between tourism development and carbon emissions. In YRD, industry size and expenditure size effect were the principal factors to promote carbon emissions growth, whereas energy intensity, spatial structure, and sectorial structure had negative effects. This led to key issues that should be emphasized by policymakers with regards to the promotion of low-carbon tourism development, especially energy intensity reduction from tourism.
Author Contributions
L.C. and W.Y. conceived and designed the research; L.C. collected data and analyzed the data; B.T. and L.C. contributed to progress of research idea and wrote the paper. All authors have read and approved the final manuscript.
Funding
This work was supported by the Jiangsu Overseas Research & Training Program for University Young & Middle-aged Teachers and President in 2016.
Acknowledgments
The valuable comments from the anonymous reviewers were much appreciated and enhanced the overall paper.
Conflicts of Interest
The authors declare no conflict of interest.
References
- Gössling, S. National emissions from tourism: An overlooked policy challenge? Energy Policy 2013, 59, 433–442. [Google Scholar] [CrossRef]
- Gössling, S.; Buckley, R. Carbon labels in tourism: Persuasive communication? J. Clean. Prod. 2016, 111, 358–369. [Google Scholar] [CrossRef]
- UNWTO-UNEP-WMO. Climate Change and Tourism: Responding to Global Challenge; The World Tourism Organization and The United Nations Environment Programme: Madrid, Spain, 2008. [Google Scholar]
- G8. Declaration of the Leaders of the Major Economies Forum on Energy and Climate. Available online: https://www.icao.int/Meetings/AMC/MA/High%20Level%202009/HLMENV_IP003_en.pdf (accessed on 28 November 2017).
- Jiang, B.; Sun, Z.Q.; Liu, M.Q. China’s energy development strategy under the low-carbon economy. Energy 2010, 35, 4257–4264. [Google Scholar] [CrossRef]
- Lee, C.T.; Hashim, H.; Ho, C.S.; Fan, Y.V.; Klemeš, J.J. Sustaining the low-carbon emission development in Asia and beyond: Sustainable energy, water, transportation and low-carbon emission technology. J. Clean. Prod. 2017, 146, 1–13. [Google Scholar] [CrossRef]
- Aall, C. Sustainable tourism in practice: Promoting or perverting the quest for a sustainable development? Sustainability 2014, 6, 2562–2583. [Google Scholar] [CrossRef]
- Ozturk, I. The relationships among tourism development, energy demand, and growth factors in developed and developing countries. Int. J. Sustain. Dev. World 2016, 23, 122–131. [Google Scholar] [CrossRef]
- Paramati, S.R.; Alam, M.S.; Chen, C.F. The Effects of Tourism on Economic Growth and CO2 Emissions: A Comparison between Developed and Developing Economies. J. Travel Res. 2017, 56, 712–724. [Google Scholar] [CrossRef]
- Becken, S. Evidence of a low-carbon tourism paradigm? J. Sustain. Tour. 2017, 25, 832–850. [Google Scholar] [CrossRef]
- Gössling, S.; Scott, D.; Hall, C.M. Challenges of tourism in a low-carbon economy. Clim. Chang. 2013, 4, 525–538. [Google Scholar] [CrossRef]
- Shi, Y.; Du, Y.Y.; Yang, G.F.; Tang, Y.L.; Fan, L.K.; Zhang, J.; Lu, Y.J.; Ge, Y.; Chang, J. The use of green waste from tourist attractions for renewable energy production: The potential and policy implications. Energy Policy 2013, 62, 410–418. [Google Scholar] [CrossRef]
- Kasemsap, K. Sustainability, environmental sustainability, and sustainable tourism: Advanced issues and implications. In Business Infrastructure for Sustainability in Developing Economies, 1st ed.; Ray, N., Ed.; IGI Global: Hershey, PA, USA, 2016; pp. 1–24. ISBN 9781522520412. [Google Scholar]
- Zhang, J.K.; Zhang, Y. Carbon tax, tourism CO2 emissions and economic welfare. Ann. Tour. Res. 2018, 69, 18–30. [Google Scholar] [CrossRef]
- Perch-Nielsen, S.; Sesartic, A.; Stucki, M. The greenhouse gas intensity of the tourism sector: The case of Switzerland. Environ. Sci. Policy 2010, 13, 131–140. [Google Scholar] [CrossRef]
- Wu, P.; Shi, P.H. An estimation of energy consumption and CO2 emissions in tourism sector of China. J. Geogr. Sci. 2011, 21, 733–745. [Google Scholar] [CrossRef]
- Smith, I.J.; Rodger, C.J. Carbon emission offsets for aviation-generated emissions due to international travel to and from New Zealand. Energy Policy 2009, 37, 3438–3447. [Google Scholar] [CrossRef]
- Tao, Y.G.; Huang, Z.F. Review of accounting for carbon dioxide emissions from tourism at different spatial scales. Acta Ecol. Sin. 2014, 34, 246–254. [Google Scholar] [CrossRef]
- Surugiu, C.; Surugiu, M.R.; Breda, Z.; Dinca, A.I. An input-Output Approach of CO2 Emissions in Tourism Sector in Post-Communist Romania. Procedia Econ. Financ. 2012, 3, 987–992. [Google Scholar] [CrossRef]
- Dwyer, L.; Forsyth, P.; Spurr, R.; Hoque, S. Estimating the carbon footprint of Australian tourism. J. Sustain. Tour. 2010, 8, 355–376. [Google Scholar] [CrossRef]
- Martín-Cejas, R.R.; Sánchez, P.P.R. Ecological footprint analysis of road transport related to tourism activity: The case for Lanzarote Island. Tour. Manag. 2010, 31, 98–103. [Google Scholar] [CrossRef]
- Kuo, N.W.; Chen, P.H. Quantifying energy use, carbon dioxide emission, and other environmental loads from island tourism based on a life cycle assessment approach. J. Clean. Prod. 2009, 17, 1324–1330. [Google Scholar] [CrossRef]
- Ng, T.H.; Lye, C.T.; Lim, Y.S. A decomposition analysis of CO2 emissions: Evidence from Malaysia’s tourism industry. Int. J. Sustain. Dev. World 2016, 23, 266–277. [Google Scholar] [CrossRef]
- Tang, Z.; Shang, J.; Shi, C.B.; Liu, Z.; Bi, K.X. Decoupling indicators of CO2 emissions from the tourism industry in China: 1990–2012. Ecol. Indic. 2014, 46, 390–397. [Google Scholar] [CrossRef]
- Becken, S.; Simmons, D.; Frampton, C. Energy use associated with different travel choices. Tour. Manag. 2003, 24, 267–277. [Google Scholar] [CrossRef]
- UNWTO. Towards a Low Carbon Travel & Tourism Sector. Available online: http://www.greeningtheblue.org/sites/default/files/Towards%20a%20low%20carbon%20travel%20&%20tourism%20sector.pdf (accessed on 29 November 2017).
- Scott, D.; Peeters, P.; Gössling, S. Can tourism deliver its “aspirational” greenhouse gas emission reduction targets? J. Sustain. Tour. 2010, 18, 393–408. [Google Scholar] [CrossRef]
- Hsu, C.W.; Kuo, T.C.; Shyu, G.S.; Chen, P.S. Low carbon supplier selection in the hotel industry. Sustainability 2014, 6, 2658–2684. [Google Scholar] [CrossRef]
- Sun, Y.Y. Decomposition of tourism greenhouse gas emissions: Revealing the dynamics between tourism economic growth, technological efficiency, and carbon emissions. Tour. Manag. 2016, 55, 326–336. [Google Scholar] [CrossRef]
- Tapio, P. Towards a theory of decoupling: Degrees of decoupling in the EU and the case of road traffic in Finland between 1970 and 2001. Transp. Policy 2005, 12, 137–151. [Google Scholar] [CrossRef]
- Luken, R.A.; Piras, S. A critical overview of industrial energy decoupling programs in six developing countries in Asia. Energy Policy 2011, 39, 3869–3872. [Google Scholar] [CrossRef]
- Liu, J.; Feng, T.T.; Yang, X. The energy requirements and carbon dioxide emissions of tourism industry of Western China: A case of Chengdu city. Renew. Sustain. Energy Rev. 2011, 15, 2887–2894. [Google Scholar] [CrossRef]
- Robaina-Alves, M.; Moutinho, V.; Costa, R. Change in energy-related CO2 (carbon dioxide) emissions in Portuguese tourism: A decomposition analysis from 2000 to 2008. J. Clean. Prod. 2016, 111, 520–538. [Google Scholar] [CrossRef]
- China Tourism Academy. Annual Report of Tourism Statistics in 2016 and Prediction of Tourism Economy in 2017; China Tourism Academy: Beijing, China, 2017; Available online: http://www.ctaweb.org/html/2017-2/2017-2-24-9-10-97907.html (accessed on 29 November 2017). (In Chinese)
- National Tourism Administration of the People’s Republic of China. The Yearbook of China Tourism Statistics; China Travel Press: Beijing, China, 2001. (In Chinese)
- Luo, F.; Becken, S.; Zhong, Y.D. Changing travel patterns in China and ‘carbon footprint’ implications for a domestic tourist destination. Tour. Manag. 2018, 65, 1–13. [Google Scholar] [CrossRef]
- Cai, M.; Wang, Y.M. Low-carbon Tourism: A New Mode of Tourism Development. Tour. Trib. 2010, 25, 13–17. (In Chinese) [Google Scholar]
- Dou, X.S.; Cui, H.Y. Low-carbon society creation and socio-economic structural transition in China. Environ. Dev. Sustain. 2017, 19, 1577–1599. [Google Scholar] [CrossRef]
- Wang, K.; Xiao, Y.; Li, Z.M.; Liu, H.L. Decomposition of China’s tourism carbon emissions: Based on LMDI method. Tour. Sci. 2016, 30, 13–27. (In Chinese) [Google Scholar]
- Xie, Y.F.; Zhao, Y. Measuring carbon dioxide emissions from energy consumption by tourism in Yangtze River Delta. Geogr. Res. 2012, 31, 429–438. (In Chinese) [Google Scholar]
- Peeters, P.; Dubois, G. Tourism travel under climate change mitigation constraints. J. Transp. Geogr. 2010, 13, 131–140. [Google Scholar] [CrossRef]
- Becken, S.; Frampton, C.; Simmons, D. Energy consumption patterns in the accommodation sector: The New Zealand case. Ecol. Econ. 2001, 39, 371–386. [Google Scholar] [CrossRef]
- Nepal, S.K. Tourism-induced rural energy consumption in the Annapurna regional of Nepal. Tour. Manag. 2008, 29, 89–100. [Google Scholar] [CrossRef]
- Katircioglu, S.T.; Feridun, M.; Kilinc, C. Estimating tourism-induced energy consumption and CO2 emissions: The case of Cyprus. Renew. Sustain. Energy Rev. 2014, 29, 634–640. [Google Scholar] [CrossRef]
- Jones, C. Scenarios for greenhouse gas emissions reduction from tourism: An extended tourism satellite account approach in a regional setting. J. Sustain. Tour. 2013, 21, 458–472. [Google Scholar] [CrossRef]
- Becken, S.; Patterson, M. Measuring National Carbon Dioxide Emissions from Tourism as a Key Step Towards Achieving Sustainable Tourism. J. Sustain. Tour. 2006, 14, 323–328. [Google Scholar] [CrossRef]
- Sharp, H.; Grundius, J.; Heinonen, J. Carbon footprint of inbound tourism to Iceland: A consumption-based life-cycle assessment including direct and indirect emissions. Sustainability 2016, 8, 1147. [Google Scholar] [CrossRef]
- Zhong, Y.D.; Shi, S.Y.; Li, S.H.; Luo, F.; Luo, W.L. Empirical research on measurement framework construction for tourist industry carbon emission in China: A perspective of input-output. J. Cent. South Univ. For. Technol. 2015, 35, 144. (In Chinese) [Google Scholar]
- Meng, W.Q.; Xu, L.Y.; Hu, B.B.; Zhou, J.; Wang, Z.L. Quantifying direct and indirect carbon dioxide emissions of the Chinese tourism industry. J. Clean. Prod. 2016, 126, 586–594. [Google Scholar] [CrossRef]
- Bao, Z.X.; Yuan, S.Q.; Chen, G.S. Carbon dioxide emission from tourist transport in three destinations of different travel distances. Sci. Geogr. Sin. 2012, 32, 1168–1174. (In Chinese) [Google Scholar]
- Li, C.Y.; Chen, X.P.; Zhang, Z.L.; Feng, H.H. Estimation of tourism carbon emission and its decoupling with tourism development in Dunhuang. Ecol. Sci. 2016, 35, 109–116. (In Chinese) [Google Scholar]
- Tao, Y.G.; Huang, Z.F.; Wu, L.M.; Yu, F.L.; Wang, K. Measuring carbon dioxide emissions for regional tourism and its factor decomposition: A case study of Jiangsu province. Acta Geogr. Sin. 2014, 69, 1438–1448. (In Chinese) [Google Scholar]
- Wang, J.H.; Li, X. The effect of sector decoupling between China’s industrial economic growth and carbon dioxide emissions. Econ. Geogr. 2015, 35, 105–110. (In Chinese) [Google Scholar]
- Organization for Economic Co-operation and Development. Indicators to Measure Decoupling of Environmental Pressure from Economic Growth. Available online: https://www.oecd.org/env/indicators-modelling-outlooks/1933638.pdf (accessed on 29 November 2017).
- Vehmas, J.; Malaska, P.; Luukkanen, J.; Kaivo-oja, J.; Hietanen, O.; Vinnari, M.; Ilvonen, J. Europe in the Global Battle of Sustainability: Rebound Strikes Back?—Advanced Sustainability Analysis; Series Discussion and Working Papers, No. 7; Publications of the Turku School of Economics and Business Administration: Turku, Finland, 2003. [Google Scholar]
- Zhang, M.; Wang, W.W. Decouple indicators on the CO2 emission-economic growth linkage: The Jiangsu Province case. Ecol. Indic. 2013, 32, 239–244. [Google Scholar] [CrossRef]
- Vehmas, J.; Luukkanen, J.; Kaivo-Oja, J. Linking analyses and environmental Kuznets Curves for material flows in the European Union 1980–2000. J. Clean. Prod. 2007, 15, 1662–1673. [Google Scholar] [CrossRef]
- Climent, F.; Pardo, A. Decoupling factors on the energy-output linkage: The Spanish case. Energy Policy 2007, 35, 522–528. [Google Scholar] [CrossRef]
- Wang, Y.H.; Xie, T.Y.; Yang, S.L. Carbon emission and its decoupling research of transportation in Jiangsu Province. J. Clean. Prod. 2017, 142, 907–914. [Google Scholar] [CrossRef]
- Lee, J.W.; Brahmasrene, T. Investigating the influence of tourism on economic growth and carbon emissions: Evidence from panel analysis of the European Union. Tour. Manag. 2013, 38, 69–76. [Google Scholar] [CrossRef]
- Ang, B.W.; Zhang, F.Q.; Choi, K.H. Factorizing changes in energy and environmental indicators through decomposition. Energy 1998, 23, 489–495. [Google Scholar] [CrossRef]
- Ang, B.W. Decomposition analysis for policymaking in energy: Which is the preferred method? Energy Policy 2004, 32, 1131–1139. [Google Scholar] [CrossRef]
- Ang, B.W.; Liu, F.L.; Chew, E.P. Perfect decomposition techniques in energy and environmental analysis. Energy Policy 2003, 31, 1561–1566. [Google Scholar] [CrossRef]
- Lu, I.J.; Lin, S.J.; Lewis, C. Decomposition and decoupling effects of carbon dioxide emission from highway transportation in Taiwan, Germany, Japan and South Korea. Energy Policy 2007, 35, 3226–3235. [Google Scholar] [CrossRef]
- Tang, C.C.; Zhong, L.S.; Ng, P. Factors that Influence the Tourism Industry’s Carbon Emissions: A Tourism Area Life Cycle Model Perspective. Energy Policy 2017, 109, 704–718. [Google Scholar] [CrossRef]
- Albrecht, J.; Francois, D.; Schoors, K. A Shapley decomposition of carbon emissions without residuals. Energy Policy 2002, 30, 727–736. [Google Scholar] [CrossRef]
- Ye, B.; Jiang, J.J.; Li, C.S.; Miao, L.X.; Tang, J. Quantification and driving force analysis of provincial-level carbon emissions in China. Appl. Energy 2017, 198, 223–238. [Google Scholar] [CrossRef]
- Zhou, X.; Zhang, M.; Zhou, M.H.; Zhou, M. A comparative study on decoupling relationship and influence factors between China’s regional economic development and industrial energy-related carbon emissions. J. Clean. Prod. 2017, 142, 783–800. [Google Scholar] [CrossRef]
- National Development and Reform Commission. Circular of the National Development and Reform Commission on printing the Regional Plans for the Yangtze River Delta. Available online: http://www.ndrc.gov.cn/zcfb/zcfbghwb/201006/t20100622_585472.html (accessed on 28 November 2017). (In Chinese)
- Zhang, H.; Gu, C.L.; Gu, L.W.; Zhang, Y. The evaluation of tourism destination competitiveness by TOPSIS & information entropy—A case in the Yangtze River Delta of China. Tour. Manag. 2011, 32, 443–451. [Google Scholar] [CrossRef]
- National Bureau of Statistics. Statistical Bulletin on National Economic and Social Development of Provinces and Municipalities in 2015. Available online: http://district.ce.cn/zg/201602/25/t20160225_9083623.shtml (accessed on 28 November 2017). (In Chinese)
- National Bureau of Statistics. Statistical Bulletin on National Economic and Social Development of Shanghai in 2001. Available online: http://www.shanghai.gov.cn/nw2/nw2314/nw2319/nw2404/nw4361/nw4371/u26aw259.html (accessed on 28 November 2017). (In Chinese)
- National Bureau of Statistics. Statistical bulletin on national economic and social development of Jiangsu in 2001. Available online: http://www.jssb.gov.cn/jstjgove/goveinfo/201112/t20111219_23492.html (accessed on 28 November 2017). (In Chinese)
- National Bureau of Statistics. Statistical Bulletin on National Economic and Social Development of Zhejiang in 2001. Available online: http://tjj.zj.gov.cn/tjgb/gmjjshfzgb/200203/t20020307_122151.html (accessed on 28 November 2017). (In Chinese)
- Wei, Y.X.; Sun, G.N.; Ma, L.J.; Li, J. Estimating the carbon emissions and regional differences of tourism transport in China. J. Shananxi Norm. Univ. (Natur. Sci. Ed.) 2012, 40, 76–84. (In Chinese) [Google Scholar]
- Carlsson-Kanyama, A.; Lindén, A.L. Travel patterns and environmental effects now and in the future: Implications of differences in energy consumption among socio-economic groups. Ecol. Econ. 1999, 30, 405–417. [Google Scholar] [CrossRef]
- Lenzen, M. Total requirements of energy and greenhouse gases for Australian transport. Transp. Res. Part D Transp. Environ. 1999, 4, 265–290. [Google Scholar] [CrossRef]
- Gössling, S. Global environmental consequences of tourism. Glob. Environ. Chang. 2002, 12, 283–302. [Google Scholar] [CrossRef]
- Kaya, Y. Impact of Carbon Dioxide Emissions on GNP Growth: Interpretation of Proposed Scenarios; IPCC Energy and Industry Subgroup, Response Strategies Working Group: Paris, France, 1990. [Google Scholar]
- Ang, B.W.; Liu, F.L. A new energy decomposition method: Perfect in decomposition and consistent in aggregation. Energy 2001, 26, 537–548. [Google Scholar] [CrossRef]
- Ang, B.W. The LMDI approach to decomposition analysis: A practical guide. Energy Policy 2005, 33, 867–871. [Google Scholar] [CrossRef]
- Policy and Regulation Department of the National Tourism Administration. The Sample Survey Information of Inbound Tourist; China Travel & Tourism Press: Beijing, China, 2002–2009. (In Chinese)
- Policy and Regulation Department of the National Tourism Administration. Tourism Sample Survey Information; China Travel & Tourism Press: Beijing, China, 2010–2016. (In Chinese)
- Policy and Regulation Department of the National Tourism Administration. Chinese Domestic Tourism Sample Survey Information; China Travel & Tourism Press: Beijing, China, 2002–2016. (In Chinese)
- State Council. Circular of the Stat Council on Issuing the Comprehensive Work Plan for Energy Saving and Emission Reduction in the 12th Five-Year Plan. Available online: http://www.gov.cn/zwgk/2011-09/07/content_1941731.htm (accessed on 29 November 2017). (In Chinese)
- Sheng, Y.C. On the evolution of the optimization of tourism industrial structure to the contribution of economic growth of regional tourism. Tour. Trib. 2012, 27, 11–19. (In Chinese) [Google Scholar]
- Gössling, S.; Hansson, C.B.; Hörstmeier, O.; Saggel, S. Ecological footprint analysis as a tool to assess tourism sustainability. Ecol. Econ. 2002, 43, 199–211. [Google Scholar] [CrossRef]
- Gössling, S.; Peeters, P.; Ceron, J.P.; Dubois, G.; Patterson, T.; Richardson, R.B. The Eco-efficiency of Tourism. Ecol. Econ. 2005, 54, 417–434. [Google Scholar] [CrossRef]
- Sherafatian-Jahromi, R.; Othman, M.S.; Law, S.H.; Ismail, N.W. Tourism and CO2 emissions nexus in Southeast Asia: New evidence from panel estimation. Environ. Dev. Sustain. 2017, 19, 1407–1423. [Google Scholar] [CrossRef]
- Xu, X.B.; Chen, S.; Yang, G.S. Characteristics and impact mechanism of carbon emission for urban residents’ transport in the Yangtze River Delta, China. Resour. Env. Yangtze Basin 2014, 23, 1064–1071. (In Chinese) [Google Scholar]
- Becken, S. Operators’ perceptions of energy use and actual saving opportunities for tourism accommodation. Asia Pac. J. Tour. Res. 2013, 18, 72–91. [Google Scholar] [CrossRef]
- Tian, J.P. Modeling and empirical research on international metropolis tourism industrial structure multi-objective optimization model: Based on optimizing Shanghai tourism industrial structure. Shanghai J. Econ. 2012, 11, 100–111. (In Chinese) [Google Scholar]
Figure 1.
The study area—YRD.

Figure 2.
Research Framework.

Figure 3.
The proportion of CO2 emissions from tourism sectors within YRD (2001–2015). (a) Proportion of emissions from tourism; (b) Proportion of emissions from tourism transport; (c) Proportion of emissions from accommodation; (d) Proportion of emissions from tourism activities.
Figure 3.
The proportion of CO2 emissions from tourism sectors within YRD (2001–2015). (a) Proportion of emissions from tourism; (b) Proportion of emissions from tourism transport; (c) Proportion of emissions from accommodation; (d) Proportion of emissions from tourism activities.

Figure 4.
The decoupling relation between CO2 emissions and YRD’s tourism economy. (a) Decoupling relation in the YRD; (b) Decoupling relation in Jiangsu; (c) Decoupling relation in Zhejiang; (d) Decoupling relation in Shanghai.
Figure 4.
The decoupling relation between CO2 emissions and YRD’s tourism economy. (a) Decoupling relation in the YRD; (b) Decoupling relation in Jiangsu; (c) Decoupling relation in Zhejiang; (d) Decoupling relation in Shanghai.


Table 1.
The classification of the decoupling state and its relationship with sustainability.
| State | %ΔLCO2 | %ΔL | LD | Relationship with Sustainability |
|---|---|---|---|---|
| Strong decoupling | <0 | >0 | <0 | The best state towards sustainability under the low-carbon tourism economy. |
| Weak decoupling | >0 | >0 | 0 < LD < 1 | The state is desirable. |
| Negative decoupling | >0 | >0 | >1 | The state is not favorable for sustainability. |
| Recessive decoupling | <0 | <0 | >1 | The state is not favorable for sustainability. |
| Weak negative decoupling | <0 | <0 | 0 < LD < 1 | The state is not favorable for sustainability. |
| Strong negative decoupling | >0 | <0 | <0 | The worst state towards sustainability under the low-carbon tourism economy. |
Table 2.
The total amount of energy consumption and CO2 emissions from tourism in the YRD (2001–2015).
Table 2.
The total amount of energy consumption and CO2 emissions from tourism in the YRD (2001–2015).
| Year | Energy Consumption (108 MJ) | CO2 Emissions (104 t) | ||||||
|---|---|---|---|---|---|---|---|---|
| E1 | E2 | E3 | Total | C1 | C2 | C3 | Total | |
| 2001 | 760.85 | 106.97 | 29.09 | 896.90 | 488.70 | 169.44 | 15.41 | 673.55 |
| 2002 | 856.45 | 120.24 | 33.40 | 1010.09 | 551.46 | 190.46 | 17.64 | 759.57 |
| 2003 | 897.12 | 122.86 | 33.52 | 1053.50 | 580.57 | 194.60 | 17.65 | 792.83 |
| 2004 | 1288.31 | 183.92 | 41.12 | 1513.35 | 838.94 | 291.33 | 21.57 | 1151.84 |
| 2005 | 1428.85 | 182.13 | 47.45 | 1658.43 | 933.48 | 288.50 | 24.88 | 1246.86 |
| 2006 | 1611.26 | 188.65 | 55.72 | 1855.64 | 1055.28 | 298.83 | 29.24 | 1383.35 |
| 2007 | 1929.21 | 201.60 | 63.77 | 2194.58 | 1268.93 | 319.34 | 33.36 | 1621.63 |
| 2008 | 1994.38 | 171.46 | 72.36 | 2238.20 | 1311.01 | 271.59 | 38.20 | 1620.79 |
| 2009 | 2100.63 | 168.30 | 85.11 | 2354.03 | 1380.84 | 266.58 | 45.32 | 1692.74 |
| 2010 | 2450.10 | 152.87 | 112.61 | 2715.58 | 1606.73 | 242.15 | 60.49 | 1909.37 |
| 2011 | 2666.14 | 146.98 | 138.00 | 2951.12 | 1747.28 | 232.81 | 75.46 | 2055.54 |
| 2012 | 2614.91 | 173.60 | 161.63 | 2950.13 | 1705.75 | 274.98 | 88.48 | 2069.22 |
| 2013 | 2531.50 | 138.29 | 177.66 | 2847.45 | 1621.62 | 219.04 | 97.59 | 1938.25 |
| 2014 | 2685.06 | 137.55 | 239.57 | 3062.18 | 1704.57 | 217.88 | 139.54 | 2061.99 |
| 2015 | 2810.54 | 138.19 | 258.67 | 3207.40 | 1782.62 | 218.89 | 150.76 | 2152.27 |
Note: E1, E2, and E3 represent EC of tourism transport, accommodation, and activities, respectively. C1, C2, and C3 are the CE of tourism transport, accommodation, and activities.
Table 3.
The decomposition of CO2 emissions from tourism in the YRD (2001–2015).
| Factor | Sector | 2001–2005 | 2006–2010 | 2011–2015 | 2001–2015 |
|---|---|---|---|---|---|
| Industry size/104 t | JT | 488.51 | 1020.59 | 757.44 | 2266.54 |
| J1 | 360.77 | 824.41 | 636.63 | 1821.81 | |
| J2 | 117.35 | 169.13 | 81.52 | 368.00 | |
| J3 | 10.38 | 27.05 | 39.29 | 76.72 | |
| Expenditure size/104 t | JT | 196.41 | 42.59 | 131.10 | 370.10 |
| J1 | 145.05 | 31.36 | 110.19 | 286.61 | |
| J2 | 47.18 | 10.20 | 14.11 | 71.49 | |
| J3 | 4.18 | 1.03 | 6.80 | 12.00 | |
| Energy intensity/104 t | JT | −272.90 | −296.50 | −382.50 | −951.90 |
| J1 | −49.48 | −182.14 | −253.24 | −484.86 | |
| J2 | −219.29 | −98.73 | −88.23 | −406.25 | |
| J3 | −4.13 | −15.63 | −41.03 | −60.79 | |
| Spatial structure/104 t | JT | −13.25 | −59.96 | −322.98 | −396.18 |
| J1 | −22.58 | −63.06 | −330.15 | −415.79 | |
| J2 | 8.74 | 2.77 | 0.63 | 12.14 | |
| J3 | 0.59 | 0.33 | 6.55 | 7.47 | |
| Sectorial structure/104 t | JT | 2.04 | −84.06 | −17.60 | −99.62 |
| J1 | 6.13 | 34.76 | −59.07 | −18.18 | |
| J2 | −2.73 | −136.29 | −21.95 | −160.97 | |
| J3 | −1.35 | 17.47 | 63.42 | 79.53 | |
| Total/104 t | JT | 400.82 | 622.66 | 165.46 | 1188.94 |
| J1 | 439.90 | 645.33 | 104.36 | 1189.59 | |
| J2 | −48.75 | −52.92 | −13.92 | −115.59 | |
| J3 | 9.67 | 30.24 | 75.02 | 112.76 |
Notes: JT: tourism industry; J1: tourism transport; J2: tourism accommodation; J3: tourism activities.
Table 4.
The decomposition of CO2 emissions from tourism within the YRD (2001–2015).
| Year | Sub-Region | Sector | Industry Size/104 t | Expenditure Size/104 t | Energy Intensity/104 t | Spatial Structure/104 t | Sectorial Structure/104 t |
|---|---|---|---|---|---|---|---|
| 2001–2005 | Jiangsu | J1 | 98.43 | 39.57 | −84.91 | 27.76 | −16.42 |
| J2 | 42.61 | 17.13 | −36.76 | 12.02 | 35.44 | ||
| J3 | 4.11 | 1.65 | −3.55 | 1.16 | 2.20 | ||
| Zhejiang | J1 | 94.39 | 37.95 | −73.84 | 20.49 | −3.05 | |
| J2 | 44.21 | 17.78 | −202.40 | 9.60 | 5.21 | ||
| J3 | 3.25 | 1.31 | −2.55 | 0.71 | 0.86 | ||
| Shanghai | J1 | 167.96 | 67.53 | 109.28 | −70.82 | 25.60 | |
| J2 | 30.53 | 12.28 | 19.87 | −12.87 | −43.37 | ||
| J3 | 3.02 | 1.21 | 1.96 | −1.27 | −4.41 | ||
| 2006–2010 | Jiangsu | J1 | 171.95 | 6.54 | −159.88 | 19.38 | 13.81 |
| J2 | 67.07 | 2.55 | −62.36 | 7.56 | −61.73 | ||
| J3 | 11.28 | 0.43 | −10.49 | 1.27 | 9.21 | ||
| Zhejiang | J1 | 192.16 | 7.31 | −14.09 | 5.96 | 13.25 | |
| J2 | 66.41 | 6.29 | −35.74 | 2.06 | −47.59 | ||
| J3 | 9.34 | 0.36 | −5.03 | 0.29 | 5.00 | ||
| Shanghai | J1 | 460.30 | 17.51 | −8.17 | −88.40 | 7.70 | |
| J2 | 35.65 | 1.36 | −0.63 | −6.85 | −26.96 | ||
| J3 | 6.42 | 0.24 | −0.11 | −1.23 | 3.26 | ||
| 2011–2015 | Jiangsu | J1 | 116.46 | 20.16 | −129.49 | 20.23 | −22.53 |
| J2 | 28.64 | 4.96 | −31.84 | 4.97 | −14.50 | ||
| J3 | 16.72 | 2.89 | −18.59 | 2.90 | 26.98 | ||
| Zhejiang | J1 | 121.28 | 20.99 | −207.40 | 45.78 | −28.43 | |
| J2 | 35.15 | 6.08 | −60.11 | 13.27 | −7.17 | ||
| J3 | 14.15 | 2.45 | −24.20 | 5.34 | 29.57 | ||
| Shanghai | J1 | 398.88 | 69.04 | 83.65 | −396.16 | −8.10 | |
| J2 | 17.74 | 3.07 | 3.72 | −17.62 | −0.29 | ||
| J3 | 8.41 | 1.46 | 1.76 | −1.70 | 6.87 |
Notes: J1: tourism transport; J2: tourism accommodation; J3: tourism activities.
© 2018 by the authors. Licensee MDPI, Basel, Switzerland. This article is an open access article distributed under the terms and conditions of the Creative Commons Attribution (CC BY) license (http://creativecommons.org/licenses/by/4.0/).
Share and Cite
MDPI and ACS Style
Chen, L.; Thapa, B.; Yan, W. The Relationship between Tourism, Carbon Dioxide Emissions, and Economic Growth in the Yangtze River Delta, China. Sustainability 2018, 10, 2118. https://doi.org/10.3390/su10072118
AMA Style
Chen L, Thapa B, Yan W. The Relationship between Tourism, Carbon Dioxide Emissions, and Economic Growth in the Yangtze River Delta, China. Sustainability. 2018; 10(7):2118. https://doi.org/10.3390/su10072118
Chicago/Turabian StyleChen, Lingling, Brijesh Thapa, and Wei Yan. 2018. "The Relationship between Tourism, Carbon Dioxide Emissions, and Economic Growth in the Yangtze River Delta, China" Sustainability 10, no. 7: 2118. https://doi.org/10.3390/su10072118
Note that from the first issue of 2016, this journal uses article numbers instead of page numbers. See further details here.