Grid Load Shifting and Performance Assessments of Residential Efficient Energy Technologies, a Case Study in Japan


1
Faculty of Environmental Engineering, The University of Kitakyushu, Kitakyushu 808-0135, Japan
2
Institute of Mechanical Engineering, Tongji University, Siping Road 1239, Shanghai 20092, China
3
Faculty of Economics and Business Administration, The University of Kitakyushu, Kitakyushu 802-8577, Japan
*
Author to whom correspondence should be addressed.
Sustainability 2018, 10(7), 2117; https://doi.org/10.3390/su10072117
Submission received: 22 May 2018
/
Revised: 13 June 2018
/
Accepted: 17 June 2018
/
Published: 21 June 2018
(This article belongs to the Section Energy Sustainability)
Abstract
:The increasing penetration of renewable energy decreases grid flexibility; thus, decentralized energy management or demand response are emerging as the main approaches to resolve this limitation and to provide flexibility of resources. This research investigates the performance of high energy efficiency appliances and grid-integrated distributed generators based on real monitored data from a social demonstration project. The analysis not only explores the potential cost savings and environmental benefits of high energy efficiency systems in the private sector, but also evaluates public grid load leveling potential from a bottom-up approach. This research provides a better understanding of the behavior of high decentralized efficient energy and includes detailed scenarios of monitored power generation and consumption in a social demonstration project. The scheduled heat pump effectively lifts valley load via transforming electricity to thermal energy, its daily electricity consumption varies from 4 kWh to 10 kWh and is concentrated in the early morning over the period of a year. Aggregated vehicle to home (V2H) brings flexible resources to the grid, by discharging energy to cover the residential night peak load, with fuel cost savings attributed to 90% of profit. The potential for grid load leveling via integrating the power utility and consumer is examined using a bottom-up approach. Five hundred thousand contributions from scheduled electrical vehicles (EVs) and fuel cells provide 5.0% of reliable peak power capacity at 20:00 in winter. The outcome illustrates the energy cost saving and carbon emission reduction scenarios of each of the proposed technologies. Relevant subsidies for heat pump water heater systems and cogeneration are essential customers due to the high initial capital investment. Optimal mixes in structure and coordinated control of high efficiency technologies enable customers to participate in grid load leveling in terms of lowest cost, considering their different features and roles.
1. Introduction
The impact of climate change and sustainable energy growth have heightened the urgency for investigation into next generation energy and social system models in Japan, especially after the Fukushima nuclear disaster on March 2011. Following this, Japan shut down almost all of its nuclear power plants, which accounted for around 30% of total power generation. Now, the tight balance between the demand and supply of power at peak hours in Japan is obvious, and the ambitious plan to reduce GHG (greenhouse gas) emissions (a 25% reduction by 2020 compared with 1990 level) has become unfeasible under this scenario. In order to tackle the tight grid demand-supply balance scenario, especially during peak demand periods, enormous political and technical efforts are being taken to replace the loss of the nuclear energy. Extensive research efforts have focused on power supply optimization, and considering features of both power supply and demand, such as the dispatch of pumped hydro storage, demand response management, variable renewable energy (VRE) feed-in tariff schemes and retail market liberalization, Komiyama and Fujii [1]. VRE is expected to play a significant role in enhancing Japan’s energy self-sufficiency and greenhouse gas reduction. However, it is predicted that due to low correlation between fluctuating VRE generation and instantaneous electric power demand, increasing VRE integration will lead to a nonlinear decrease in residual load and cause curtailment of variable renewables due to limits in grid flexibility, which also influences the effective utilization and market value of regional VRE [2,3,4]. Currently, the building sector is trending towards decentralized, more efficient technologies to cover electrical or heating loads. Hence, with the increase in efficient power technologies being installed in the electrical distribution grid, planning their integration into the public grid is also needed. This is similar to the integration of renewable energy resources, where consumers adjust their energy consumption patterns to provide flexibility of resources.
Researchers [5,6,7,8,9] have examined the performance of demand side management strategies, such as uptake of energy saving appliances, integration of flexible power technologies, and relevant incentive policies to encourage customers to participate more in local or community power supply management. Relevant studies have discussed the impact on load shifting of implementing high efficiency technologies such as heat pump water heaters, distributed PV system and EV with a coordinated demand response scheme. Heat pump water heaters are generally considered as useful appliances for environmental protection and load shifting. The uptake of heat pumps is generally supported by specific electricity tariff schemes in the energy market and policy implications. Klein, Herkel [7] analyzed the cumulative load shifting potential in the heating and cooling sector, and found that different flexibility and storage options can be used to alter the load trajectory. Goto, Goto [8] states that an increase in energy price will enhance the selection rate of Eco-cute, and that cost reductions will be effective under specific tariff structures. Love, Smith [10] analyzed the effects of the uptake of heat pumps on the Great Britain national electricity grid from an aggregated perspective, using a simple upscaling method to add heat pump electrical load to the national grid which indicated peak demand and ramp rate increases. Fischer, Wolf [11] assessed the flexibility of the residential heat pump model considering maximum power, shiftable energy and regeneration time, with results showing that flexibility is highly dependent on ambient temperature. Baeten, Rogiers [12] simulated control models for heat pump and thermal storage, and the results indicated that customers with heat pump heating systems can effectively participate in reducing peak generation capacity. With the expansion in the use of grid-connected on-site generators, power storage can provide customers with potential cost saving benefits by allowing them to manage their local power consumption under specific electricity market conditions. Meanwhile, this also adds flexibility to the grid in an aggregated form. Komiyama and Fujii [13] pointed that lower rechargeable battery cost can decrease the PV output suppression rate after large-scale PV energy is integrated into the grid. Rodriguez-Calvo, Cossent [14] investigated the technical impact of the future integration of electrical vehicles and PV generation, considering residential demand and homogeneously distributed EV and PV, EV charging works effectively in off-peak valley hours, excess PV production increases the degree of load imbalance. Management for the operation and planning of distributed energy systems is important. White and Zhang [15] examined the potential financial return for using vehicle to grid (V2G) as a grid resource for peak load reduction and regulation on a daily basis. Aggregated V2G participation may create a formal storage market with higher penetration of intermittent resources. Mohammadi, Mehrtash [16] analyzed the features of power networks to find a set of suitable portions with the aim of convergence performance improvement. Amini and Islam [17] uses a genetic algorithm to find the best allocation of parking lots. Bahrami and Parniani [18] proposes a load management strategy for EV charging to reduce peak load, and used a stochastic approach to enable smart chargers to schedule EVs based on historical charging data, thus minimizing the cost of charging for the vehicle owner. Recently, price-based demand response has been widely implemented in the power market, shifting part of the behavioral-based responsive load between different periods to reduce energy costs [19,20]. Rahmani-andebili [21] proposed linear and nonlinear modeling for the incentive-based and price-based demand response programs that have been implemented in several real power markets. In Rahmani-andebili [22] modelled implementation of demand response programs considering the power unit commitment, results indicating that residential customers can decrease the cost of power using cooperative demand side management strategies, and the carbon emission from thermal power plants is also reduced. Rahmani-Andebili and Shen [23] investigates price-controlled energy management of smart homes through a bi-level optimization framework. Smart homes achieve cost saving through scheduling the daily power consumption load. Driven by the potential benefits of demand side management, HEMS (Home Energy Management System, Panasonic) is widely promoted to reduce household energy in Japan. A national energy roadmap launched by METI (Ministry of Economy, Trade and Industry) launched in 2014 states that the Japanese Government is committed to the realization of low energy consumption households, for example, all newly constructed houses are expected to be equipped with HEMS by 2030.
Buildings offer the potential for on-site energy generation (e.g., rooftop PV, cogeneration systems, Panasonic) and different storage options (e.g., thermal tank and battery), and their integration into the public grid needs to be planned similarly to the integration of renewable energy resources, providing flexible resources to the grid. The first aim of this research is to present the performance of high efficiency technology applications in the residential sector, and to classify the variability in local power generation and load consumption. Then, we examine the grid load leveling potential of coordinated demand side management strategies from a bottom-up approach. This study also presents their economic and environmental benefits, numerically, under the current electricity market in Japan.
The paper is organized as follows: Section 2 provides an overview of the public power supply system and the data resources. Section 3 develops a better understanding of the behaviors of decentralized high efficiency energy systems based on real monitored applications and investigates the performance of the high efficiency technology applications with coordinate management strategies. Section 4 discusses the impacts of demand side management on the public grid from an aggregated perspective and estimates the economic and environmental benefits. Finally, conclusions and suggestions are provided.
2. Objective and Motivation
2.1. Location Scenario
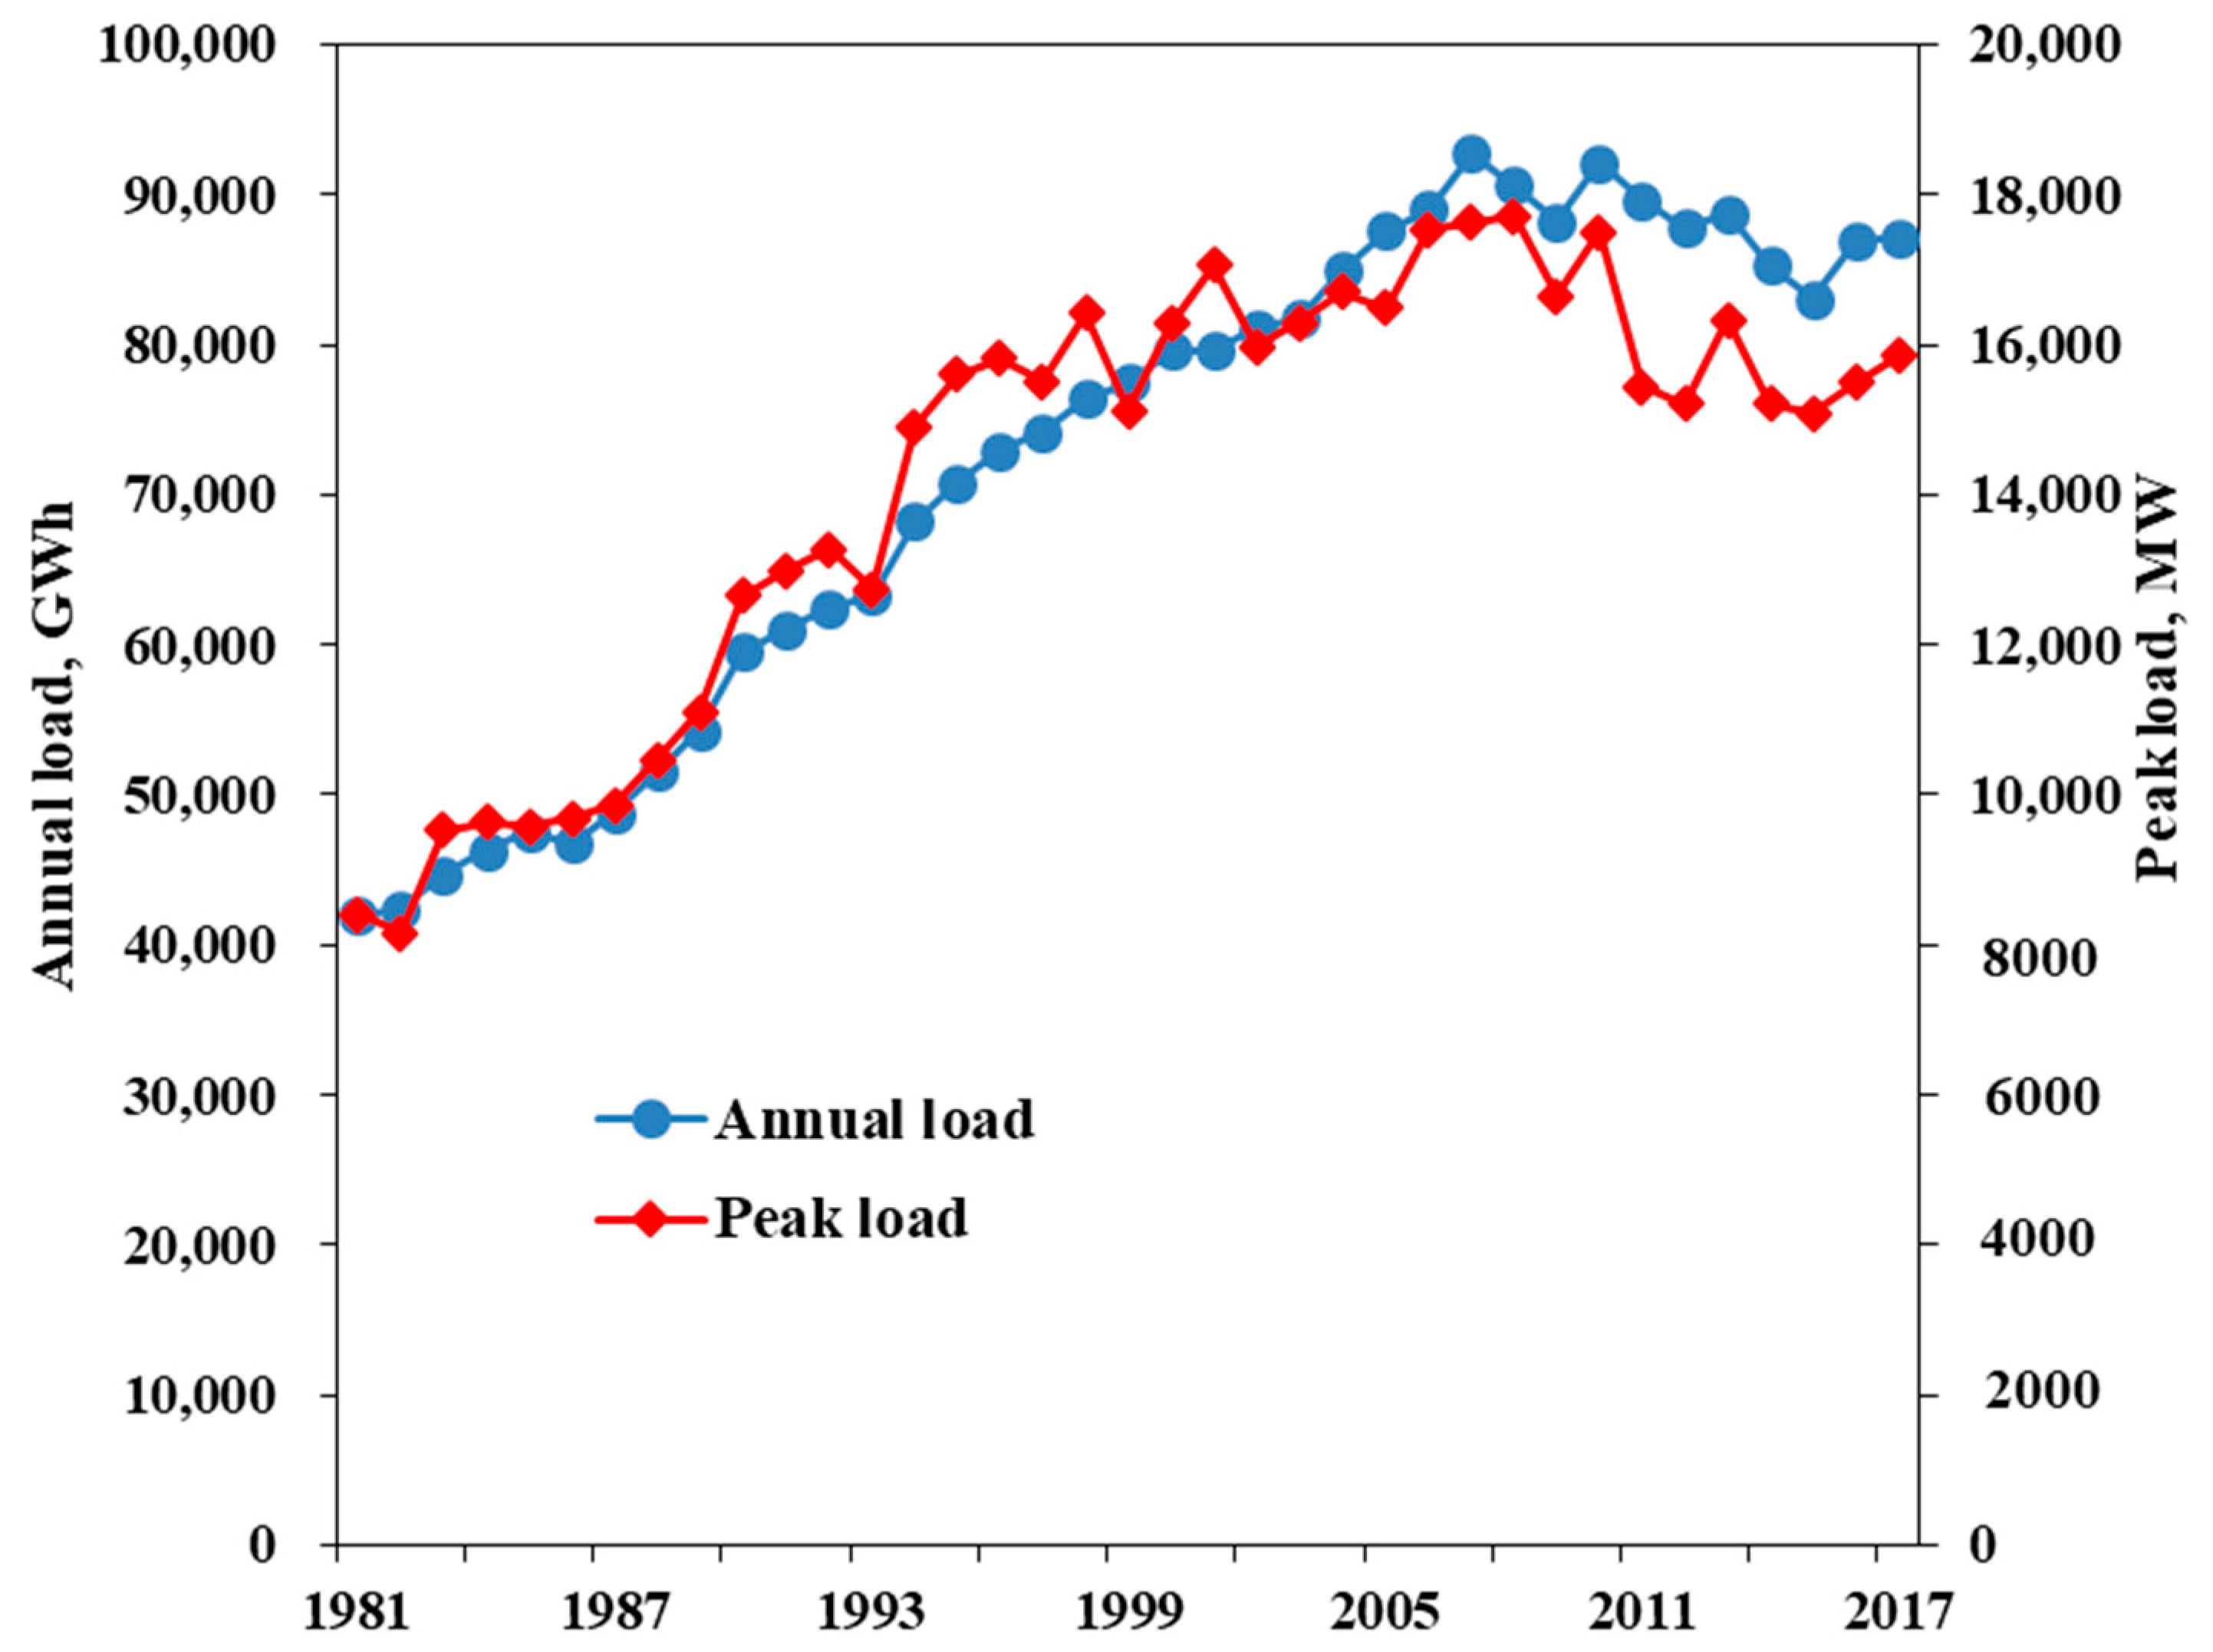
Currently, PV generation is the renewable energy resource that is playing the main role in enhancing energy self-sufficiency at the district level, since the feed-in tariff was launched in 2012 in Japan. For example, the integrated cumulative capacity of PV reached 787 MWp in February, 2018 in Kyushu, accounting for 24.5% of the total district power capacity. Increasingly, intermittent sources provide a large proportion of variable and less flexible generation; Kyushu Electric Power even declared a temporary halt to VRE integration because of concern that PV output could impact the lower demand during the mid-season in September 2014. Figure 1 presents the locational scenario of the area we examined in this paper. Kyushu lays off the south end of Honshu; as Japan’s third largest island the population reached 13 million by the end of 2017, which is 10.2% of the national population, the land area covers 42,231 km2, which is 11.2% of the national land area. Kyushu Electric Power sales amounted to 9.2% of the nationwide electricity business, according to the Kyuden annual report, 2017. Figure 2 describes the trend of yearly and hourly peak demand trends from 1981 to 2017 in the Kyushu public grid. It shows a steady growth trend before 2005, then it experiences a decrease mainly influenced by a nationwide electricity saving campaign during 2012 in response to the tight power supply-demand scenario. Recently, the peak demand and yearly load have reached saturation level.
2.2. Data Resources
Historical public grid loads were collected from the Kyuden Power Company website at hourly interval over 2017 [24], Figure 3 describes the daily average demand curves in the public grid. During the mid-season months, it shows a relatively flat daily demand curve. Higher daily variations occur in the summer and winter seasons due to the increasing air conditioning loads, the average summer peak load driven by the massive cooling demand reaches around 14,000 MWh as much as 1.6 times of the valley-load. We note that averaging the time series over a day may lead to an underestimation in variations in the daily demand curve. Daily load in winter generally experiences two peak periods in the morning and night driven by the increase in heating demand. Load leveling and peak load shifting have become important strategies for the grid utilities who are concerned about power balancing security and quality maintenance, especially during the summer and winter seasons.
2.3. Motivation
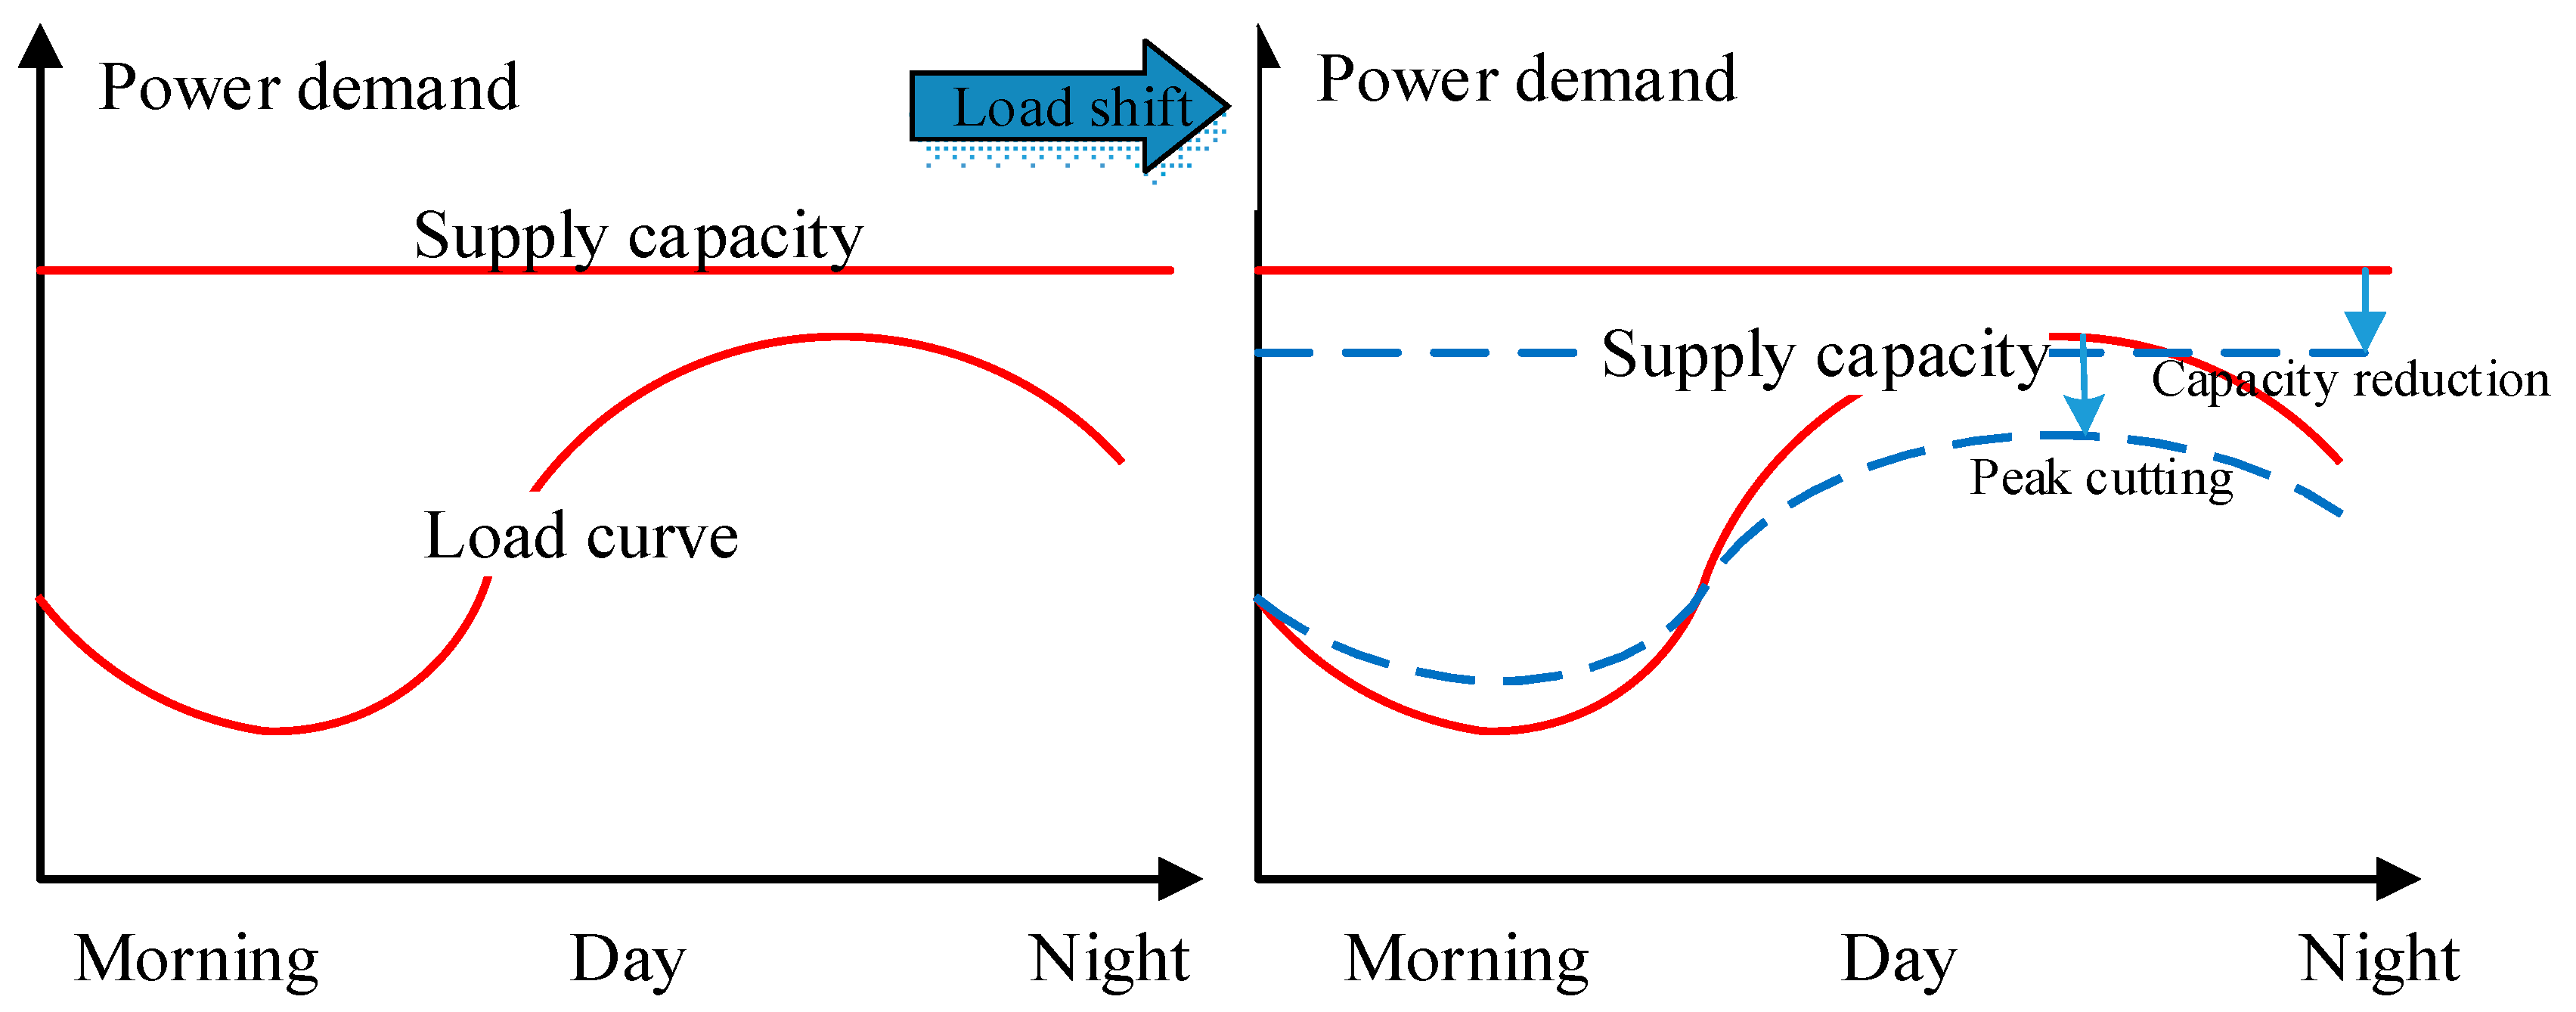
As shown in Figure 4, load shifting can bring benefits to both power demand and supply sides. For demand users, the overall operational cost can be reduced due to the high price during peak period. As illustrated in Figure 4, grid load leveling can be achieved by valley bottom-up and peak cutting, enhancing the grid flexibility on a daily basis. In the following section we will examine the load level potential from high efficiency technologies from a bottom-up approach as illustrated in Hainoun [25].
Renewable production is hard to schedule since it is highly dependent on nature. With increasing levels of renewable penetration, grid generation becomes less flexible to balance the flexibility. Demand side management is seen as a promising resource to increase the flexibility of the power system. Coordinated demand side management can reduce the customer’s overall costs via shifting peak load during the peak price period. For suppliers, benefits can be obtained through the investment in additional power generation facilities. As a result, the responsibility for grid flexibility does not fall solely on the plant side, but also requires flexibility on the part of the demand side management. Figure 5 illustrates the schematic overview of the research, the black line refers to power flow, the dashed blue line represents the signal flow, and the red dotted line is thermal flow: on the plant side, thermal plants, renewable energy and nuclear energy serve as the main power resources to meet variable grid load, the central load dispatch center sends the price signal to the consumers and receives real-time power consumption from smart meters; thus, providing chances for cooperation between the utility and consumers. V2H, heat pumps and on-site generators are implemented on the demand side, and are designed to shift the owner’s load pattern and reduce energy consumption or cost.
3. High Efficiency Technologies
This part will mainly describe the performance of high efficiency technology applications in next-generation energy and social systems demonstration projects in Kyushu, Japan. Firstly, daily residential power load curves for each month are calculated by averaging 200 residential households, and the power consumption ratios of heat pump water systems over a week in different seasons were investigated in detail in 10 households. Then, the detailed power flows of EV over 153 days in a residential application are described. Finally, the production scenario for a PV/fuel cell hybrid power system is presented based on a social experiment demonstration project in Kitakyushu.
3.1. Heat Pump Water Heaters
Energy for hot water accounts for about 30% of total residential energy consumption in Japan According to Zhang, Qin [26], numerous heat pump water heaters have been developed for the residential sector, alongside the promotion of all-electrification households over recent years. Thermal storage applications are integrated to shift daily energy consumption patterns, and generally schedule the working time of heat pump water heater in the lower pricing region (early morning and deep night) to provide potential economic benefits for customers. Figure 6 presents the structure of a residential household with a heat pump water system, the unit capacity and water tank volume generally falls in the range of 4.5/6.0 kW and 370/460 L, respectively. Annual average coefficient of performance (COP) of the Eco-cute CO2 heat pump water heater normally ranges from 3.2 to 3.8. There has been a steady increasing trend in the uptake of heat pump water heaters in recent years; the cumulative number of heat pump water heaters in Japan’s residential sector has reached around six million. In order to investigate the operational scenario of the residential heat pump water heater, we collected the monitored historical loads at hourly interval of 200 residential households with the Eco-cute system in the Kitakyushu Smart Community Demonstration Project.
Figure 7 presents the color-scale distribution of residential load each month for households equipped with a heat pump water heater system. The daily energy consumption pattern has a strong relationship with the customer’s habits, with two daily peak periods of household load mainly occurring in the early morning and the evening. It can also be clearly seen that the baseload increases during air conditioning seasons and that early morning peak load driven by the utilization of the heat pump water heater increases, due to the production of hot water that generally lasts from 0:00 to 6:00 a.m. when the electricity price is cheap according to time-of-use pricing schemes.
In order to investigate the detailed consumption structure and seasonal variations, the power consumption of 10 selected households were collected over a week, including the detailed consumption of the heat pump, lights, air conditioner and others. Figure 8 illustrates the distributions of monitored heat pump water heater power consumption ratios of daily load in different seasons, generally range from 20~45%. Increasing heating demand, drop in COP of heat pump and rising energy loss jointly lead the increases of heat pump power consumption during winter period.
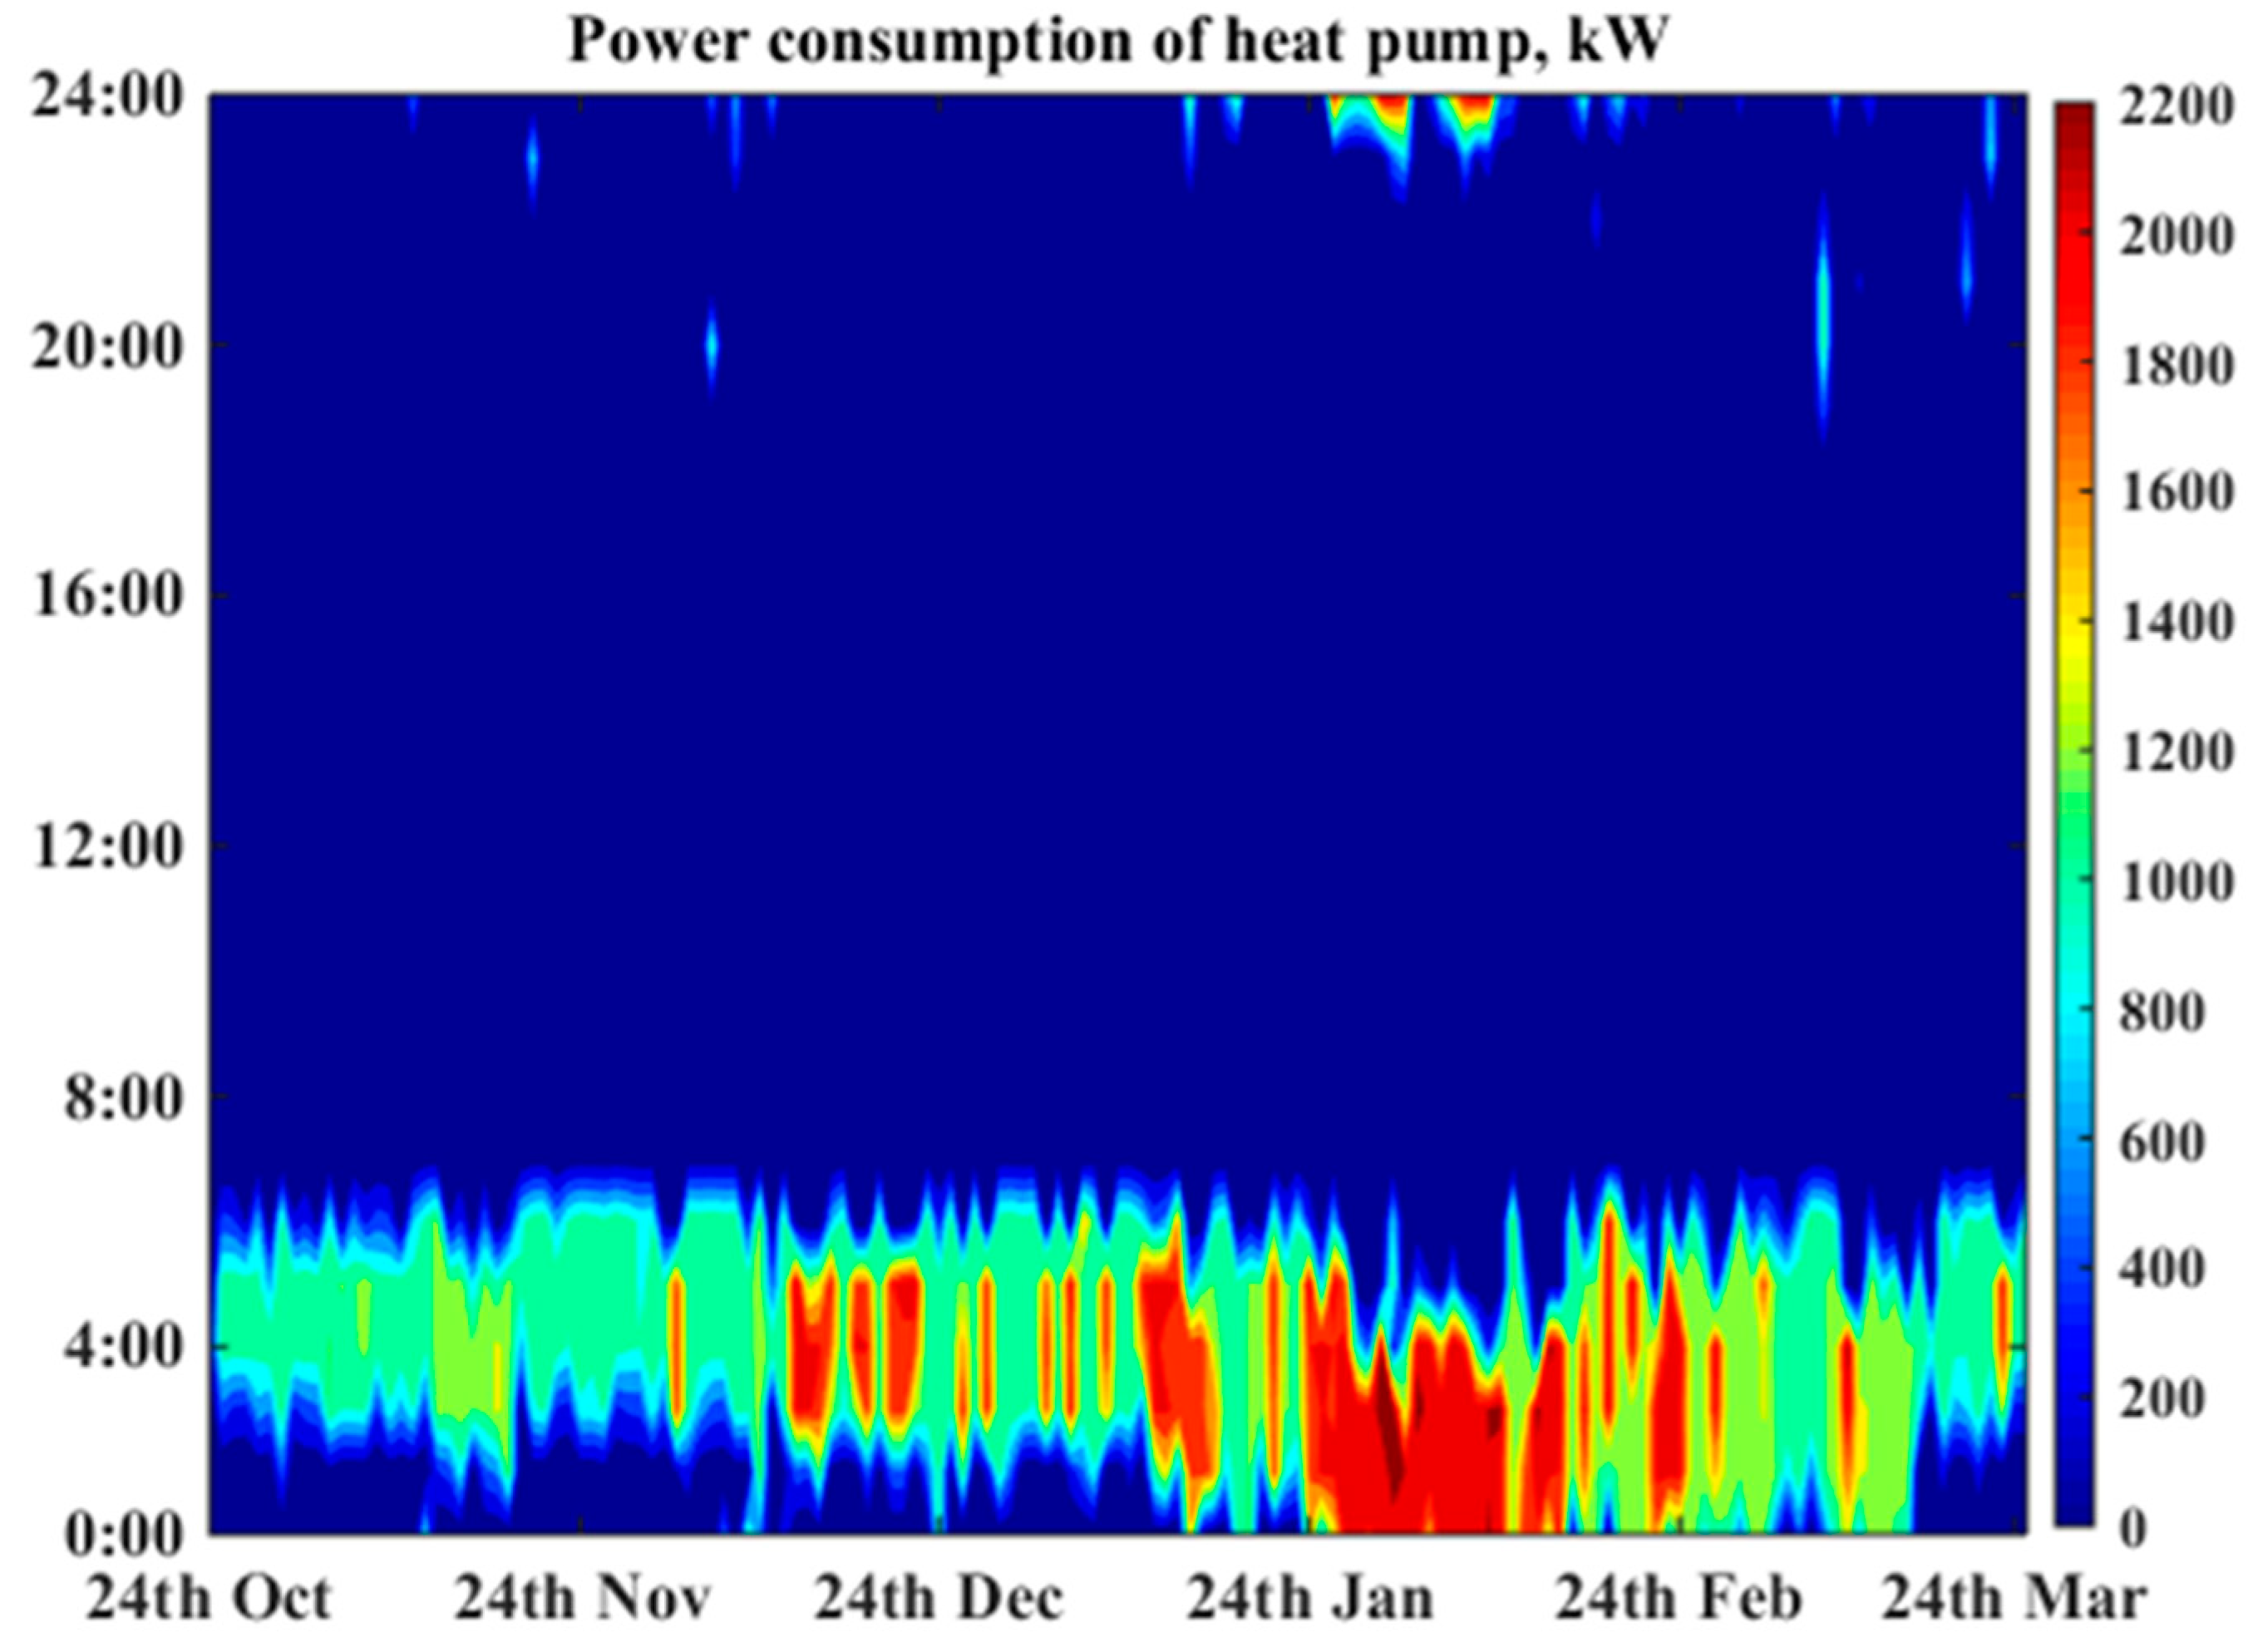
Figure 9 presents the color scale distributions of the power consumption of a heat pump water heater in a typical residential household. The working period of the heat pump is usually from 0:00 to 7:00 a.m., in the valley period of the demand load. Operating time becomes shorter with daily decreasing heating demand, and the heat pump water heater system shows higher power consumption density in the winter, which can be attributed to the higher heating demand and lower generating efficiency under low ambient temperature. Heat pump water heaters tend to operate earlier in winter time to meet the daily heating load, which may be highly dependent on the activity-based load.
3.2. EV (V2H)
Grid utilities has been making efforts by giving incentives to V2H customers to modify their power consumption using a scheduling strategy that enables EV to charge during the grid valley period and to discharge power to the home at night; this is typically accomplished in a HEMS environment. Electrical vehicles for residential demand response could bring potential benefits to both the power supply and demand side, supporting peak reduction from the aggregated form and reducing customer energy costs under time-of-use tariff schemes. Figure 10 illustrates the structure of the examined residential V2H system in the Kitakyushu Jono Smart Community Project.
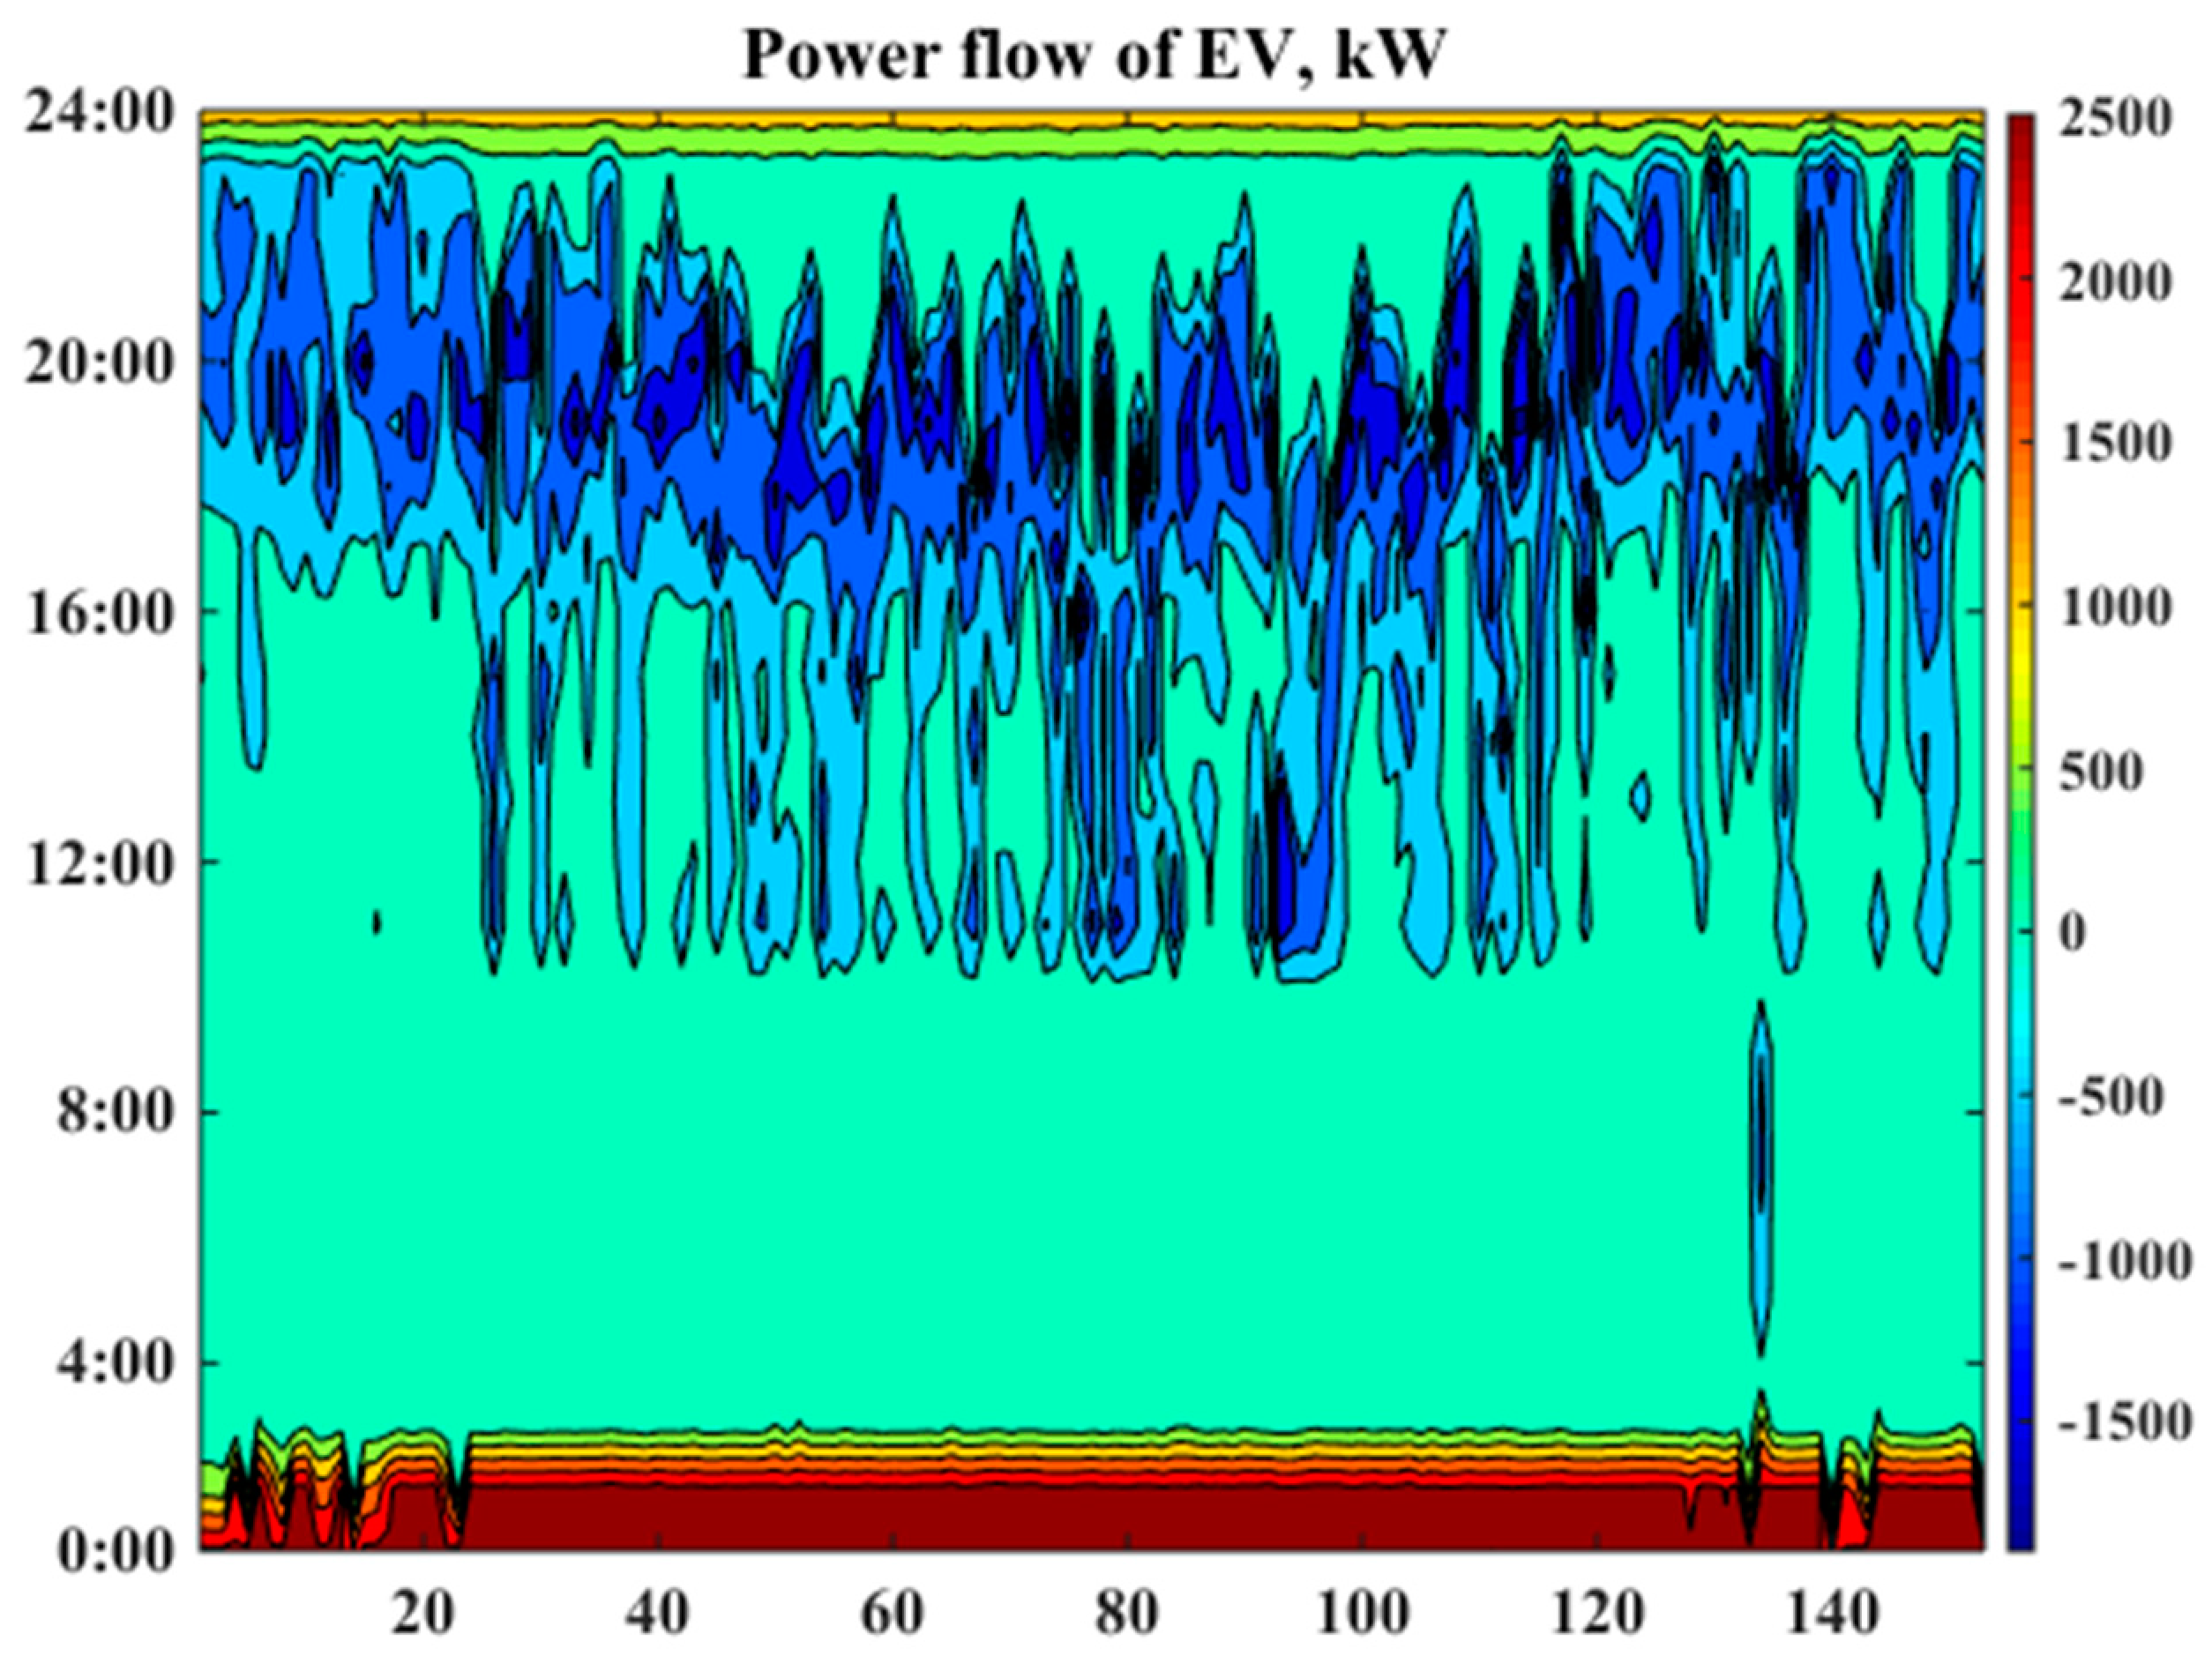
The working condition of an EV in a typical household is illustrated in Figure 10. The controller can determine the charge/discharge condition of the battery considering the price signal from the grid. Figure 11 describes the distribution of power flows from residential EV system in Jono, Kitakyushu, over 153 days. Plug-in conditions are mainly concentrated in the middle of the night from 23:30 to 3:00 and the discharge domain generally occurs after work and lasts from 17:00 and 23:00. This actually charging/discharging operation of the battery coincides with grid valley and peak demand. EV uptake could lead to a valley increase of 2.5 kW and provide around 1.5 kW peak reduction in the evening, meaning that the daily charge power is around 8.5 kWh and around 41% of charged power will be released to home electricity consumption, that is, around half of the stored power will be used to replace the oil consumption of the EV car. The color distribution of power flows from EVs confirms that expanded use of EVs could be scheduled to support grid operation during daily use from an aggregated perspective.
3.3. On-Site Generators
Distributed on-site generators, such as PV and cogeneration systems are playing an increasing role in enhancing local energy self-sufficiency in Japan. Figure 12 describes the structure of a residential hybrid on-site energy supply system, the grid connected PV capacity is 4.84 kWp, the fuel cell has 0.70 kWp nominal output equipped with 140 L thermal tank for hot water storage; cogeneration runs in the combined heating and power mode tracking thermal load. When the PV production is greater than the simultaneous electrical demand, excess generation will be sold into the grid. If the total production from the PV and fuel cell is still unable to cover the residential load, electricity will be imported from the grid to cover the shortage.
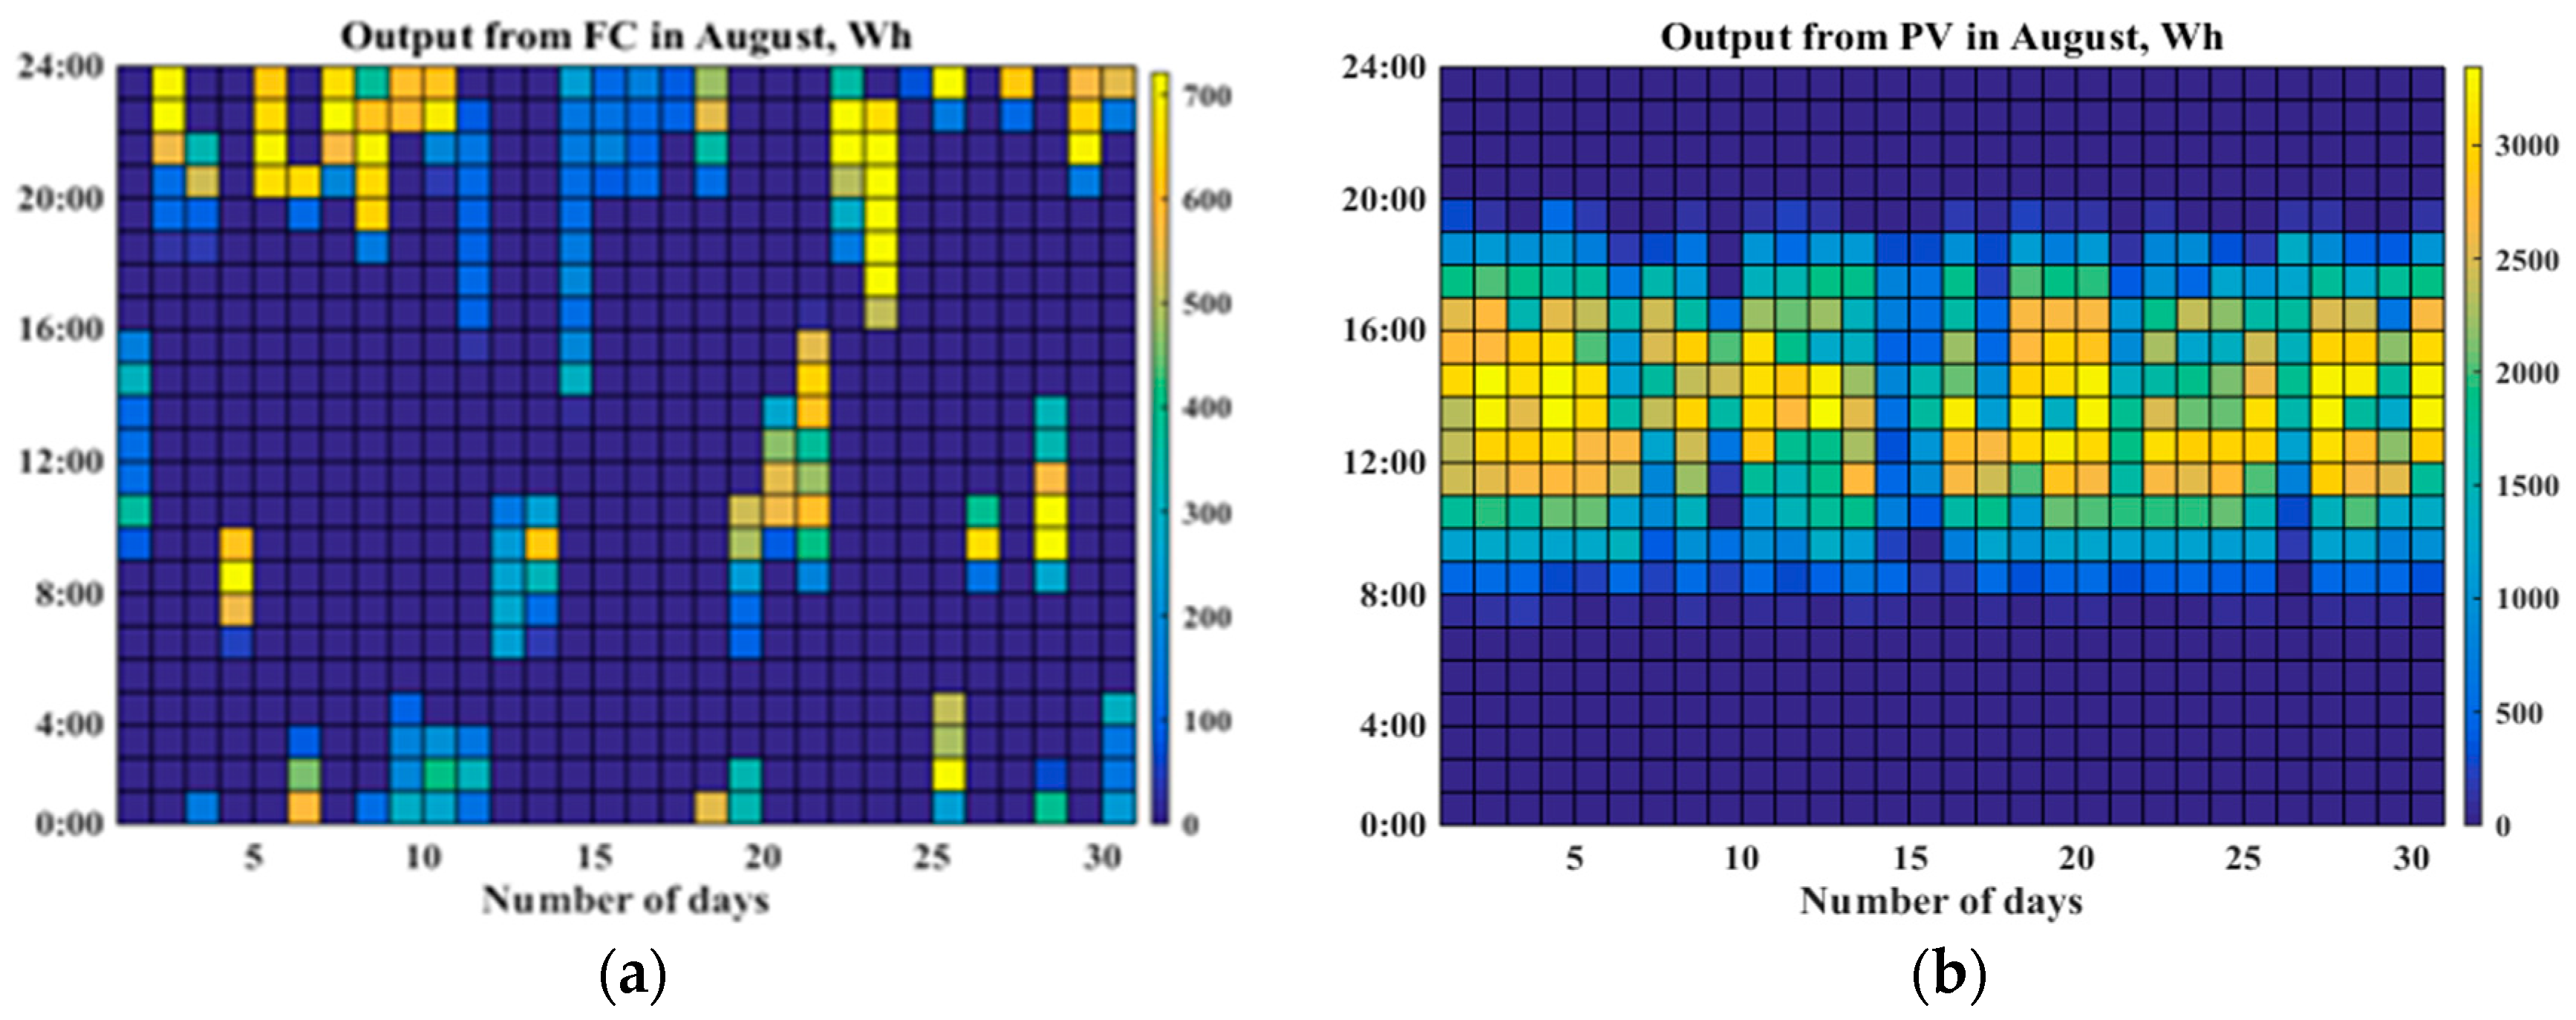
Figure 13, Figure 14 and Figure 15 demonstrate the detailed daily variabilities in PV (a) and fuel cell outputs (b) in color scale distributions for August, October and January, which represent the summer, mid-season and winter, respectively. The operation of cogeneration follows a thermal tracking strategy, and the working period and output from the fuel cell have a strong relationship with the amount of daily heating demand. The output of PV highly depends on the weather conditions and shows low power supply credit on winter or mid-season days, it shows higher power density in the summer period.
4. Analysis and Results
4.1. Impacts on Grid
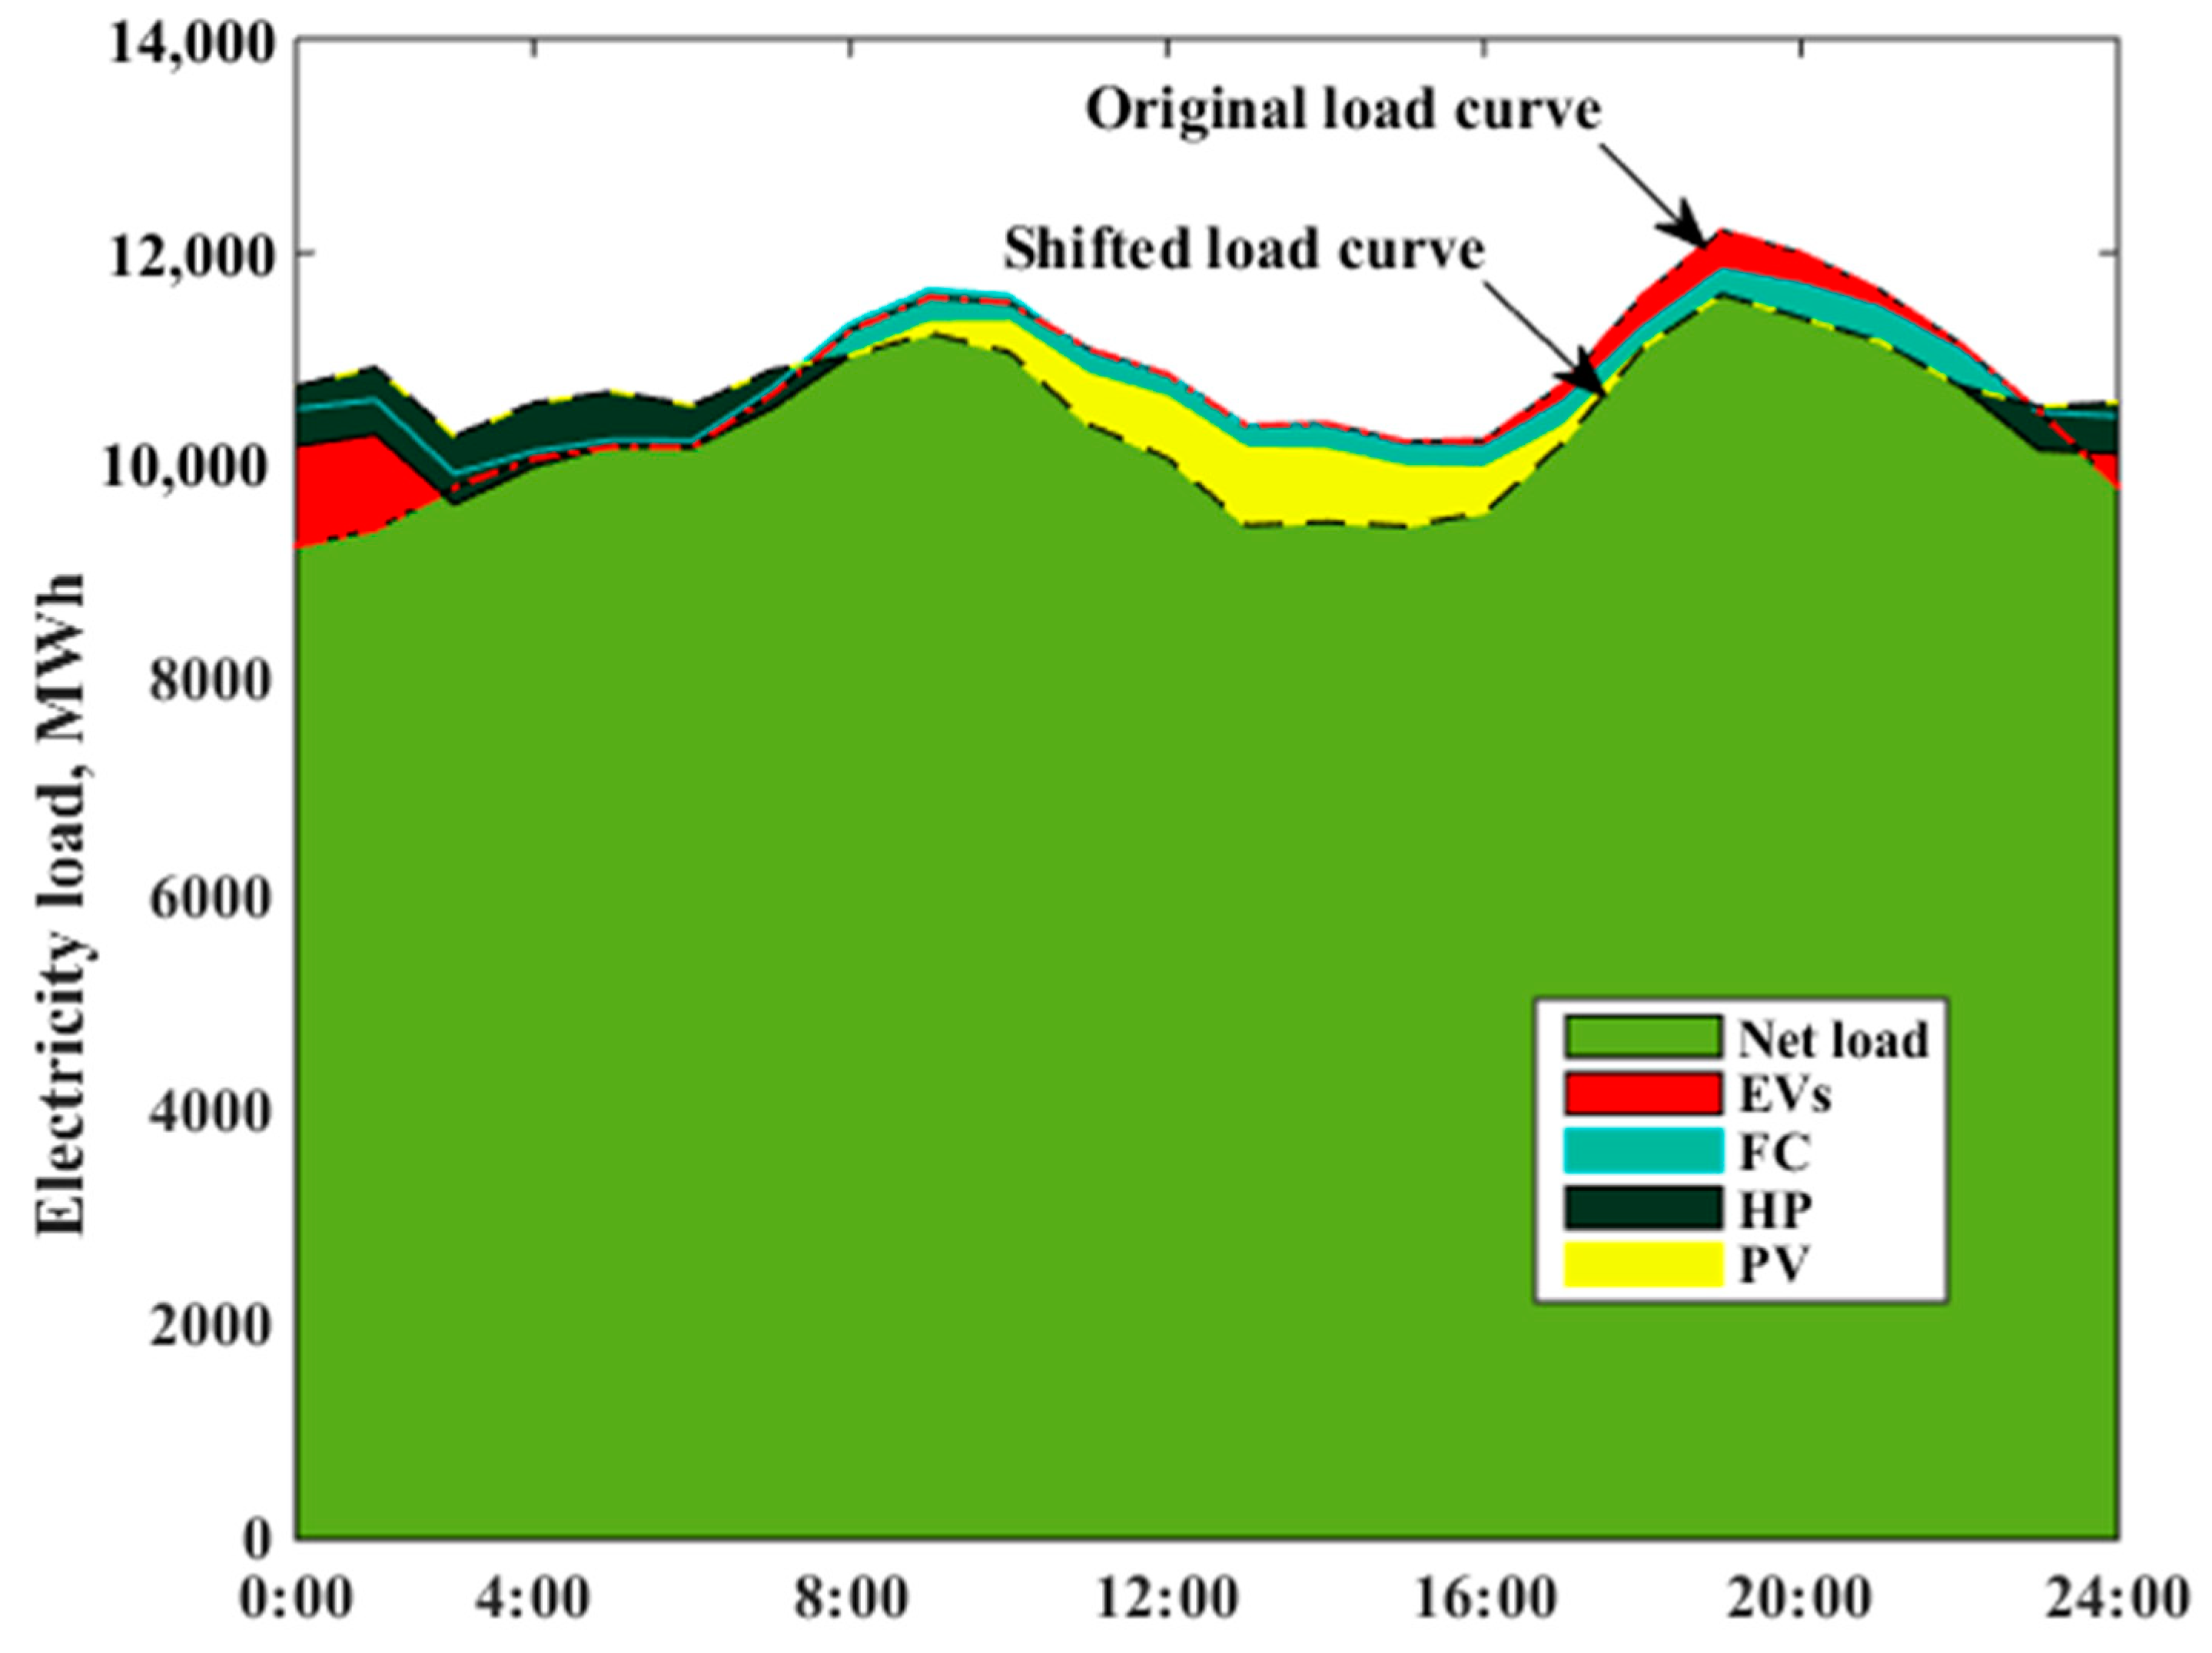
Currently, the residential sector accounts for around 33% of total power consumption in Japan. This part takes a bottom-up engineering approach to estimate the impact of aggregated residential high efficiency energy technologies on the real world public grid. Assuming the load shape effects have a linear relationship with, and the participation rate of high efficiency technologies, we estimated the load leveling potential for 500,000 participants for the abovementioned technologies. Considering that the need for load leveling and power balancing pressure mainly occur in air conditioning seasons, we examine daily load shifting performances in August and January. As shown in Figure 16, the red dotted line represents the original daily demand curves in August, with cooling demand leading to two peak periods in the daytime and early night. The EVs and heat pump water heaters mainly bottom-up the valley load during deep night time and early morning, the PV systems largest generating ability coincides with the grid daytime peak period, fuel cells contribute less to the daily power consumption and are greatly limited to the lower heating demand in summer period. Released energy from EVs can effectively reduce the night peak load in the absence of PV production.
Figure 17 presents the load shifting scenario of January, the original grid load is described in the red dotted line, power consumption increases in the periods of early morning and after dinner time, which coincides with the power consumption in residential sector. Fuel cells contribute more to the residential daily load when there is an increase in heating demand, including hot water and space heating. Heat pumps consume more electricity to meet the daily increasing heat demand and lift more in grid valley period. PVs show lower generating ability in the winter compared with the summer period and have low correlation with the grid load; it should be noted that high PV penetration may lead to the ‘duck curve’ to increase the net load fluctuation. Scheduled EVs and fuel cells jointly contribute to the 5.0% of peak reduction at 20:00, enhancing the daily grid flexibility on a daily basis.
4.2. Economic Performance
In order to incentive the uptake of high efficiency technologies and encourage customers to participate more in district grid operation management, Japanese policy makers are liberalizing the retail electricity market to increase their economic efficiency and produce benefits for consumers, mainly through price reductions, Shin and Managi [27]. In order to reinforce industrial competitiveness, Japan achieved full liberalization of the retail electricity market in April 2016. Policy makers opened the retail electricity market to competition, and enabled business consumers more options to manage their energy consumption; consumers can choose to buy electricity from the retailer of their choice that best meets their needs, such as optimal tariff design, feed-in tariffs and relevant capacity subsidies. This part analyze the electricity cost for customers with the uptake of different high efficiency technologies. Economic benefits for consumers are critical for the development of high efficiency appliances. There are two main types of tariff schemes for customers to choose to achieve high energy saving benefit, as shown in Figure 18.
Figure 18A shows a typical electricity tariff scheme composed of a base charge and a volume charge that is favorable for customer with on-site generators. Electricity tariffs increase with higher monthly consumption volume, although it also indicates the potential for electricity bill savings by introducing an on-site generator to reduce the amount of electricity imported from the grid. The time-of-use tariff structure is described in Figure 18B, with 0.22 $/kWh in the daytime lasting from 8:00 to 22:00, and 0.11 $/kWh from 23:00 to 7:00. This scheme is suitable for heat pump and EV users, and encourages customers to schedule their daily energy consumption according to the time-of-use scheme for cost reduction. In order to investigate their potential economic benefit, Table 1 illustrates the cost and technical input parameters used for the assessment.
Figure 19 illustrates the average cost reduction via application of high efficiency technologies, the savings from use of a heat pump water heater is calculated and compared to the cost of a conventional gas boiler. Assuming that an annual average of 35.0% of the total electricity demand is shiftable and the average COP is 3.4, the high efficiency of the heat pump water heater system contributed a cost saving of around $3.25 per day. The benefits of EV are the reduction in the gasoline fuel cost of a car and electricity tariff reduction due to the time-of-use rates. Results show that the fuel cost reduction accounted for a large ratio of car fuel cost saving, although the potential cost saving is still less when the battery only participates in the home load management through the discharging/charging cycle. On-site generators can reduce customers’ electricity costs by using the electricity tariff scheme with volume charges. PV feed-in production brings the cash flow from the grid utility, although it should be noted that while cogeneration systems can provide high overall energy supply efficiency, the gas fuel cost will rise with increasing amounts of power production from the fuel cell.
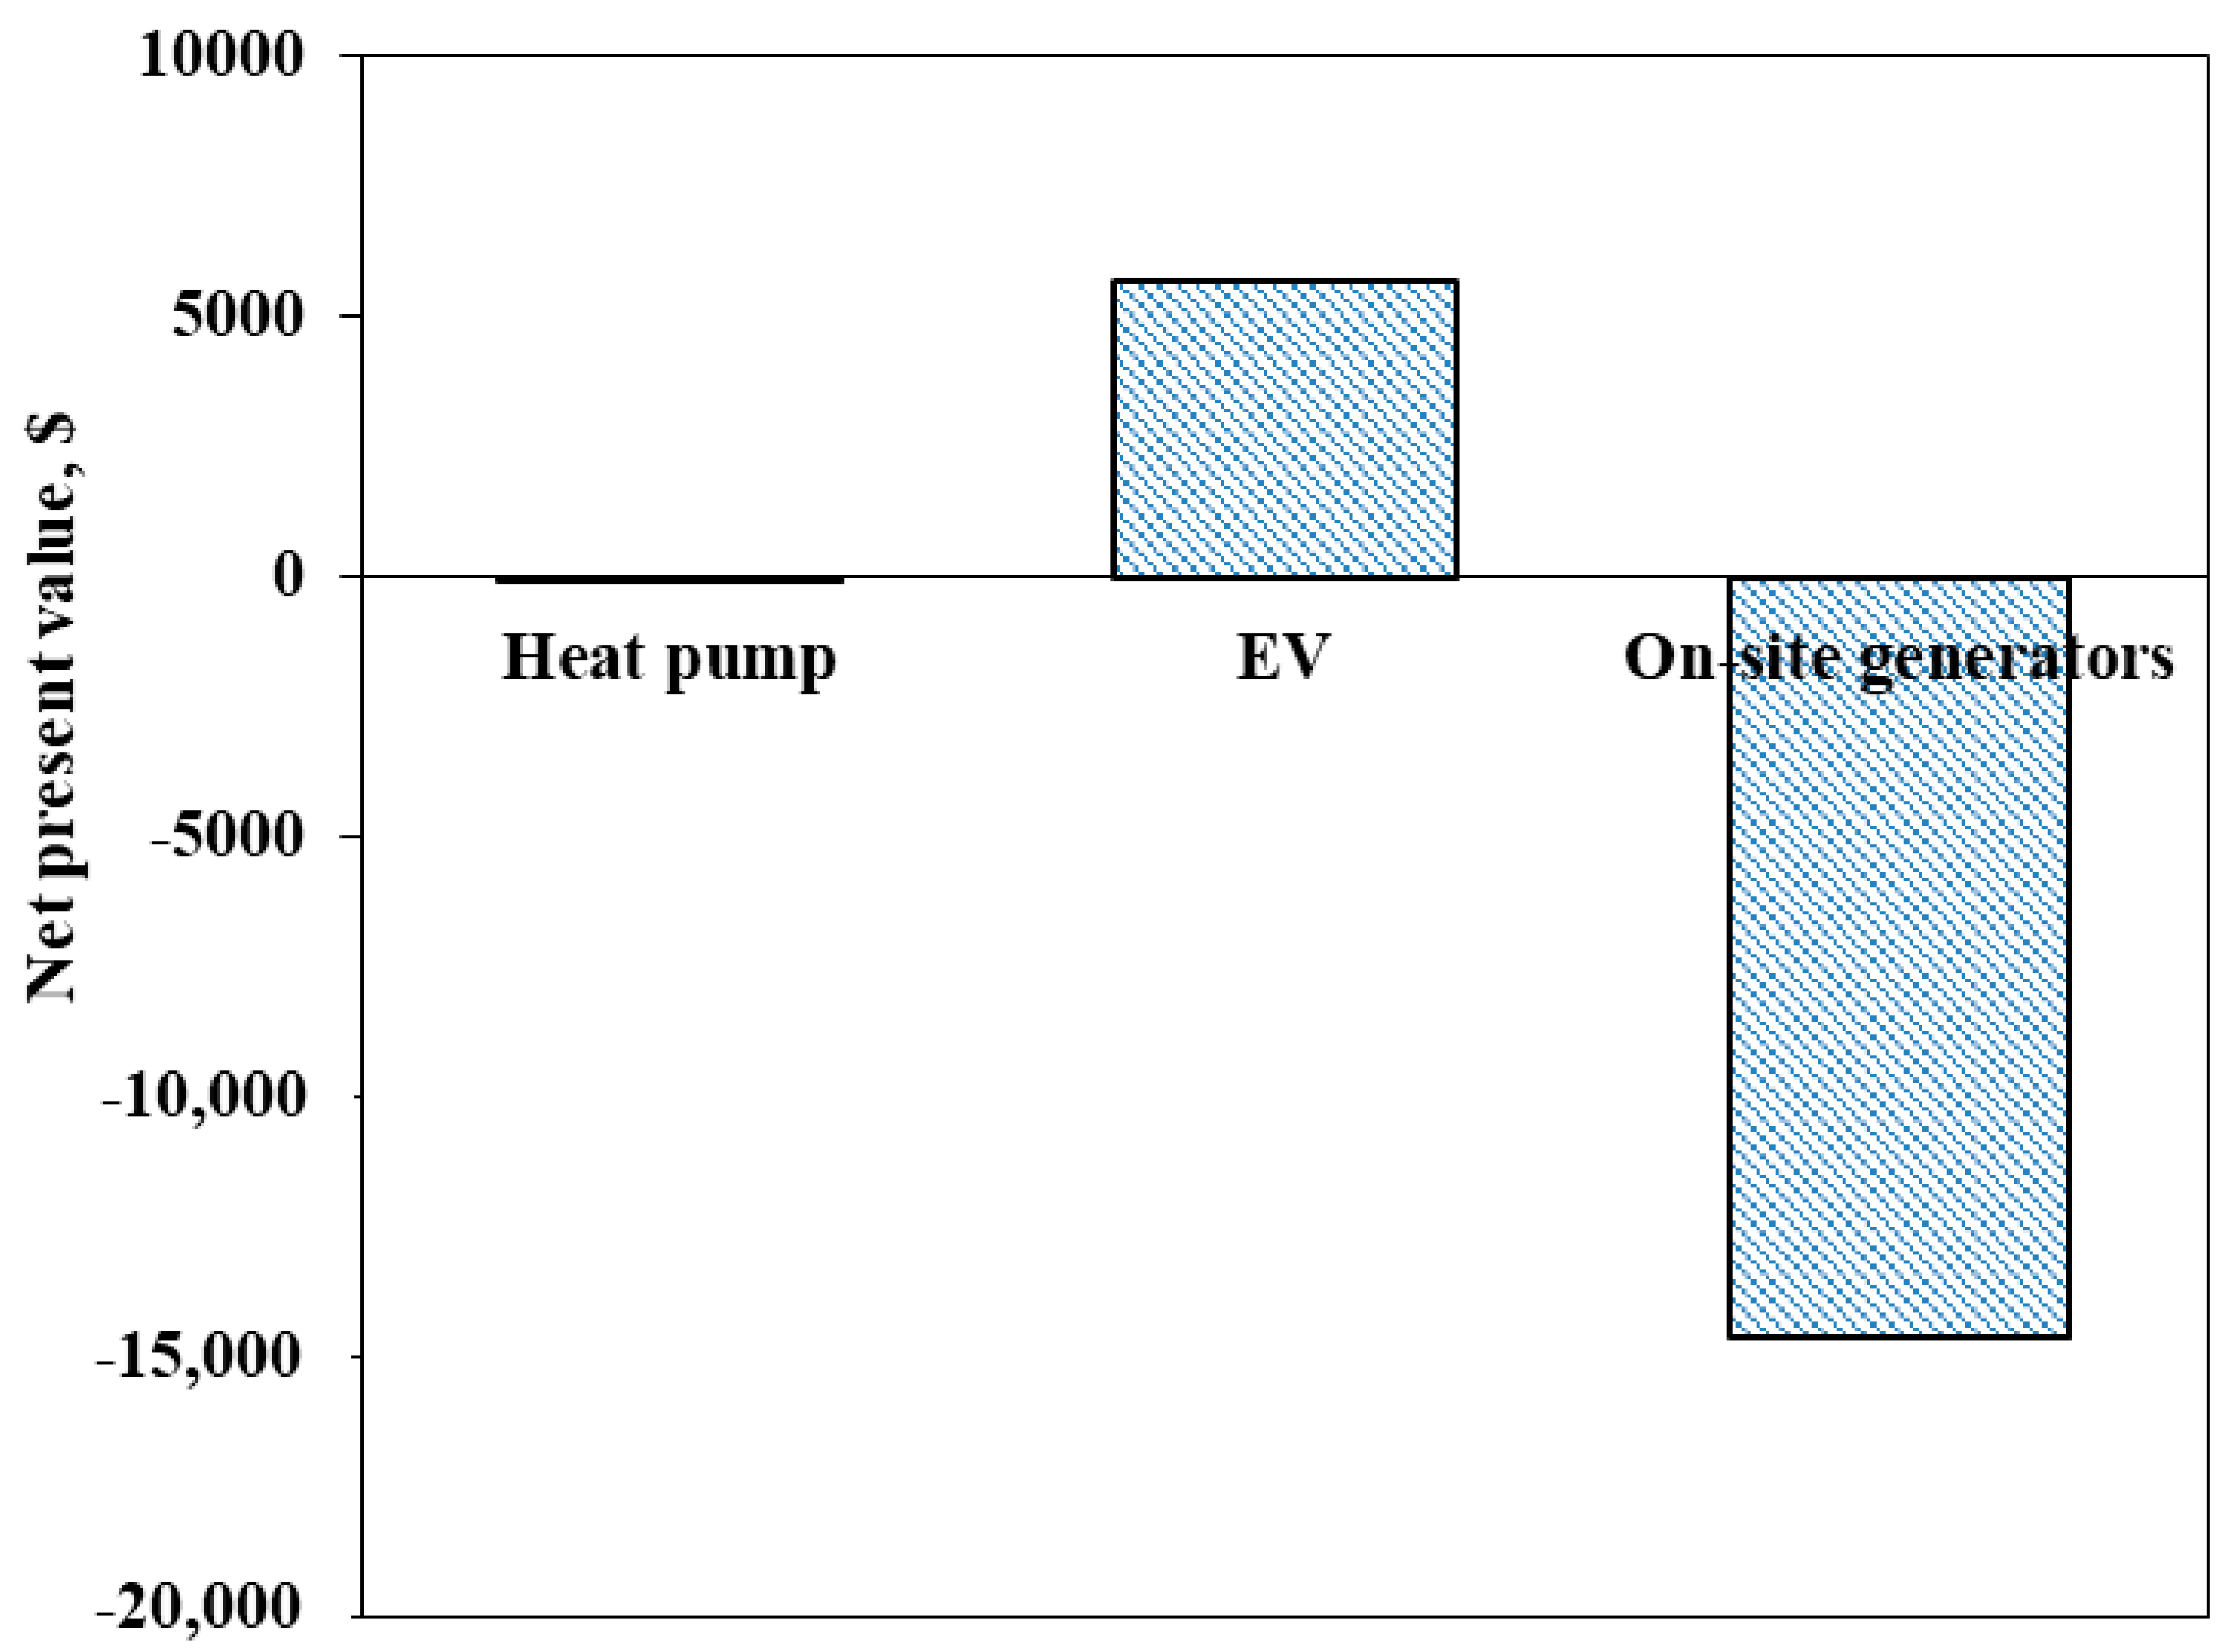
In order to investigate the economic feasibility of the high efficiency technologies, choosing the annual discount rate i equals to 4.0%, the NPV (net present value) performance of efficiency energy systems in their 10th year were carried out based on parameter values in Table 1, as shown in Figure 20. As given in Equation (1), the cash inflow refers to the annual net profit of technologies for the generic year j = {1, 2, …, 10}, and presents the installation cost. The EV system achieves a promising net benefit within 10 years due to the cost differences between electricity and gasoline. Heat pump water heater systems can achieve a net profit within its lifespan (12 years), but the payback period is longer than 10 years; proper subsidies or a further drop in capital costs may encourage the customer’s preference for Eco-cute. It is hard to achieve benefits for customers with PV/fuel cell hybrid system, because the economic feasibility of hybrid energy system is still highly dependent on direct subsidies or adjustments in energy pricing and the high initial investment is still the main obstacle to its wide adoption in the coming decades.
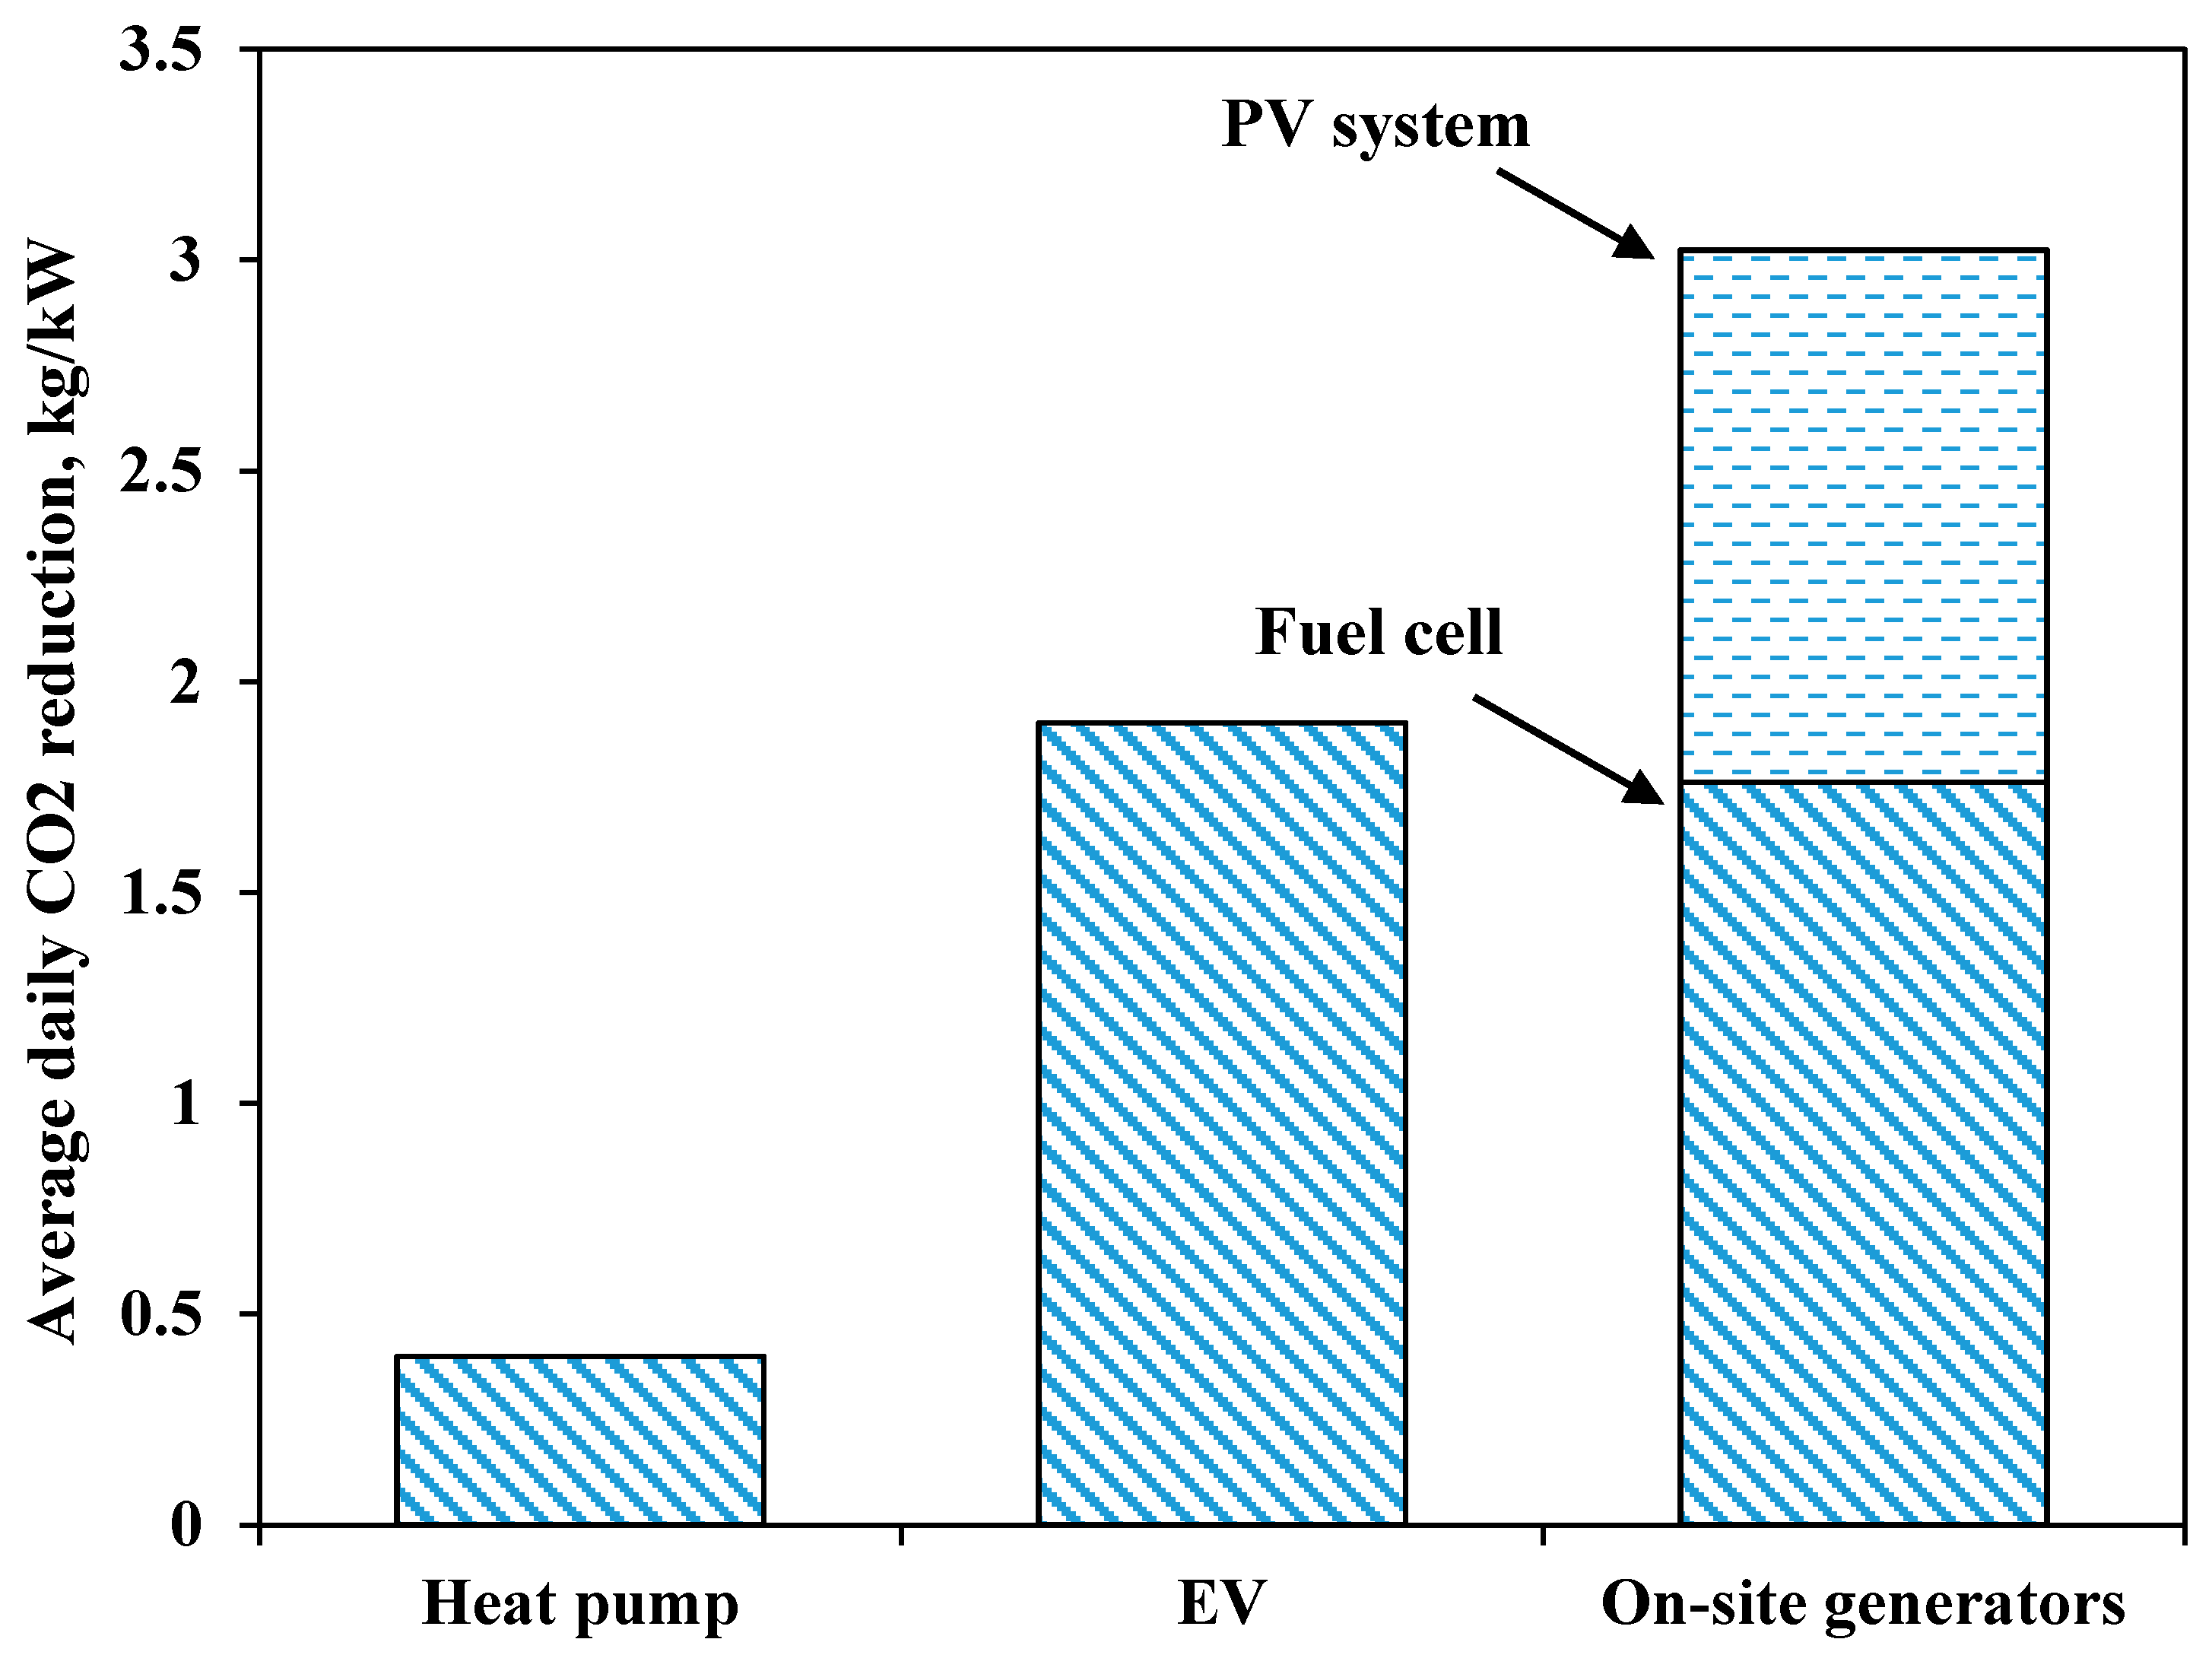
Assuming electric efficiency is 39.0%, thermal efficiency is 46.0% for fuel cells and 85.0% thermal efficiency for conventional hot water boilers and assuming the CO2 emission factor of natural gas and gasoline are 2.29 kg/Nm3 and 2.32 kg/L, respectively; a 0.483 kg/kWh CO2 emission factor was calculated for the imported power from Kyushu public grid. The annual average daily CO2 emission reductions per capacity of high efficiency technologies were estimated as illustrated in Figure 21. Environmental benefits from the heat pump and EV were achieved due to the replacement of natural gas and gasoline consumption. The emission reductions of on-site generators can be attributed to PV production and use of recycled waste gas from the fuel cell for heating demand.
5. Conclusions
This research examined the performance of scheduled efficient technologies, including heating pumps, thermal/battery storage and on-site generators in the residential sector, in order to obtain a better understanding of the behaviors of decentralized high efficiency energy systems and it estimated their cost saving and environmental benefits, based on real tested applications in social demonstration projects in Kyushu, Japan. The results provide a good reference for a plan for mixed high efficiency energy technologies, especially when they are managed to participate in grid load management. The main findings of this research can be summarized as follows:
- Aggregated heat pump and V2G systems can effectively be used for grid peak load leveling, heat pump water heaters can flexibly shift heating demand to the early morning to bottom-up the grid valley load, daily power consumption of heat pumps vary from 4.0 kWh to 10.0 kWh over the year. Scheduled V2G can effectively cover the night peak load via an optimal discharging strategy.
- Due to limited heating demand, fuel cells hardly run and have nominal output during the summer period. Fuel cells contribute more to customer electricity load under higher heating demand, and it can be used as a reliable peak power resource, independent of the weather conditions. PV production coincides with the grid peak period in summer and presents high peak capacity credit, and PV generating ability shows great variations among days over a year.
- Heat pump provides the opportunity to reduce CO2 emission 0.40 kg/(kW·day) via reducing fuel consumption, EV systems with 2.5 kW charging capacity produce around $ 3.2/day profit through replacing gasoline consumption, and achieve economic benefits within six years. Heat pump water heater systems have a relatively longer payback period (10 years) in the current energy market, the feasibility of the on-site cogeneration system still highly depends on access to capacity subsidies under the current energy market in Japan, despite its higher CO2 reduction, 1.76 kg/(kW·day).
- Different technologies show different roles in load leveling An optimal mix plan and coordinates management strategies are important to regulate local or community energy systems, 500,000 contributions from scheduled EVs and fuel cells could serve as 5.0% of reliable peak power capacity at 20:00 in winter.
This paper found that aggregated high efficiency technologies can not only help grid regulation but also reduce social carbon emissions. Higher initial investment is perhaps the most serious obstacle for installation of high efficiency technologies on the demand side. When home appliances or on-site generators are scheduled for grid load regulation, financial incentives for customers to shoulder part of the capacity cost may be favorable for the adoption of high efficiency technologies. In terms of storage systems for power regulation, especially under massive integration of intermittent renewable resources, future work will explore the performance of a combination of EV and PV systems. Meanwhile, considering the decreasing trend in feed-in tariffs over the coming years, future research will focus on increasing local renewable energy consumption with local power resource sharing on a community scale.
Author Contributions
W.C. methodology, Y.L. software and validation, Y.R. and Y.U. resources.
Conflicts of Interest
The authors declare that there is no conflict of interests regarding the publication of this paper.
Abbreviations
The following abbreviations are used in this manuscript:
| Electrical vehicles | EVs |
| Greenhouse gas | GHG |
| Variable renewable energy | VRE |
| Photovoltaic | PV |
| Vehicle to home | V2H |
| Vehicle to grid | V2G |
| Home energy management system | HEMS |
| Ministry of economy, trade and industry | METI |
| Coefficient of performance | COP |
| Fuel cell | FC |
| Heat pump | HP |
| Net present value | NPV |
References
- Komiyama, R.; Fujii, Y. Long-term scenario analysis of nuclear energy and variable renewables in Japan’s power generation mix considering flexible power resources. Energy Policy 2015, 83, 169–184. [Google Scholar] [CrossRef]
- Hirth, L. The market value of variable renewables. Energy Econ. 2013, 38, 218–236. [Google Scholar] [CrossRef] [Green Version]
- Winkler, J.; Pudlik, M.; Ragwitz, M.; Pfluger, B. The market value of renewable electricity—Which factors really matter? Appl. Energy 2016, 184, 464–481. [Google Scholar] [CrossRef]
- Roos, A.; Bolkesjø, T.F. Value of demand flexibility on spot and reserve electricity markets in future power system with increased shares of variable renewable energy. Energy 2018, 144, 207–217. [Google Scholar] [CrossRef]
- Li, Y.; Gao, W.; Ruan, Y. Feasibility of virtual power plants (VPPs) and its efficiency assessment through benefiting both the supply and demand sides in Chongming country, China. Sustain. Cities Soc. 2017, 35, 544–551. [Google Scholar] [CrossRef]
- Kim, J.J. Economic analysis on energy saving technologies for complex manufacturing building. Resour. Conserv. Recycl. 2016. [Google Scholar] [CrossRef]
- Klein, K.; Herkel, S.; Henning, H.-M.; Felsmann, C. Load shifting using the heating and cooling system of an office building: Quantitative potential evaluation for different flexibility and storage options. Appl. Energy 2017, 203, 917–937. [Google Scholar] [CrossRef]
- Goto, H.; Goto, M.; Sueyoshi, T. Consumer choice on ecologically efficient water heaters: Marketing strategy and policy implications in Japan. Energy Econ. 2011, 33, 195–208. [Google Scholar] [CrossRef]
- Mah, D.N.-y.; Wu, Y.-Y.; Ip, J.C.-m.; Hills, P.R. The role of the state in sustainable energy transitions: A case study of large smart grid demonstration projects in Japan. Energy Policy 2013, 63, 726–737. [Google Scholar] [CrossRef]
- Love, J.; Smith, A.Z.P.; Watson, S.; Oikonomou, E.; Summerfield, A.; Gleeson, C.; Biddulph, P.; Chiu, L.F.; Wingfield, J.; Martin, C.; et al. The addition of heat pump electricity load profiles to GB electricity demand: Evidence from a heat pump field trial. Appl. Energy 2017, 204, 332–342. [Google Scholar] [CrossRef]
- Fischer, D.; Wolf, T.; Wapler, J.; Hollinger, R.; Madani, H. Model-based flexibility assessment of a residential heat pump pool. Energy 2017, 118, 853–864. [Google Scholar] [CrossRef]
- Baeten, B.; Rogiers, F.; Helsen, L. Reduction of heat pump induced peak electricity use and required generation capacity through thermal energy storage and demand response. Appl. Energy 2017, 195, 184–195. [Google Scholar] [CrossRef]
- Komiyama, R.; Fujii, Y. Assessment of massive integration of photovoltaic system considering rechargeable battery in Japan with high time-resolution optimal power generation mix model. Energy Policy 2014, 66, 73–89. [Google Scholar] [CrossRef]
- Rodriguez-Calvo, A.; Cossent, R.; Frías, P. Integration of PV and EVs in unbalanced residential LV networks and implications for the smart grid and advanced metering infrastructure deployment. Int. J. Electr. Power Energy Syst. 2017, 91, 121–134. [Google Scholar] [CrossRef]
- White, C.D.; Zhang, K.M. Using vehicle-to-grid technology for frequency regulation and peak-load reduction. J. Power Sources 2011, 196, 3972–3980. [Google Scholar] [CrossRef]
- Mohammadi, A.; Mehrtash, M.; Kargarian, A.; Barati, M. Tie-Line Characteristics based Partitioning for Distributed Optimization of Power Systems. arXiv, 2018; arXiv:1805.09779. [Google Scholar]
- Amini, M.; Islam, A. Allocation of electric vehicles’ parking lots in distribution network. In Proceedings of the Innovative Smart Grid Technologies Conference (ISGT), Washington, DC, USA, 19–22 Feburary 2014; pp. 1–5. [Google Scholar]
- Bahrami, S.; Parniani, M. Game theoretic based charging strategy for plug-in hybrid electric vehicles. IEEE Trans. Smart Grid 2014, 5, 2368–2375. [Google Scholar] [CrossRef]
- Rahmani-andebili, M. Risk-cost-based generation scheduling smartly mixed with reliability-driven and market-driven demand response measures. Int. Trans. Electr. Energy Syst. 2015, 25, 994–1007. [Google Scholar] [CrossRef]
- Rahmani-andebili, M. Investigating effects of responsive loads models on unit commitment collaborated with demand-side resources. IET Gener. Transm. Distrib. 2013, 7, 420–430. [Google Scholar] [CrossRef]
- Rahmani-andebili, M. Modeling nonlinear incentive-based and price-based demand response programs and implementing on real power markets. Electr. Power Syst. Res. 2016, 132, 115–124. [Google Scholar] [CrossRef]
- Rahmani-andebili, M. Nonlinear demand response programs for residential customers with nonlinear behavioral models. Energy Build. 2016, 119, 352–362. [Google Scholar] [CrossRef]
- Rahmani-Andebili, M.; Shen, H. Price-Controlled Energy Management of Smart Homes for Maximizing Profit of a GENCO. IEEE Trans. Syst. Man Cybern. Syst. 2017. [Google Scholar] [CrossRef]
- Grid Electricity Load and PV Integration in Kyushu, Kyuden Electrical Company. Available online: http://www.kyuden.co.jp/wheeling_disclosure.html (accessed on 20 March 2018).
- Hainoun, A. Construction of the hourly load curves and detecting the annual peak load of future Syrian electric power demand using bottom-up approach. Int. J. Electr. Power Energy Syst. 2009, 31, 1–12. [Google Scholar] [CrossRef]
- Zhang, J.-F.; Qin, Y.; Wang, C.-C. Review on CO2 heat pump water heater for residential use in Japan. Renew. Sustain. Energy Rev. 2015, 50, 1383–1391. [Google Scholar] [CrossRef]
- Shin, K.J.; Managi, S. Liberalization of a retail electricity market: Consumer satisfaction and household switching behavior in Japan. Energy Policy 2017, 110, 675–685. [Google Scholar] [CrossRef]
- Residential Fuel Cell Cogeneration System, Panasonic Company. Available online: https://panasonic.biz/appliance/FC/ (accessed on 20 April 2018).
- Eco-Cute in Japan, Panasonic Company. Available online: http://sumai.panasonic.jp/hp/ (accessed on 21 April 2018).
- Smart V2G in Japan. Available online: http://www.shouene.com/photovoltaic/smarthouse/ev.html (accessed on 21 April 2018).
Figure 1.
Location of Kyushu region in Japan.

Figure 2.
Trend of yearly and peak electricity loads.

Figure 3.
Average daily grid demand curves in different months of Kyushu region.

Figure 4.
Grid load shifting scheme.

Figure 5.
Schematic overview of the research.

Figure 6.
Structure of residential household with heat pump water heater system.

Figure 7.
Load color scale distribution of residential household equipped with Eco-cute.

Figure 8.
Distribution of power consumption of the heat pump water heater to daily power load ratio.
Figure 8.
Distribution of power consumption of the heat pump water heater to daily power load ratio.

Figure 9.
Color-scale distribution of power consumption of a heat pump water heater system in a typical residential house.
Figure 9.
Color-scale distribution of power consumption of a heat pump water heater system in a typical residential house.

Figure 10.
Structure of residential household with EV car system.

Figure 11.
Color-scale distribution of power flows in V2H system.

Figure 12.
PV and fuel cell hybrid residential energy supply system.

Figure 13.
Distributions of power output from fuel cell (0.70 kWp) and PV (4.84 kWp) in August.

Figure 14.
Distributions of power output from fuel cell (0.70 kWp) and PV (4.84 kWp) in October.

Figure 15.
Distributions of power output from fuel cell (0.70 kWp) and PV (4.84 kWp) in January.

Figure 16.
Load shifting performance of high efficiency technologies in August.

Figure 17.
Load shifting performance of high efficiency technologies in January.

Figure 18.
Different electricity tariff schemes for residential customer.

Figure 19.
Average daily profits for customers with different applications of high efficiency technologies.
Figure 19.
Average daily profits for customers with different applications of high efficiency technologies.

Figure 20.
Net present value of high efficiency technologies within 10 years.

Figure 21.
Comparison of various high efficiency technologies for average daily CO2 reduction.


| Variables | Value |
|---|---|
| Annual COP of heat pump | 3.4 |
| Daily heat pump power consumption | 5.5 kWh (30% of average daily load) |
| Cost of heat pump | 8000 $ (4.5 kW, 370 L tank) |
| PV feed-in tariff | 0.25 $/kWh |
| PV cost | 1000 $/kW |
| Gas pricing | 1.86 $/Nm3 |
| Lower Heating Value | 45 MJ/Nm3 |
| Oil Pricing | 1.18 $/L |
| EV car consumption | 9.5 km/kWh (electricity), 12.5 km/L (Oil) |
| EV battery cost | 1200 $/kW |
| Fuel cell efficiency | Electricity 39%, thermal 46% |
| Fuel cell cost | 13,000 $ (0.70 kW nominal output) |
| Gas boiler | Thermal efficiency 85% |
© 2018 by the authors. Licensee MDPI, Basel, Switzerland. This article is an open access article distributed under the terms and conditions of the Creative Commons Attribution (CC BY) license (http://creativecommons.org/licenses/by/4.0/).
Share and Cite
MDPI and ACS Style
Li, Y.; Gao, W.; Ruan, Y.; Ushifusa, Y. Grid Load Shifting and Performance Assessments of Residential Efficient Energy Technologies, a Case Study in Japan. Sustainability 2018, 10, 2117. https://doi.org/10.3390/su10072117
AMA Style
Li Y, Gao W, Ruan Y, Ushifusa Y. Grid Load Shifting and Performance Assessments of Residential Efficient Energy Technologies, a Case Study in Japan. Sustainability. 2018; 10(7):2117. https://doi.org/10.3390/su10072117
Chicago/Turabian StyleLi, Yanxue, Weijun Gao, Yingjun Ruan, and Yoshiaki Ushifusa. 2018. "Grid Load Shifting and Performance Assessments of Residential Efficient Energy Technologies, a Case Study in Japan" Sustainability 10, no. 7: 2117. https://doi.org/10.3390/su10072117
Note that from the first issue of 2016, this journal uses article numbers instead of page numbers. See further details here.