Assessing Strategies for Urban Climate Change Adaptation: The Case of Six Metropolitan Cities in South Korea


1
KU-KIST Green School (Graduate School of Energy and Environment), Korea University, 145 Anam-ro, Seongbuk-gu, Seoul 02841, Korea
2
Division of International Studies, Korea University, 145 Anam-ro, Seongbuk-gu, Seoul 02841, Korea
*
Author to whom correspondence should be addressed.
Sustainability 2018, 10(6), 2065; https://doi.org/10.3390/su10062065
Submission received: 20 May 2018
/
Revised: 12 June 2018
/
Accepted: 14 June 2018
/
Published: 18 June 2018
(This article belongs to the Special Issue Climate Resilient Urban Development)
Abstract
:As interest in climate change adaptation grows, an increasing number of national and local governments are developing adaptation strategies. This study assesses the strategies for urban climate change adaptation of municipal governments in South Korea. The adaptation plans and budget expenditures of six metropolitan cities in South Korea were compared, based on the Implementation Plan for Climate Change Adaptation Strategy (IPCCAS) 2012–2016 and annual expenditure reports of each city. The results show that the actual implementation of these adaptation programs varied vis-à-vis the original plans, in terms of the level of overall expenditure and sector-specific expenditure. The following findings were drawn from the analysis: First, in most cases, the highest adaptation priorities were disaster/infrastructure, water management, and the health sector. Second, actual expenditure on climate change adaptation programs was smaller than the planned budget in the IPCCAS. Third, the prioritized sectors matched for planning and implementation in Seoul, Daegu, Daejeon, and Incheon, but not in Busan and Ulsan. Fourth, the adaptation programs of South Korean metropolitan cities do not seem to have been well-tailored to each case.
1. Introduction
The global urban population has grown from 2.3 billion in 1990 to about 4 billion in 2016, or 43% and 54.5% of the world’s population, respectively. It is projected that 60% of the world’s population will dwell in urban areas by 2030 [1,2]. Such rapid urbanization poses various social and environmental problems for cities, including insufficient housing, traffic congestion, increasing crime rates, environmental pollution, and inadequate sanitation services [3,4,5,6,7]. In addition to these “traditional” challenges, responding to climate change has emerged as an important task for municipal governments. Since anthropogenic greenhouse gas (GHG) emissions originating from cities account for up to 70% of global GHG emissions [8], cities can play a significant role in climate change mitigation by reducing fossil fuel consumption and promoting a low-carbon economy. Furthermore, cities themselves are under threat from the effects of climate change, such as sea-level rise, more frequent extreme weather events, and natural disasters, which negatively affect human health, water availability, and so on [9,10,11]. The number of natural disasters worldwide has quadrupled to around 400 a year since 1975 [12], and the economic loss resulting from natural disasters between 2005 and 2014 reached 1.5 trillion USD, a ten-fold increase from the previous decade [13]. In 2014, 87% of disasters were climate-related [2]. Although disasters can seriously threaten both urban and rural areas, cities are particularly vulnerable due to high population density as well as concentrated infrastructure and assets [9,14,15,16]. Since it is expected that climate change will increase both the risk of disasters and loss from those disasters [17], cities must find ways to deal with climate hazards.
In this regard, the concept of the climate-resilient city has received increasing attention from municipal governments. The term “resilience” was originally used by physical scientists to indicate the characteristics of a spring and the resistance of materials to external shocks [18] (p. 300). The term was later introduced into ecology, where it is used to describe the capacity of a system to maintain its functions and controls when faced with disturbance [19] (p. 220). Based on this ecological interpretation, urban resilience is commonly defined as the ability of a system, a community, and a society within a city to resist, absorb, survive, adapt, and recover from the stresses and shocks to which they are exposed [6,19,20,21]. The concept of resilience has recently been used in diverse areas, including disaster management, urban security, and economic growth [19]. Since climate change tends to harm cities through causing an increase in natural disasters and extreme weather events, a climate-resilient city has many common features with a disaster-resilient city. According to Wamsler et al. (2013), a disaster-resilient city is one that decreases not only actual hazards, but also the susceptibility of individuals, communities, and institutions to hazards, and formalizes disaster recovery mechanisms [11]. Applying the definition of general urban resilience and disaster resilience, a climate-resilient city can be described as a city having the capacity to relieve and recover from climate-related shocks and stresses and reduce its vulnerability to climate change [21].
In the climate change policy context, efforts to build climate resilience can be understood as climate change adaptation strategies. The Intergovernmental Panel on Climate Change (IPCC, 2014) explains that “adaptation is the process of adjustment to actual or expected climate and its effects” [22] (p. 118). Adaptation is a more ambitious form of climate resilience including providing an alternative water supply, cooling services, flood protection, green infrastructure, and emergency preparedness mechanisms [23,24,25]. The growing realization that mitigation alone is not an effective response to climate change has created an opening for adaptation policy [26,27,28]. Consequently, increasingly more national and local governments around the world have developed various adaptation strategies. According to the Organisation for Economic Co-operation and Development (OECD), only five member countries had established specific adaptation policies in 2006, but, by 2012, that number had increased to 27 [29]. Many megacities such as New York, London, Mexico City, Seoul, and Sydney have also devised adaptation policies.
Despite the increased number of adaptation plans announced by municipal governments, analysis of their actual implementation is rare. Thus far, many studies have focused on the establishment of municipal adaptation strategies without assessing their performance. However, plans are not always implemented, and although governments adopt adaptation plans to improve climate-resilience, they may fail to implement those plans due to various political and financial factors. Therefore, monitoring implementation outcomes is important to assess cities’ climate-resilience. One of the methods used to evaluate the efforts of a city to adapt to climate change is analyzing its financial report for adaptation measures [10].
This study therefore examines the implementation of the climate change adaptation strategies of six metropolitan cities in South Korea, i.e., all metropolitan cities except Gwangju. Since the establishment of the National Comprehensive Plan for Climate Change Adaptation in December 2008, the South Korean government has announced a series of national-level adaptation plans and encouraged local governments to develop their own adaptation plans. The Framework Act on Low Carbon Green Growth, enacted in 2009, mandates that every five years the national government must formulate an adaptation strategy and local governments must establish implementation plans for the adaptation strategy. Based on this provision, the South Korean government announced the National Climate Change Adaptation Strategy (NCCAS) 2011–2015 in 2010 and distributed a manual for the Implementation Plan for Climate Change Adaptation Strategy (IPCCAS) to help local governments devise their own plans. By 2012, all seven metropolitan governments in South Korea had established their IPCCAS 2012–2016. After the implementation periods of the first plans, the second round of national strategy and implementation plans were established and implemented (NCCAS 2016–2020 and IPCCAS 2017–2021). Each IPCCAS contains specific adaption programs that the local government attempts to carry out and related budget plans. This study uses the first IPCCAS and annual expenditure reports of six metropolitan cities in South Korea to identify key characteristics of urban climate change adaptation and assess their implementation.
The remainder of this paper is structured as follows. The second section reviews the literature of urban adaptation strategies to climate change and the third Section explains the data and methods used in the analysis. The fourth Section presents our analysis of the climate change adaptation plans and expenditure schemes in the six metropolitan cities; it specifically examines which adaptation programs were devised, the budget allocated to those programs, and how much of that budget was actually spent for each city. The Conclusion summarizes the key findings of this study and outlines the implications for future urban adaptation plans.
2. Literature Review of Urban Climate Change Adaptation
2.1. Options for Climate Change Adaptation
Climate change adaptation includes both reducing damage from climate change and taking advantage of it where possible [22,30]. Since climate affects diverse economic and social sectors including agriculture, forestry, fisheries, housing, transport, and human health [27]. Adaptation options also cover a wide range of activities across all sectors of society. In addition to direct actions to reduce climate risks, adaptation options also include capacity building measures for individuals, communities, and organizations [30].
The classification of adaptation options varies. One of the most common way is categorizing adaptation options by sector. De Bruin et al. (2009) suggests 96 adaptation options for seven sectors (agriculture, nature, water, energy and transport, housing and infrastructure, health, and recreation and tourism) [31]. Moser and Satterthwaite (2008) divided adaptation options into four categories (protection, pre-disaster damage limitation, immediate post-disaster responses, and rebuilding) [32], while the Asian Cities Climate Change Resilience Network indicated four elements of resilience (infrastructure systems, ecosystems, agent capacities, and institutions) [33]. The IPCC sorted adaptation options into three main categories (structural/physical, social, and institutional) and ten sub-categories (engineered and built environment, technological, ecosystem-based, services, educational, informational, behavioral, economic, laws and regulations, and government policies and programs) [34]. The United Kingdom Climate Impacts Programme suggested adaptation options according to two categories (building adaptive capacity and delivering adaptation actions) and seven sub-categories (creating information, supportive social structure, supportive governance, accepting the impacts and bearing losses, preventing effects or reducing risks, offsetting losses by spreading or sharing risks or losses, and exploring positive opportunities) [35]. Examples of suggested adaptation options are listed in Table 1.
2.2. Cities’ Climate Change Adaptation
Climate change mitigation has been dominant on cities’ agendas for climate change response. Broto and Bulkeley (2013) reported that only 12% of 627 mitigation and adaptation practices of 100 global cities were adaptation programs [23], and Reckien et al. (2014) showed that only 28% of 200 European cities had adaptation plans, while 65% of the cities had mitigation plans [16]. Nevertheless, various adaptation strategies have been increasingly developed by national and local governments around the world [23,28,29,36], and investigation into the substance and consequence of urban climate adaptation has been initiated by a series of studies.
The most prevalent type of study involves exploring and comparing the adaptation strategies of multiple cities. Broto and Bulkeley (2013) examined climate change policies of 100 global cities and concluded that adaptation programs were found most frequently in Oceania and least frequently in Europe [23]. Studies have varying results on the most popular adaptation options and sectors. Preston et al. (2011) identified 507 adaptation options in 57 adaptation plans from Australia, the United Kingdom, and the United States and found that capacity building programs accounted for 72% of total adaptation options, outnumbering the delivery of specific vulnerability reduction programs [28]. Lesnikowski et al. (2014) reviewed 4104 adaptation initiatives communicated to the UNFCCC and found that the largest number of initiatives were related to infrastructure, technology, and innovation in the environmental, water, and agricultural sectors [37]. Wamsler et al. (2013) compared adaptation options found in developed and developing countries through meta-evaluation of multiple country studies [11].
Some studies found factors that enabled municipal governments to successfully adopt and implement adaptation policies [14,24,36,38]. Carmin et al. (2009) noted internal motivation, such as the need to protect property and lives from natural disasters, was a strong driver for Durban and Quito to develop adaptation planning far earlier than other cities [38]. In California, large population, high household income, and strong support from local leaders and the public were associated with adopting local climate change adaptation policies [36]. Another key success factor was the active participation of stakeholders, as shown in the cases of London and New York [14]. The commitment of local leaders, municipal expenditures per capita, and awareness of climate change were positively associated with engagement in adaptation planning [24]. On the other hand, potential obstacles to adopting climate change adaptation policies were also identified: difficulties in negotiation and coordination among various stakeholders, political change, lack of awareness, uncertainty, and complacency [39,40].
One recent study provides more specific results about cities’ adaptation efforts by analyzing the disbursement for climate change adaptation in ten megacities—London, Paris, New York, Mexico City, São Paulo, Beijing, Mumbai, Jakarta, Lagos, and Addis Ababa. The results show that expenditure on adaptation accounted for as much as 0.33% of a city’s gross domestic product. While cities in developed countries spend more money on energy and water, cities in developing countries tend to focus on adaptation options for the health and agricultural sectors [10].
Previous studies on urban climate change adaption have some limitations. Most of the studies investigated the establishment of adaptation policies rather than their implementation. The papers report which adaptation options are included in the adaptation plans of cities and what leads or impedes municipal governments to adopt adaptation strategies. However, adopting an adaptation policy is only the first step in municipal adaptation efforts. Therefore, it is necessary to monitor whether municipal governments implement the policy that they adopted and to evaluate how effective their adaptation is in enhancing climate resilience. Georgeson et al. (2016) analyzed cities’ actual expenditure on climate change adaptation, but focused on only one fiscal year; moreover, they did not analyze whether the expenditure corresponded with the original budget. Given these previous limitations, this study attempted to assess whether cities have implemented their climate change adaptation policies in accordance with their original plans.
3. Materials and Methods
3.1. Scope of Analysis: Six Metropolitan Cities in South Korea
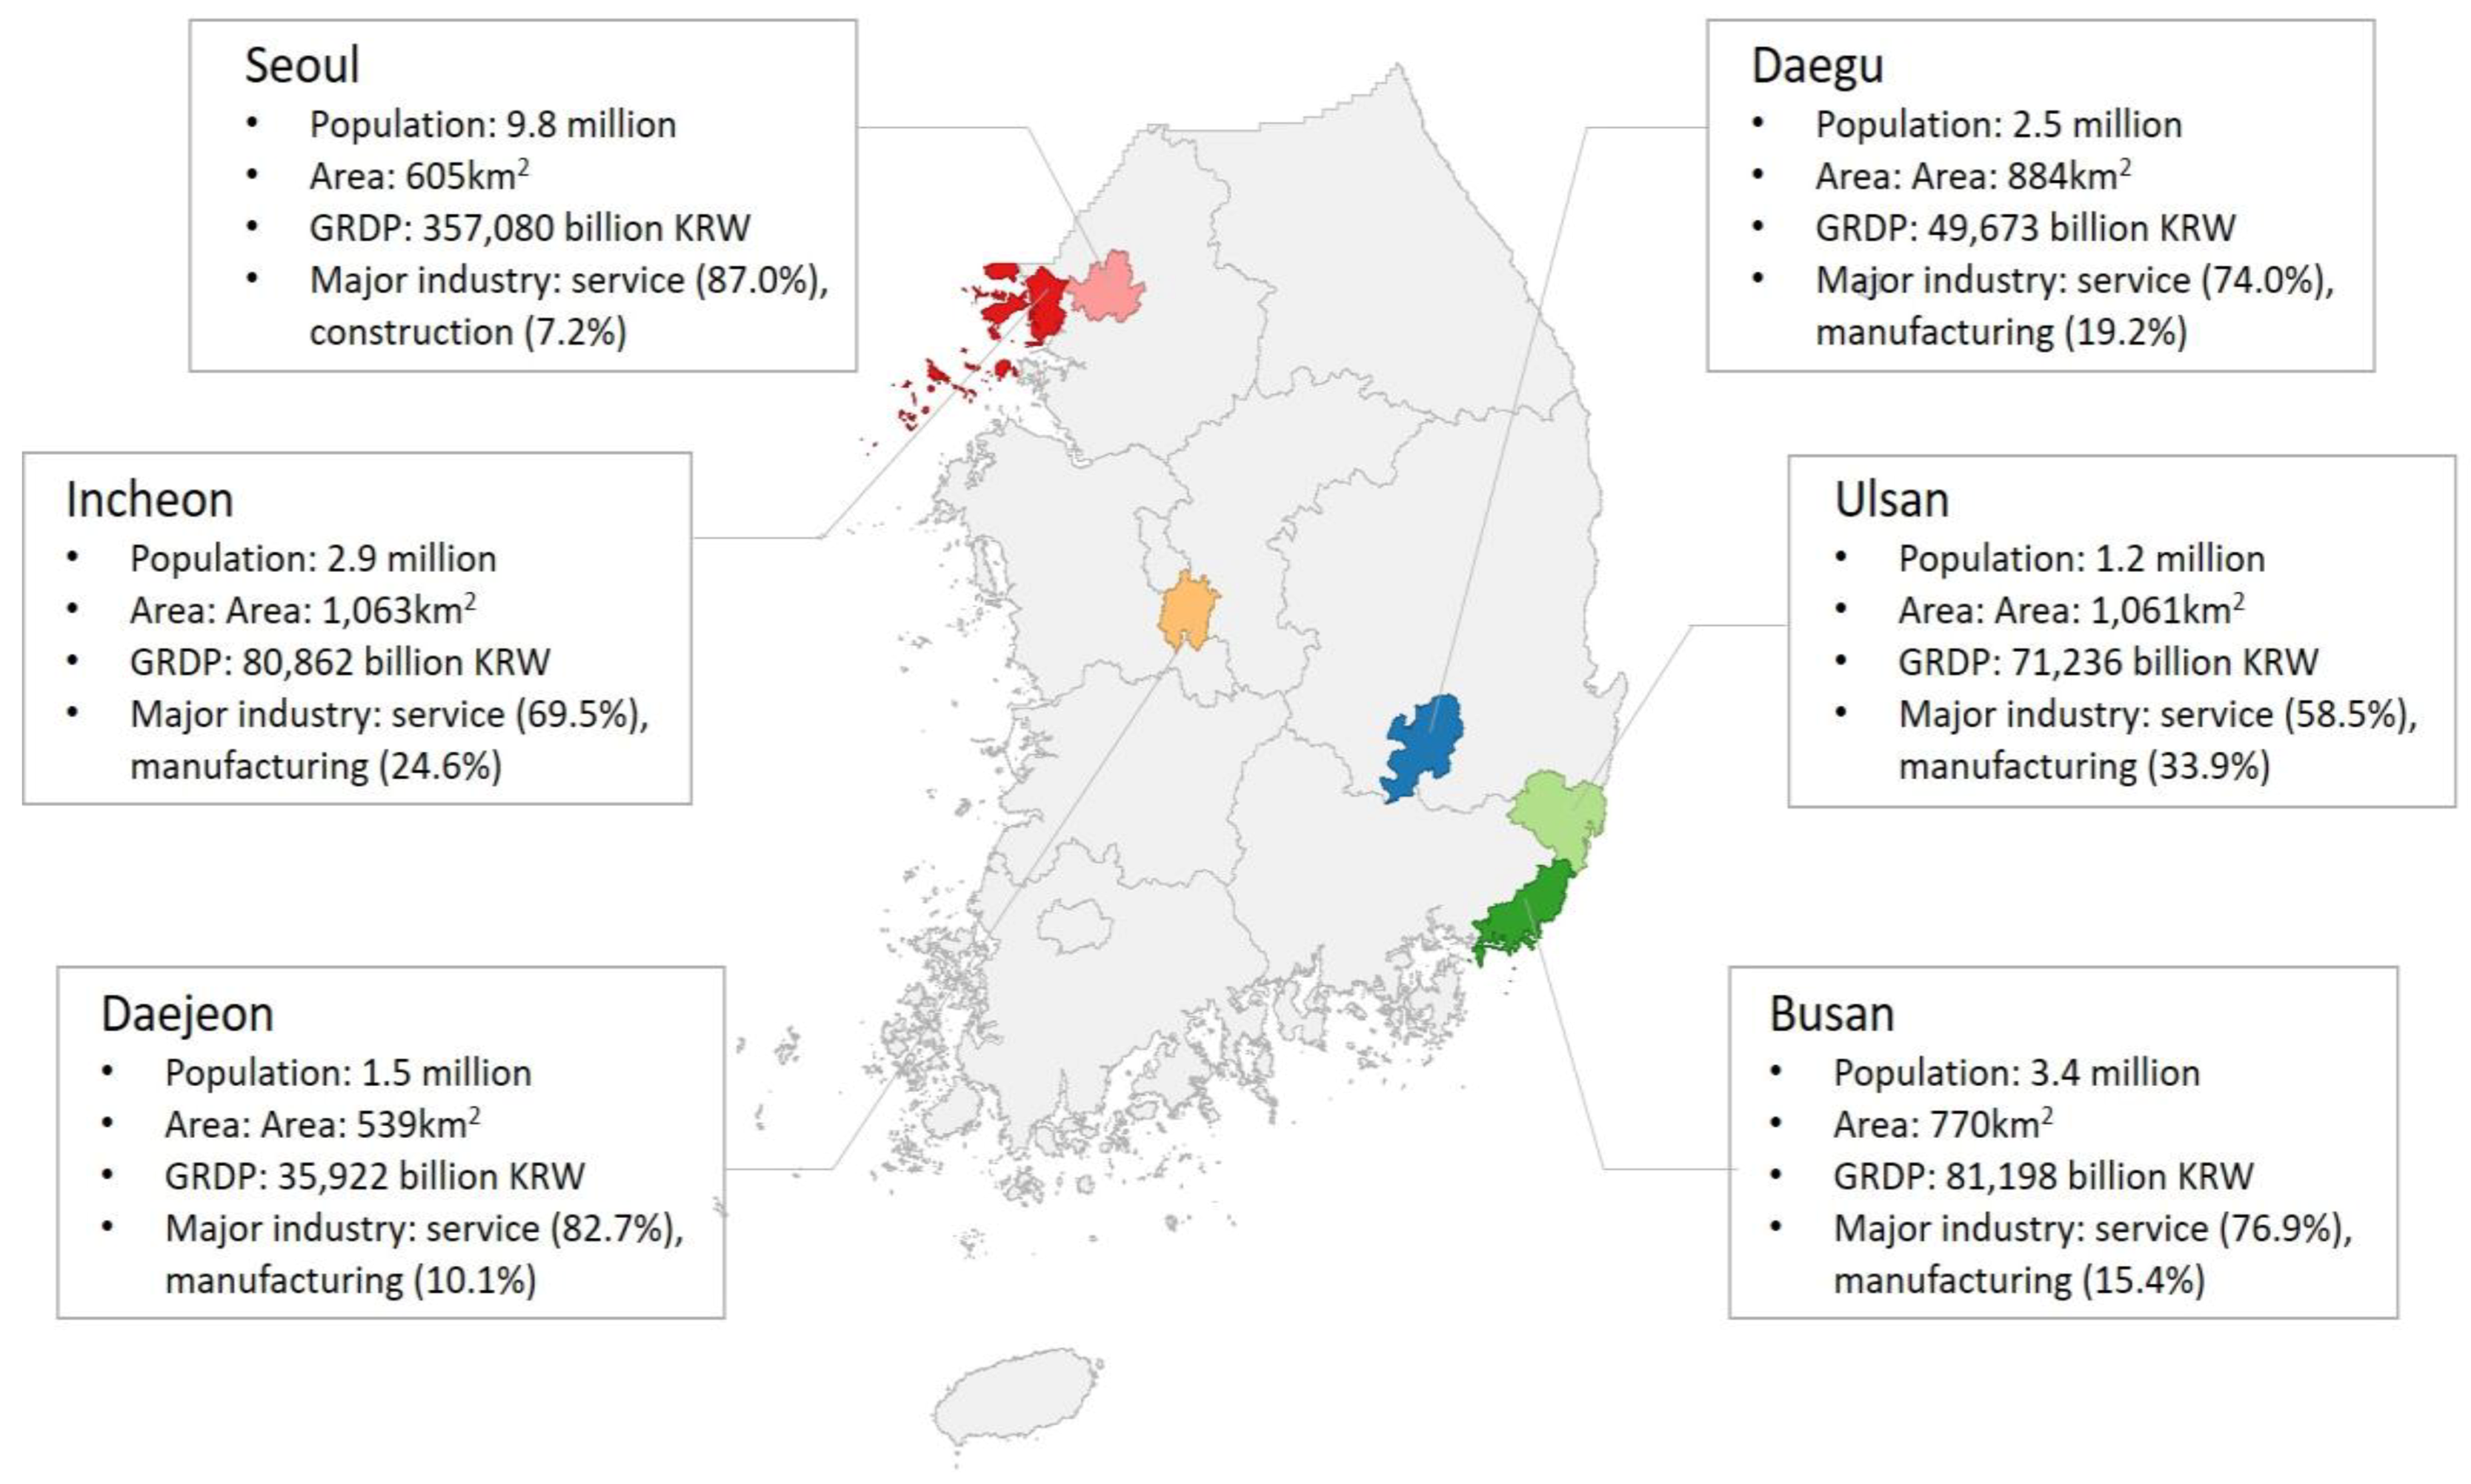
This study analyzed the budget and actual expenditure on climate change adaptation programs from 2012 to 2016 of six metropolitan cities in South Korea (Seoul, Busan, Daegu, Daejeon, Incheon, and Ulsan). The seventh metropolitan city, Gwangju, was excluded to enable more consistent analysis: while the other six cities have an annual budget plan for adaptation strategies, Gwangju provides only a five-year budget. The geographic location and general characteristics of each city are presented in Figure 1. The six cities have experienced gradual increases in annual average temperature and precipitation since the 1960s [41,42,43,44,45,46], and those tendencies are expected to continue [47,48,49,50,51,52]. Table 2 shows the change in annual average temperature and precipitation of each city under the Representative Concentration Pathways (RCP) 2.6 and RCP 6.0 scenarios presented in the Fifth Assessment Report of the IPCC.
3.2. Data Sources
Data on planning and implementation of adaptation measures for each city was required for this study. Adaptation planning data were collected from the IPCCAS of six metropolitan cities [41,42,43,44,45,46]. In South Korea, each local government must establish its own IPCCAS every five years, as mandated by the Framework Act on Low Carbon Green Growth that was enacted in 2009. All seven metropolitan governments in South Korea completed the establishment of their first IPCCAS (2012–2016) in 2012; they announced their second IPCCAS (2017–2021) in 2017. Smaller local governments have also developed IPCCAS. In this study, the adaptation efforts of municipal governments were identified and assessed using IPCCAS 2012–2016, since the IPCCAS 2017–2021 were still in the initial stage of implementation at the time of this study. To study implementation, this study measured the adaptation efforts of municipal governments based on their financial response. Expenditure reports for each city for fiscal years 2012–2016 [54,55,56,57,58,59,60,61,62,63,64,65,66,67,68,69,70,71,72,73,74,75,76,77,78,79,80,81,82,83] were used to assess actual expenditure on the adaptation programs suggested in IPCCAS.
3.3. Methods
The following approaches were applied to assess the adaptation efforts of the six metropolitan cities. First, all adaption programs described in the IPCCAS were identified and recategorized using a standardized typology. Since each city used its own criteria to categorize adaptation programs, it is difficult to directly compare sector-specific budget plans and expenditures among the cities. For instance, Seoul included a flood early-warning system in the disaster management sector of its IPCCAS, but the same measure was listed in the water management sector of Busan’s IPCCAS. In addition, Busan put “creating urban forests” in the forest section, while Daegu included it under the health sector. Furthermore, Ulsan introduced unique criteria—healthy and safe city, water-circulating eco city, and climate-friendly city—while the other cities retained traditional criteria based on sectors such as health, disaster, agriculture, and forest. To resolve this issue of inconsistent classification, we reclassified the adaptation programs stated in the IPCCAS in accordance with the criteria used in NCCAS 2011–2015, which presented 29 strategies and 87 specific plans under ten sectors: health, disaster/infrastructure, agriculture, forest, ocean/fisheries, water management, ecosystem, climate change monitoring/projection, adaptation industry/energy, and education/promotion/international cooperation. Table 3 outlines the NCCAS classifications [84].
We estimated the planned budget and actual expenditure on adaptation programs based on the IPCCAS and annual expenditure reports of six cities. The budget data were acquired from the IPCCAS. However, there are no official data that show the exact amount of governmental spending on climate change adaptation programs. Annual expenditure reports provide the expenditure on specific programs undertaken by municipal government departments in the fiscal year. To estimate spending on adaptation, we selected the programs sharing common features with the IPCCAS from the annual expenditure reports and aggregated the expenses of those programs. For example, the expenditure on purchasing equipment to extinguish forest fires was used to estimate the expenditure on the “prevention and alleviation of forest disaster” program in the forest sector, and the expenditure on water reuse projects was used to estimate the expenditure on the “developing alternative water sources” program in the water management sector. In addition, we also calculated expenditure on programs that were not included in that city’s IPCCAS but were included in other cities’ IPCCAS and NCCAS. After this adjustment process, we compared budget plans and actual expenditure.
There are a few limitations to this method. First, some programs that did not need money were excluded from evaluation since the expenditure reports only include programs in which budget was invested. For example, the IPCCAS include modifying rules and regulations, but most of these were not included in expenditure reports as the cities did not allocate a budget for these objectives because they are normal activities of the municipal government that require no direct cost. Instead, this study focused on comparing planned budget and actual expenditure on adaptation programs. Second, the expenditure on climate change adaptation programs may be overestimated. Adaptation programs are not undertaken in the name of climate change, but are often combined with existing development, disaster management, and welfare programs [23]. For instance, most cities’ IPCCAS include river maintenance to adapt to climate change and visiting health services for people who are vulnerable to heat wave. However, the expenditure reports show the spending on general river maintenance and visiting health services since they are often not implemented with the only purpose of climate change adaptation. Nevertheless, it is not expected to hamper the validity of the results since the budget in the IPCCAS also does not seem to be confined to climate-specific programs.
4. Results
4.1. Climate Change Adaptation Plans of Six Metropolitan Cities
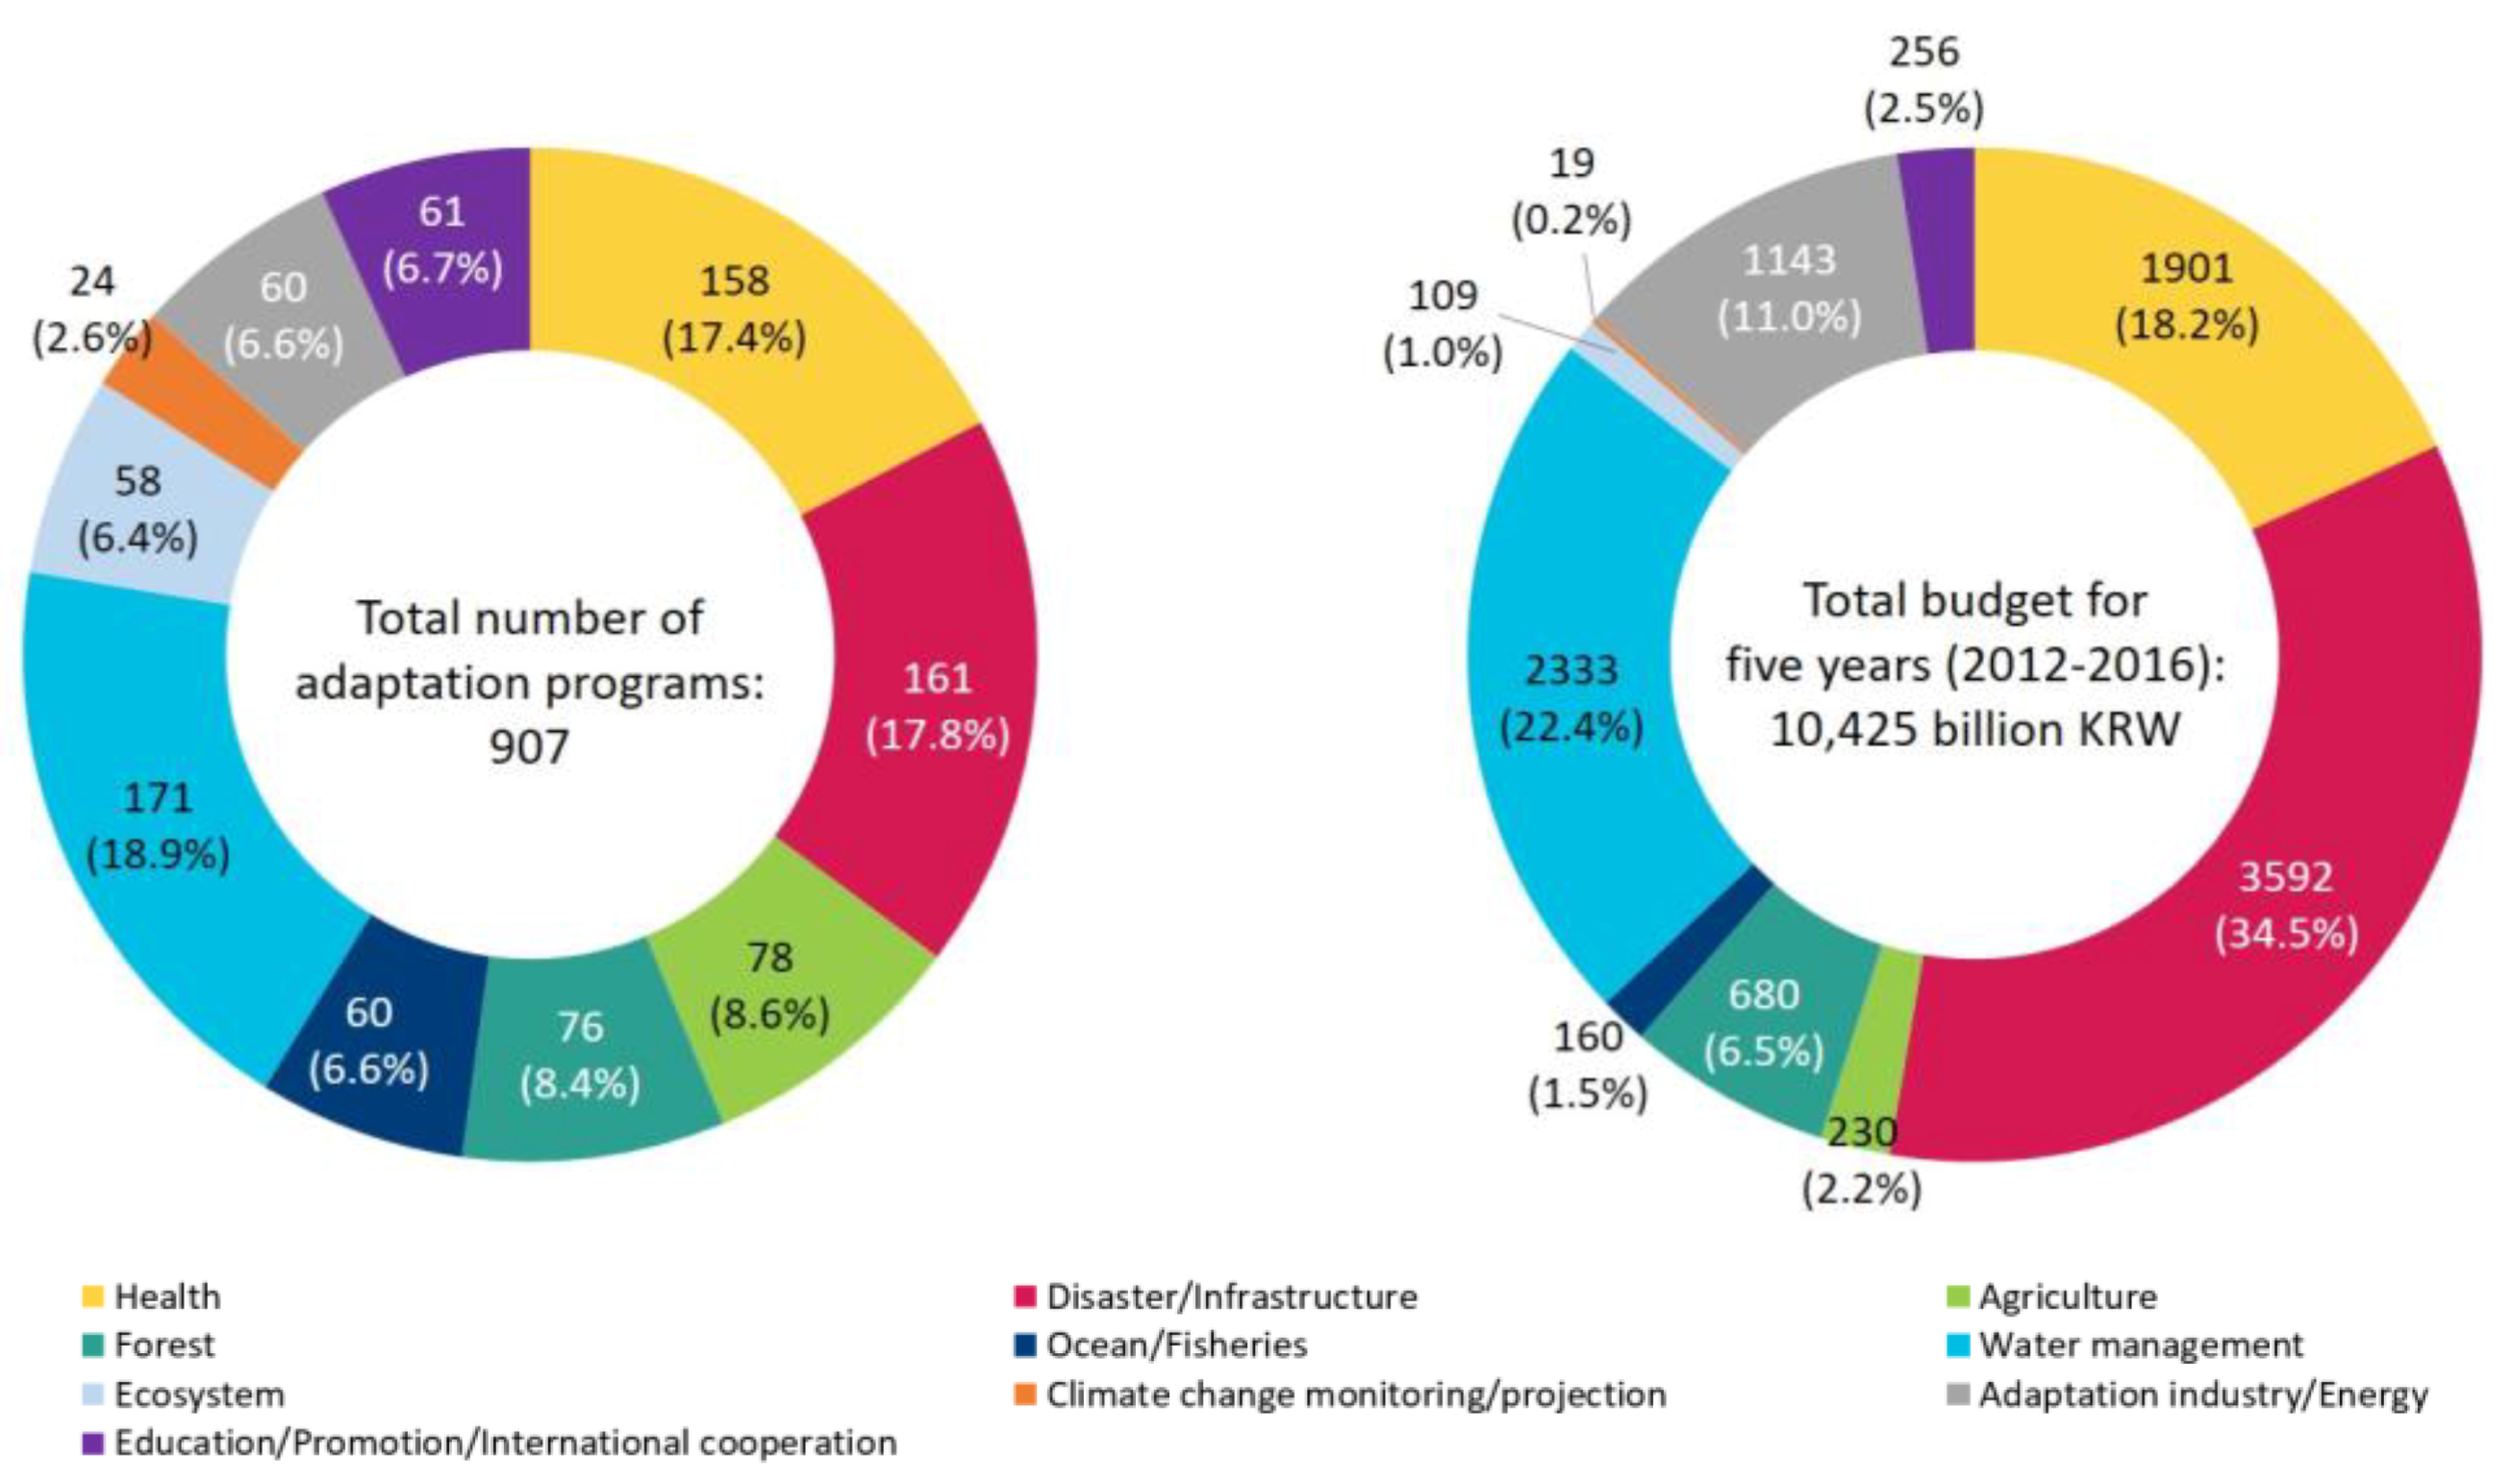
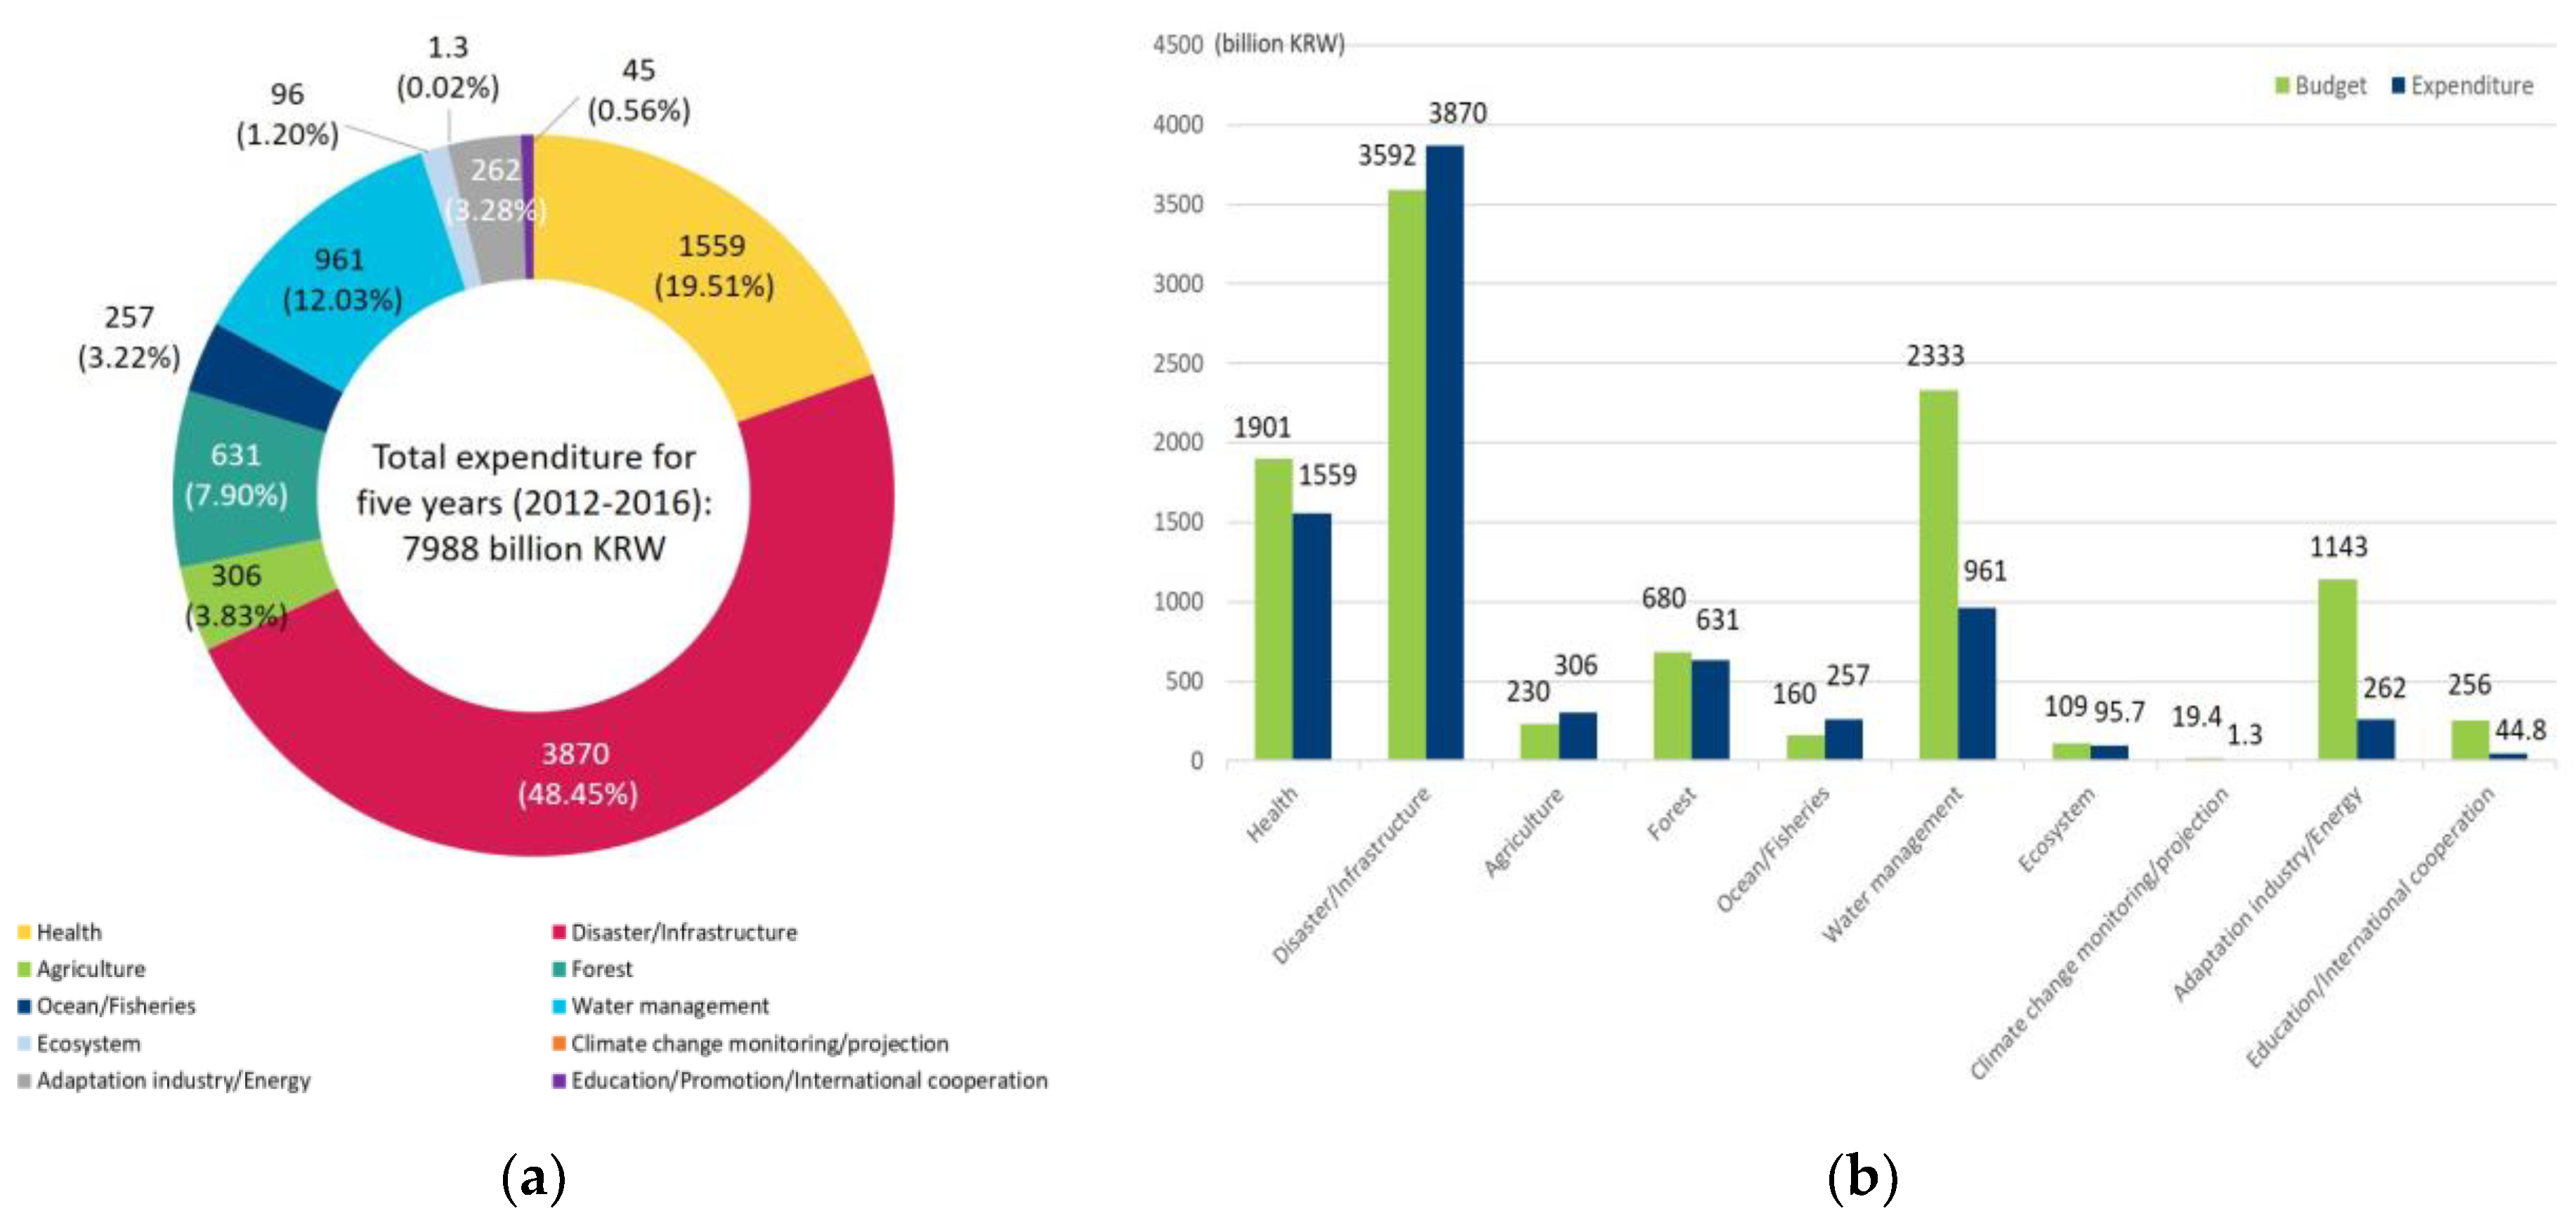
Seoul, the capital city of South Korea, was the first city to establish an IPCCAS. It announced its first IPCCAS in December 2011, while the other metropolitan cities did so in February 2012. In the IPCCAS, the cities presented specific adaptation programs in various sectors and developed annual budget plans to implement these programs. According to IPCCAS 2012–2016 of six cities, the cities planned to spend 10,425 billion KRW (approximately 9.9 billion USD) on over 900 adaptation programs across five years. The cities tended to prioritize disaster/infrastructure, water management, and the health sector. They planned to spend 3592 billion KRW on 161 programs to prevent and respond to disasters, 2333 billion KRW on 171 programs to manage water quantity and quality, and 1901 billion KRW on 158 programs to prevent and manage diseases caused by climate change (Figure 2). A larger budget was allocated to the disaster/infrastructure sector than to water management: although the former sector had fewer programs, these programs included high-cost projects such as maintaining and expanding drain pipes and constructing waste treatment facilities.
The climate change adaptation strategies of the cities, considered together, have similar tendencies to strategies examined in prior studies. The most prevalent adaptation measures are related to water management [11], and many adaptation programs are similar to disaster management programs [23,85]. On the other hand, the adaptation strategies we studied were more focused on health and the adaptation of industry than cities assessed in previous studies. This is more apparent at the specific plan level. Table 4 presents the top five plans by program number and budget. In terms of the number of programs, measures to “reduce damage from heat waves and UV” (77 programs) are most frequently found, followed by “development of new and promising industries” (44 programs), and water quality management (37 programs). In terms of planned budget, the biggest portion was earmarked for “improvement of sewerage system” (2634 billion KRW), followed by “reducing damage from heat waves and UV” (1721 billion KRW), and “development of new and promising industries” (1140 billion KRW). This distribution may be attributed to the typology and background of IPCCAS 2012–2016. First, according to the NCCAS 2011–2015, activities to increase urban green areas are categorized in the health sector (“reducing damage from heat waves and UV”) rather than the forest sector. The NCCAS considers increasing urban green areas to be a key measure to mitigate urban heat island effects and provide shelter through shade. Municipal governments have conducted many projects to increase green spaces, not only to protect citizens’ health, but also to improve urban landscapes. In this sense, it is unsurprising that the health sector has the largest number of programs and one of the highest proportions of the budget. Second, most of the IPCCAS 2012–2016 were prepared with reference to the NCCAS 2011–2015, which was established based on the Framework Act on Low Carbon Green Growth. The Korean government regarded the green growth model as a new mechanism for national growth and emphasized that managing climate change risk should be treated as a new opportunity for economic growth. Consequently, the government promoted industries related to climate change, such as renewable energy, desalination, and climate-related financial services, which became a key element of its climate change adaptation strategy.
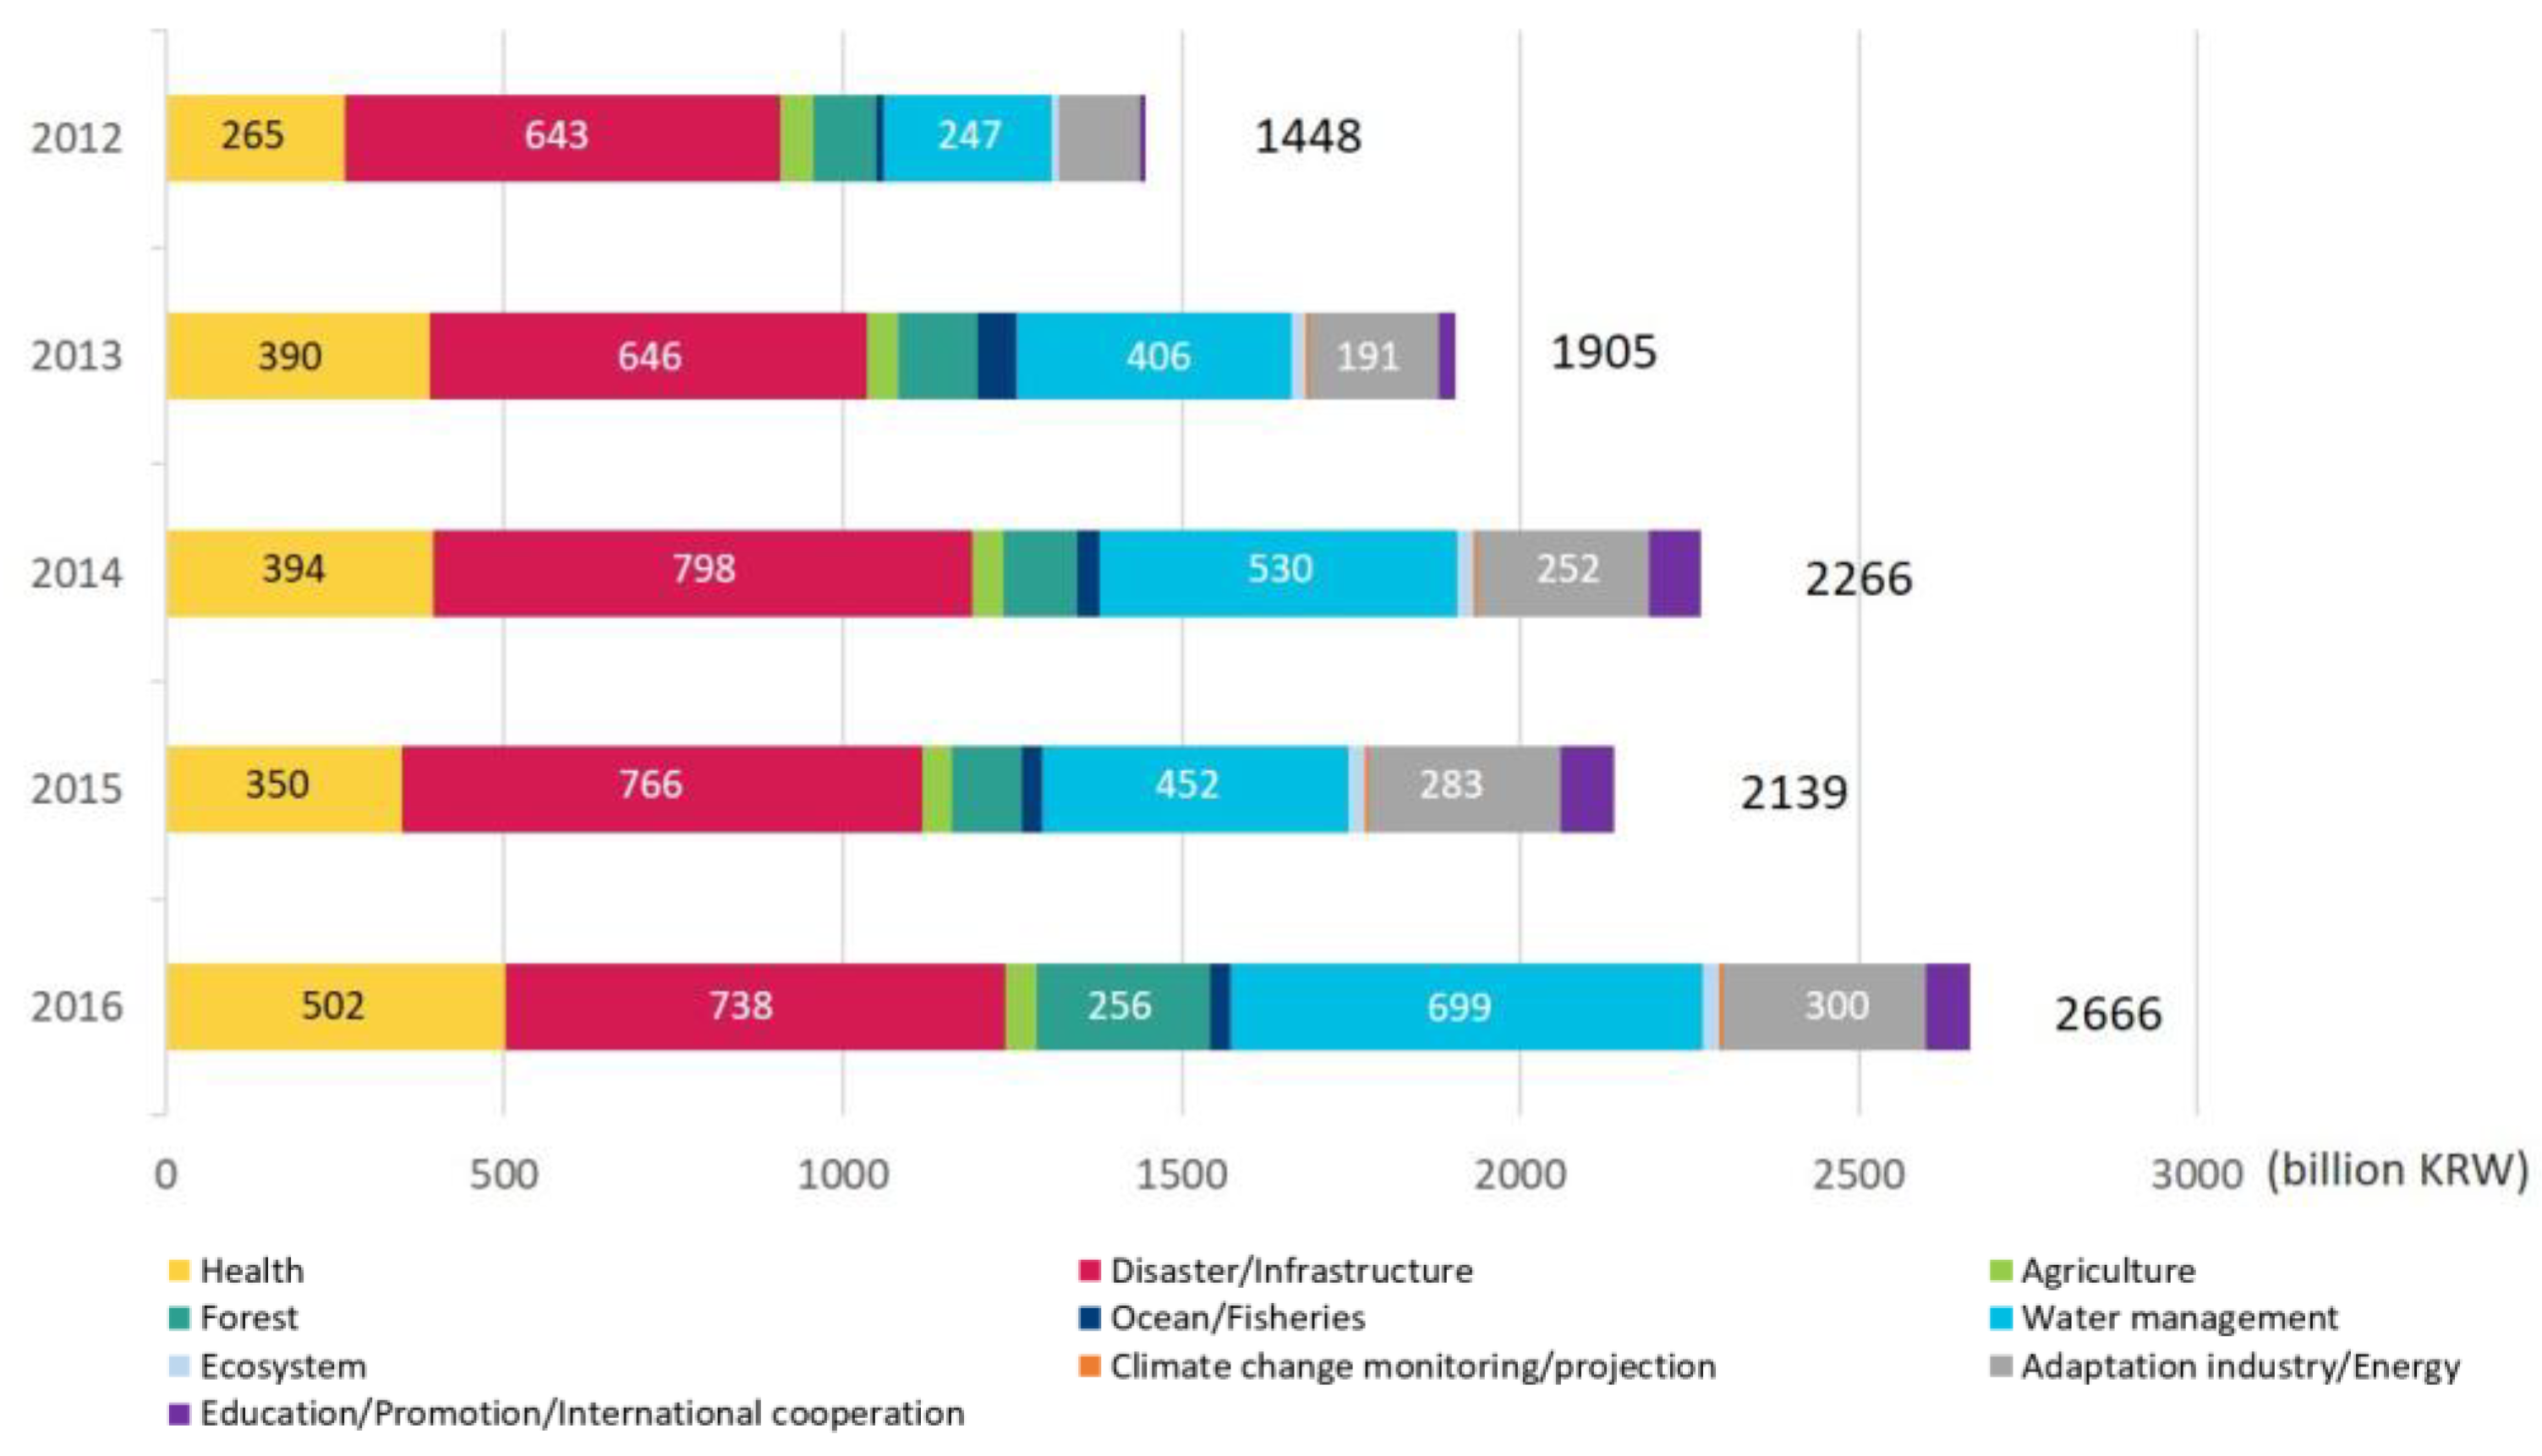
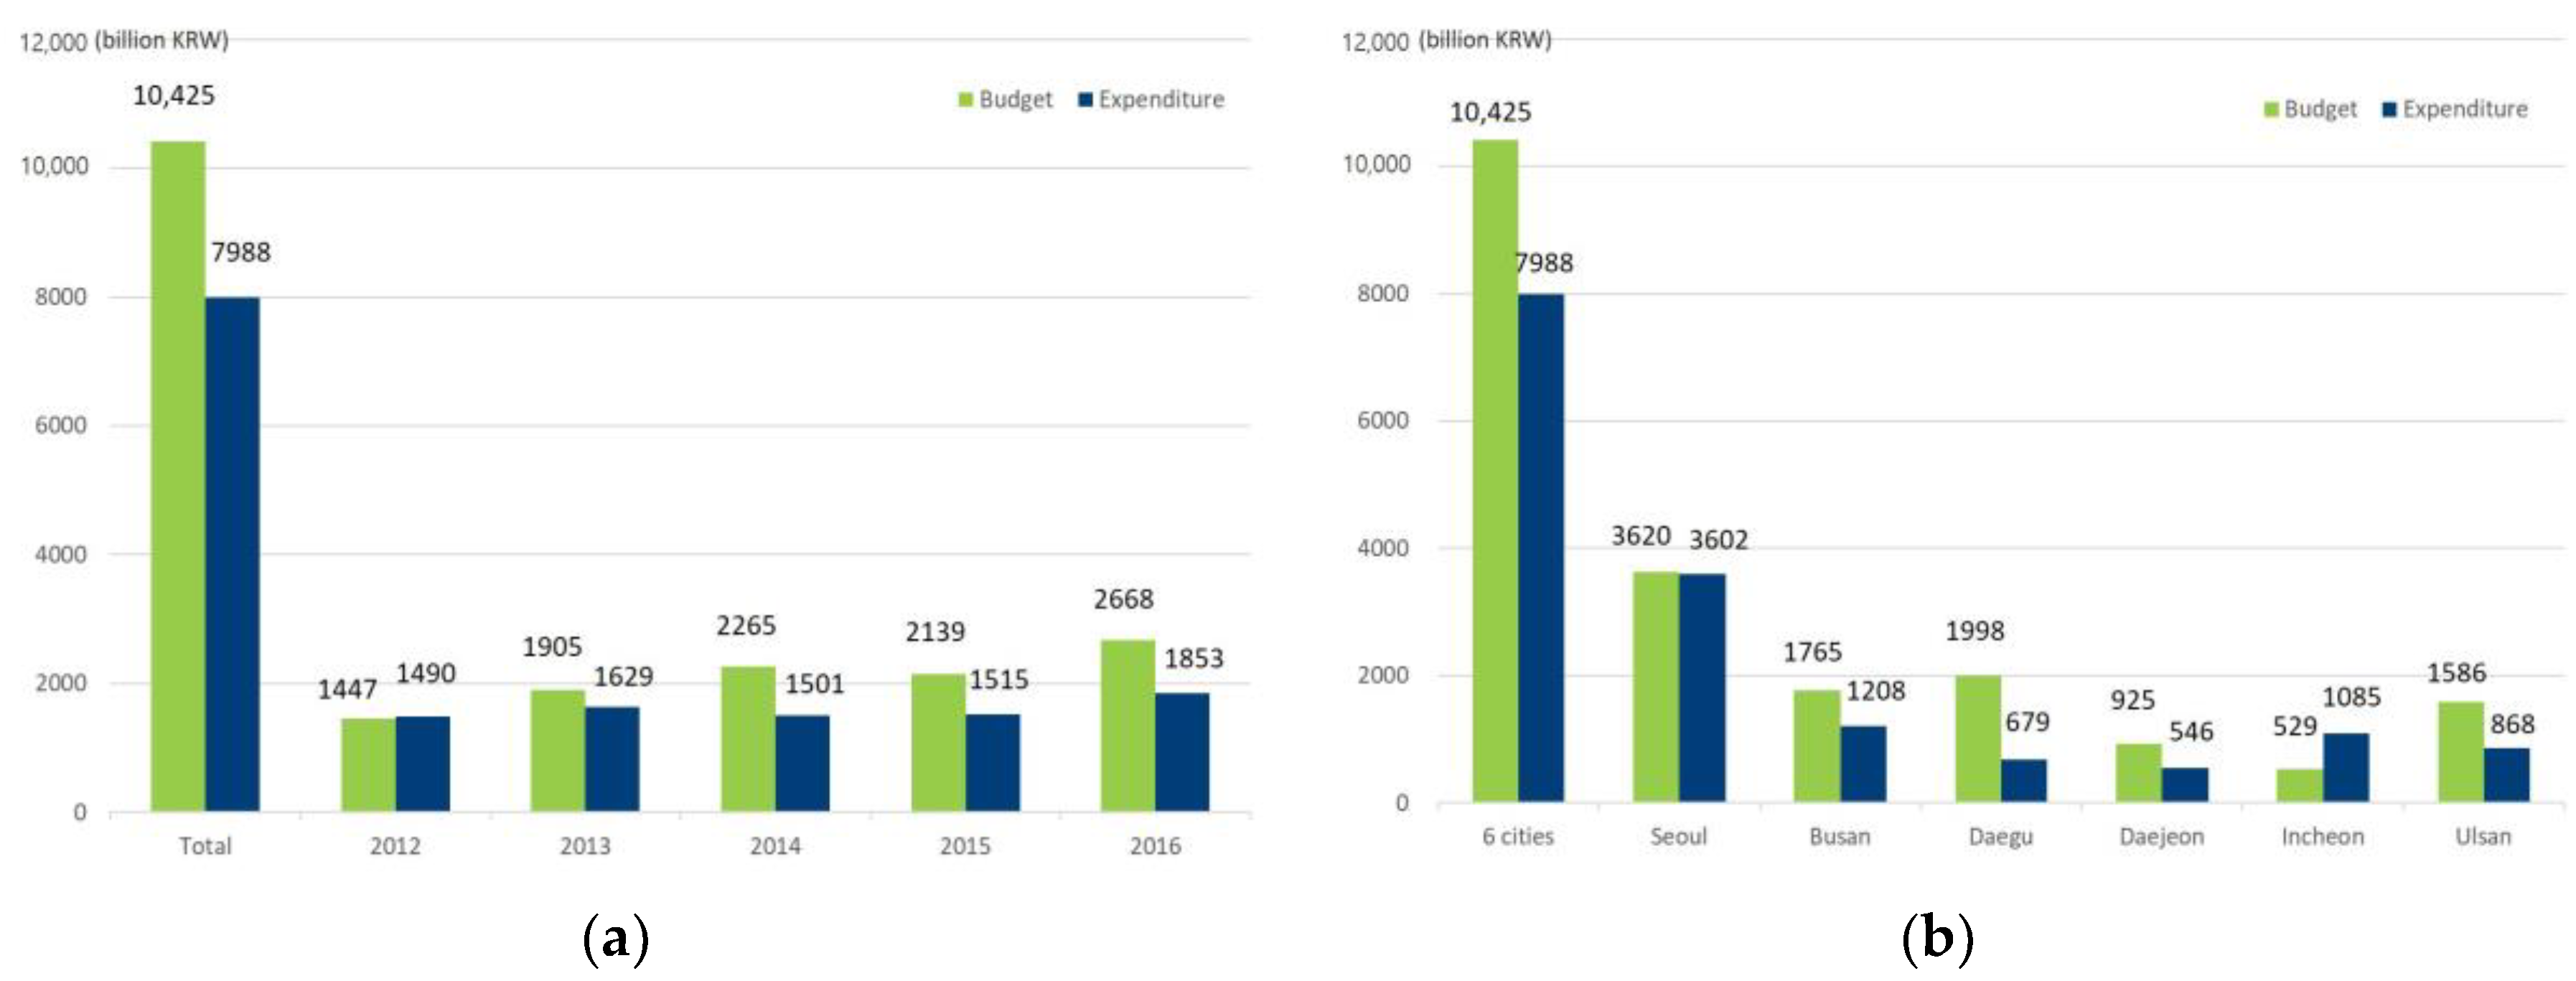
The total planned budget of all six cities was 1448 billion KRW for adaptation programs in 2012, which would be expanded to 2666 billion KRW in 2016 (Figure 3). The budget for adaptation programs increased every year except between 2014 and 2015; this exception was mainly due to a large increase in the water management sector in 2014 and 2016. Incheon sharply increased its budget for several river maintenance projects in 2014, and Ulsan allocated a large budget for projects to reuse sewage and waste water in 2016. The increase in the health sector budget between 2015 and 2016 is accounted for by Ulsan’s large planned investment in urban parks and green spaces.
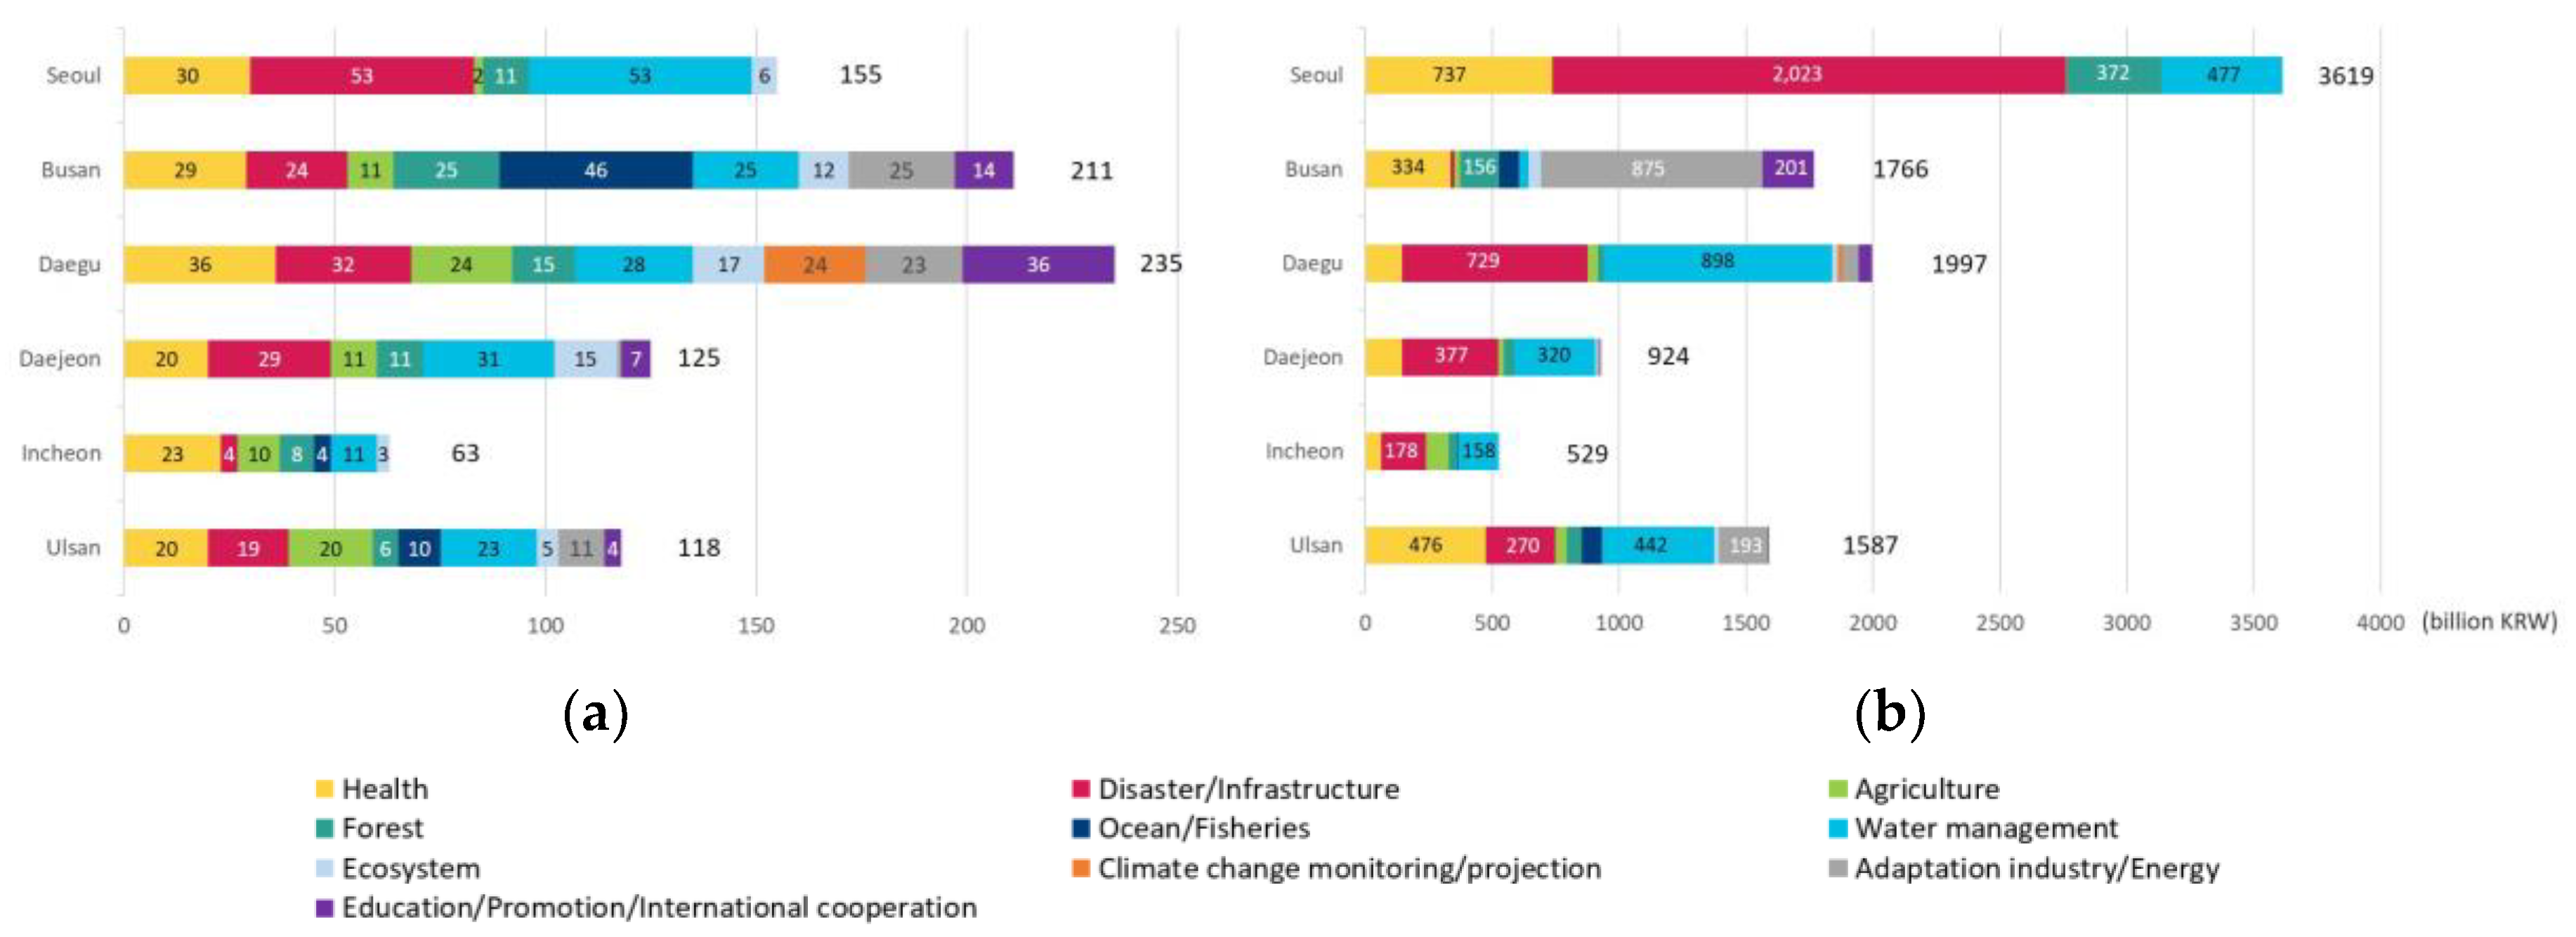
At the individual city level, Seoul allocated the largest budget (3619 billion KRW) to climate change adaption programs, of which it had 155. The next largest planned budget was in Daegu, where 1977 billion KRW was allocated to 235 programs, the highest number of programs among these six cities. Busan, Ulsan, and Daejeon planned to spend 1766 billion KRW on 211 programs, 1587 billion KRW on 118 programs, and 924 billion KRW on 125 programs, respectively. Incheon had the smallest budget (529 billion KRW) and number of programs (63) (Figure 4).
Figure 4 shows the number of programs and planned budget by sector in each city. Adaptation efforts seem comparatively well-distributed among sectors in terms of the number of programs, with some exceptions. First, Daegu is the only city that planned programs for climate change monitoring and projection. Since Korean cities tend to rely on nationally provided climate data and climate change scenarios, the other cities seemed unwilling to undertake programs for this sector. However, Daegu planned to develop systems to monitor its urban microclimate and produce city-specific climate data and scenarios. Second, the coastal cities—Busan, Incheon, and Ulsan—prepared programs for the ocean/fisheries sector, whereas the inland cities—Seoul, Daegu, and Daejeon—presented no such programs. Third, Seoul did not include any programs for adaptation of industry/energy or the education/promotion/international cooperation sector, despite having the largest planned budget. One possible explanation is that Seoul did not consider educational and promotional programs to be adaptation options when it established IPCCAS, since its establishment preceded the national government distributing the IPCCAS writing manual.
The planned budgets show that the case cities have different predominant sectors, and the cities can be divided into four groups. First, the majority of cities prioritized the disaster/infrastructure and water management sectors: Daegu, Daejeon, and Incheon, respectively, allocated 81.5%, 75.4% and 63.5% of their total budgets for adaptation programs to these sectors. Second, Seoul planned to invest a very sizable portion of its budget, 2023 of 3619 billion KRW (55.9%), in only the disaster/infrastructure sector, with the aims of expanding sewer capacity and installing rainwater detention facilities to prevent flood damage. Third, Busan prioritized the climate change industry/energy sector more than the other cities. It planned to spend 49.5% of its budget (875 of 1766 billion KRW) on nurturing the marine bio industry, seawater desalination, and Green Port industry; developing renewable energy projects, including constructing off-shore wind farms; and developing hydrogen production and storage technology. By contrast, the other cities considered renewable energy projects as mitigation efforts rather than adaptation programs. Finally, Ulsan distributed its budget relatively evenly across diverse sectors compared to the other cities. Table A1 and Table A2 present more detailed information about budget allocation by programs for each city.
4.2. Implementation of Climate Change Adaptation Measures in Six Metropolitan Cities
From 2012 to 2016, the six metropolitan governments spent 7988 billion KRW (approximately 7.6 billion USD) on climate change adaptation programs, falling short of the planned budget for the total period. In 2012, the cities’ spending exceeded their planned budget, but in all other years they spent less money (Figure 5a). At the individual city level, all cities except Incheon spent less on climate change adaptation programs than they had planned in the IPCCAS (Figure 5b).
Figure 6 shows actual expenditure on adaptation programs by sector. The most money was spent on the disaster/infrastructure sector (3870 billion KRW, 48.4%), followed by health (1559 billion KRW, 19.5%), and water management (961 billion KRW, 12.0%). These three sectors also had the three highest planned budgets. However, expenditure on the water management and health sectors was lower than the respective planned budgets of 2333 and 1901 billion KRW for these sectors. In contrast, expenditure on the disaster/infrastructure sector exceeded the planned budget of 3592 billion KRW. Consequently, about half of total adaptation expenditure was concentrated on programs to prevent and respond to disasters. In addition to exceeding the planned disaster/infrastructure sector budget, the six municipal governments spent more money than planned on the agriculture and ocean/fisheries sectors: 306 billion KRW rather than 230 for agriculture; 257 billion KRW rather than 160 for ocean/fisheries. A similar amount of money was spent on the ecosystem sector, while in other sectors the planned budget was not completely utilized.
Table 5 outlines spending on specific plans. In the disaster/infrastructure sector, a significant amount of money was invested in programs to improve sewerage systems, including expanding sewer capacity and installing rainwater detention facilities to prevent flood damage (1514 billion KRW), to safely manage waste treatment facilities (1042 billion KRW), and to protect disaster-prone areas such as low-lying ground and slopes (541 billion KRW). Within the health sector, the six cities spent large amounts on programs to reduce damage from heat waves and UV (1001 billion KRW) and damage from air pollution (32 billion KRW). Among the five plans with the largest expenditures, only two—improvement of sewerage system and reducing damage from heat waves and UV—had been adequately budgeted for in the IPCCAS. More detailed information about expenditure by program for each city is presented in Table A1 and Table A2.
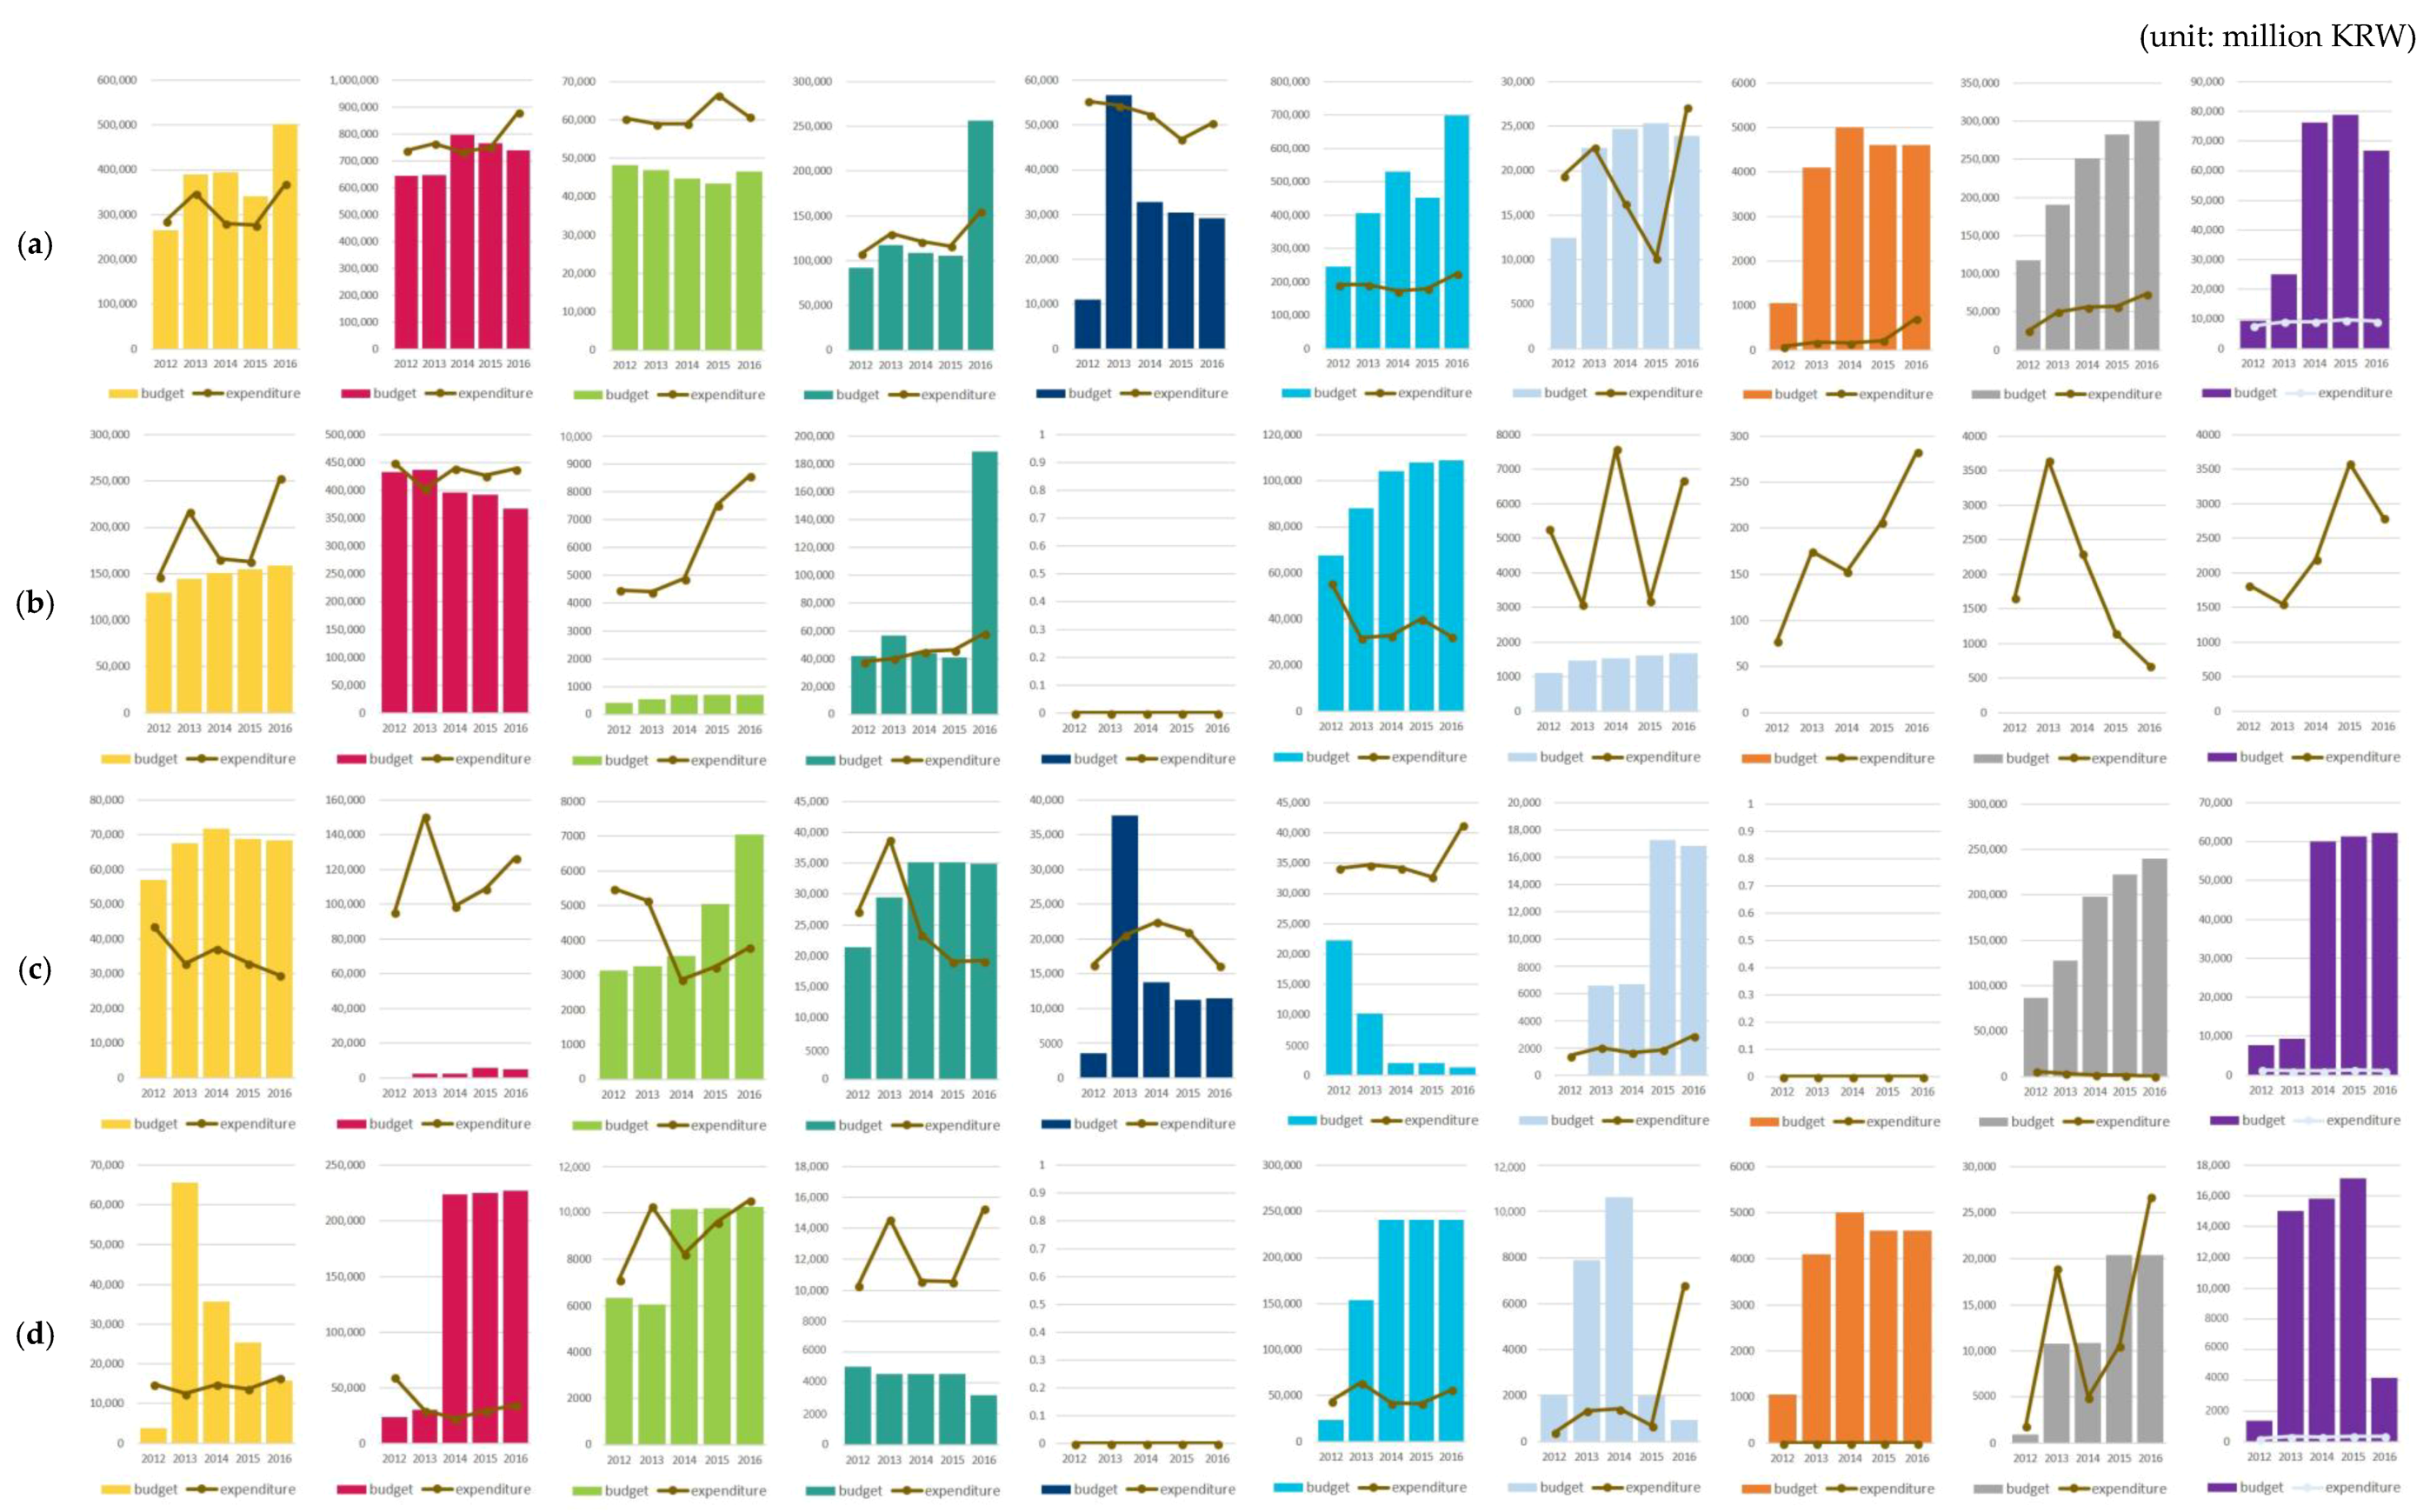
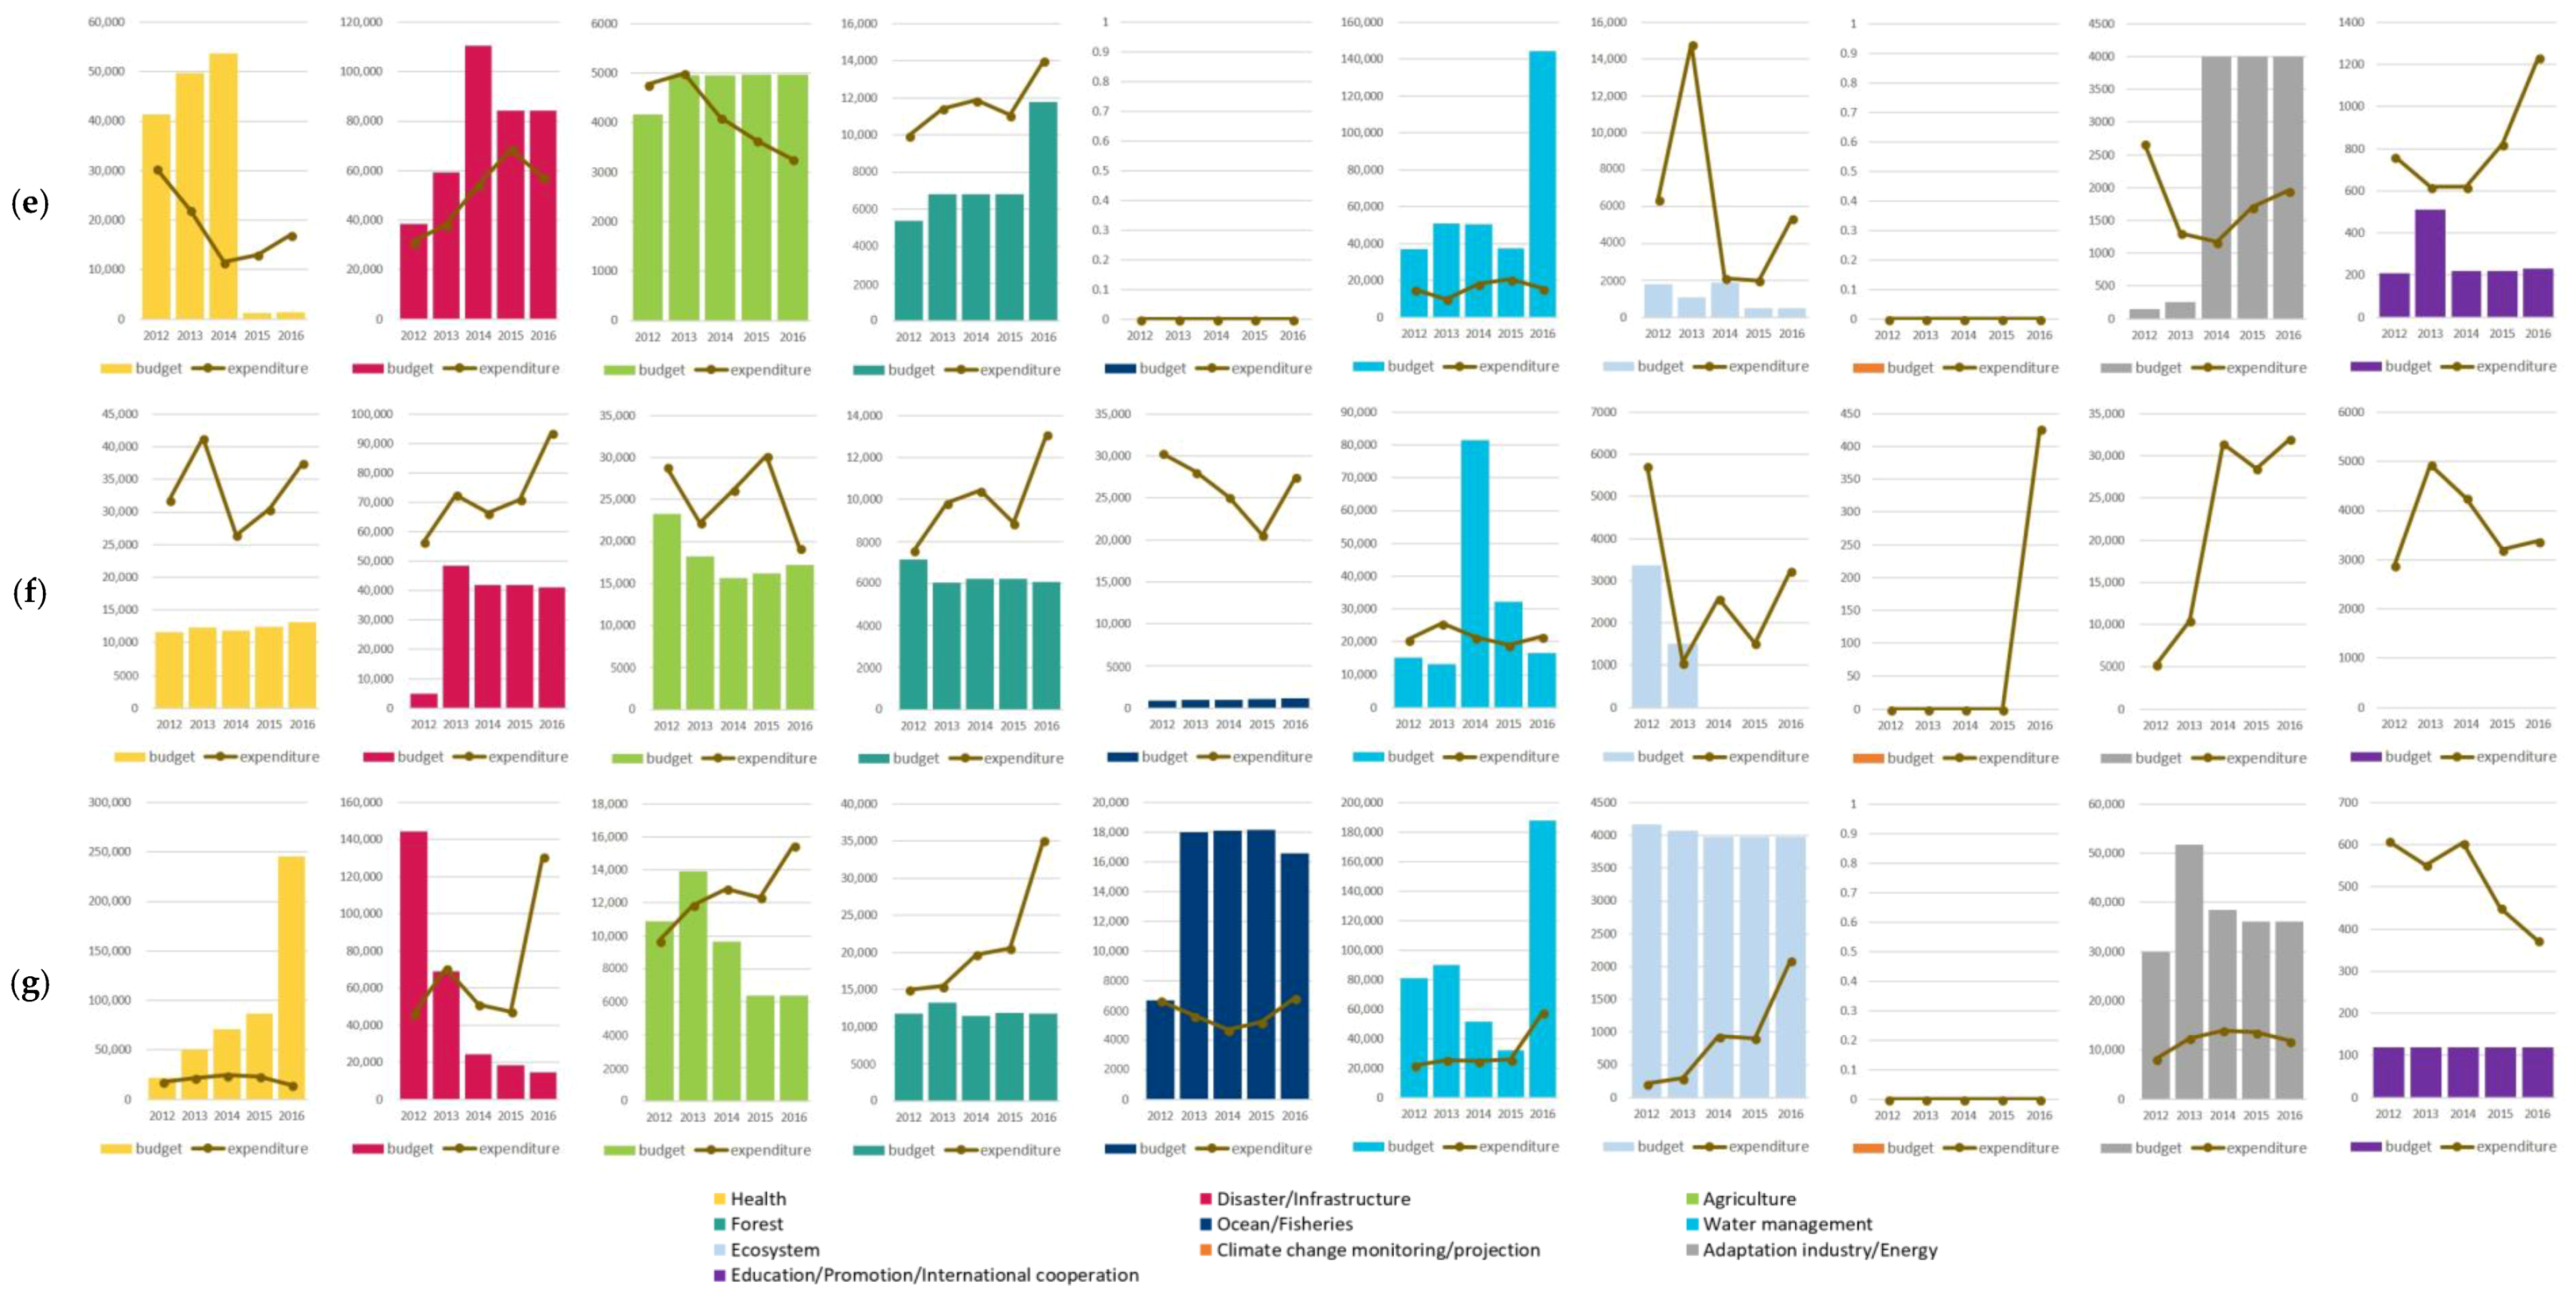
The phenomenon of expenditure exceeding the budget in some sectors is made more obvious by scrutinizing the expenditure at the level of each city. Figure 7 presents the planned budget and actual expenditure by sector and year for each city. The bars indicate the planned budget set out in the IPCCAS, and the lines show actual expenditure estimated from the expenditure reports. Although looking at all six cities together suggests that only the disaster/infrastructure, agriculture, and ocean/fisheries sectors exceeded the planned budget, looking at each city shows that expenditure also exceeded budget in other sectors. Seoul spent more money than planned in the health, ecosystem, climate change industry/energy, and education/promotion/international cooperation sectors; Busan in water management; Daegu in forest; Daejeon in ecosystem and education/promotion/international cooperation; Incheon in health, forest, climate change industry/energy, and education/promotion/international cooperation; and Ulsan in forest and education/promotion/international cooperation.
The reason for the variation between planned and actual expenditure may be municipal governments’ different perceptions of climate change adaptation. Since adaptation policies overlap with disaster management and other environmental policies, the range of adaptation programs may depend on how climate change adaptation and climate-related risks are defined. This meant that certain programs were included in the IPCCAS of some cities but not others. For example, Seoul and Incheon did not recognize the international cooperation sector as an adaptation category and thus did not list any programs in this sector whereas Busan, Daegu, and Ulsan included various programs in this sector. According to the NCCAS, programs falling under the international cooperation sector could include holding international conferences and exhibitions about climate change adaptation, exchanging knowledge with foreign governments and institutions, and participating in international adaptation projects. Seoul and Incheon spent a substantial amount of money on this sector: Seoul held the International Council of Local Environmental Initiatives (ICLEI) World Congress in 2015 and operates the ICLEI East Asia Secretariat; Incheon also supported international organizations located in its territory, such as the Green Climate Fund. Similarly, Daegu, Daejeon, and Incheon spent money on programs to reduce air pollution even though they did not present those programs as adaptation programs in the IPCCAS. Expenditure on such “unrecognized” adaptation programs ranged from 4.9% to 60.8% of individual cities’ total expenditure on adaptation programs (Table 6).
5. Discussion
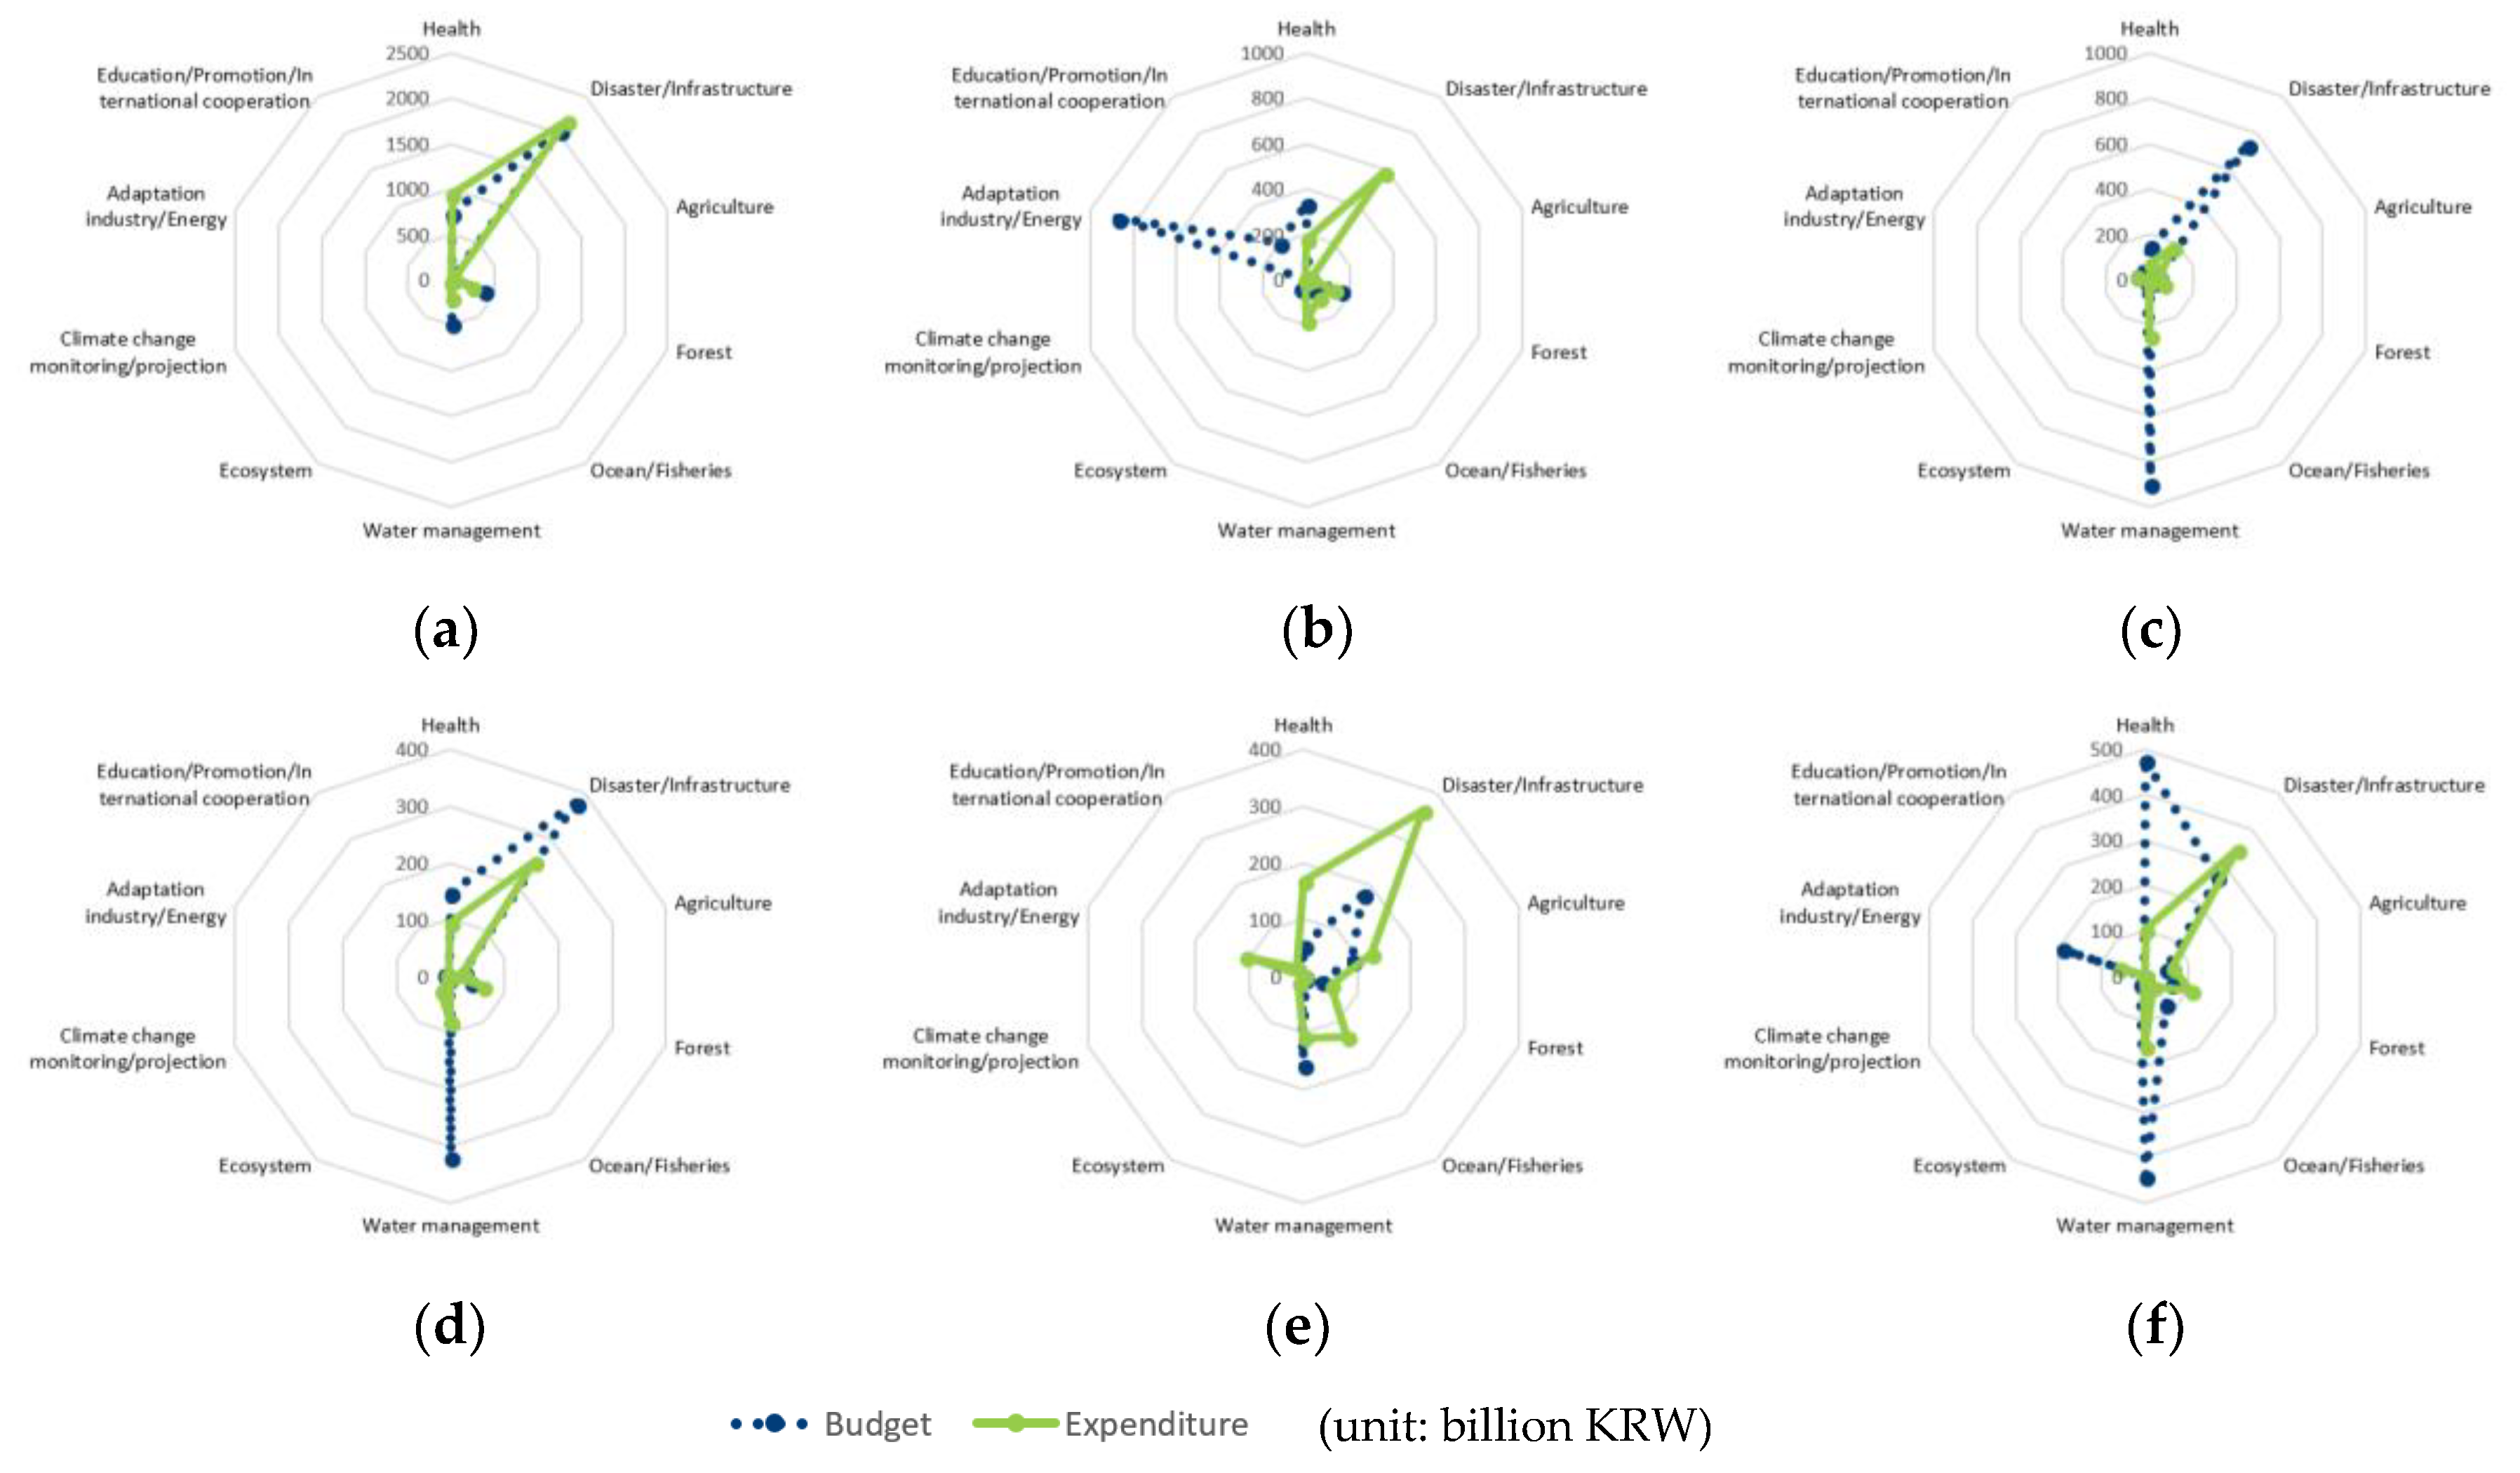
The analysis showed that the South Korean metropolitan cities taken as case studies varied in implementing the strategies for climate change adaptation that were indicated in their IPCCAS. Figure 8 summarizes these outcomes. Seoul shows almost the same shape for both budget (blue dotted line) and expenditure (green solid line), which means it implemented the adaptation programs that it planned. In Daegu and Daejeon, the shapes of budget and expenditure are similar, but the budget is bigger than the expenditure. This means that these cities distributed their actual expenditure as planned in the budget, but the absolute level of expenditure was lower than planned. Incheon also has relatively similar shapes for budget and expenditure, but the budget is smaller than the expenditure. This indicates that Incheon concentrated its actual expenditure on the sectors that were prioritized in the IPCCAS, and the actual expenditure surpassed the allocated budget. Finally, in Busan and Ulsan, the shapes and sizes of the budget and expenditure are different from each other, which suggests that these cities implemented their adaptation programs differently from the original plans.
Despite their overall tendency to spend less than budgeted, it can be argued that metropolitan cities in South Korea have been implementing various climate change adaptation programs. However, it may be too early to assert that the programs are fully developed to enable climate change adaptation in individual cities. First, most of the IPCCAS adaptation programs came from the NCCAS; consequently, the programs are quite similar across cities, although climate change adaptation itself is “highly context-specific because it depends on the climatic, environmental, social, and political conditions in the target region and sector” [27] (p. 273). Although the NCCAS provides a good catalogue of diverse adaptation options, it does not offer specific, locally-customized adaptation programs since it was prepared in the national context. Given this limitation, municipal adaptation plans should fully consider local conditions and include numerous unique programs that the NCCAS could not provide. However, IPCCAS 2012–2016 showed a substantial overlap with the NCCAS and the overlapping programs appear to be general programs applicable to most cities, for example reducing damage from heavy snow and strong winds; promoting urban farming; managing street trees; maintaining mountain trails; and developing technology to store, process, and distribute marine products. The expenditure on such programs is classified under “Etc.” for each sector in Table A1 and Table A2 in the appendix.
The amount of unutilized budget also shows that municipal governments were not fully able to develop an effective IPCCAS. According to Table 7, 343 billion KRW (3.3% of total planned budget) was not spent, because not all programs to which a budget was allocated were implemented. This seems to be a small proportion of the total budget, but the majority of the unimplemented programs were vulnerability assessments and advanced monitoring to predict the effects of climate change on various sectors.
Finally, a question about the effect of adaptation programs arises. If adaptation programs do not appropriately reflect local conditions, are they effective in mitigating the adverse effects of climate change and making cities more climate-resilient? The six case study cities still spent large amounts of money on post-disaster restoration. For example, Busan’s annual expenditure between 2012 and 2016 on restoring damaged areas and supporting people damaged by floods and landslides was 1186, 203, 8011, 1107 and 3003 million KRW. In Ulsan, annual expenditure amounted to 3184, 1484, 6408, 1698, and 53,531 million KRW. Considering that implementing policies and spending large amounts on programs does not always guarantee the expected outcomes, future research should focus on evaluating the actual effect of adaptation programs on individual cities [28]. Moreover, if adaptation programs do not have a significant effect, research should address why the programs are not working.
6. Conclusions
Through analyzing budgets and actual expenditure on climate change adaptation programs in six metropolitan cities in South Korea, this study found that these cities have implemented various programs to adapt to climate change, but the cities’ expenditure varied to different degrees from their original IPCCAS in terms of both level of overall expenditure and specific expenditure by sector. More specifically, we discovered the following: First, most cities prioritized the disaster/infrastructure, water management, and health sectors for adaptation. Second, actual expenditure on climate change adaptation programs was less than the budget planned in the IPCCAS. Third, some cities (Seoul, Daegu, Daejeon, and Incheon) prioritized the sectors similarly in both the planning and implementation stages, whereas some cities (Busan and Ulsan) had different priorities in the two stages. In other words, the former cities spent more money on the sectors to which more budget had been allocated, but the latter cities did not distribute their money as planned in the IPCCAS. Fourth, it is difficult to assert that the current adaptation programs of South Korean metropolitan cities are well-tailored to each city.
This study is the first to compare the planning and implementation stages of adaptation at the level of municipal governments in South Korea in terms of budget and expenditure. It has important implications for many other local governments that are preparing to establish an IPCCAS, as well as the six metropolitan governments implementing their second IPCCAS. The findings suggest that, to improve consistency between planning and implementation, municipal governments should consider local conditions and develop locally required programs rather than broadly accepting and emulating the NCCAS. Successfully implementing climate change adaptation programs at the city level not only protects citizens from climate hazards, but also contributes to global efforts to achieve Sustainable Development Goals (SDGs), such as Good Health and Well-being (SDG 3); Clean Water and Sanitation (SDG 6); Affordable and Clean Energy (SDG 7); Industry, Innovation and Infrastructure (SDG 9); Sustainable Cities and Communities (SDG 11); Climate Action (SDG 13); Life Below Water (SDG 14); and Life on Land (SDG 15). Since these goals can be achieved only if they are supported by local efforts and cooperation, it is very important for local governments to create and implement well-tailored climate change adaptation plans. Furthermore, since implementing adaptation programs does not reduce the negative effects and risks of climate change, monitoring and evaluation systems for adaptation programs are still required.
Author Contributions
J.-S.L. (corresponding author) and J.W.K. (first author) conceived and designed the study; J.W.K. analyzed the data; and J.-S.L. and J.W.K. wrote the paper.
Funding
This work was supported by the KU-KIST Graduate School.
Acknowledgments
The authors appreciate useful comments from the reviewers.
Conflicts of Interest
The authors declare no conflict of interest.
Appendix A

Table A1.
Climate change adaptation programs, planned budget, and actual expenditure of three metropolitan cities in South Korea (Seoul, Busan, and Daegu), 2012–2016.
Table A1.
Climate change adaptation programs, planned budget, and actual expenditure of three metropolitan cities in South Korea (Seoul, Busan, and Daegu), 2012–2016.
| Sector/Specific Plan | Seoul | Busan | Daegu | ||||||
|---|---|---|---|---|---|---|---|---|---|
| Programs (#) | Budget (million KRW) | Expenditure (million KRW) | Programs (#) | Budget (million KRW) | Expenditure (million KRW) | Programs (#) | Budget (million KRW) | Expenditure (million KRW) | |
| Total | 155 | 3,620,143 | 3,602,143 | 211 | 1,765,486 | 1,208,395 | 235 | 1,998,212 | 678,538 |
| Health | 30 | 737,324 | 946,464 | 29 | 333,650 | 176,666 | 36 | 146,407 | 72,573 |
| 2 | 0 | 0 | 5 | 8100 | 0 | 0 | 0 | 0 |
| 17 | 676,299 | 690,541 | 9 | 317,700 | 104,005 | 23 | 140,843 | 33,658 |
| 2 | 9620 | 4217 | 0 | 0 | 4633 | 3 | 3471 | 3466 |
| 0 | 0 | 0 | 0 | 0 | 7 | 0 | 0 | 0 |
| 3 | 5180 | 5575 | 6 | 700 | 4482 | 5 | 393 | 830 |
| 0 | 0 | 0 | 0 | 0 | 0 | 2 | 1070 | 0 |
| 0 | 0 | 0 | 0 | 0 | 0 | 0 | 0 | 0 |
| 2 | 300 | 242,891 | 9 | 7150 | 62,287 | 2 | 100 | 33,794 |
| 0 | 0 | 0 | 0 | 0 | 0 | 0 | 0 | 0 |
| 1 | 1100 | 0 | 0 | 0 | 0 | 0 | 0 | 0 |
| 3 | 44,825 | 3240 | 0 | 0 | 1251 | 1 | 530 | 825 |
| Disaster/infrastructure | 53 | 2,023,172 | 2,157,140 | 24 | 15,584 | 581,080 | 32 | 728,524 | 175,488 |
| 0 | 0 | 0 | 3 | 1600 | 0 | 2 | 100 | 0 |
| 1 | 0 | 0 | 0 | 0 | 0 | 4 | 6300 | 0 |
| 1 | 0 | 65 | 2 | 1584 | 0 | 2 | 26,250 | 287 |
| 3 | 19,957 | 48,769 | 4 | 600 | 347,255 | 2 | 84,393 | 60,824 |
| 14 | 15,966 | 18,534 | 0 | 0 | 36,281 | 11 | 8994 | 37,174 |
| 5 | 1500 | 94,024 | 3 | 4500 | 19,672 | 3 | 80 | 0 |
| 2 | 94,190 | 91,850 | 8 | 6700 | 52,234 | 0 | 0 | 500 |
| 0 | 0 | 322,915 | 0 | 0 | 122,891 | 2 | 0 | 38,728 |
| 0 | 0 | 0 | 0 | 0 | 0 | 0 | 0 | 0 |
| 12 | 1,699,686 | 1,356,684 | 4 | 600 | 2502 | 2 | 602,000 | 35,213 |
| 0 | 0 | 0 | 0 | 0 | 0 | 0 | 0 | 0 |
| 0 | 0 | 0 | 0 | 0 | 0 | 0 | 0 | 0 |
| 0 | 0 | 2103 | 0 | 0 | 244 | 0 | 0 | 0 |
| 1 | 590 | 1112 | 0 | 0 | 0 | 0 | 0 | 1876 |
| 14 | 191,283 | 221,084 | 0 | 0 | 0 | 4 | 407 | 884 |
| Agriculture | 2 | 3060 | 29,824 | 11 | 22,040 | 20,558 | 24 | 42,999 | 45,794 |
| 0 | 0 | 0 | 2 | 0 | 0 | 1 | 0 | 0 |
| 0 | 0 | 0 | 2 | 8000 | 0 | 2 | 7796 | 3295 |
| 0 | 0 | 971 | 2 | 200 | 5074 | 3 | 5830 | 9474 |
| 0 | 0 | 0 | 0 | 0 | 155 | 0 | 0 | 4067 |
| 0 | 0 | 0 | 0 | 0 | 16 | 0 | 0 | 77 |
| 0 | 0 | 0 | 0 | 0 | 0 | 3 | 170 | 0 |
| 0 | 0 | 0 | 0 | 0 | 0 | 2 | 19,243 | 300 |
| 0 | 0 | 0 | 0 | 0 | 0 | 3 | 100 | 0 |
| 0 | 0 | 9 | 4 | 13,840 | 5079 | 3 | 2445 | 6194 |
| 0 | 0 | 0 | 0 | 0 | 3620 | 2 | 5210 | 11,339 |
| 0 | 0 | 196 | 1 | 0 | 98 | 3 | 50 | 5 |
| 0 | 0 | 0 | 0 | 0 | 0 | 0 | 0 | 100 |
| 0 | 0 | 1101 | 0 | 0 | 2727 | 2 | 2155 | 6525 |
| 2 | 3060 | 27,547 | 0 | 0 | 3789 | 0 | 0 | 4417 |
| Forest | 11 | 372,371 | 227,662 | 25 | 155,900 | 127,696 | 15 | 22,002 | 61,385 |
| 0 | 0 | 0 | 4 | 67,600 | 30,702 | 2 | 450 | 9386 |
| 0 | 0 | 0 | 3 | 2600 | 0 | 4 | 5693 | 7251 |
| 0 | 0 | 0 | 2 | 1000 | 0 | 0 | 0 | 0 |
| 1 | 2578 | 0 | 2 | 0 | 256 | 0 | 0 | 256 |
| 1 | 0 | 0 | 0 | 0 | 330 | 3 | 185 | 235 |
| 4 | 329,932 | 107,687 | 8 | 65,500 | 34,308 | 3 | 12,389 | 17,086 |
| 0 | 0 | 14,159 | 2 | 0 | 30,148 | 3 | 3285 | 5481 |
| 0 | 0 | 140 | 0 | 0 | 0 | 0 | 0 | 12 |
| 3 | 39,861 | 105,676 | 4 | 19,200 | 31,952 | 0 | 0 | 21,679 |
| Ocean/fisheries | 0 | 0 | 0 | 46 | 77,700 | 96,615 | 0 | 0 | 0 |
| 0 | 0 | 0 | 4 | 1500 | 0 | 0 | 0 | 0 |
| 0 | 0 | 0 | 14 | 18,300 | 173 | 0 | 0 | 0 |
| 0 | 0 | 0 | 6 | 8250 | 35,897 | 0 | 0 | 0 |
| 0 | 0 | 0 | 5 | 1300 | 90 | 0 | 0 | 0 |
| 0 | 0 | 0 | 7 | 2350 | 11,395 | 0 | 0 | 0 |
| 0 | 0 | 0 | 3 | 1000 | 0 | 0 | 0 | 0 |
| 0 | 0 | 0 | 0 | 22,500 | 162 | 0 | 0 | 0 |
| 0 | 0 | 0 | 0 | 0 | 0 | 0 | 0 | 0 |
| 0 | 0 | 0 | 3 | 0 | 12,226 | 0 | 0 | 0 |
| 0 | 0 | 0 | 4 | 22,500 | 36,672 | 0 | 0 | 0 |
| Water management | 53 | 476,810 | 192,835 | 25 | 37,650 | 177,204 | 28 | 898,436 | 247,943 |
| 1 | 0 | 2879 | 3 | 1250 | 671 | 2 | 0 | 466 |
| 1 | 0 | 0 | 4 | 2000 | 0 | 0 | 0 | 0 |
| 7 | 22,200 | 42,565 | 8 | 2000 | 0 | 3 | 6800 | 11,635 |
| 4 | 0 | 0 | 0 | 0 | 61 | 2 | 1600 | 43 |
| 4 | 2313 | 3442 | 0 | 0 | 3 | 4 | 0 | 27 |
| 12 | 33,628 | 37,151 | 3 | 30,700 | 0 | 9 | 782,913 | 5885 |
| 3 | 76,564 | 48,424 | 3 | 1200 | 71,559 | 6 | 106,148 | 112,538 |
| 0 | 0 | 0 | 0 | 0 | 0 | 0 | 0 | 29,440 |
| 20 | 292,865 | 30,447 | 0 | 0 | 49,164 | 2 | 975 | 51,546 |
| 1 | 49,240 | 27,927 | 4 | 500 | 55,747 | 0 | 0 | 36,361 |
| Ecosystem | 6 | 7406 | 25,861 | 12 | 47,300 | 9879 | 17 | 23,495 | 10,651 |
| 3 | 1177 | 586 | 0 | 0 | 0 | 3 | 1080 | 149 |
| 0 | 0 | 0 | 5 | 4300 | 0 | 0 | 0 | 0 |
| 2 | 5969 | 12,129 | 3 | 500 | 7538 | 4 | 5358 | 2581 |
| 0 | 0 | 12,987 | 4 | 42,500 | 1589 | 3 | 17,008 | 7921 |
| 1 | 260 | 0 | 0 | 0 | 752 | 0 | 0 | 0 |
| 0 | 0 | 159 | 0 | 0 | 0 | 3 | 49 | 0 |
| Climate change monitoring/projection | 0 | 0 | 0 | 0 | 0 | 0 | 24 | 19,350 | 0 |
| 0 | 0 | 0 | 0 | 0 | 0 | 3 | 5700 | 0 |
| 0 | 0 | 0 | 0 | 0 | 0 | 4 | 7450 | 0 |
| 0 | 0 | 0 | 0 | 0 | 0 | 2 | 500 | 0 |
| 0 | 0 | 0 | 0 | 0 | 0 | 6 | 1000 | 0 |
| 0 | 0 | 0 | 0 | 0 | 0 | 0 | 0 | 0 |
| 0 | 0 | 0 | 0 | 0 | 0 | 2 | 1000 | 0 |
| 0 | 0 | 0 | 0 | 0 | 0 | 0 | 0 | 0 |
| 0 | 0 | 895 | 0 | 0 | 0 | 0 | 0 | 0 |
| 0 | 0 | 0 | 0 | 0 | 0 | 7 | 3700 | 0 |
| Adaptation industry/energy | 0 | 0 | 0 | 25 | 874,860 | 12,742 | 23 | 63,544 | 63,166 |
| 0 | 0 | 0 | 1 | 0 | 0 | 2 | 600 | 0 |
| 0 | 0 | 0 | 2 | 1370 | 0 | 6 | 1030 | 0 |
| 0 | 0 | 9459 | 21 | 873,490 | 12,742 | 15 | 61,914 | 63,166 |
| 0 | 0 | 0 | 1 | 0 | 0 | 0 | 0 | |
| Education/promotion/international cooperation | 0 | 0 | 11,961 | 14 | 200,802 | 5955 | 36 | 53,455 | 1538 |
| 0 | 0 | 1461 | 8 | 850 | 2122 | 18 | 8305 | 1412 |
| 0 | 0 | 3673 | 3 | 150,500 | 7 | 12 | 40,700 | 126 |
| 0 | 0 | 6828 | 3 | 49,452 | 3826 | 6 | 4450 | 0 |
Table A2.
Climate change adaptation programs, planned budget, and actual expenditure of three metropolitan cities in South Korea (Daejeon, Incheon, and Ulsan), 2012–2016.
Table A2.
Climate change adaptation programs, planned budget, and actual expenditure of three metropolitan cities in South Korea (Daejeon, Incheon, and Ulsan), 2012–2016.
| Sector/Specific plan | Daejeon | Incheon | Ulsan | ||||||
|---|---|---|---|---|---|---|---|---|---|
| Programs (#) | Budget (Million KRW) | Expenditure (Million KRW) | Programs (#) | Budget (Million KRW) | Expenditure (Million KRW) | Programs (#) | Budget (Million KRW) | Expenditure (Million KRW) | |
| Total | 125 | 925,255 | 546,253 | 63 | 529,345 | 1,084,965 | 118 | 1,586,432 | 867,899 |
| Health | 20 | 147,320 | 94,113 | 23 | 61,100 | 167,599 | 20 | 475,575 | 101,578 |
| 0 | 0 | 0 | 0 | 0 | 0 | 0 | 0 | 0 |
| 14 | 145,868 | 70,218 | 7 | 14,596 | 29,100 | 7 | 425,680 | 73,377 |
| 4 | 1360 | 2741 | 4 | 36,502 | 32,300 | 1 | 1620 | 2191 |
| 0 | 0 | 0 | 6 | 0 | 0 | 0 | 0 | 0 |
| 2 | 92 | 6374 | 0 | 7449 | 16,259 | 6 | 3465 | 3563 |
| 0 | 0 | 0 | 0 | 0 | 0 | 0 | 0 | 0 |
| 0 | 0 | 0 | 0 | 0 | 0 | 0 | 0 | 0 |
| 0 | 0 | 14,755 | 0 | 0 | 89,837 | 3 | 42,160 | 22,448 |
| 0 | 0 | 0 | 0 | 0 | 0 | 0 | 0 | 0 |
| 0 | 0 | 0 | 0 | 0 | 0 | 0 | 0 | 0 |
| 0 | 0 | 25 | 6 | 2553 | 102 | 3 | 2650 | 0 |
| Disaster/infrastructure | 29 | 377,047 | 249,903 | 4 | 177,808 | 360,169 | 19 | 270,343 | 346,258 |
| 0 | 0 | 0 | 0 | 0 | 0 | 0 | 0 | |
| 6 | 1700 | 108 | 0 | 0 | 813 | 0 | 0 | 2350 |
| 2 | 15 | 56 | 1 | 0 | 75 | 1 | 60 | 0 |
| 0 | 0 | 5928 | 1 | 4708 | 35,267 | 3 | 16,823 | 42,722 |
| 8 | 45,624 | 35,204 | 0 | 0 | 34,804 | 3 | 255 | 31,174 |
| 0 | 0 | 4033 | 0 | 0 | 10,275 | 2 | 0 | 66,304 |
| 2 | 482 | 0 | 0 | 0 | 0 | 0 | 0 | 1272 |
| 6 | 324,379 | 203,478 | 0 | 0 | 185,290 | 2 | 54,992 | 168,618 |
| 0 | 0 | 0 | 0 | 0 | 0 | 0 | 0 | 0 |
| 5 | 4847 | 0 | 2 | 173,100 | 88,550 | 7 | 153,439 | 31,023 |
| 0 | 0 | 0 | 0 | 0 | 0 | 0 | 0 | 0 |
| 0 | 0 | 0 | 0 | 0 | 0 | 0 | 0 | 0 |
| 0 | 0 | 0 | 0 | 0 | 0 | 1 | 44,774 | 0 |
| 0 | 0 | 0 | 0 | 0 | 2341 | 0 | 0 | 2794 |
| 0 | 0 | 1096 | 0 | 0 | 2753 | 0 | 0 | 0 |
| Agriculture | 11 | 24,004 | 20,765 | 10 | 90,439 | 126,657 | 20 | 47,249 | 62,240 |
| 0 | 0 | 0 | 0 | 0 | 1 | 34 | 0 | |
| 0 | 0 | 0 | 0 | 1009 | 1 | 170 | 3212 | |
| 6 | 18,806 | 10,636 | 4 | 0 | 24,596 | 11 | 39,569 | 20,152 |
| 0 | 0 | 1294 | 0 | 0 | 2493 | 0 | 0 | 63 |
| 0 | 0 | 483 | 0 | 0 | 1090 | 0 | 0 | 12,546 |
| 0 | 0 | 441 | 0 | 0 | 0 | 0 | 0 | 0 |
| 2 | 4200 | 0 | 1 | 0 | 20,984 | 1 | 0 | 0 |
| 0 | 0 | 0 | 0 | 0 | 0 | 0 | 0 | |
| 3 | 998 | 317 | 1 | 32,664 | 5636 | 1 | 0 | 3724 |
| 0 | 0 | 1300 | 1 | 57,760 | 51,466 | 1 | 1679 | 9389 |
| 0 | 0 | 100 | 3 | 15 | 1324 | 1 | 0 | 140 |
| 0 | 0 | 0 | 0 | 0 | 0 | 0 | 0 | |
| 0 | 0 | 2845 | 0 | 0 | 10,716 | 3 | 5797 | 10,954 |
| 0 | 0 | 3351 | 0 | 0 | 7343 | 0 | 0 | 2061 |
| Forest | 11 | 37,628 | 58,373 | 8 | 31,717 | 49,827 | 6 | 60,108 | 105,967 |
| 0 | 0 | 10,447 | 0 | 0 | 0 | 0 | 0 | 721 |
| 4 | 2091 | 10,310 | 2 | 14,831 | 13,140 | 0 | 0 | 12,981 |
| 0 | 0 | 0 | 0 | 0 | 0 | 0 | 0 | 0 |
| 0 | 0 | 2815 | 0 | 0 | 7011 | 0 | 0 | 476 |
| 0 | 0 | 0 | 0 | 0 | 0 | 0 | 200 | 591 |
| 7 | 16,886 | 14,194 | 3 | 12,710 | 21,646 | 1 | 32,833 | 35,098 |
| 0 | 0 | 1550 | 3 | 4176 | 3463 | 2 | 25,545 | 39,302 |
| 0 | 0 | 4 | 0 | 0 | 230 | 2 | 0 | 2797 |
| 0 | 18,651 | 19,052 | 0 | 0 | 4337 | 0 | 1530 | 14,002 |
| Ocean/fisheries | 0 | 0 | 0 | 4 | 5123 | 131,724 | 10 | 77,503 | 29,054 |
| 0 | 0 | 0 | 0 | 0 | 0 | 1 | 33 | 0 |
| 0 | 0 | 0 | 0 | 0 | 0 | 0 | 0 | 0 |
| 0 | 0 | 0 | 0 | 0 | 92 | 0 | 0 | 2905 |
| 0 | 0 | 0 | 0 | 0 | 0 | 1 | 33 | 0 |
| 0 | 0 | 0 | 0 | 0 | 45,876 | 4 | 13,187 | 12,005 |
| 0 | 0 | 0 | 0 | 0 | 8408 | 1 | 700 | 0 |
| 0 | 0 | 0 | 0 | 0 | 187 | 1 | 150 | 322 |
| 0 | 0 | 0 | 0 | 0 | 0 | 0 | 0 | 0 |
| 0 | 0 | 0 | 4 | 5123 | 71,786 | 2 | 63,400 | 12,310 |
| 0 | 0 | 0 | 0 | 0 | 5374 | 0 | 0 | 1511 |
| Water management | 31 | 319,693 | 79,501 | 11 | 158,291 | 108,036 | 23 | 442,220 | 155,811 |
| 0 | 0 | 1604 | 0 | 0 | 1399 | 0 | 0 | |
| 0 | 0 | 0 | 0 | 0 | 270 | 1 | 200 | 3299 |
| 0 | 0 | 19,037 | 0 | 0 | 1668 | 2 | 700 | 0 |
| 0 | 0 | 3 | 0 | 0 | 0 | 3 | 250 | 0 |
| 8 | 685 | 1345 | 0 | 0 | 16,241 | 4 | 135,231 | 9135 |
| 2 | 0 | 0 | 0 | 0 | 16,829 | 5 | 166,240 | 3142 |
| 6 | 107,860 | 38,982 | 0 | 0 | 65,427 | 3 | 126,140 | 115,329 |
| 3 | 50 | 60 | 0 | 0 | 0 | 0 | 0 | |
| 11 | 201,740 | 3489 | 0 | 0 | 6262 | 4 | 13,209 | 5591 |
| 1 | 9358 | 14,981 | 11 | 158,291 | 0 | 1 | 250 | 19,315 |
| Ecosystem | 15 | 5773 | 30,728 | 3 | 4867 | 14,141 | 5 | 20,155 | 4450 |
| 4 | 2973 | 0 | 1 | 623 | 0 | 1 | 83 | 0 |
| 1 | 0 | 0 | 0 | 0 | 0 | 1 | 0 | 0 |
| 1 | 0 | 6777 | 0 | 0 | 4174 | 1 | 44,774 | 4450 |
| 8 | 2800 | 23,951 | 2 | 4244 | 9917 | 2 | 20,072 | 0 |
| 1 | 0 | 0 | 0 | 0 | 50 | 0 | 0 | 0 |
| 0 | 0 | 0 | 0 | 0 | 0 | 0 | 0 | 0 |
| Climate change monitoring/projection | 0 | 0 | 0 | 0 | 0 | 0 | 0 | 0 | 0 |
| 0 | 0 | 0 | 0 | 0 | 0 | 0 | 0 | 0 |
| 0 | 0 | 0 | 0 | 0 | 0 | 0 | 0 | 0 |
| 0 | 0 | 0 | 0 | 0 | 0 | 0 | 0 | 0 |
| 0 | 0 | 0 | 0 | 0 | 0 | 0 | 0 | 0 |
| 0 | 0 | 0 | 0 | 0 | 0 | 0 | 0 | 0 |
| 0 | 0 | 0 | 0 | 0 | 0 | 0 | 0 | 0 |
| 0 | 0 | 0 | 0 | 0 | 0 | 0 | 0 | 0 |
| 0 | 0 | 0 | 0 | 0 | 427 | 0 | 0 | 0 |
| 0 | 0 | 0 | 0 | 0 | 0 | 0 | 0 | 0 |
| Adaptation industry/Energy | 1 | 12,400 | 8811 | 0 | 0 | 107,713 | 11 | 192,679 | 59,950 |
| 0 | 0 | 0 | 0 | 0 | 0 | 1 | 0 | 0 |
| 0 | 0 | 0 | 0 | 0 | 0 | 2 | 200 | 0 |
| 1 | 12,400 | 8811 | 0 | 0 | 107,713 | 7 | 192,479 | 59,950 |
| 0 | 0 | 0 | 0 | 0 | 0 | 1 | 0 | 0 |
| Education/Promotion/International cooperation | 7 | 1390 | 4059 | 0 | 0 | 18,673 | 4 | 600 | 2591 |
| 2 | 90 | 3890 | 0 | 0 | 5052 | 2 | 500 | 2374 |
| 5 | 1300 | 169 | 0 | 0 | 1361 | 0 | 0 | 69 |
| 0 | 0 | 0 | 0 | 0 | 12,260 | 2 | 100 | 148 |
References
- UNDESA (United Nations Department of Economic and Social Affairs). The World’s Cities in 2016—Data Booklet; ST/EAS/SER.A/392; United Nations Department of Economic and Social Affairs, Population Division: New York, NY, USA, 2016; pp. 1–9. [Google Scholar]
- UN-HABITAT (United Nations Human Settlements Programme). World Cities Report 2016—Urbanization and Development: Emerging Futures; United Nations Human Settlements Programme: Nairobi, Kenya, 2016; pp. 1–17. Available online: http://wcr.unhabitat.org/wp-content/uploads/2017/02/WCR-2016-Full-Report.pdf (accessed on 11 April 2018).
- Brennan, E.M. Population, urbanization, environment, and security: A summary of the issues. Environ. Chang. Secur. Proj. Rep. 1999, 5, e14. Available online: http://citeseerx.ist.psu.edu/viewdoc/download?doi=10.1.1.557.4969&rep=rep1&type=pdf (accessed on 16 April 2018).
- Cohen, B. Urbanization in developing countries: Current trends, future projections, and key challenges for sustainability. Technol. Soc. 2006, 28, 63–80. [Google Scholar] [CrossRef]
- Henderson, V. Urbanization in developing countries. World Bank Res. Obs. 2002, 17, 89–112. [Google Scholar] [CrossRef]
- Spaans, M.; Waterhout, B. Building up resilience in cities worldwide—Rotterdam as participant in the 100 Resilient Cities Programme. Cities 2017, 61, 109–116. [Google Scholar] [CrossRef]
- Moore, M.; Gould, P.; Keary, B.S. Global urbanization and impact on health. Int. J. Hyg. Environ. Health 2003, 206, 269–278. [Google Scholar] [CrossRef] [PubMed]
- UN-HABITAT (United Nations Human Settlements Programme). Global Report on Human Settlements 2011—Cities and Climate Change; United Nations Human Settlements Programme: Nairobi, Kenya, 2011; pp. vi–viii. Available online: https://unhabitat.org/books/cities-and-climate-change-global-report-on-human-settlements-2011/ (accessed on 11 April 2018).
- IPCC (Intergovernmental Panel on Climate Change). Climate Change 2014: Impacts, Adaptation, and Vulnerability. Working Group II Contribution to the Fifth Assessment Report of the Intergovernmental Panel on Climate Change; Cambridge University Press: New York, NY, USA, 2014; pp. 535–612. Available online: http://www.ipcc.ch/pdf/assessment-report/ar5/wg2/WGIIAR5-Chap8_FINAL.pdf (accessed on 12 April 2018).
- Georgeson, L.; Maslin, M.; Poessinouw, M.; Howard, S. Adaptation responses to climate change differ between global megacities. Nat. Clim. Chang. 2016, 6, 584. [Google Scholar] [CrossRef]
- Wamsler, C.; Brink, E.; Rivera, C. Planning for climate change in urban areas: From theory to practice. J. Clean. Prod. 2013, 50, 68–81. [Google Scholar] [CrossRef]
- UNISDR; USAID; CRED. 2011 Disasters in Numbers. 2012. Available online: https://www.unisdr.org/files/24692_2011disasterstats.pdf (accessed on 11 April 2018).
- UNISDR (United Nations Office for Disaster Risk Reduction). National Disaster Risk Assessment: Governance System, Methodologies, and Use of Results; United Nations Office for Disaster Risk Reduction: Geneva, Switzerland, 2017; pp. 21–25. Available online: https://www.unisdr.org/files/52828_nationaldisasterriskassessmentwiagu.pdf (accessed on 11 April 2018).
- Hunt, A.; Watkiss, P. Climate change impacts and adaptation in cities: A review of the literature. Clim. Chang. 2011, 104, 13–49. [Google Scholar] [CrossRef] [Green Version]
- De Sherbinin, A.; Schiller, A.; Pulsipher, A. The vulnerability of global cities to climate hazards. Environ. Urban 2007, 19, 39–64. [Google Scholar] [CrossRef] [Green Version]
- Reckien, D.; Flacke, J.; Dawson, R.J.; Heidrich, O.; Olazabal, M.; Foley, A.; Hamann, J.J.-P.; Orru, H.; Salvia, M.; De Gregorio Hurtado, S.; et al. Climate change response in Europe: What’s the reality? Analysis of adaptation and mitigation plans from 200 urban areas in 11 countries. Clim. Chang. 2014, 122, 331–340. [Google Scholar] [CrossRef]
- UNISDR (United Nations Office for Disaster Risk Reduction). Global Assessment Report on Disaster Risk Reduction 2015; United Nations Office for Disaster Risk Reduction: Geneva, Switzerland, 2015; pp. 53–88. Available online: https://www.preventionweb.net/english/hyogo/gar/2015/en/gar-pdf/GAR2015_EN.pdf (accessed on 11 April 2018).
- Davoudi, S. Resilience: A bridging concept or a dead end? Plan. Theory Pract. 2012, 13, 299–333. [Google Scholar] [CrossRef]
- Jabareen, Y. Planning the resilient city: Concepts and strategies for coping with climate change and environmental risk. Cities 2013, 31, 220–229. [Google Scholar] [CrossRef]
- Desouza, K.C.; Flanery, T.H. Designing, planning, and managing resilient cities: A conceptual framework. Cities 2013, 35, 89–99. [Google Scholar] [CrossRef]
- Leichenko, R. Climate change and urban resilience. Curr. Opin. Environ. Sustain. 2011, 3, 164–168. [Google Scholar] [CrossRef]
- IPCC (Intergovernmental Panel on Climate Change). Annex II: Glossary. In Climate Change 2014: Synthesis Report. Contribution of Working Group I, II and III to the Fifth Assessment Report of the Intergovernmental Panel on Climate Change; Intergovernmental Panel on Climate Change: Geneva, Switzerland, 2014; pp. 117–130. Available online: https://www.ipcc.ch/pdf/assessment-report/ar5/syr/AR5_SYR_FINAL_Glossary.pdf (accessed on 30 April 2018).
- Broto, V.C.; Bulkeley, H. A survey of urban climate change experiments in 100 cities. Glob. Environ. Chang. 2013, 23, 92–102. [Google Scholar] [CrossRef] [PubMed] [Green Version]
- Shi, L.; Chu, E.; Debats, J. Explaining progress in climate adaptation planning across 156 U.S. municipalities. J. Am. Plan. Assoc. 2015, 81, 191–202. [Google Scholar] [CrossRef]
- Hamin, E.M.; Gurran, N. Urban form and climate change: Balancing adaptation and mitigation in the U.S. and Australia. Habitat Int. 2009, 33, 238–245. [Google Scholar] [CrossRef] [Green Version]
- Biesbroek, G.R.; Swart, R.J.; Carter, T.R.; Cowan, C.; Henrichs, T.; Mela, H.; Morecroft, M.D.; Rey, D. Europe adaps to climate change: Comparing National Adaptation Strategies. Glob. Environ. Chang. 2010, 20, 440–450. [Google Scholar] [CrossRef]
- Füssel, H.M. Adaptation planning for climate change: Concepts, assessment approaches, and key lessons. Sustain. Sci. 2007, 2, 265–275. [Google Scholar] [CrossRef]
- Preston, B.L; Westaway, R.M.; Yuen, E.J. Climate adaptation planning in practice: An evaluation of adaptation plans from three developed nations. Mitig. Adapt. Strateg. Glob. Chang. 2011, 16, 407–438. [Google Scholar] [CrossRef]
- Mullan, M.; Kingsmill, N.; Kramer, A.M.; Agrawala, S. National Adaptation Planning: Lessons from OECD Countries; OECD Environmental Working Paper; OECD Publishing: Paris, France, 2013; Volume 54, pp. 1–74. [Google Scholar] [CrossRef]
- Adger, W.N.; Arnell, N.W.; Tompkins, E.L. Successful adaptation to climate change across scales. Glob. Environ. Chang. 2005, 15, 77–86. [Google Scholar] [CrossRef]
- De Bruin, K.; Dellink, B.; Ruijs, A.; Bolwidt, L.; Van Buuren, A.; Graveland, J.; De Groot, R.S.; Kuikman, P.J.; Reinhard, S.; Roetter, R.P.; et al. Adapting to climate change in the Netherlands: An inventory of climate adaptation options and ranking of alternatives. Clim. Chang. 2009, 95, 23–45. [Google Scholar] [CrossRef] [Green Version]
- Moser, C.; Satterthwaite, D. Towards Pro-Poor Adaptation to Climate Change in the Urban Centres of Low- and Middle-Income Countries; Global Urban Research Centre Working Paper #1; October 2008. Available online: http://hummedia.manchester.ac.uk/institutes/gdi/publications/workingpapers/gurc/GURC_wp1.pdf (accessed on 21 March 2018).
- Tyler, S.; Moench, M. A framework for urban climate resilience. Clim. Dev. 2012, 4, 311–326. [Google Scholar] [CrossRef] [Green Version]
- IPCC (Intergovernmental Panel on Climate Change). Climate Change 2014: Impacts, Adaptation, and Vulnerability. Working Group II Contribution to the Fifth Assessment Report of the Intergovernmental Panel on Climate Change; Cambridge University Press: New York, NY, USA, 2014; pp. 833–868. Available online: http://www.ipcc.ch/pdf/assessment-report/ar5/wg2/WGIIAR5-Chap14_FINAL.pdf (accessed on 20 March 2018).
- UKCIP (UK Climate Impacts Programme). Identifying Adaptation Options; UK Climate Impacts Programme: Oxford, UK, 2008; pp. 12–31. Available online: https://ukcip.ouce.ox.ac.uk/wp-content/PDFs/ID_Adapt_options.pdf (accessed on 21 March 2018).
- Bedsworth, L.W.; Hanak, E. Climate policy at the local level: Insights from California. Glob. Environ. Chang. 2013, 23, 664–677. [Google Scholar] [CrossRef]
- Lesnikowski, A.C.; Ford, J.D.; Berrang-Ford, L.; Barrera, M.; Heymann, J. How are we adapting to climate change? A global assessment. Mitig. Adapt. Strateg. Glob. Chang. 2015, 20, 277–293. [Google Scholar] [CrossRef]
- Carmin, J.; Roberts, D.; Anguelovski, I. Planning climate resilient cities: Early lessons from early adapters. In Proceedings of the World Bank 5th Urban Research Symposium, Cities and Climate Change: Responding to an Urgent Agenda, Marseille, France, June 2009; Available online: http://www.academia.edu/download/30581072/carmin_earlycityadaptation.pdf (accessed on 3 May 2018).
- Ford, J.D.; Berrang-Ford, L.; Paterson, J. A systematic review of observed climate change adaptation in developed nations. Clim. Chang. 2011, 106, 327–336. [Google Scholar] [CrossRef] [Green Version]
- Carter, J. Climate change adaptation in European cities. Curr. Opin. Environ. Sustain. 2011, 3, 193–198. [Google Scholar] [CrossRef]
- Busan Metropolitan City. Implementation Plan for Climate Change Adaptation Strategy (2012–2016). February 2012. Available online: http://ccas.kei.re.kr/community/manual/plan/plan_view1.do (accessed on 26 February 2018).
- Daegu Metropolitan City. Implementation Plan for Climate Change Adaptation Strategy (2012–2016). February 2012. Available online: http://ccas.kei.re.kr/community/manual/plan/plan_view1.do (accessed on 26 February 2018).
- Daejeon Metropolitan City. Implementation Plan for Climate Change Adaptation Strategy (2012–2016). February 2012. Available online: http://ccas.kei.re.kr/community/manual/plan/plan_view1.do (accessed on 26 February 2018).
- Incheon Metropolitan City. Implementation Plan for Climate Change Adaptation Strategy (2012–2016). February 2012. Available online: http://ccas.kei.re.kr/community/manual/plan/plan_view1.do (accessed on 26 February 2018).
- Seoul Metropolitan Government. Implementation Plan for Climate Change Adaptation Strategy (2012–2016). December 2011. Available online: http://ccas.kei.re.kr/community/manual/plan/plan_view1.do (accessed on 26 February 2018).
- Ulsan Metropolitan City. Implementation Plan for Climate Change Adaptation Strategy (2012–2016). February 2012. Available online: http://ccas.kei.re.kr/community/manual/plan/plan_view1.do (accessed on 26 February 2018).
- Korea Meteorological Administration. Busan Metropolitan City Climate Change Projection Report to Respond to New Climate Regime. December 2017. Available online: http://www.climate.go.kr/home/cc_data/2018/scenario/forecast_report/Busan.pdf (accessed on 5 June 2018).
- Korea Meteorological Administration. Daegu Metropolitan City Climate Change Projection Report to Respond to New Climate Regime. December 2017. Available online: http://www.climate.go.kr/home/cc_data/2018/scenario/forecast_report/Daegu.pdf (accessed on 5 June 2018).
- Korea Meteorological Administration. Daejeon Metropolitan City Climate Change Projection Report to Respond to New Climate Regime. December 2017. Available online: http://www.climate.go.kr/home/cc_data/2018/scenario/forecast_report/Daejeon.pdf (accessed on 5 June 2018).
- Korea Meteorological Administration. Incheon Metropolitan City Climate Change Projection Report to Respond to New Climate Regime. December 2017. Available online: http://www.climate.go.kr/home/cc_data/2018/scenario/forecast_report/Incheon.pdf (accessed on 5 June 2018).
- Korea Meteorological Administration. Seoul Metropolitan City Climate Change Projection Report to Respond to New Climate Regime. December 2017. Available online: http://www.climate.go.kr/home/cc_data/2018/scenario/forecast_report/Seoul.pdf (accessed on 5 June 2018).
- Korea Meteorological Administration. Ulsan Metropolitan City Climate Change Projection Report to Respond to New Climate Regime. December 2017. Available online: http://www.climate.go.kr/home/cc_data/2018/scenario/forecast_report/Ulsan.pdf (accessed on 5 June 2018).
- Korean Statistical Information Service. Available online: http://kosis.kr/eng (accessed on 6 June 2018).
- Busan Metropolitan City. 2012 Expenditure Report. March 2013. Available online: http://www.busan.go.kr/public/finalaccount/832941?curPage=&srchBeginDt=2008-05-05&srchEndDt=2018-05-05&srchKey=&srchText= (accessed on 27 March 2018).
- Busan Metropolitan City. 2013 Expenditure Report. March 2014. Available online: http://www.busan.go.kr/public/finalaccount/832946?curPage=&srchBeginDt=2008-05-05&srchEndDt=2018-05-05&srchKey=&srchText= (accessed on 27 March 2018).
- Busan Metropolitan City. 2014 Expenditure Report. March 2015. Available online: http://www.busan.go.kr/public/finalaccount/832942?curPage=&srchBeginDt=2008-05-05&srchEndDt=2018-05-05&srchKey=&srchText= (accessed on 27 March 2018).
- Busan Metropolitan City. 2015 Expenditure Report. March 2016. Available online: http://www.busan.go.kr/public/finalaccount/832938?curPage=&srchBeginDt=2008-05-05&srchEndDt=2018-05-05&srchKey=&srchText= (accessed on 27 March 2018).
- Busan Metropolitan City. 2016 Expenditure Report. March 2017. Available online: http://www.busan.go.kr/public/finalaccount/835694?curPage=&srchBeginDt=2008-05-05&srchEndDt=2018-05-05&srchKey=&srchText= (accessed on 27 March 2018).
- Daegu Metropolitan City. 2012 Expenditure Report. March 2013. Available online: http://jumin.daegu.go.kr/budget/account/accountSheet.do (accessed on 27 March 2018).
- Daegu Metropolitan City. 2013 Expenditure Report. March 2014. Available online: http://jumin.daegu.go.kr/budget/account/accountSheet.do (accessed on 27 March 2018).
- Daegu Metropolitan City. 2014 Expenditure Report. March 2015. Available online: http://jumin.daegu.go.kr/budget/account/accountSheet.do (accessed on 27 March 2018).
- Daegu Metropolitan City. 2015 Expenditure Report. March 2016. Available online: http://jumin.daegu.go.kr/budget/account/accountSheet.do (accessed on 27 March 2018).
- Daegu Metropolitan City. 2016 Expenditure Report. March 2017. Available online: http://jumin.daegu.go.kr/budget/account/accountSheet.do (accessed on 27 March 2018).
- Daejeon Metropolitan City. 2012 Expenditure Report. March 2013. Available online: http://www.daejeon.go.kr/bud/BudFinanceboardList.do (accessed on 3 April 2018).
- Daejeon Metropolitan City. 2013 Expenditure Report. March 2014. Available online: http://www.daejeon.go.kr/bud/BudFinanceboardList.do (accessed on 3 April 2018).
- Daejeon Metropolitan City. 2014 Expenditure Report. March 2015. Available online: http://www.daejeon.go.kr/bud/BudFinanceboardList.do (accessed on 3 April 2018).
- Daejeon Metropolitan City. 2015 Expenditure Report. March 2016. Available online: http://www.daejeon.go.kr/bud/BudFinanceboardList.do (accessed on 3 April 2018).
- Daejeon Metropolitan City. 2016 Expenditure Report. March 2017. Available online: http://www.daejeon.go.kr/bud/BudFinanceboardList.do?boardId=budboard006&menuSeq=372 (accessed on 3 April 2018).
- Incheon Metropolitan City. 2012 Expenditure Report. March 2013. Available online: http://www.incheon.go.kr/posts/49/86?rnum=9&curPage=1 (accessed on 3 April 2018).
- Incheon Metropolitan City. 2013 Expenditure Report. March 2014. Available online: http://www.incheon.go.kr/posts/49/86?rnum=9&curPage=1 (accessed on 3 April 2018).
- Incheon Metropolitan City. 2014 Expenditure Report. March 2015. Available online: http://www.incheon.go.kr/posts/49/86?rnum=9&curPage=1 (accessed on 3 April 2018).
- Incheon Metropolitan City. 2015 Expenditure Report. March 2016. Available online: http://www.incheon.go.kr/posts/49/86?rnum=9&curPage=1 (accessed on 3 April 2018).
- Incheon Metropolitan City. 2016 Expenditure Report. March 2017. Available online: http://www.incheon.go.kr/posts/49/86?rnum=9&curPage=1 (accessed on 3 April 2018).
- Seoul Metropolitan Government. 2012 Expenditure Report. March 2013. Available online: http://finance.seoul.go.kr/archives/17868 (accessed on 25 March 2018).
- Seoul Metropolitan Government. 2013 Expenditure Report. March 2014. Available online: http://finance.seoul.go.kr/archives/20659 (accessed on 25 March 2018).
- Seoul Metropolitan Government. 2014 Expenditure Report. March 2015. Available online: http://finance.seoul.go.kr/archives/31133 (accessed on 25 March 2018).
- Seoul Metropolitan Government. 2015 Expenditure Report. March 2016. Available online: http://finance.seoul.go.kr/archives/34415 (accessed on 25 March 2018).
- Seoul Metropolitan Government. 2016 Expenditure Report. March 2017. Available online: http://finance.seoul.go.kr/archives/36612 (accessed on 25 March 2018).
- Ulsan Metropolitan City. 2012 Expenditure Report. March 2013. Available online: https://www.ulsan.go.kr/tax/fhsettlement (accessed on 3 April 2018).
- Ulsan Metropolitan City. 2013 Expenditure Report. March 2014. Available online: https://www.ulsan.go.kr/tax/fhsettlement (accessed on 3 April 2018).
- Ulsan Metropolitan City. 2014 Expenditure Report. March 2015. Available online: https://www.ulsan.go.kr/tax/fhsettlement (accessed on 3 April 2018).
- Ulsan Metropolitan City. 2015 Expenditure Report. March 2016. Available online: https://www.ulsan.go.kr/tax/fhsettlement (accessed on 3 April 2018).
- Ulsan Metropolitan City. 2016 Expenditure Report. March 2017. Available online: https://www.ulsan.go.kr/tax/fhsettlement (accessed on 3 April 2018).
- Government of Republic of Korea. National Climate Change Adaptation Strategy 2011–2015. October 2010. Available online: http://www.cdc.go.kr/CDC/cms/content/49/5349_view.html (accessed on 28 February 2018).
- Lim, B.; Spanger-Siegfried, E.; Burton, I.; Malone, E.L.; Huq, S. Adaptation Policy Frameworks for Climate Change: Developing Strategies, Policies and Measures; Cambridge University Press: Cambridge, UK, 2004; pp. 1–3. [Google Scholar]
Figure 1.
Location and characteristics of six South Korean metropolitan cities (Data source: [53]).
Figure 1.
Location and characteristics of six South Korean metropolitan cities (Data source: [53]).

Figure 2.
Climate change adaptation programs and budget plans divided by sector for six Korean cities, 2012–2016.
Figure 2.
Climate change adaptation programs and budget plans divided by sector for six Korean cities, 2012–2016.

Figure 3.
Total annual planned budgets for climate adaptation programs in six Korean cities, 2012–2016.
Figure 3.
Total annual planned budgets for climate adaptation programs in six Korean cities, 2012–2016.

Figure 4.
Planned climate change adaptation measures in six Korean cities for 2012–2016: (a) number of adaptation programs; and (b) allocated budget.
Figure 4.
Planned climate change adaptation measures in six Korean cities for 2012–2016: (a) number of adaptation programs; and (b) allocated budget.

Figure 5.
Planned budget vs. actual expenditure on climate change adaptation programs for 2012–2016 in six Korean cities: (a) by year; and (b) by city.
Figure 5.
Planned budget vs. actual expenditure on climate change adaptation programs for 2012–2016 in six Korean cities: (a) by year; and (b) by city.

Figure 6.
Spending on climate change adaptation programs in six Korean cities, 2012–2016: (a) by sector; and (b) comparison between planned budget and actual expenditure by sector.
Figure 6.
Spending on climate change adaptation programs in six Korean cities, 2012–2016: (a) by sector; and (b) comparison between planned budget and actual expenditure by sector.

Figure 7.
Annual planned budget and actual expenditure on climate change adaptation programs by sector for: (a) all six cities; (b) Seoul; (c) Busan; (d) Daegu; (e) Daejeon; (f) Incheon; and (g) Ulsan.
Figure 7.
Annual planned budget and actual expenditure on climate change adaptation programs by sector for: (a) all six cities; (b) Seoul; (c) Busan; (d) Daegu; (e) Daejeon; (f) Incheon; and (g) Ulsan.


Figure 8.
Comparison between planned budget and actual expenditure on climate change adaptation programs by sector from 2012–2016 for: (a) Seoul; (b) Busan; (c) Daegu; (d) Daejeon; (e) Incheon; and (f) Ulsan.
Figure 8.
Comparison between planned budget and actual expenditure on climate change adaptation programs by sector from 2012–2016 for: (a) Seoul; (b) Busan; (c) Daegu; (d) Daejeon; (e) Incheon; and (f) Ulsan.

| Source | Category | Examples of Adaptation Options | |
|---|---|---|---|
| de Bruin et al. (2009) | Agriculture |
| |
| Nature |
| ||
| Water |
| ||
| Energy and transport |
| ||
| Housing and infrastructure |
| ||
| Health |
| ||
| Recreation and tourism |
| ||
| Moser and Satterthwaite (2008) | Protection |
| |
| Pre-disaster damage limitation |
| ||
| Immediate post-disaster responses |
| ||
| Rebuilding |
| ||
| Tyler and Moench (2012) | Infrastructure systems |
| |
| Ecosystems |
| ||
| Agent capacities |
| ||
| Institutions |
| ||
| Intergovernmental Panel on Climate Change (2014) | Structural/physical | Engineered and built environment |
|
| Technological |
| ||
| Ecosystem-based |
| ||
| Services |
| ||
| Social | Educational |
| |
| Informational |
| ||
| Behavioral |
| ||
| Institutional | Economic |
| |
| Laws and regulations |
| ||
| Government policies and programs |
| ||
| United Kingdom Climate Impacts Programme (2008) | Building adaptive capacity | Creating information |
|
| Supportive social structure |
| ||
| Supportive governance |
| ||
| Delivering adaptation actions | Offsetting losses by spreading or sharing |
| |
| Preventing effects or reducing risks |
| ||
| Exploiting opportunities |
| ||
| Accepting the impacts and bearing loss |
| ||
| Element | Period | Scenario | Seoul | Busan | Daegu | Daejeon | Incheon | Ulsan | ||
|---|---|---|---|---|---|---|---|---|---|---|
| Average temperature (°C) | 2001–2010 | - | 13.0 | 14.4 | 13.2 | 12.4 | 12.0 | 13.4 | ||
| 2041–2050 | RCP2.6 | 13.3 | 15.7 | 14.6 | 13.7 | 13.5 | 14.7 | |||
| RCP6.0 | 13.7 | 15.0 | 13.9 | 13.0 | 12.6 | 14.1 | ||||
| 2091–2100 | RCP2.6 | 14.5 | 15.9 | 14.8 | 13.8 | 13.7 | 15.0 | |||
| RCP6.0 | 16.0 | 17.2 | 16.2 | 15.3 | 15.1 | 16.2 | ||||
| Average precipitation (mm) | 2001–2010 | - | 1387.4 | 1532.9 | 1266.4 | 1285.0 | 1192.5 | 1192.5 | 1446.0 | |
| 2041–2050 | RCP2.6 | 1202.8 | 1552.7 | 1174.6 | 1226.4 | 1019.8 | 1442.4 | |||
| RCP6.0 | 1258.7 | 1560.6 | 1182.8 | 1301.7 | 1057.3 | 1367.3 | ||||
| 2091–2100 | RCP2.6 | 1328.6 | 1552.3 | 1273.0 | 1293.5 | 1118.9 | 1479.3 | |||
| RCP6.0 | 1279.1 | 1695.4 | 1283.8 | 1250.8 | 1064.4 | 1642.4 | ||||
Table 3.
National Climate Change Adaptation Strategy of South Korea, 2011–2015 (Source: [84]).
Table 3.
National Climate Change Adaptation Strategy of South Korea, 2011–2015 (Source: [84]).
| Sector | Strategy | Specific Plan |
|---|---|---|
| Health | (1) Heat wave and UV |
|
| (2) Climate hazards |
| |
| (3) Infectious diseases |
| |
| (4) Air pollution and chemicals |
| |
| (5) Allergies (asthma, rhinitis, atopy) |
| |
| Disaster/infrastructure | (1) Disaster prevention system |
|
| (2) Infrastructure for disaster prevention |
| |
| (3) Infrastructure for society |
| |
| Agriculture | (1) Climate-friendly agriculture and animal husbandry |
|
| (2) Preventing damages |
| |
| Forest | (1) Improving resilience and function of forests |
|
| (2) Increasing forest productivity |
| |
| (3) Preventing forest damage |
| |
| Ocean/fisheries | (1) Plans for coastal areas |
|
| (2) Increasing productivity of fisheries |
| |
| (3) Preventing damage to fisheries |
| |
| Water management | (1) Impact and vulnerability assessment |
|
| (2) Flood and drought prevention |
| |
| (3) Management of water quality and aquatic ecosystems |
| |
| Ecosystem | (1) Monitoring and vulnerability assessment |
|
| (2) Adaptation plan |
| |
| Climate change monitoring/projection | (1) Monitoring climate change |
|
| (2) Producing projection data |
| |
| (3) Korea-specific projection model |
| |
| (4) Application system of projection/monitoring data |
| |
| Adaptation industry/energy | (1) Impact and vulnerability assessment |
|
| (2) Risk management and taking advantage of opportunities |
| |
| Education/promotion/international cooperation | (1) Education and promotion |
|
| (2) International cooperation |
|
Table 4.
Specific climate adaptation plans of six Korean cities, ranked by number of programs and allocated budget.
Table 4.
Specific climate adaptation plans of six Korean cities, ranked by number of programs and allocated budget.
| Category | Rank | Sector | Specific Plan | Program/Budget |
|---|---|---|---|---|
| Number of programs | 1 | Health | Reducing damage from heat waves and UV | 77 |
| 2 | Adaptation industry/energy | Developing and supporting new/promising industries | 44 | |
| 3 | Water management | Management of water quality | 37 | |
| 4 | Disaster/infrastructure | Early-warning and response system to disasters | 36 | |
| 5 | Disaster/infrastructure | Improvement of sewerage system | 32 | |
| Budget (billion KRW) | 1 | Disaster/infrastructure | Improvement of sewerage system | 2634 |
| 2 | Health | Reducing damage from heat waves and UV | 1721 | |
| 3 | Adaptation industry/energy | Developing and supporting new/promising industries | 1140 | |
| 4 | Water management | Developing alternative water sources | 1013 | |
| 5 | Water management | Management of water quality | 509 |
Table 5.
The five most costly specific plans for climate change adaptation in six Korean cities (2012–2016).
Table 5.
The five most costly specific plans for climate change adaptation in six Korean cities (2012–2016).
| Rank | Sector | Specific Plan | Expenditure (billion KRW) |
|---|---|---|---|
| 1 | Disaster/infrastructure | Improvement of sewerage system | 1514 |
| 2 | Disaster/infrastructure | Stable management and disaster prevention system of waste treatment facilities | 1042 |
| 3 | Health | Reducing damage from heat waves and UV | 1001 |
| 4 | Disaster/infrastructure | Disaster prevention programs for high-risk areas | 541 |
| 5 | Health | Reducing damage from air pollution | 32 |
Table 6.
Cities’ expenditure on climate change adaptation (2012–2016) that was not planned in their Implementation Plans for Climate Change Adaptation Strategy.
Table 6.
Cities’ expenditure on climate change adaptation (2012–2016) that was not planned in their Implementation Plans for Climate Change Adaptation Strategy.
| Seoul | Busan | Daegu | Daejeon | Incheon | Ulsan | |
|---|---|---|---|---|---|---|
| Unplanned expenditure (million KRW) | 377,055 | 222,297 | 98,786 | 71,110 | 659,354 | 42,544 |
| Unplanned expenditure (% of total adaptation expenditure) | 10.5 | 18.4 | 14.6 | 13.0 | 60.8 | 4.9 |
Table 7.
Unspent climate change adaptation budget (2012–2016) allocated in the Implementation Plans for Climate Change Adaptation Strategy of six Korean cities.
Table 7.
Unspent climate change adaptation budget (2012–2016) allocated in the Implementation Plans for Climate Change Adaptation Strategy of six Korean cities.
| Seoul | Busan | Daegu | Daejeon | Incheon | Ulsan | |
|---|---|---|---|---|---|---|
| Unspent budget (million KRW) | 3938 | 64,754 | 33,299 | 12,502 | 158,914 | 69,589 |
| Unspent budget (% of total adaptation budget) | 0.1 | 3.7 | 1.7 | 1.4 | 30.4 | 4.4 |
© 2018 by the authors. Licensee MDPI, Basel, Switzerland. This article is an open access article distributed under the terms and conditions of the Creative Commons Attribution (CC BY) license (http://creativecommons.org/licenses/by/4.0/).
Share and Cite
MDPI and ACS Style
Lee, J.-S.; Kim, J.W. Assessing Strategies for Urban Climate Change Adaptation: The Case of Six Metropolitan Cities in South Korea. Sustainability 2018, 10, 2065. https://doi.org/10.3390/su10062065
AMA Style
Lee J-S, Kim JW. Assessing Strategies for Urban Climate Change Adaptation: The Case of Six Metropolitan Cities in South Korea. Sustainability. 2018; 10(6):2065. https://doi.org/10.3390/su10062065
Chicago/Turabian StyleLee, Jae-Seung, and Jeong Won Kim. 2018. "Assessing Strategies for Urban Climate Change Adaptation: The Case of Six Metropolitan Cities in South Korea" Sustainability 10, no. 6: 2065. https://doi.org/10.3390/su10062065
Note that from the first issue of 2016, this journal uses article numbers instead of page numbers. See further details here.