Article

Analysis, Evaluation and Optimization Strategy of China Thermal Power Enterprises’ Business Performance Considering Environmental Costs under the Background of Carbon Trading

1
School of Economics and Management, North China Electric Power University, Changping, Beijing 102206, China
2
Beijing Key Laboratory of New Energy and Low-Carbon Development, North China Electric Power University, Changping, Beijing 102206, China
*
Authors to whom correspondence should be addressed.
Sustainability 2018, 10(6), 2006; https://doi.org/10.3390/su10062006
Submission received: 17 May 2018 / Revised: 8 June 2018 / Accepted: 10 June 2018 / Published: 14 June 2018

Abstract

:
With the development of China’s energy structure adjustment and energy conservation and emission reduction, China’s carbon trading market has been fully launched. As an important participant in the carbon trading market, thermal power enterprises that play a major role in China’s power supply structure may bear huge environmental cost pressures, including carbon transaction costs. Under such a circumstance, thermal power enterprises urgently need to ensure operating performance through environmental cost management. This article takes the thermal performance of Chinese thermal power companies under the background of carbon trading as the study object, designs a measurement method for the environmental costs of thermal power companies, and analyzes the influence mechanism of the environmental cost based on the principle of system dynamics. Relying on the correlation analysis between environmental costs and business performance of thermal power companies, the company’s business performance is evaluated by data envelopment analysis (DEA) efficiency. After reaching the study conclusion, the article proposes an optimization strategy for thermal enterprises to manage and control their environmental cost and business performance. This paper closely integrates the actual background of carbon trading, including carbon transaction costs into environmental costs, and conducts an econometric analysis. It constructs a composite measurement of environmental costs that accounts for carbon transaction costs and conducts performance evaluations of power generation companies based on factors such as environmental costs, which all has a certain degree of innovation.

1. Introduction

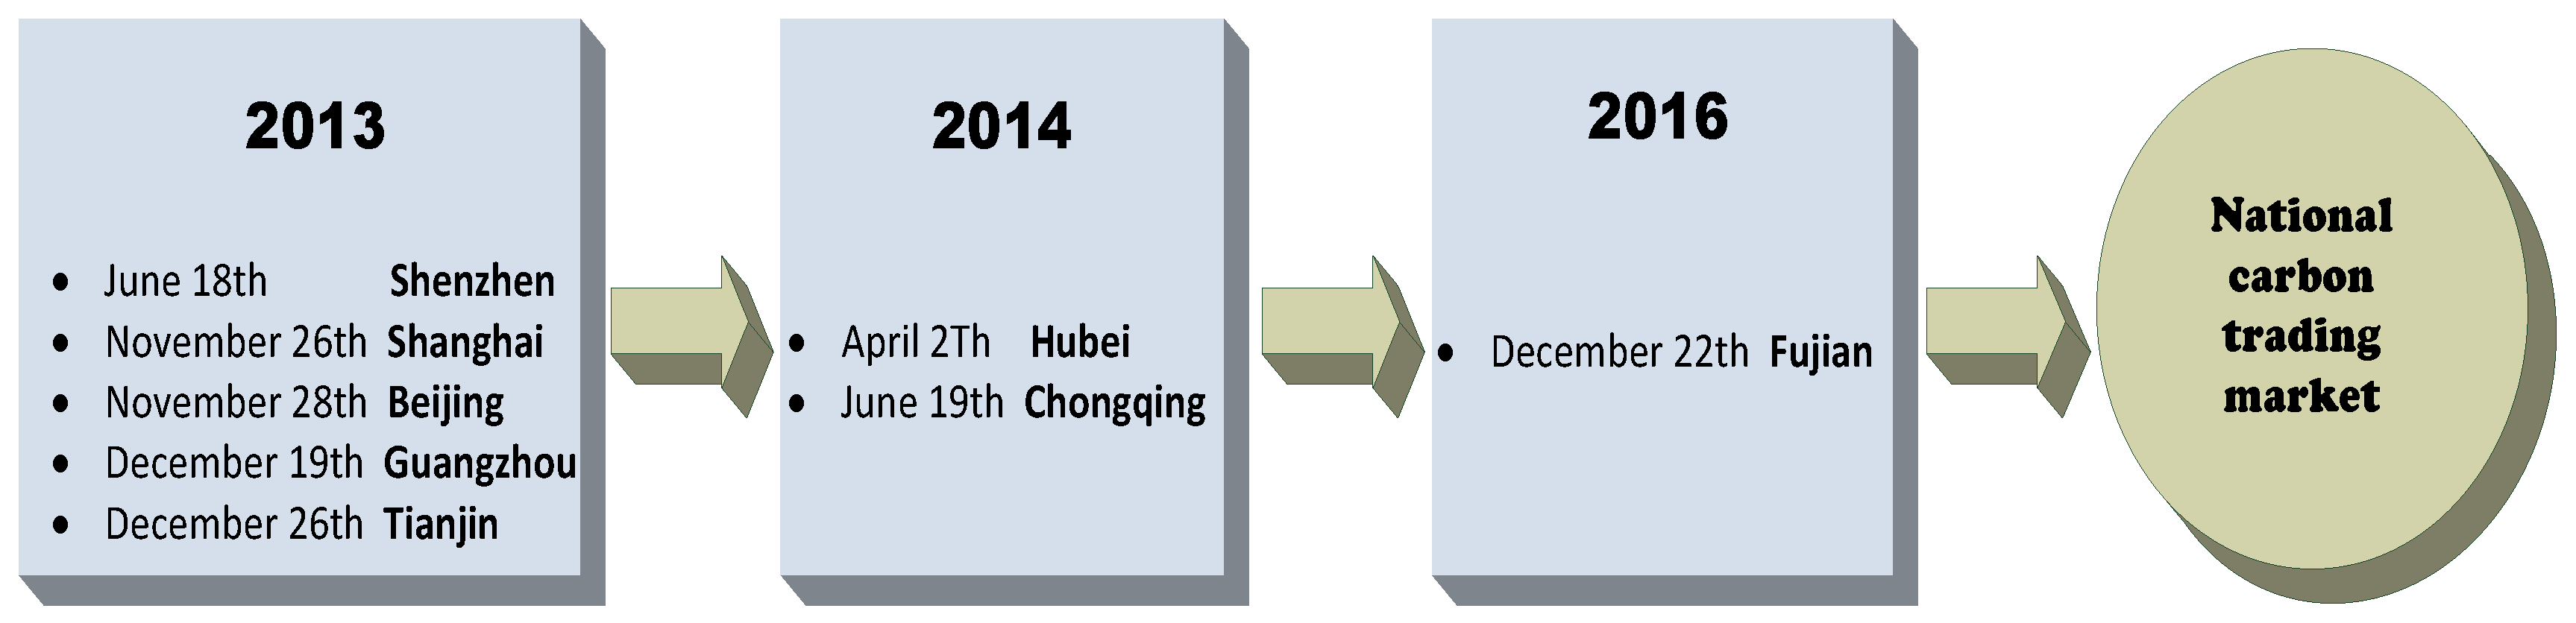
Energy structure adjustment, the development of energy conservation, and emission reduction have all become an important part of sustainable development strategy in China. In order to achieve effective control of total carbon emissions and guide enterprises to actively participate in emission reduction work, China’s carbon trading market has developed rapidly. Since October 2011, China has successively established trials of carbon emissions trading in seven provinces and cities, including Shenzhen and Shanghai, as shown in Figure 1. The carbon emissions trading system officially opened in December 2017 in the country. As of the end of October 2017, a total of 13.325 million tons of quota transactions had been completed, and the cumulative carbon trading volume exceeded 2.7 billion yuan. China has become the second largest carbon market in the world [1].
Thermal power enterprises are one of the main targets of carbon emission control in China, and they are also important participants in the carbon trading market [2]. According to the “National Carbon Emissions Trading Market Construction Plan (Power Generation Industry)” issued by the National Development and Reform Commission in December 2017, the power generation industry is the leading pilot industry for the development of the national carbon trading market. As a result, the participation of coal-fired power companies in carbon trading which occupies up to 64.04% in the power structure has great potential for development. As shown in Figure 2, the total amount of carbon emissions from thermal power generation in the country from 2010 to 2016 was more than 3 billion tons, accounting for more than 20% of the country’s total carbon emissions [3,4,5]. Carbon quota trading will be a significant means for thermal power enterprises to control carbon emissions actively in the future.
Under the development requirements of carbon emission reduction control, thermal power enterprises urgently need to improve their business performance through environmental cost management. Some studies have found that between 2003 and 2011, the proportion of eco-environmental costs in developing countries to GDP was approximately 20.79% to 23.02%, and that of developed countries was only 3.99% to 4.22%. So the issue of environmental costs has become a considerable constraint factor for the development of high-energy-consuming enterprises. The national emission reduction control intensity has been gradually strengthened, and the pressure on enterprises to reduce emissions continues to increase. It is of utmost importance for thermal power enterprises to manage business performance considering the environmental costs, including their operating results, development potential, and business management level. Therefore, under the market environment where carbon trading is actively developing, the design of environmental cost composite measurement indicators, and then the analysis of operating performance considering environmental costs, can provide important support for corporate strategy formulation and sustainable development [6]. At the same time, in-depth analysis of the relationship between environmental costs and business performance, mining business efficiency, data envelopment analysis (DEA) efficiency considering environmental costs and putting forward business performance optimization strategies, can provide theoretical and methodological references for thermal power companies to better adapt to the development of the carbon trading market and to support corporate environmental cost management and business performance optimization.

2. Literature Review

In recent years, the issue of environmental costs has received widespread attention. The United States Environmental Protection Agency (USEPA) formally proposed the concept of environmental costs in 1995 and divided it into four categories: traditional costs, potential costs, contingent costs, and relationship and image costs. In terms of environmental cost accounting, management, and disclosure, Takanobu Kosugi combined a life cycle impact assessment model, an optimal economic growth model, and a comprehensive assessment model to conduct an econometric analysis of corporate costs. Chou designed and developed the evaluation system of carbon emissions and the special calculation method of environmental cost in the construction industry [7]. More and more scholars have made different statements on the significance and quantitative relationship of environmental cost to firm performance. After investigation, Mokhtar et al. found that Malaysian listed companies have incorporated environmental information into performance measurement, control and report [8]. Haggard and other scholars point out that, voluntary disclosure of environmental accounting information by enterprises enhances the transparency of enterprises, and effectively reduces the cost of obtaining environmental accounting information for investors, which is very beneficial for reducing the volatility of stock prices and maintaining the stability of the market value of the company [9]. With transfer costs, competition intensity, interaction theory and the interactive perspective, Taiwen and other scholars found that financial performance is positively related to the environmental management system, and found that the in-depth study of environmental costs and the construction of a good environmental management system have positive significance for business performance [10]. Ramos-Real et al. used data envelopment analysis to evaluate the business performance of 18 power companies in Brazil from 1998 to 2005 [11].
After 2002, with global warming and the signing of the Kyoto Protocol, the situation of carbon trading and carbon information disclosure in enterprises gradually attracted the attention of researchers in accounting circles. Larrinaga and Bebbington think that controlling carbon emissions is an important part of enterprise environmental management. Therefore, enterprises need to disclose carbon information [12]. Schaltegger suggests that in the context of a low-carbon economy, new management methods and models are needed to predict and meet new carbon information needs [13]. Brawn et al. believe that companies should recognize the carbon emission obtained free of charge from the government as intangible assets at the market price at the time of acquisition, followed by amortization, and the book value of carbon emission rights should be adjusted at the end of the period according to the market price of the carbon emission rights. When sold, the difference between income and book value of carbon emission rights should be recognized as liabilities [14].
With the development of a low-carbon economy, the problem of carbon emission control in thermal power enterprises is becoming more and more prominent. Zhai, H. adopts a power plant modelling tool to reduce the unit CO2 emission rate by 30% through the carbon capture, utilization, and storage (CCUS) modification of the existing US coal-fired generating units (EGUs). [15]. Cristóbal, J. used a mixed integer nonlinear programming (MINLP) model to optimize the power production of coal-fired power plants with carbon management [16]. Having studied, SQ, Jiang found that coal-fired power plants installed in China between 1993 and 2013 will lead to 106 Gt of carbon dioxide emissions during their average lifetime, more than three times the global carbon dioxide emissions from fossil fuels in 2010 [17]. Wang, J. analyzed the impact of coal-fired power generation on the environment in China by using the life-cycle assessment (LCA) method, and the cost of resource consumption and external environmental cost of coal-fired power generation was further calculated by using the related cost theory [18]. Du, L. found that Chinese coal-fired power plants have great opportunities to reduce carbon dioxide emissions, and older and larger power plants have lower environmental efficiency and marginal carbon dioxide emission reduction costs [19]. In the aspect of business performance research in Thermal Power Enterprises, a new two-stage network DEA model was proposed by Bi, G.B. to evaluate the performance of coal-fired power generation in China by improving the link constraints which is different from the traditional network DEA method [20]. To evaluate the performance and output level of coal-fired power plants in the United States, Färe, R. constructed the environmental performance index (EPI) [21].
In summary, the academic community has carried out certain exploration research on the environment cost, enterprise carbon trading, and carbon emission, and has also carried out certain analysis on thermal power enterprise carbon emission reduction and management performance. However, under the development of the carbon trading market, the research on relationship analysis and evaluation of environmental cost and operating performance of thermal power enterprises is relatively lacking, and the measurement research of the environmental cost index is limited to the quantitative index and index design and measurement of environmental cost quality need to be deeply studied. Therefore, this paper selects thermal power generation enterprises as the research object, carries out measurement analysis on its environmental cost from the quality and the quantity aspect, modeling studies on the correlation between the environmental cost and management performance, scientifically assessing the level of business performance considering environmental costs, and then puts forward the optimization of management and the control strategy to enhance the sustainable development ability of thermal power enterprises under the background of carbon trading, which has a certain theoretical research value.

3. Methodology

This article takes the business performance of Chinese thermal power enterprises in the context of carbon trading as the research object. Relying on the research on the correlation between the environmental costs and business performance of thermal power enterprises, the efficiency of business performance was evaluated. Based on this, this paper proposes an optimization strategy for thermal power companies’ environmental cost management and business performance improvement. The method frame for this article is shown in Figure 3.

3.1. System Dynamics Model

System dynamics was first proposed by Prof. Forrester of the Massachusetts Institute of Technology in 1956. It was introduced to China in the late 1970s and achieved success in many fields such as energy management and industrial research. It is based on the idea that every system must have structure and system structure determines system function. According to the internal and external causal feedback features of the internal components of the system, the root cause of the problem is looked for from the internal structure of the system. It is believed that there are causal links between the numerous variables within the system in their interacting feedback loops. The systematic interconnection between feedbacks constitutes the structure of the system, and it is this structure that becomes the fundamental determinant of system behavior.
The influence relationship between the causes and results of the system elements can be described by connecting the arrows and lines of the causal elements, which is called causality. When both the cause and the outcome move in the same direction, this relationship is called the positive causal relationship, and is represented by “+”. Then on the contrary, it is called negative causal relationship. When multiple causal chains are connected end to end, they form a causal feedback loop. As shown in Figure 4, the causal feedback loop can be divided into positive feedback and negative feedback. The causal circuit diagram (CLD) composed of multiple feedback loops can clearly show the complex causal relationship between multiple variables, and extract the key elements that affect the structure of the system. It simplifies the problem of high order, nonlinear, multiple feedback complex time-varying systems.

3.2. Multiple Linear Regression Analysis

In regression analysis, if there are two or more independent variables, it is called multiple regression. In fact, a phenomenon is often associated with multiple factors, and predicting or estimating the dependent variable in combination with the optimal combination of multiple independent variables is more effective than predicting or estimating with only one independent variable. The multivariate linear regression model is a mathematical statistics method that studies the relationship between the independent variable and the dependent variable. Based on the correlations between the collected data, the mathematical model is used to establish the model that reflects the correlation and the regression is obtained. The coefficient can reflect the degree of importance of the corresponding independent variable. Given the linear correlation between the dependent variable Y and the K explanatory variables X1, X2, …, Xk, the basic form of the multiple linear regression model is as follows:
Y = α + β0 + β1X1 + β2X2 + … + βKXK + Ɛ
where α is the drift term, β is the regression coefficient, and Ɛ is the stochastic error.

3.3. Data Envelopment Analysis Model

Data Envelopment Analysis (DEA) is an efficiency evaluation method based on the relative efficiency concept proposed by A. Charnes and W.W. Coopor in 1978. By maintaining the input or output of the decision making unit (DMU) unchanged, the method uses mathematical planning ideas and statistical data to determine relatively effective production frontiers, and projects each decision making unit onto the production frontier of the DEA. By comparing the degree of deviation of the decision making unit from the frontier surface of DEA, their relative effectiveness is evaluated.
As it does not need estimating parameters when studying the multi-input, multi-output production function theory, it shows greater advantages in avoiding the subjective factors’ impact on the results, simplifying the algorithm, and reducing errors, and has been widely used in efficiency evaluation of energy, in economics, and in other areas [22,23]. The most widely used DEA model is the C2R model and the BC2 model. The C2R model is based on the assumption of constant returns to scale for the measurement of technical efficiency. The BC2 model believes that the return to scale is variable. This is taken into account, and the overall efficiency of the decision-making unit is decomposed into pure technical efficiency and scale efficiency.

3.3.1. Charnes–Cooper–Rhodes Model (CCR)

Assume that there are n power enterprises, called n decision making units (DMUs). There are m inputs and s outputs in each decision making unit, which are represented by different economic indicators. Where Xij is the total input of the j_(th) decision unit to the i_(th) type of input, Xij > 0; Yrj is the total output of the j_(th) decision unit for the r_(th) type of output, Yrj > 0. v = (v1, v2, …, vm)T = (v1, v2, …, vm)T is the weight coefficient that represents the input metric. u = (u1, u2, …, um) is the weight coefficient that represents the output metric. Then each decision unit DMUj has a corresponding efficiency evaluation index hj:
h j = u T y i v T x j = r = 1 s u r y r j i = 1 m n v i x i j
Appropriate weighting factors v and u can make hj ≤ 1, j = 1, …, n.
If the efficiency index h of the j_(th) decision making unit is the target and the efficiency index of all decision units is the constraint, the CCR model can be expressed as follows:
{ m a x h j 0 = r = 1 s u r y r j 0 i = 1 m v i x i j 0 s . t . r = 1 s u r y r j i = 1 m v i x i j 1 , j = 1 , 2 , , n u 0 , v 0

3.3.2. Banker–Charnes–Cooper Model (BCC)

min [ θ ε ( e ^ T S + e T S + ) ]
s . t . { j = 1 n x j λ j + S = θ x 0 j = 1 n y j λ j + S + = y 0 λ j 0 , j = 1 , , n S 0 , S + 0
where e ^ T = ( 1 , 1 , , 1 ) R m , e T = ( 1 , 1 , , 1 ) R s .
Set the optimal solution of BCC model as λ 0 , S 0 , S 0 + , θ0, then θ0 = 1, and S0− = 0, S0+ = 0, then the decision making model is DEA efficiency, which means hj = 1.

4. Analysis of the Influence Mechanism of the Environmental Cost of Thermal Power Enterprises Based on the System Dynamics Model

4.1. Environmental Cost Measurement Analysis of Thermal Power Generation Enterprises

This paper believes that corporate environmental costs include pollution charges and carbon transaction costs as the two main parts. The pollution charges are the costs incurred by thermal power companies to control the emissions of pollutants (sulfur dioxide, nitrogen oxides, power fumes, and sewage, etc.) during the production cycle of power products and subsequent treatment. Also the carbon transaction cost is the purchase cost paid when the carbon dioxide emission quota is insufficient under the carbon trading market operating mechanism. The formation mechanism is shown in Figure 5.

4.1.1. Pollution Cost (C1)

C 1 = i = 1 n F i
where Fi is the corresponding sewage fee paid for the discharge of the i_(th) pollutant.
According to the Regulations of the State Council on the Administration of the Collection and Use of Wastewater Discharge Charges, this paper mainly considers the cost of sewage generated by three kinds of waste gas as sulfur dioxide, nitrogen oxides, and electric power dust, as well as sewage. The pollutant discharge fee standard is measured in terms of pollutant equivalents, that is:
F i = λ α E i
where λ is the regional fee adjustment factor and α is the pollutant charge standard (yuan/equivalent). The regional fee adjustment coefficient is 0.8 in underdeveloped regions, 1 in general regions, and 1.2 in developed regions. This paper assigns value to λ according to the power generation and production location. According to the National Development and Reform Commission’s “Notice on Relevant Issues Concerning the Adjustment of Levy Charge Standards”, the λ value of sulfur dioxide, nitrogen oxides, and soot is 1.2 yuan/equivalent, and the λ value of waste water is 1.4 yuan/equivalent. Ei is the annual emission equivalent of the i_(th) pollutant, and its formula is:
E i = a i X i
Xi is the equivalent value of the i_(th) pollutant (kg/equivalent), and the equivalent values of various types of pollutants are shown in Table 1.
ai is the annual discharge (kg) of the ith pollutant, which is calculated as follows:
a i = K n P i
Among them, Kn is the thermal power generation (kWh) of the power generation company in the n_(th) year, and the data comes from the annual report of the company or the disclosure of the completion status of the company. If the company’s annual report does not disclose the annual power generation of the company, then the company’s online power is used instead. Pi is the company’s pollutant discharge performance (g/kWh) for that year, and the data is taken from publicly released reports such as the company’s annual report or social responsibility report. If there is no separate disclosure, the average performance of pollutant emissions from the power industry in each year is used, as shown in Table 2.

4.1.2. Carbon Transaction Cost (C2)

C 2 = p Q c
where p is the average unit price of carbon dioxide emissions trading (yuan/ton). This paper selects the average transaction price of the carbon trading market in each year of Beijing and other seven pilots as p-value. Qc is the purchase amount of CO2 emission rights. At present, the historical emission method or the baseline method is commonly used in the international community to calculate the annual free carbon emission quotas of enterprises [24,25]. The baseline method requires more internal undisclosed data of thermal power plants [26,27]. Therefore, the paper used the historical emission method to estimate the carbon emission allowances for thermal power enterprises based on their annual increase in carbon dioxide emissions. The formula is as follows:
Q C = T n T n 1
Tn is the carbon dioxide emission of the thermal power company in the nth year. The formula is as follows:
T n = K n f n
Among them, Kn is the thermal power generation (kWh) of the company in the n_(th) year, and f n is the average CO2 emission factor of the thermal power company in the n_(th) year (g/kWh). If the public information does not disclose the CO2 emission performance of the company in the current year, the average CO2 emission per unit of thermal power generation is used as the basis for calculation, as shown in Table 3.
In order to reflect the level of environmental cost better, in addition to the above-mentioned measurement of the amount of environmental costs, the paper also designed a measurement method for the quality of the environment costs, and built an environmental cost quality disclosure index evaluation system.

4.2. Analysis of the Environmental Cost Influence Mechanism of Thermal Power Enterprises under Carbon Trading

The environmental cost of thermal power enterprises is affected by many factors, such as economy, environment, and population etc., including energy structure, government policy mechanism etc. They constitute a complex system of influence structures. Therefore, this paper uses the idea of system dynamics to analyze the influencing factors and the mechanism of environmental cost of enterprises. According to the interaction between environmental cost and other influencing factors, synthesizing the interaction mechanism of each element, it constructs the causality diagram of environmental cost of power generation enterprise, as shown in Figure 6.
There are several feedback loops in the causality circuit diagram. Based on the analysis of causality diagram of system dynamics, this paper takes a main equilibrium loop as an example to illustrate how environmental costs impact on power generation enterprises:
Fossil energy generation →(+)Fossil energy consumption →(+)Pollutant discharge →(+)Pollutant disposal →(+)Environmental costs of thermal power company →(+)Total cost of thermal power companies →(−)Thermal power company net income →(−)GDP →(+)Energy saving and environmental protection policy →(−)Fossil energy installation ratio →(−)Fossil energy generation
Fossil energy power generation leads to the increase of fossil energy consumption and the emission of a large number of pollutants, which increases the costs associated with the disposal of pollutants, and increases the environmental cost of fossil fuel power generation enterprises, which increases the total cost of power generation [28,29]. It reduces the total net income of fossil-fuel power plants, which could have the consequence of falling GDP, which has led the government to pursue tougher energy conservation policies and reduce the share of fossil energy plants installed and reduce fossil power generation to promote sustainable economic development.
Based on the above analysis of causality circuit diagram, economic development, government policy and environmental quality will all have direct or indirect effects on the environmental cost of power generation enterprises. The analysis of the environmental cost of different types of power generation enterprises should consider many factors. At the same time, under the background of the current carbon transaction, the carbon transaction will lead to a direct rise in the environmental cost of fossil energy power generation enterprises and an obvious decrease of net income. At the same time, the renewable energy power generation enterprises can bring more development opportunities to the renewable energy generation by means of environmental cost advantage.

5. Analysis of the Correlation between Environmental Costs and Business Performance of Thermal Power Enterprises

5.1. Index Design and Correlation Analysis Model Construction

Business performance is a very broad concept. It refers to the contribution made by the company’s strategy and its implementation and execution to the final business performance of the company within a certain period. It shows the strength of the company in terms of asset profitability, operations, debt repayment, anti-risk, and growth, and it is an important part of the company’s overall strength. In the context of a low-carbon economy and sustainable development, according to previous research results and the characteristics of production and operation of thermal power companies, this paper defines the thermal power company’s operating performance as follows. In a certain period of time, thermal power companies fully and rationally use their various resources for production, which is based on the principle of maximizing corporate value and shareholder value, and through the provision of low-carbon, green, stable, high-quality power products, demonstrate the operating results, development potential and management level. The level of operating profit and the growth of operating income can more intuitively reflect the business performance of the company.
Thermal power enterprises are asset-intensive enterprises, their own profitability and growth ability is the focus of business performance. Therefore this paper chooses Rate of Return on Common Stockholders’ Equity (ROE) as the index to measure the profitability of power generation enterprises and chooses Increasing Rate of Sales Income (ORIR) as the index to measure the growth ability of power generation enterprises. In order to measure the environmental cost level of thermal power enterprises in an all-round way, two indexes of quantity and quality are set up in this paper, that is, the environmental cost is evaluated by using the Environmental Cost Index (EC) and the Environmental Cost Disclosure Quality Index (ECQ) is used to measure the quality of environmental cost information disclosure. In addition, this paper introduces Asset-liability Ratio (DEBT), Total Assets Turnover (ATAR), Firm Size (SIZE), and Firm Age (AGE), taking them as control variables, because they are considered to be more important influencing factors of business performance. The model variables are summarized in Table 4 below.
The indicators are calculated as follows.

5.1.1. Environmental Cost Numerical Index (EC)

E C = C 1 + C 2 O C × 100 % , where C1 is the cost for pollution discharge and C2 is the purchase cost of the carbon dioxide emission quota. The two calculation methods were explained in the previous article, and OC is the total operating cost of the enterprise.

5.1.2. Environmental Cost Disclosure Quality Index (ECQ)

In order to obtain the Environmental Cost Disclosure Quality Index (ECQ), this paper designs an evaluation system of environmental cost disclosure quality index, which is analyzed from two aspects: Disclosure method aspect and disclosure content aspect. As is shown in Table 5, the system consists of 13 sub-items. With regard to the method, environmental costs are disclosed, a score of 0 for non-disclosure of environmental cost information in any public report; a score of 1 for disclosure of environmental cost related information only in enterprise annual reports; and a score of 2 for disclosure of environmental cost related information in social responsibility report or sustainable development report in addition to its annual report. With regard to the content, environmental costs are disclosed, score for disclosure of environmental costs if no information is disclosed publicly is 0; score for the project only carried on the text description is 1; score for the project carried on the text and digital disclosure is 2; score for the project fully disclosed and share the list description is 3. For the convenience of statistics, we multiply the obtained quality evaluation score by 100/38 to convert the total score from 38 to 100.

5.1.3. Rate of Return on Common Stockholders’ Equity (ROE)

ROE = Profit after tax/average net assets

5.1.4. Increasing Rate of Sales Income (ORIR)

ORIR = Sales growth/total prior year sales × 100%

5.1.5. Asset-Liability Ratio (DEBT)

DEBT = Total liabilities at end/total assets at end × 100%

5.1.6. Total Assets Turnover (ATAR)

ATAR = Net operating income/average total assets

5.1.7. Firm Size (SIZE)

SIZE = Ln(Total assets of enterprises)

5.1.8. Firm Age (AGE)

AGE = Enterprise listing year − Reporting year + 1.
To sum up, this paper constructs the following two empirical analysis models:
The relationship between environmental cost and ROE of thermal power enterprises (A) is as follows:
ROE = α + β1EC + β2ECQ + β3DEBT + β4ATAR + β5SIZE + β6AGE + Ɛ
The relationship between environmental cost and ORIR of thermal power enterprises (B) is as follows:
ORIR = α + β1EC + β2ECQ + β3DEBT + β4ATAR + β5SIZE + β6AGE + Ɛ
where α is model intercept term, β is the regression coefficient of the model, Ɛ is the stochastic error.

5.2. Sample Selection

This paper selects listed companies of A share power of thermal power generation listed in the power plate of Sina Finance, excluding *ST enterprises and those whose data are incomplete or abnormal in the reporting period; because carbon trading officially opened the pilot project in 2013, considering there is a certain time lag of its influence on the actual production and operation of power generation enterprises, we finally selected the effective sample values from 2014–2016 of 36 listed thermal power companies, as Datang Co., Ltd. (601991), Huadian Power International Co., Ltd. (600027), with a total sample capacity of 108. The imperfection disclosure mechanism of environmental cost information in thermal power enterprises leads to incomplete cost information and scattered distribution. Therefore, in addition to the annual report, this paper also carries out artificial data collection and statistical analysis on the enterprise social responsibility report, the sustainable development report, the electricity generation completion announcement etc. Social responsibility reports and sustainable development reports are from the data center of Eastmoney.com. Financial data are from the Reese Database (RESSRT) and CCER Database.

5.3. Research Hypothesis

Thermal power companies, like other companies, are economic organizations that seek to maximize profits. Only by reducing its own production and operating costs can there be more room for profit. Therefore, in line with the principle of cost-effectiveness, companies are committed to continuously reducing costs to increase revenue. Its own technological process and production and operation characteristics have determined that thermal power companies are facing enormous environmental pressure. In order to reduce the impact on the environment, thermal power companies need to pay higher environmental costs throughout their entire life cycle. Under the background of the near-completion of the carbon trading market, the purchase expenditures for CO2 emission right quotas will also be gradually included in the environmental costs that thermal power plants need to pay and lead to the direct outflow of money, which may further reduce corporate profits. However, environmental costs do not only lead to the direct outflow of economic benefits. The environmental prevention costs that companies actively pay for, such as the R&D of clean power generation technologies and the construction of environmental protection facilities, may increase the power generation efficiency of enterprises and reduce the emission levels of pollutants, which will have a positive and positive impact on business performance in the future. At the same time, the relatively high cost of post-environment compensation paid by the company may stimulate the company to strengthen its energy-saving transformation work, strengthen management, improve the company’s operating efficiency, and actively carry out development and transformation, thus ultimately promoting improvement of the company’s operating performance. Darnall N. et al. analyzed the samples from more than 100 listed companies in different industries and found that there was a significant positive correlation between environmental costs and business performance [30]. Based on the above analysis, this paper proposes Hypothesis 1:
Hypothesis 1 (H1).
There is a positive correlation between environmental cost and business performance.
Business performance is the embodiment of the company’s operating results over a period of time and the management of the business operators. It can be evaluated in terms of profitability, dividends, and development capabilities. Therefore, for thermal power companies, Han F. et al. believe that profitability and growth ability are key factors in evaluating their operating performance [31]. Based on Hypothesis 1, this article proposes the following two sub-hypotheses:
Hypothesis 1.1 (H1.1).
The environmental cost of the enterprise is positively related to the profitability of the enterprise.
Hypothesis 1.2 (H1.2).
The environmental cost of the enterprise is positively related to the development ability of the enterprise.
The Environmental Cost Quantity Index and Environmental Cost Disclosure Quality Index are two aspects of the composite measurement of environmental costs. They show the relationship between environmental costs and business performance indicators from two dimensions. The environmental cost disclosure refers to the enterprise’s disclosure of corporate information such as corporate annual reports, social responsibility reports, and sustainable development reports: the process of revealing the outflow of economic benefits generated. Thermal power companies need to pay high costs every year for the environment. Also, because environmental cost information is scattered and difficult to gather, disclosure of environmental cost information also requires a certain cost. Given the established level of income, the increased cost of the disclosure of environmental cost information will lead to a decline in the profitability of the company. However, based on the concept of social responsibility, corporate disclosure of environmental cost information is a manifestation of the active implementation of social responsibility. The quality of the disclosure of the company’s environmental cost information will help improve the corporate reputation. On the other hand, the disclosure of environmental cost information also urges high-emission and high-pollution power generation enterprises to accelerate the pace of energy conservation and emission reduction, and actively innovate to promote the development of enterprises. In summary, this article proposes Hypothesis 2:
Hypothesis 2 (H2).
There is a positive correlation between the quality of environmental cost disclosure and business performance.
Based on profitability and growth ability which are the key factors for evaluating the performance of power generation companies, this paper puts forward two sub-hypotheses based on Hypothesis 2:
Hypothesis 2.1 (H2.1).
There is a positive correlation between the quality of Environmental Cost Disclosure and the profitability of Enterprises.
Hypothesis 2.2 (H2.2).
There is a positive correlation between the quality of Environmental Cost Disclosure and Enterprise Development ability.

5.4. Empirical Calculation and Conclusion Analysis

5.4.1. Descriptive Statistics

The descriptive statistics of selected samples are shown in Table 6. The level of operating performance and environmental cost of thermal power enterprises is uneven and the difference is obvious. The enterprise environmental cost quantity index is generally small; the maximum value is only 2.24%. The difference in the environmental cost disclosure quality index is significant, which indicates that the environmental cost disclosure of enterprises is not standardized and not unified. According to the operating performance, the difference of ORIR data is obvious, and the sales income of power generation enterprises is declining. The ROE gap of different enterprises is also large, but it still shows a positive growth trend from the average point of view. From the point of view of control variables, the value of asset-liability ratio of different enterprises fluctuates greatly, and the asset size is large, but the gap is small. The largest age difference between enterprises reached 22, indicating that there are emerging enterprises which keep on joining the power industry.

5.4.2. Correlation Analysis and Regression Test

According to the above hypothesis, we first choose Rate of Return on Common Stockholders’ Equity (ROE) as dependent variables to carry out regression analysis. The results are shown in Table 7. The test value of model (A) F is 3.074, passed the significance test. The DW test is 1.830, which indicates that there is no sequence auto-correlation. Since the focus of this study is on the correlation between environmental costs and operating performance, close to 70% of the goodness of fit is considered acceptable. In summary, this paper holds that model (A) has a certain accuracy and can be used in empirical analysis. From the regression results of model (A), both EC and ECQ passed the significance test. There was a significant positive correlation between the Environmental Cost Numerical Index (EC) and the Rate of Return on Common Stockholders’ Equity (ROE), and the coefficient was 4.3. The rise of environmental cost as a proportion of operating cost will significantly stimulate firms to increase their ROE, so the assumption of H1a is verified. The Environmental Cost Disclosure Quality Index (ECQ) is also positively correlated with the Rate of Return on Common Stockholders’ Equity (ROE), with a coefficient of 0.481. This shows that the improvement of environmental information disclosure quality will promote the profitability of enterprises to a certain extent, so the assumption of H2.1 is verified.
This paper chooses Increasing Rate of Sales Income (ORIR) as the dependent variable, the result is shown in Table 8. The test value of model (B) F is 2.275, passing the significance test. The DW test is 2.077, which indicates that there is no sequence auto-correlation. Model (B) can be applied to empirical analysis. From the regression results, only EC and firm size (SIZE) passed the significance test. There was a significant positive correlation between the Environmental Cost Numerical Index (EC) and the Increasing Rate of Sales Income (ORIR), and the coefficient was 9.936. An increase in the proportion of environmental costs to operating costs will stimulate enterprises’ diversification and transformation and will have a positive effect on the growth of overall sales income of power generation enterprises, and promote the sustained growth of revenue, so the assumption H1b has been verified. Although the correlation coefficient between ECQ and ROE is positive, neither of these two variables has passed the significance test, which may be related to the low quality of environmental cost information disclosure in thermal power enterprises at present. Therefore, it is assumed that H2b cannot be verified from model (B) for the time being.
The conclusion of empirical analysis of model (A) and model (B) shows that Hypothesis 1.1, Hypothesis 1.2, and Hypothesis 2.1 are all verified, that is, environmental cost has a positive correlation with business performance, environmental cost information disclosure quality, and profitability.

5.4.3. Conclusion Analysis

Based on the empirical analysis of the correlation between environmental cost and business performance of thermal power enterprises, this paper draws the following conclusions:
There are significant differences in environmental costs among different power generation enterprises. From the aspect of Environmental Cost Numerical Index (EC), the environmental cost of the power generation enterprise with the thermal power plant accounts for a large proportion of the operating cost. Reducing the proportion of thermal power installed, and diversifying development helps power generation enterprises to reduce environmental costs. Judging from the ECQ, many enterprises do not consider environmental costs, such as greening costs, and the disclosure of carbon trading information is also relatively lacking.
There is a significant positive correlation between the level of environmental cost and business performance. (1) Environmental Cost Numerical Index is positively correlated with the business performance of power generation enterprises. The high environmental cost expenditure level of power generation enterprises stimulates enterprises to improve their technical level and management ability. It has a positive effect on the profitability and growth ability of power generation enterprises. (2) The Environmental Cost Disclosure Quality Index is positively correlated with the profitability of power generation enterprises. The higher the quality of environmental cost information disclosure, the stronger is the profit of power generation enterprises. In summary, this paper holds that environmental costs and business performance show a positive correlation.

6. Evaluation of Business Performance of Thermal Power Enterprises Considering Environmental Cost Input

6.1. Samples and Index Selected

In order to maintain the comparability and continuity of the study, the samples selected are the same as the previous ones. Since the 36 listed companies in the sample are all of the same type of enterprise, based on the requirements of the DEA model for decision-making units, this paper assumes that they are all decision-making units of the same type. In this paper, indicators such as environmental costs and solvency are the input index, and profitability and development capacity are the output index to input the DEA model, as shown in Table 9.

6.2. Analysis of Operational Performance Evaluation Based on the DEA Method

The data that has been normalized is imported into DEAP 2.1 software. The CCR model and BCC model in the DEA model are used to calculate the data, and the performance values of the comprehensive technical efficiency (crste) and pure technical efficiency (vrste) of the thermal power enterprise in the sample are obtained.

6.2.1. Efficiency Calculation Analysis

The comprehensive technical efficiency value indicates that the decision unit is in the state of optimal output value. If the decision unit is effective, the efficiency of the business management is high and the business performance is good. Judging from the performance of comprehensive efficiency values, a total of 14 out of 36 decision-making units have DEA efficiency, and the comprehensive technical efficiency value reaches 1. The proportion of units that did not achieve DEA efficiency was 61.11%. The average level of comprehensive efficiency is 0.83, indicating that the overall operating efficiency of the thermal power industry is still not high, and the level of input of environmental factors, such as environmental costs, is low, so there is room for improvement in the output level of enterprises. The average age of the companies that have DEA efficiency is 18 years old, which is less than the company whose comprehensive technical efficiency value does not reach 1. It shows that emerging thermal power companies are more efficient in their operations and management activities. At the same time, only the thermal power companies’ DEA is more effective than the diversified power generation companies, as shown in Figure 7, which indicates that the former ones’ operating efficiency is higher than that of the latter. According to the descriptive statistics of the input indicators, the environmental cost input and environmental cost disclosure quality of only-thermal power companies are both higher than those of diversified power generation companies. This indicates that the high environmental cost input and high-level environmental cost information disclosure are positively correlated with the company’s operating performance, which is in accordance with the results of the previous correlation analysis.
The state of purely technical efficiency represents the company’s production efficiency under the influence of management and technology. According to Figure 8, the pure technical efficiency value of the power generation company outperforms the comprehensive efficiency value. The average pure technical efficiency of the 36 decision-making units is 0.90, and the pure technical efficiency value of 16 decision-making units achieves 1. The purely technical efficiency values of most power generation companies are relatively close. This shows that the advanced technologies of thermal power companies such as clean power generation and electric dust removal have a relatively high level of utilization. The input of these technological production factors is effective and promotes the overall efficiency of the company. The pure technical efficiency value of only-thermal power generation enterprises is higher than that of diversified power generation enterprises, indicating that the former ones pay more attention to technology research and development and application. Therefore, diversified power generation companies need to make more efforts in the investment of advanced environmental protection equipment and the introduction of technical talents.

6.2.2. Efficiency Improved Analysis

In order to propose improvement measures for DEA inefficiency or weak DEA effective units, this paper uses projection analysis method to improve the input variable value and output variable value of the sample, which will help thermal power companies adjust their input and output volumes and achieve optimal operating performance. For a Thermal Power Enterprise whose overall efficiency value does not reach 1, it can be further improved based on the difference between the actual value and the target value so as to place it at the frontier of effective production. The direction and degree of improvement of the input–output variables of each decision-making unit are shown in Table 10. S x represents the average degree of relaxation of each input variable, a positive number represents insufficient input, and a negative number represents input redundancy. S y represents the average degree of slackness of each output variable, reflecting the output growth potential of each unit.
The degree of relaxation of indicators in the input indicator is not the same. After statistics on the frequency and mean value of the input indicators, as is shown in Table 11, it is found that X1 and X2, which are closely related to the environmental costs in the input indicators, account for a greater degree of relaxation and the highest frequency of occurrence. This shows that the lack of input is reflected in the unreasonable investment in environmental costs. The article analyzes two indicators related to environmental costs, and finds that the quality of information disclosure of environmental costs has a wide range of impact, but it has less need for improvement. Therefore, the thermal power industry as a whole needs to increase the investment in environmental costs and improve the quality of public disclosure of environmental cost information. Take Jingneng Power, whose environmental costs are most in need of improvement, as an example, although the sustainability report was disclosed, the report did not show environmental equipment investment, carbon trading, etc. The total number of pages for its sustainability report is less than one-third of the social responsibility report released by Datang Power Generation, a DEA efficiency company. Therefore, Jingneng Power still has a great deal of room for improvement in the quality of environmental cost information disclosure. At the same time, the increase in asset-liability ratio has also become the best way for many power generation companies to achieve optimal operating efficiency. From the point of view of the output system, y2 has more obvious growth potential than y1, which indicates that there is much room for excavation in the sales revenue of the power generation industry. Under the background of weak power growth, power generation companies still need to continue to deepen their progress in power sales, diversified business development, and so on, in order to promote optimal operating performance.
Through the above empirical analysis, the main conclusions are summarized as follows:
  • There is room for optimization of the overall operating efficiency of thermal power generation enterprises. The average level of comprehensive efficiency of 36 sample power generation enterprises was 0.83, and 22 companies did not achieve DEA efficiency. This shows that power companies have not reached maximum input and output, and the overall operating efficiency is not high. The overall efficiency and pure technical efficiency of only-thermal power enterprises are higher than that of diversified power generation enterprises, indicating that the input–output efficiency of other power supply types needs to be improved.
  • Environmental costs are positively related to corporate operating efficiency. Through descriptive statistics on the environmental cost level of DEA-effective companies and the disclosure quality of environmental costs, the paper finds that the average environmental cost level of DEA-effective companies and the disclosure quality of environmental costs are at a relatively high level. This is consistent with the empirical results of the previous correlation analysis.
  • Thermal power companies have many optimization directions for their operating efficiency. Judging from the analysis of the relaxation of input indicators, increasing the control of environmental costs, enhancing the disclosure of information on environmental costs, and appropriately increasing financial leverage can all help companies achieve optimal operating efficiency. From the perspective of the analysis of the slackness of output indicators, it is of great potential to expand the sales revenue of power generation companies. From the perspective of the company itself, thermal power companies can promote the continuous growth of sales revenue by expanding business scope and developing diversified businesses.

7. Optimization Strategy of the Environmental Cost and Business Performance of Thermal Power Enterprises under Carbon Trading

Based on the above research results, this paper proposes corresponding strategies for optimization of thermal power business performance from the three dimensions of development, including carbon trading, environmental cost management, and operation improvement, as shown in Figure 9.

7.1. Carbon Trading Development Strategy

7.1.1. Active Participation in Carbon Trading, Increasing Vitality in the Carbon Trading Market

The comprehensive development of carbon trading mechanism is an opportunity and a challenge for thermal power enterprises. Participation in carbon trading may increase the cost burden of thermal power enterprises with larger carbon emissions in the short term. However, the restraint mechanism of the carbon market has forced thermal power enterprises to vigorously implement carbon management, optimize their structure, improve their management level, and tap their own space for emission reduction. Therefore, in the long run, the carbon trading mechanism has a positive influence on the improvement of business performance. Under the background that the national carbon market has been fully opened, if the thermal power enterprises participate passively, carbon compliance will bind the development of the enterprises. However, if thermal power companies take advantage of this opportunity, actively participate in carbon trading, establish the overall strategic goal of carbon emission reduction in enterprises, establish a top-down statistical system of carbon data adapted to the market and make carbon management run through the daily integrated management of enterprises, enterprises will better adapt to the carbon trading market and occupy a favorable position in the carbon market, and then benefit from it, and effectively improve their own business performance.

7.1.2. Seeking the Optimal Carbon Emission Strategy in the Game of Reducing Production and Reducing Emissions

Under the carbon trading mechanism, thermal power, in order to control carbon dioxide emissions in order to reduce the additional cost of carbon trading, may choose to reduce overall electricity production to reduce carbon emissions, or to reduce carbon emissions per unit of electricity generation. The impact of these two options on business performance is uncertain. It is necessary for thermal power enterprises to study their own actual situation, consider economic benefits and operational efficiency, compare and analyze different carbon emission schemes, play the game between reduction of production and reduction of emissions, and derive the optimal carbon emission strategy which is helpful to improve the operating performance.

7.1.3. Corporate with Upstream and Downstream Enterprises in the Supply Chain to Carry out Emission Reduction Cooperation

Under the carbon trading mechanism, thermal power enterprises may consider working with upstream and downstream enterprises in the power supply chain, such as electricity sellers and energy-saving service companies, to achieve emission reduction cooperation. If power generators reduce emissions on their own, they need to bear the burden of capital, technology, time and other aspects of pressure and risk in view of the electricity industry’s cost. The benefits are greatly affected by the price of coal and electricity prices, the income is not stable, so it is not advisable for the power generation companies to bear the carbon emission reduction alone. When carbon emission reduction benefit is more objective, cooperative emission reduction can achieve a more objective carbon emission reduction effect with less cost and project cycle. If the node enterprises in the supply chain can abandon the inherent management mode of their own responsibility, building horizontal or vertical enterprise alliance, integrating internal and external resources, then they can achieve the optimal allocation of resources, improve efficiency, reduce costs and improve service quality, and achieve common development and benefit promotion.

7.2. Environmental Cost Management Strategy

7.2.1. Increase Investment in Environmental Cost Control, Conduct Technology Research and Development

First, for the discharge of pollutants, the power generation enterprises should increase the input of environmental protection facilities in the various links of production, such as the green transformation of equipment technology. Much of the equipment in thermal power enterprises has the problem of aging, where it is needed to continuously raise funds for modern intelligent transformation, reduce the coal combustion loss rate, reduce the discharge amount of waste gas and waste slag for the environment, and strive to realize clean production in the real sense, thus reducing the pollution abatement cost. Second, from the discharge of carbon dioxide, enterprises can energetically develop technologies to reduce unit coal consumption and reduce carbon emission levels. According to relevant studies, if thermal power plants can tap the potential of technical innovation and innovation, and maintain the best operating conditions under the same coal types, environment, operating conditions, etc., remove dirt and ash in time, and maintain the good heat exchange capacity of the condenser, etc. the average coal consumption per unit of power generation has great potential to decrease. In addition, by exploring carbon capture and sequestration technology, developing super critical technology and so on, the goal of reducing carbon emissions can be achieved, and then the cost of carbon trading reduced and the comprehensive income of enterprises enhanced.

7.2.2. Improve the Quality of Environmental Cost Information Disclosure

The previous study found that the higher the quality of the environmental cost information disclosure of the enterprise, the more obvious the promotion of business performance. Therefore, the thermal power enterprises should actively disclose environmental cost information including carbon emission information through the sustainable development report, social responsibility report, and other forms. Then the disclosure of information at least including the total amount of emissions, the strengths, future control goals, efforts and actions, and so on, would improve the quality of environmental information disclosure, allow the social public to supervise the enterprise better, help sustainable development of a green enterprise; and at the same time display the social responsibility of the enterprise actively, helping to improve the reputation of the enterprise and setting up a good public image in the market, thereby achieving an active role in promoting business performance.

7.3. Operation Improvement Strategy

7.3.1. Pursuit of Diversified Development Strategy and Development of Clean Energy Generating Units

Based on the results of the evaluation of the performance of thermal power enterprises, this paper finds that enterprises with diversified business in the sample enterprises have more operating performance advantages. Therefore, it is suggested that enterprises pursue diversified development strategies and increase their own power types. In the current power generation industry, the number of enterprises is increasing and the competition is increasing. In the background, the power generation enterprises with low comprehensive efficiency should actively explore the type of power supply suitable for the enterprise itself and promote new technology innovation to ensure the effective improvement of business performance. The thermal power enterprises can actively develop clean energy units, expand the scope of business layout, enhance the competitive power of the fully mechanized enterprises, and then promote growing sales income.

7.3.2. Appropriate Increase in the Level of Financial Leverage

Based on DEA analysis of operating efficiency, this paper finds that the improvement of financial leverage level is in the direction of improving the operating efficiency of electric power enterprises, and the higher asset–liability ratio of power enterprises, on the one hand, can reduce the capital cost rate of enterprises and promote the creation of value due to tax credits; on the other hand, the financial risks of enterprises can be increased due to excessive debt, which can adversely affect the value creation and sustainable development of the enterprises. Of course, the financing of the enterprises will be combined with the best capital structure. Only with the best capital structure, can the performance of the enterprise management be maximized.

8. Conclusions

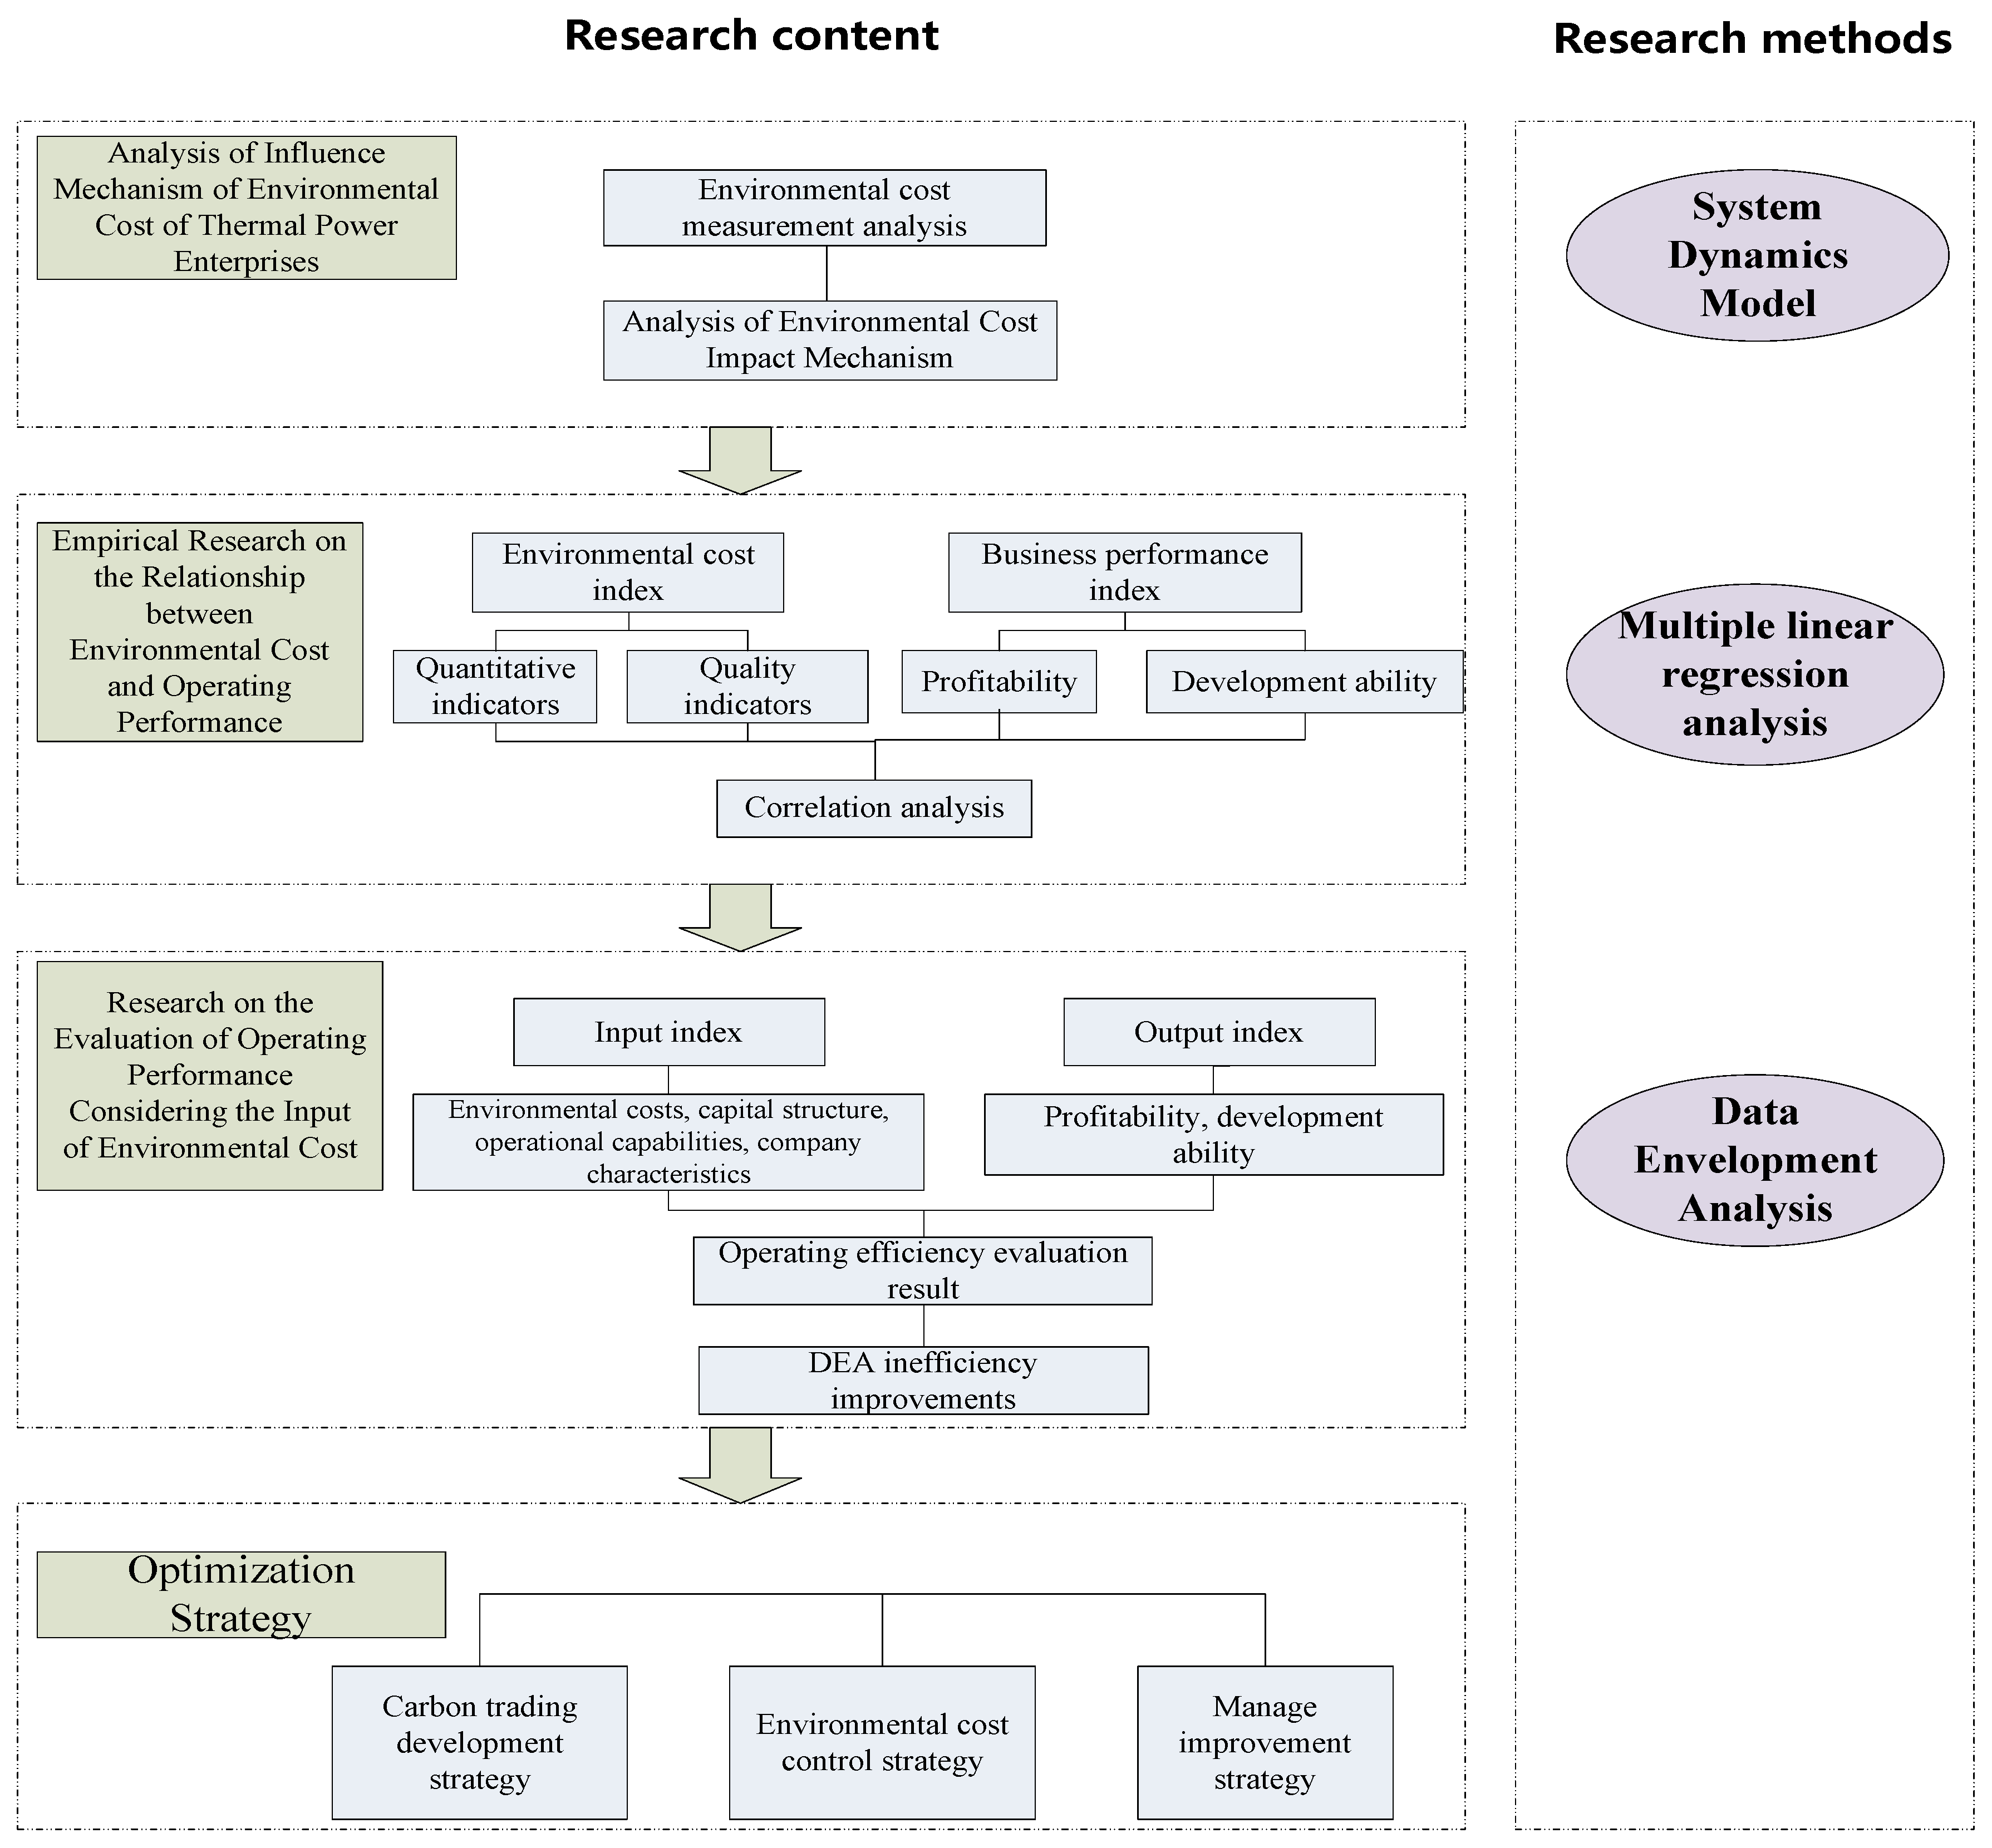
This paper explores the relationship between environmental costs and operational performance of thermal power companies in the context of carbon trading through system dynamics, multiple linear regression analysis, and the DEA model, and uses environmental costs as input factors to evaluate the company’s operating performance. This basis provides a strategic reference for thermal power companies to improve their operating performance.
The main contributions of the paper are as follows:
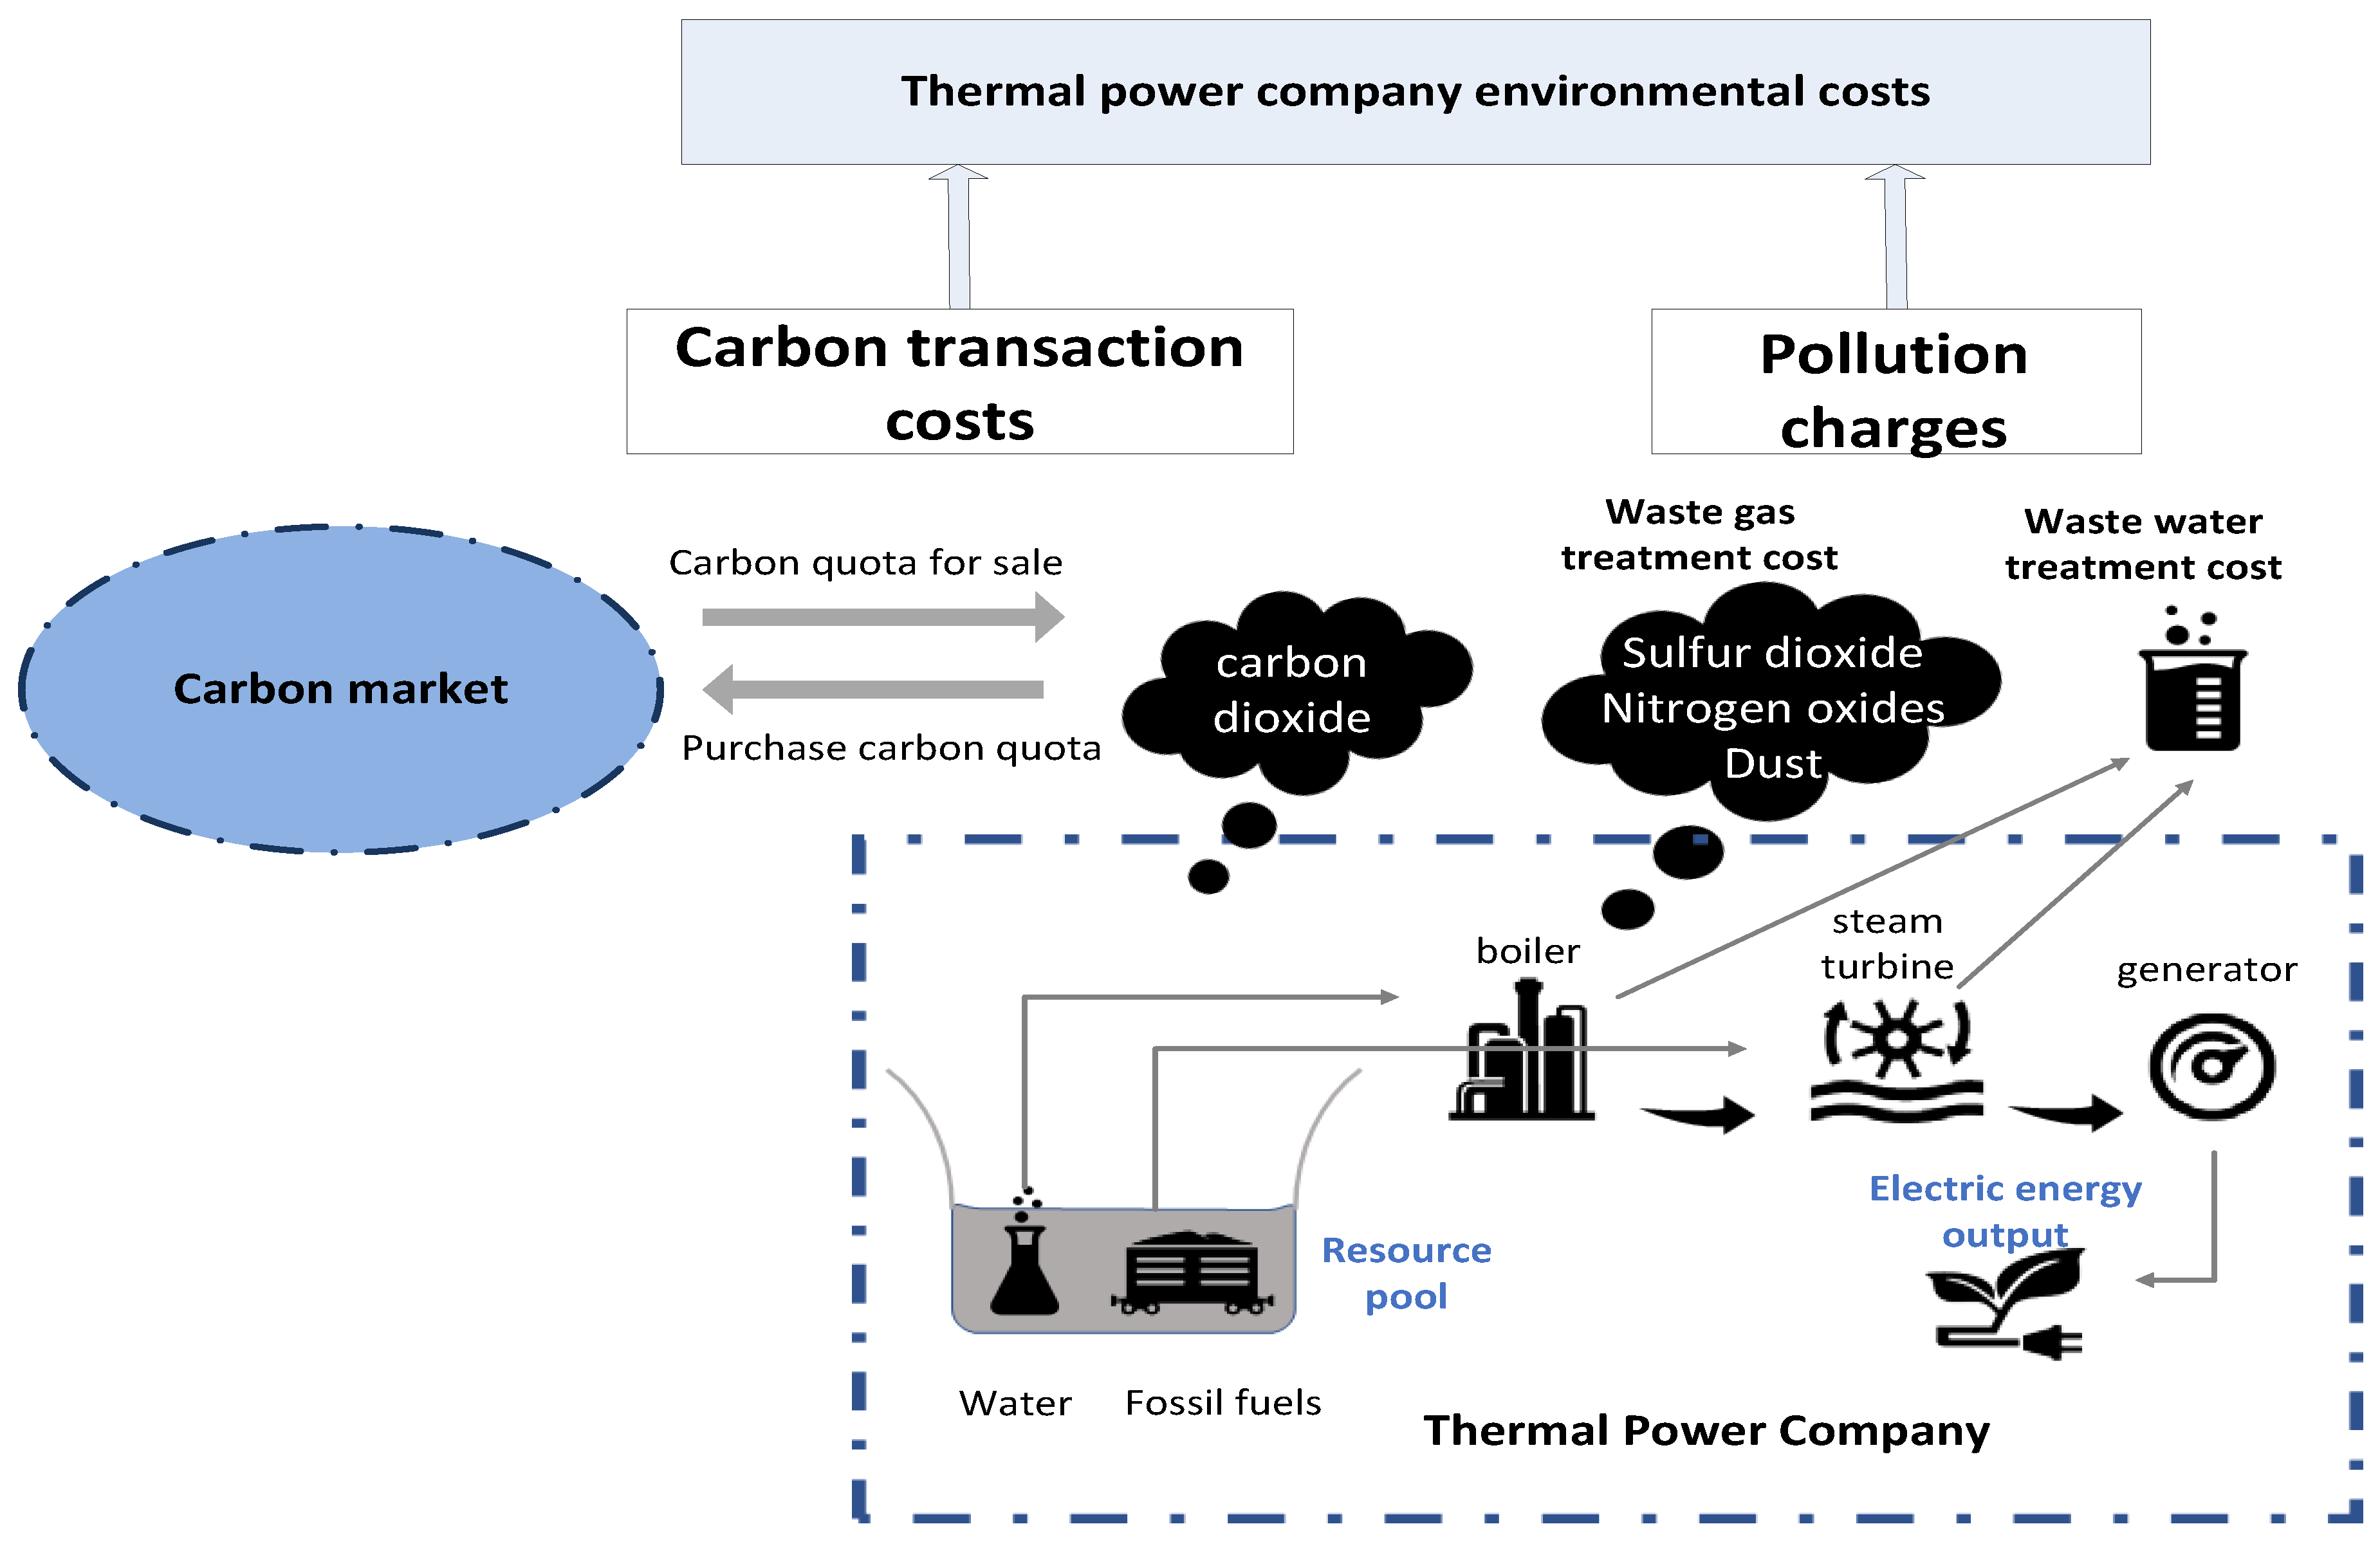
  • In this paper, the carbon transaction costs are included in the environmental costs for quantitative analysis, which enriches the connotation of thermal power companies’ environmental costs. Based on the research of experts and scholars and the era of the background of carbon trading development, the paper sorts out and summarizes public information of power generation enterprises such as the annual reports and sustainable development reports, so as to include carbon transaction costs in the environmental costs of power generation companies and carries out empirical research and analysis to provide new ideas for companies to conduct more comprehensive and detailed environmental cost management.
  • Construction of a Composite Index of Environmental Costs Considering Carbon Transaction Costs. In the construction of the indicators of environmental cost for the correlation analysis, this paper constructs an environmental cost evaluation index from a quantitative level and a quality level. Based on the company’s actual power generation, the paper calculated the environmental costs including wastewater discharge, waste gas emissions, and carbon dioxide emission costs, and established an environmental cost quantity level evaluation index. Disclosure of 13 major environmental cost sub-projects, such as equipment investment, monitoring costs, greening costs, and carbon trading conditions, is the basis for evaluation, to construct a more comprehensive evaluation system for public disclosure of environmental cost information. The composite index more comprehensively and clearly shows the environmental cost of power generation companies, which helps to more accurately reveal the relationship between environmental costs and business performance and lays a good foundation for empirical evaluation research.
  • Research on the evaluation and optimization strategy of power generation companies’ operating performance based on the input of factors such as environmental costs was carried out, and the content of correlation analysis was supplemented and improved, making the research conclusions more quantitative and specific. This paper takes the quantity and quality of environmental costs, and the size of corporate assets as input factors, analyzes the extent of actual impact on the thermal performance of thermal power companies, and proposes the direction and degree of improvement of each input factor based on the projection analysis method. The evaluation study supplements the correlation between environmental costs and operating performance and proposes corresponding strategies for effectively improving the performance of power generation enterprises in the context of carbon trading.
Based on this, the main conclusions of this paper are:
There is a positive correlation between environmental costs and operational performance of thermal power companies. The increase in corporate environmental cost input has a certain role in promoting the improvement of business performance. This provides certain theoretical support for thermal power companies to increase their investment in environmental protection and better fulfill their social responsibilities.
The increase in environmental costs and other inputs of production factors are the direction of important measures for improving the operating efficiency of thermal power companies. The analysis of the relaxation degree of input–output indicators of thermal power companies based on projection analysis shows that insufficient input of major factors such as environmental costs and financial leverage leads to insufficient output factors of power generation enterprises.
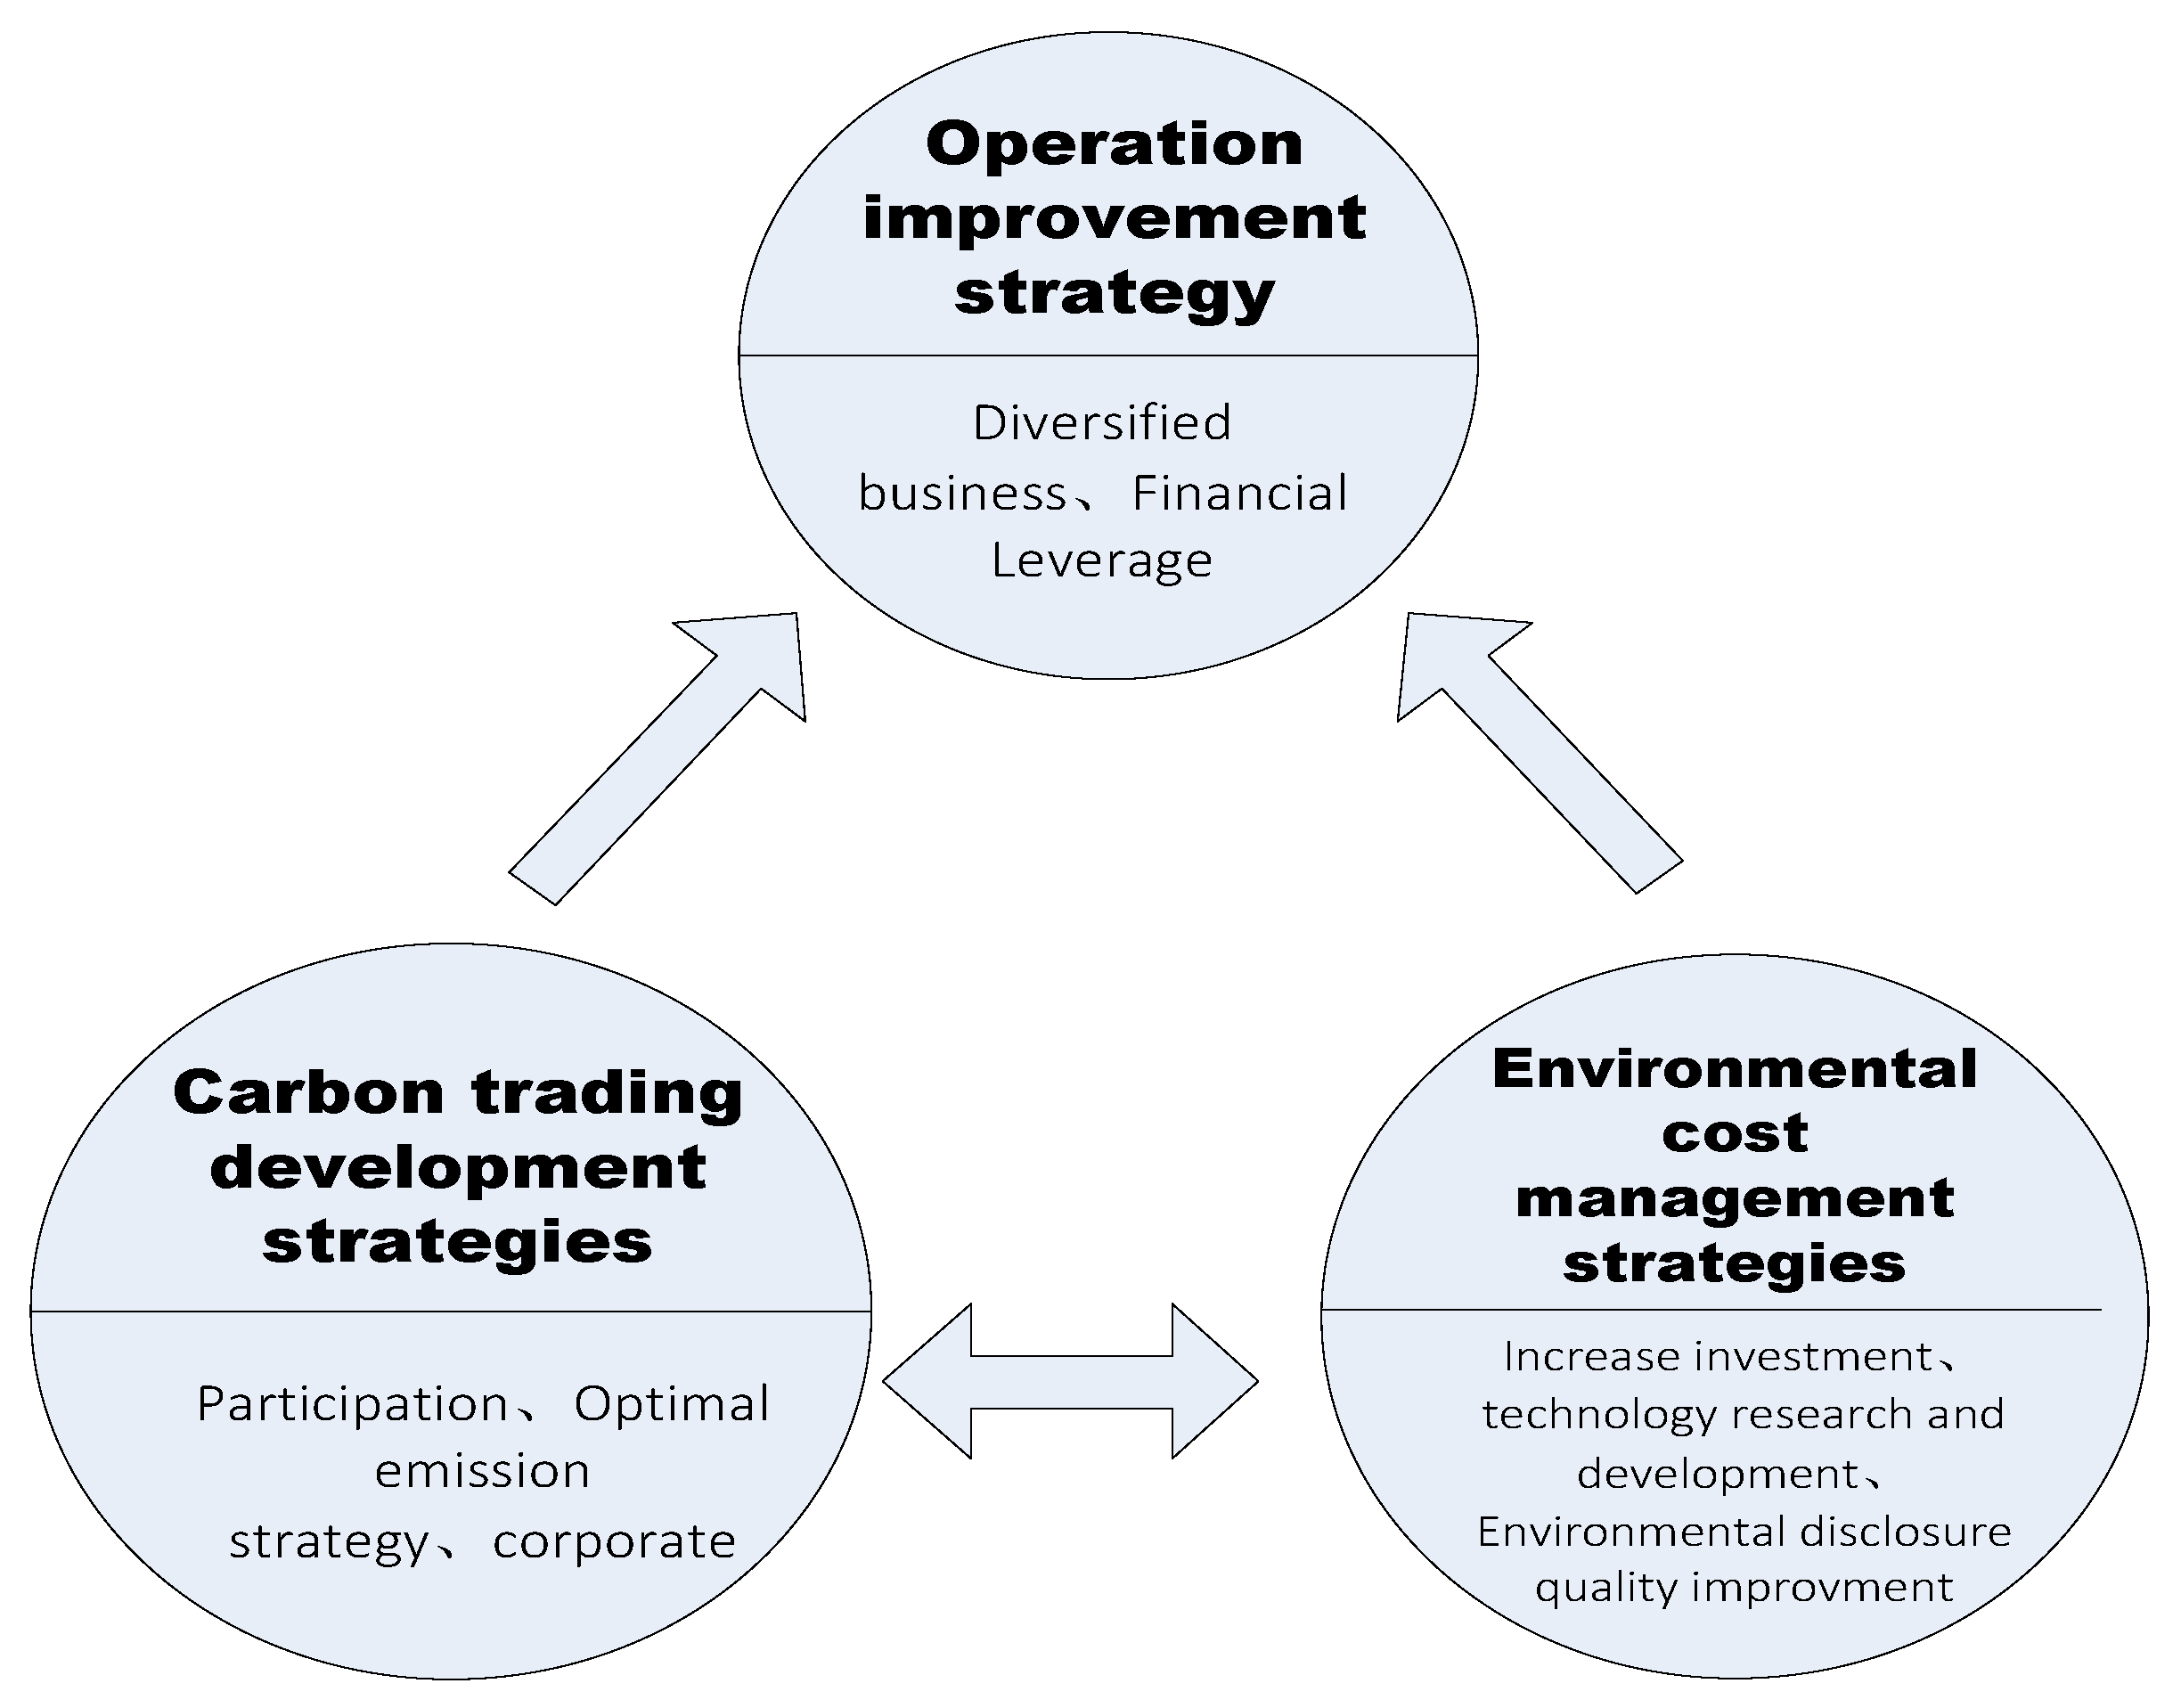
Thermal power companies should formulate optimization strategies for business performance from the aspects of carbon trading participation, environmental cost management, and operation management, and achieve improvement of business performance.
The above conclusions are innovative and enriching and expand the research results of existing literature. First of all, from the perspective of the selection of research objects, most of the existing literature separately conducts a quantitative analysis of the environmental cost elements of thermal power companies, establishes an environmental cost measurement model, and taps its sensitivity factors to determine the optimal pollutant emission reduction optimization program [32]. There is also literature on the performance indicators of the polluting industries, including thermal power companies. In the context of energy conservation and emission reduction, thermal power companies’ business performance is evaluated from the perspective of R&D investment [33,34]. The comprehensive development of China’s carbon trading market will inevitably have an important impact on thermal power companies’ environmental costs and operating performance. Few literature works have studied the relationship between the two in the new development of carbon trading. This article combines the environmental background of carbon trading with the environmental costs of thermal power companies and business performance, explores the correlation between the two, and concludes that the environmental costs are positively related to business performance, achieving the extension and supplementation of previous research conclusions. Second, as far as the selection of research methods is concerned, in the previous literature, when the environmental cost was measured and analyzed, it was mostly limited to measurement and accounting on a quantitative dimension, and the combination of environmental cost accounting and environmental cost indicators was studied in order to make business decisions as reference for sustainable development [35]. However, this article innovatively introduced environmental quality indicators, to construct a more comprehensive environmental quality information disclosure quality evaluation system, which together with quantitative indicators constitute a more scientific and reasonable environmental cost compound measurement indicator. When existing literature conducts business performance research, it mainly analyzes and evaluates financial aspects, and performs cost-benefit assessment and poor performance management improvement for the company considering electricity price and power generation cost [30]. However, this paper analyzes the DEA efficiency of business performance, and focuses on the impact of the input cost of environmental costs on business performance. It was found that the lack of input in major factors, such as environmental costs and financial leverage, causes the output elements of the power generation enterprises to be insufficient. In addition, in the field of thermal power companies’ business performance improvement and sustainable development optimization strategies, the existing literature mainly seeks corporate performance improvement strategies from the perspective of the main business [36]. However, the strategy of this article highlights the important factor of environmental costs, and encourages companies to actively participate in carbon trading, which has effectively expanded and enriched existing strategies.

Author Contributions

Conceptualization, X.S.; Data curation, X.J.; Formal analysis, X.J.; Methodology, X.S.; Validation, X.Z.; Writing—original draft, X.J. and X.Z.; Writing—review & editing, J.L.

Funding

This study was supported by the National Natural Science Foundation of China (NSFC) (71501071), Beijing Social Science Fund (17GLB010) and the Fundamental Research Funds for the Central Universities (2018ZD14, 2017MS059).

Acknowledgments

This study was supported by the National Natural Science Foundation of China (NSFC) (71501071), Beijing Social Science Fund (17GLB010) and the Fundamental Research Funds for the Central Universities (2018ZD14, 2017MS059).

Conflicts of Interest

The authors declare no conflict of interest.

References

  1. Zhang, D.; Karplus, V.J.; Cassisa, C.; Zhang, X. Emissions trading in China: Progress and prospects. Energy Policy 2014, 75, 9–16. [Google Scholar] [CrossRef]
  2. Wei, C.; Löschel, A.; Liu, B. Energy-saving and emission-abatement potential of Chinese coal-fired power enterprise: A non-parametric analysis. Energy Econ. 2015, 49, 33–43. [Google Scholar] [CrossRef] [Green Version]
  3. Zhou, G.; Chung, W.; Zhang, Y. Carbon dioxide emissions and energy efficiency analysis of China’s regional thermal electricity generation. J. Clean. Prod. 2014, 83, 173–184. [Google Scholar] [CrossRef]
  4. Fng, A. International trade and carbon emissions: The role of Chinese institutional and policy reforms. J. Environ. Manag. 2017, 205, 29. [Google Scholar] [CrossRef]
  5. Lo, A.Y. Carbon trading in a socialist market economy: Can China make a difference? Ecol. Econ. 2013, 87, 72–74. [Google Scholar] [CrossRef]
  6. Wang, J.; Li, L.; Zhang, F.; Xu, Q. Carbon emissions abatement cost in china: Provincial panel data analysis. Sustainability 2014, 6, 2584–2600. [Google Scholar] [CrossRef]
  7. Chou, J.S.; Yeh, K.C. Life cycle carbon dioxide emissions simulation and environmental cost analysis for building construction. J. Clean. Prod. 2015, 101, 137–147. [Google Scholar] [CrossRef]
  8. Mokhtar, N.; Jusoh, R.; Zulkifli, N. Corporate Characteristics and Environmental Management Accounting (EMA) Implementation: Evidence from Malaysian Public Listed Companies (PLCs). J. Clean. Prod. 2016, 136, 111–122. [Google Scholar] [CrossRef]
  9. Haggard, K.S.; Pereira, R. Does Voluntary Disclosure Improve Stock Price Informativeness. Financ. Manag. 2008, 37, 747–768. [Google Scholar] [CrossRef]
  10. Feng, T.; Cai, D.; Wang, D.; Zhang, X. Environmental management systems and financial performance: The joint effect of switching cost and competitive intensity. J. Clean. Prod. 2016, 113, 781–791. [Google Scholar] [CrossRef]
  11. Ramos-Real, F.J.; Tovar, B.; Iootty, M.; de Almeida, E.F.; Pinto, H.Q., Jr. The evolution and main determinants of productivity in Brazilian electricity distribution 1998–2005: An empirical analysis. Energy Econ. 2009, 31, 298–305. [Google Scholar] [CrossRef]
  12. Larrinaga, C.; Bebbington, J. Accounting change or institutional appropriation?—A case study of the implementation of environmental accounting. Crit. Perspect. Account. 2008, 12, 269–292. [Google Scholar] [CrossRef]
  13. Schaltegger, S.; Csutora, M. Carbon accounting for sustainability and management. Status quo and challenges. J. Clean. Prod. 2012, 36, 1–16. [Google Scholar] [CrossRef]
  14. Braun, M. The evolution of emissions trading in the European Union—The role of policy networks, knowledge and policy entrepreneurs. Account. Organ. Soc. 2009, 34, 469–487. [Google Scholar] [CrossRef]
  15. Zhai, H.; Ou, Y.; Rubin, E.S. Opportunities for decarbonizing existing U.S. coal-fired power plants via CO2 capture, utilization and storage. Environ. Sci. Technol. 2015, 49, 7571–7579. [Google Scholar] [CrossRef] [PubMed]
  16. Cristóbal, J.; Guillén-Gosálbez, G.; Jiménez, L.; Irabien, A. Minlp model for optimizing electricity production from coal-fired power plants considering carbon management. Energy Policy 2012, 51, 493–501. [Google Scholar] [CrossRef]
  17. Jiang, S.Q.; Chen, Z. Committed CO2 emissions of China's coal-fired power generators from 1993 to 2013. Energy Policy 2017, 104, 295–302. [Google Scholar] [CrossRef]
  18. Wang, J.; Wang, R.; Zhu, Y.; Li, J. Life cycle assessment and environmental cost accounting of coal-fired power generation in china. Energy Policy 2018, 115, 374–384. [Google Scholar] [CrossRef]
  19. Du, L.; Mao, J. Estimating the environmental efficiency and marginal CO2, abatement cost of coal-fired power plants in china. Energy Policy 2015, 85, 347–356. [Google Scholar] [CrossRef]
  20. Bi, G.B.; Shao, Y.Y. A formance evaluation of China’s coal-fired power generation with pollutant mitigation options. J. Clean. Prod. 2018, 171, 867–876. [Google Scholar] [CrossRef]
  21. Färe, R.; Grosskopf, S.; Pasurka, C.A., Jr. Toxic releases: An environmental performance index for coal-fired power plants. Energy Econ. 2010, 32, 158–165. [Google Scholar] [CrossRef]
  22. Sueyoshi, T.; Goto, M.; Ueno, T. Performance analysis of US coal-fired power plants by measuring three DEA efficiencies. Energy Policy 2009, 38, 1675–1688. [Google Scholar] [CrossRef]
  23. Sueyoshi, T.; Goto, M. DEA approach for unified efficiency measurement: Assessment of Japanese fossil fuel power generation. Energy Econ. 2011, 33, 292–303. [Google Scholar] [CrossRef]
  24. Xiong, L.; Shen, B.; Qi, S. The allowance mechanism of China’s carbon trading pilots: A comparative analysis with schemes in EU and California. Appl. Energy 2017, 185, 1849–1859. [Google Scholar] [CrossRef]
  25. Wang, Z.; Wang, C. How carbon offsetting scheme impacts the duopoly output in production and abatement: Analysis in the context of carbon cap-and-trade. J. Clean. Prod. 2015, 103, 715–723. [Google Scholar] [CrossRef]
  26. Shimada, K.; Tanaka, Y.; Gomi, K.; Matsuoka, Y. Developing a long-term local society design methodology towards a low-carbon economy: An application to shiga prefecture in japan. Energy Policy 2007, 35, 4688–4703. [Google Scholar] [CrossRef]
  27. Lu, C.; Tong, Q.; Liu, X. The impacts of carbon tax and complementary policies on Chinese economy. Energy Policy 2010, 38, 7278–7285. [Google Scholar] [CrossRef]
  28. Zhou, Q.; Yabar, H.; Mizunoya, T.; Higano, Y. Evaluation of integrated air pollution and climate change policies: Case study in the thermal power sector in Chongqing city, china. Sustainability 2017, 9, 1741. [Google Scholar] [CrossRef]
  29. Li, L.; Wang, J. The effects of coal switching and improvements in electricity production efficiency and consumption on CO2 mitigation goals in china. Sustainability 2015, 7, 9540–9559. [Google Scholar] [CrossRef]
  30. Darnall, N.; Jolley, G.J.; Ytterhus, B. Understanding the relationship between a facility’s environmental and financial performance. Soc. Sci. Electron. Publ. 2006, 213–260. [Google Scholar] [CrossRef]
  31. Han, F.; Wang, T.; Lei, J. Research of Performance Evaluation of Power Generation Enterprises Based on Rough Set Theory. IEEE Int. Symp. Inf. Technol. Appl. Educ. 2007, 74–77. [Google Scholar] [CrossRef]
  32. Luo, X.; Zhang, B.; Chen, Y.; Mo, S. Operational planning optimization of multiple interconnected steam power plants considering environmental costs. Energy 2012, 37, 549–561. [Google Scholar] [CrossRef]
  33. Zhang, L.; Li, N.N.; Zhao, H.R.; Yang, K. A novel comprehensive evaluation for the performance of energy saving and emission reduction in thermal power enterprise based on combination weights and improved matter-element extension model. Appl. Mech. Mater. 2014, 556–562, 6050–6053. [Google Scholar] [CrossRef]
  34. Zhao, Y.; Yue, H.; Huang, Y.J. Relationship between R & D investment and business performance from the perspective of environmental regulation: Takeing the heavy-polluting industries from 2011 to 2016 as an example. Ecol. Econ. 2017, 3, 213–226. [Google Scholar]
  35. Olga, O.; Lorena, R.A.; Silviu, B.C. General principles regarding the relationships among the environmental cost accounting, environmental performance measurement and eco-efficiency indicators. Ovidius Univ. Ann. Econ. Sci. 2012, 12, 64–76. [Google Scholar]
  36. Li, Q.; Wang, W.; Lou, Y.; Cheng, K.; Yang, X. Diversification and corporate performance: Evidence from china’s listed energy companies. Sustainability 2016, 8, 983. [Google Scholar] [CrossRef]
Figure 1. Carbon trading market developments in China.
Sustainability 10 02006 g001
Figure 2. China’s thermal power companies and their total carbon emissions from 2010 to 2016.
Sustainability 10 02006 g002
Figure 3. Method frame diagram.
Sustainability 10 02006 g003
Figure 4. Positive (negative) feedback loop.
Sustainability 10 02006 g004
Figure 5. Thermal power enterprises environment costs composition.
Sustainability 10 02006 g005
Figure 6. Environmental cost causal circuit diagram of thermal power enterprises under the background of carbon trading.
Sustainability 10 02006 g006
Figure 7. Ratio graph of 14 data envelopment analysis (DEA) efficiency enterprises.
Sustainability 10 02006 g007
Figure 8. Efficiency value comparison chart.
Sustainability 10 02006 g008
Figure 9. Optimization strategy for thermal power enterprises’ business performance.
Sustainability 10 02006 g009
Table 1. Pollutant equivalent and charges.
Types of PollutantsEquivalentPollutant Charges (Yuan/Equivalent)
Sulfur dioxide0.951.2
Nitrogen oxides0.951.2
Dust2.181.2
Wastewater0.181.4
Table 2. Performance of pollutants emission disclosed by typical companies.
Pollutant (g/kWh)Average in Electricity Industry
Dust0.08
Sulfur dioxide0.39
Nitrogen oxides0.36
Table 3. CO2 emissions from thermal power generation in China in 2014–2016.
Year201420152016
Unit CO2 emissions from thermal power generation (g/kWh)855835822
Table 4. Summary of model variables.
Variable PropertyVariable Interpretation ContentVariable NameVariable Symbol
Explained VariableBusiness PerformanceRate of Return on Common Stockholders’ EquityROE
Sales Growth RateORIR
Explanatory VariableEnvironmental CostsEnvironmental Cost Numerical IndexEC
Environmental Cost Disclosure Quality IndexECQ
Control VariableCapital StructureAsset-liability RatioDEBT
Operational CapacityTotal Assets TurnoverATAR
Enterprise CharacteristicsFirm SizeSIZE
Firm AgeAGE
Table 5. Evaluation system of environmental cost disclosure quality index.
Project CategoryProject NameProject Description
Disclosure MethodReport CategoryWhether the corporate annual report or social responsibility report contains information on environmental costs and expenditures
Disclosure ContentEnvironmental prevention costsResearch and development of technical patentResearch and development, purchase of cleaner production technology, patents, etc.
Environmental protection equipment investmentAcquisition of desulfurization and denitrification equipment, dedusting equipment, etc.
Monitoring unitAcquisition of environmental detection devices, early warning facilities, etc.
Employee labor protectionCost of labor protection, safety education, etc.
Environmental reserve or government grantEarmarked reserve funds
Environmental control costsOperating cost of environmental protection equipmentDepreciation costs, maintenance costs, etc. incurred in the operation of environmental protection facilities
GreeningGarden greening, green plant maintenance, etc.
Environmental compensation costWastewater dischargeIndustrial wastewater containing mercury, lead and other heavy metals after treatment, sewage charges
Exhaust gas dischargeSewage charges from atmospheric pollutants which still contains sulfur dioxide, nitrogen oxide, and other pollutants after treatment
Waste residue sewageFly ash, desulphurization, gypsum, and other waste sewage charges
Carbon tradingCDM project cost, carbon asset acquisition, carbon trading cost, etc.
Fines and compensationFines for environmental pollution and compensation for environmental pollution accidents
Table 6. Descriptive statistical analysis of variables.
VariablesNMinimumMaximumAverageStandard Deviation
ROE108−12.8134.5411.908.18
ORIR108−49.3561.81−2.6714.05
EC1080.022.240.590.46
ECQ1087.0029.0016.164.23
DEBT10822.0590.8559.8515.54
ATAR1080.041.010.360.16
SIZE10822.0626.4624.091.15
AGE1084.0026.0019.424.83
Table 7. Model (A) regression results and corresponding statistical test results.
Model (1) 1Unstandardized CoefficientstSignificanceVariance Inflation Factor
BStandard Error
(Constant)6.72619.6690.3420.733
EC4.31.6772.5640.0121.064
ECQ0.4810.1852.6080.0111.091
SIZE0.6140.7580.810.421.352
AGE−0.0250.165−0.1510.881.132
TATR5.6615.3691.0540.2941.31
DEBT−0.0990.052−1.9350.0471.148
Adj.R2 = 0.693 F = 3.074 (sig = 0.008) DW = 1.830
1 a dependent variable: Rate of Return on Common Stockholders’ Equity (ROE).
Table 8. Regression results of model (B) and corresponding statistical test results.
Model (2) 1Unstandardized CoefficientstSignificanceVIF
BStandard Error
(Constant)−1.78734.501−0.0520.959
EC9.9362.9423.3770.0011.071
ECQ0.0920.3240.2840.7771.093
SIZE−0.5391.329−2.6510.0081.351
AGE0.180.2890.6230.5351.122
ATAR12.599.4181.3370.1841.307
DEBT−0.0550.091−0.6060.5461.144
Adj.R2 = 0.645 F = 2.275 (sig = 0.042) DW = 2.077
1 a dependent variable: Increasing Rate of Sales Income (ORIR).
Table 9. DEA input–output index system.
Input or OutputIndex TypeIndex NameSymbol
Input indexEnvironmental CostsEnvironmental Cost Numerical IndexX1
Environmental Cost Disclosure Quality IndexX2
Capital structureAsset-liability RatioX3
Operational CapacityTotal Assets TurnoverX4
Enterprise CharacteristicsFirm SizeX5
Firm AgeX6
Output indexProfitabilityRate of Return on Common Stockholders’ EquityY1
Development abilitySales Growth RateY2
Table 10. Average relaxation of input–output indicators of power generation companies.
Stock Symbol S x 1 S x 2 S x 3 S x 4 S x 5 S x 6 S y 1 S y 2
00069000000000
60067400000000
60199100000000
00095800000000
6004830.0760.171000000
00247900000000
00089900000000
6000980.38800.19600000.46
60023600000000
6007950.05300.058000.00800.546
6008860.02500.288000.32200
60086400000000
00088300000000
60002700000000
60072600000000
6000110.03200.27700000
60074400000000.263
00087500000000
00060000.39500000.1190.339
60039600.3920000.09500
6005780.1690.59200000.0370
60086300.378000000.282
6000210.150.0020.171000.04400
0006010.2880.16000000.05
60064200000000
0000270.08200.01600000.047
00053100000000
60050900000000
6007800.14000.0470.059000.074
0005430.0640.21700000.040.153
0007200.008000.00700.1610.090.17
00189600.2110000.1420.1160.038
0005390.3980.178000000
00076700.1810000.18600
00096600.1130000.1370.0120.073
60002300000000
Table 11. Description statistics of input indicator relaxation degree.
Input Indicatorx1x2x3x4x5x6
Frequency13126218
Average input value added0.1440.2490.1680.0270.0590.137

