Participatory Mapping as an Approach to Identify Grazing Pressure in the Altay Mountains, Mongolia


1
Animal Husbandry in the Tropics and Subtropics, University of Kassel and Georg-August-Universität Göttingen, Albrecht-Thaer-Weg 3, 37075 Göttingen, Germany
2
Organic Plant Production and Agroecosystems Research in the Tropics and Subtropics, University of Kassel, Steinstraße 19, 37213 Witzenhausen, Germany
*
Author to whom correspondence should be addressed.
Sustainability 2018, 10(6), 1960; https://doi.org/10.3390/su10061960
Submission received: 10 May 2018
/
Revised: 5 June 2018
/
Accepted: 7 June 2018
/
Published: 11 June 2018
(This article belongs to the Section Environmental Sustainability and Applications)
Abstract
:Sustainable rangeland management is crucial for maintaining forage resources in pastoral systems, globally. However, pastoral regions are often remote and therefore data poor when it comes to resource monitoring. We tested participatory mapping as a means to rapidly assess rangeland use to identify areas with high grazing pressure. Participatory geographic information system data and herbaceous biomass production data were collected and georeferenced to establish a grazing pressure index for a summer pasture in the Mongolian Altay; simultaneously, a survey on herder perceptions and their recommended rangeland management measures was conducted. Areas with intense use, such as campsites and small and bovine ruminant grazing areas, corresponded with low biomass production and were found to be unsustainably grazed, likely prone to rangeland degradation. Participatory mapping was well received by herders and proved to be an effective method to appraise their herds’ impact on rangeland resources. The process incited discussion and awareness regarding not only spatial, but also temporal aspects of rangeland management. Participatory mapping is thus a valuable tool that should be incorporated into local management initiatives in order to quickly monitor rangeland use for creating feasible management plans.
1. Introduction
Mongolia has a long tradition of seminomadic transhumance [1], which has experienced much political, economic, and environmental change in the last century [2]. These changes have brought about a research focus on the problem of localized heavy grazing, caused by an increase in the number of livestock and a reduction in herder and flock mobility [3,4,5], even though processes of rangeland degradation in Mongolia are dynamic and not uniform [6]. Herders may tend to inadvertently allow their herds to graze regions unsustainably as they migrate less often and shorter distances, partly in order to remain near settlements and infrastructure [1,5]. Where poorer households lack the resources to migrate large distances, degradation may also be a result of wealth differentiation [7,8]. Compounding with changes in animal number and anthropogenic behavior are Mongolia’s highly variable environmental conditions, which make monitoring of grazing pressure and subsequently rangeland productivity a challenging task [9,10,11].
Due to its multi-faceted influencing factors, the problem of rangeland degradation is pertinently covered in the literature, not only from a soil and vegetation perspective, but as a challenge to be overcome through suitable herd management practices which are influenced by social dynamics [12] and economic conditions [13]. Grazing affects the spatial re-distribution of soil nutrients [14,15], whereby increasing grazing intensity has also been found to negatively affect long-term soil carbon and nitrogen concentrations, vegetation cover and plant species richness, especially under highly variable precipitation conditions [16]. Fernández-Giménez and Allen-Diaz [17] also reported that, specifically on the Mongolian steppe, increasing grazing intensity has resulted in the decreasing presence of grasses, and an increasing presence of forbs and weedy annuals. Based on herd management indicators, such as herbage allowance, forage nutrient concentrations, migration distance, and number of pastures visited, Jordan et al. [5] determined, through the comparison of Chinese and Mongolian Altay-Dzungarian pastures, that the reduced productivity of Mongolian pastures resulted from high animal stocking rates and prolonged intra-seasonal pasture use. Community-based rangeland management (CBRM) members are more likely to partake in proactive resource management behaviour, which could be used to address crucial resource management issues [18]; however, the overall impact of CBRM on rangeland degradation is likely overstated [19] and additional measures need to be considered.
In order to monitor rangeland use and identify areas with a high risk of degradation, there exist multiple methods from across various disciplines, such as soil and vegetation monitoring [16,20], herd tracking [5,21] and participatory mapping [22,23]. This study focuses on the latter method because participatory mapping has numerous pragmatic advantages to the other methods, along with its ability to directly link individual herd management practices at the community level. In contrast to vegetation monitoring and herd tracking, participatory mapping methods can be carried out with commonplace equipment, such as printed maps and pens or a computer loaded with free geographical software, such as Google Maps or free GIS software. The results are quickly obtained and are simultaneously visible for respondents; therefore, these approaches enable stakeholders to quickly foresee areas of potential land use conflict [24]. Bauer [25] also highlighted that participatory mapping is equipped to portray flexible and comprehensive relations in uses of space. Although it has been argued that participatory mapping cannot fully overcome power dynamics between participants and policy makers [25,26], when supported by an array of community-based methods, participatory mapping can identify auspicious or detrimental local phenomena. Such phenomena may include informal resource sharing agreements or disputes about access to resources. Therefore, participatory mapping appears adequate to identify and analyse unsustainable multi-user land use practices.
Surprisingly, despite the significant need for land use monitoring in the complex and fragile Mongolian landscape [27], and the low-tech requirements of participatory mapping, this method has not been, to the best of our knowledge, widely applied in the Mongolian context. In 1991, Mearns et al. [28] conducted participatory mapping and survey methods in two regions, while working for the Policy Alternative for Livestock Development project, whose goal was to help the transition from a centrally-planned to a market-based economy in the livestock sector. In addition, Joly et al. [29] also employed aspects of participatory mapping while asking herders where and how far their animals move to graze; however the authors failed to mention if there was the use of a map (or satellite photo) during the course of the interview. Therefore, our study aimed to test the suitability and effectiveness of GIS-based participatory mapping to record data on rangeland use and animal numbers from local herders in order to quickly identify intensely grazed areas. To increase the level of information, biomass data were also collected.
2. Materials and Methods
2.1. Study Area
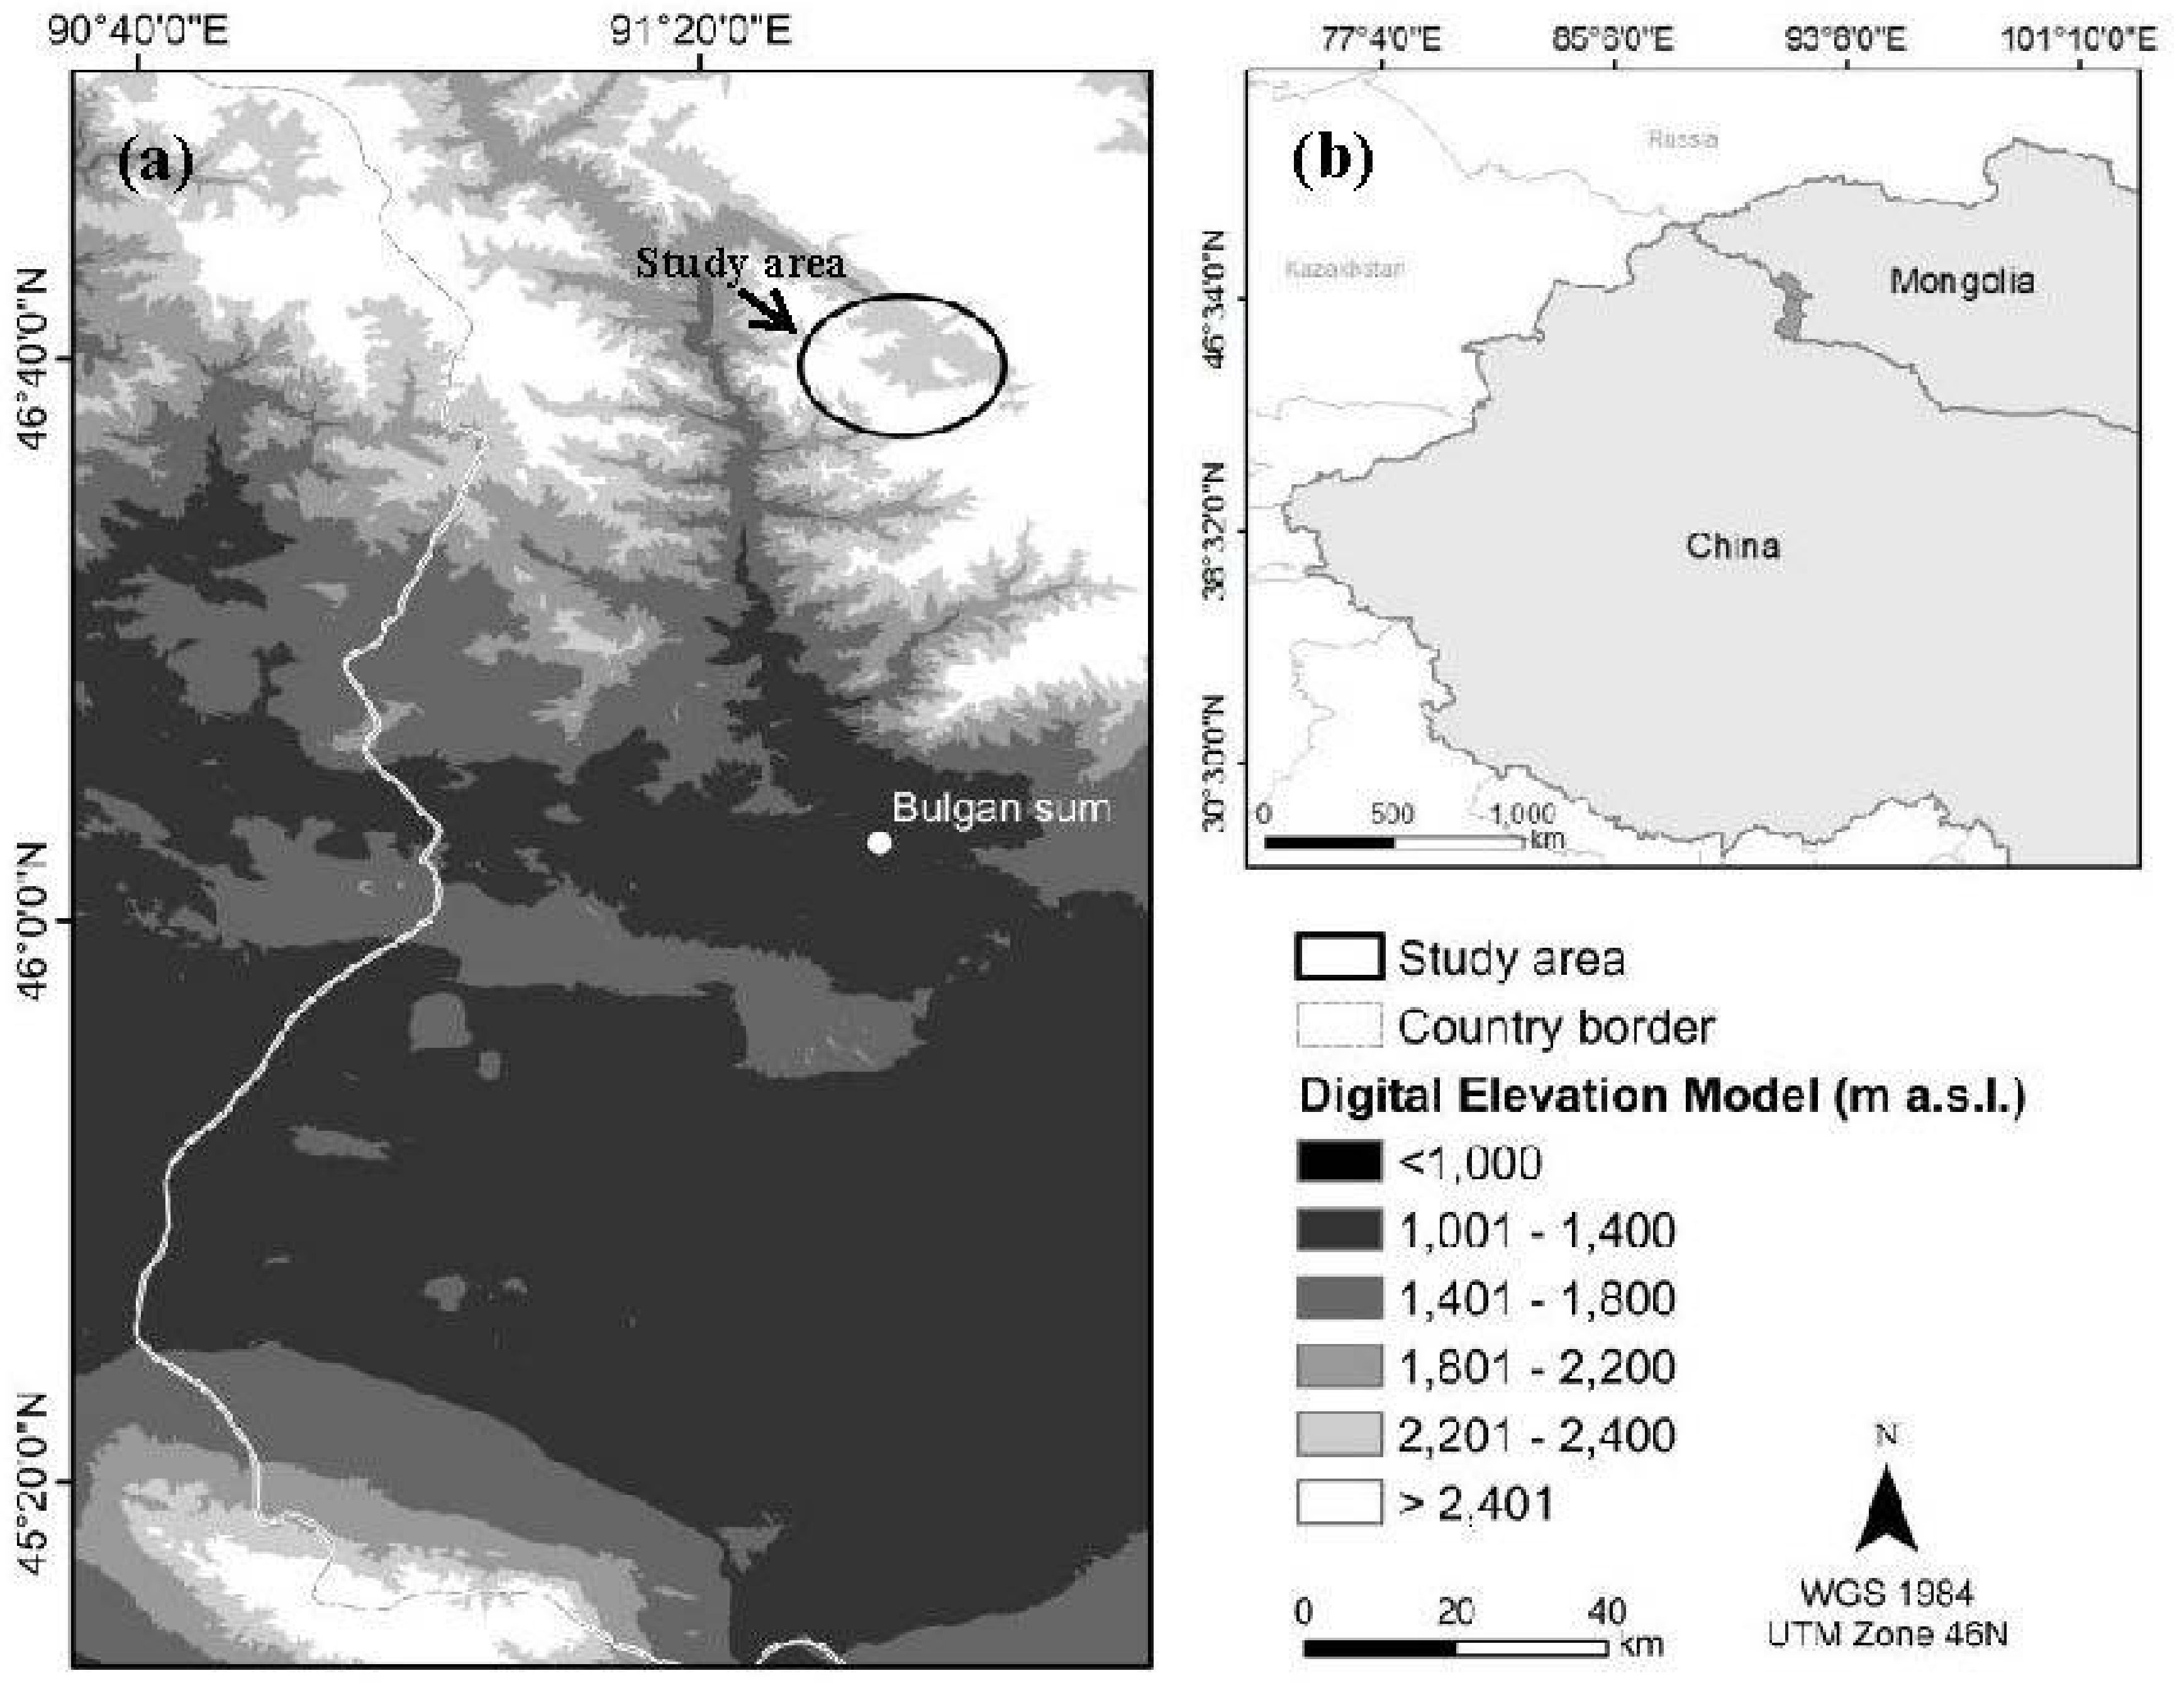
Tsunhal Nur summer pasture (also spelled Tsunkhul Lake [5] or Sonkhel Lake [30], central point of lake 46°40′ N, 91°35′ E, altitude: 2392 to 3097 m a.s.l.) is located approximately 65 km northeast of Burenkhairkhan (Khovd aimag) in the southern tip of Bulgan soum (district), Bayan-Ulgii aimag (province), Mongolia (Figure 1). The alpine steppe region is utilized as a summer pasture to support herds primarily from June through August. The lake in the center of the study area is bounded by mountains, with the Munkhkhairkhan National Park adjacent to the north. The lake is primarily fed by creeks formed from snowmelt, which primarily serve as household and livestock water sources. However, the lake was also identified as an additional water source for livestock towards the end of summer. The Altay region, in general, has historically been in flux between open grasslands and forest cover [31], since the vegetation is highly dependent upon the amount and distribution of precipitation [17,32].
Within Mongolia, our study area represents a unique and culturally complex summer pasture because the herders are of one of three ethnic groups—Kazakh, Torguud, and Uriankhai—originating from Khovd aimag and Bayan-Ulgii aimag. The Torguud and Uriankhai groups are indigenous to Mongolia, whereas the Kazakh migrated to the region in the 20th century [34]. At the national level, the Kazakh population is socioeconomically disadvantaged [8], but also the two Mongol groups included in this study are considered minorities. Therefore, in the regional context of Tsunhal Nur, we hypothesize that the Kazakh are not marginalized based on their socioeconomic status. Throughout the analysis, unless otherwise specified, the ethnic groups are analysed separately to test this hypothesis. Legally, herders from Bayan-Ulgii, most of whom are Uriankhai, have first claim to the Tsunhal Nur camp sites and the adjacent grazing areas, because the summer pasture is located in Bayan-Ulgii aimag and their provincial officials preside over the area. The Torguud migrate to Tsunhal Nur from Khovd aimag for the summer season and the Kazakh households originate from either Bayan-Ulgii or Khovd aimag.
2.2. Data Collection
During the study period from 6 July–4 August 2014, the number of gers (portable round felt-covered tent) fluctuated between 40 and 50 in the study area. Of these habitations, in total 31 households (10 originating from Khovd aimag and 21 from Bayan-Ulgii aimag) representing all but one single herder khot ail (khot ail: a group of typically two or more households who jointly practice a transhumant way of living and herding) participated in a two-part survey. The survey was conducted for two periods—at a household’s first camp site (June–July) and at the second camp site (late July onwards)—where participants completed a paper questionnaire and participatory geographic information system (PGIS) survey on a tablet computer.
During the first survey period, households were selected using snowball sampling [35], where we started with our translator’s household and from there asked the currently interviewed household member (either household head or spouse) if they knew of anyone who was at that time present at his/her ger to receive a visit. Also interviewed were respondents who volunteered to participate. Before the start of an interview, respondents were introduced to the research question and methodological approach, assured that their identity would not be disclosed in any report, and then were asked if they were willing to participate. The survey consisted of 15 closed and four open questions about animal numbers (>6 months of age for bovine and small ruminants), herder perception of rangeland condition and possible rangeland improvement measures. Fernández-Giménez [36] found perception to play an important role in resource management; therefore, we included two questions linking the respondents’ perception with what management measures they personally would recommend to implement. Households were also asked for self-reported ethnicity (i.e., Kazakh, Torguud, or Uriankhai).
Along with the questionnaire, household members completed an electronic participatory mapping exercise. First, the GPS coordinates were recorded for each ger site with a HOLUX M-241 wireless GPS logger (HOLUX Technology Inc., Hsinchu, Taiwan; accuracy ±3 m). In QGIS (version 2.2.0, QGIS Development Team, 2012, QGIS Geospatial Graphic Information System, Open Source Geospatial Foundation Project; http://qgis.osgeo.org) installed on a LENOVO Thinkpad 2 tablet operating Windows Pro 8, participants were asked to outline on a Google Earth satellite image where their animals grazed throughout the time that their ger remained at site one. For orientation, land marks, such as the main road and lake, current position and cardinal directions were pointed out on the image. Participants were asked to identify rangeland grazed by: camels, horses, bovine ruminants (cattle and yaks), and small ruminants (sheep and goats). The information was inserted directly into QGIS as polygon shape files overlaying the satellite image. Each polygon shape file corresponded to a specific household and herd type. Participants confirmed the accuracy of each polygon as it was drawn.
During survey period two, the participatory mapping exercise was repeated at the second camp site. In addition, the questionnaire was expanded to include questions on why households had (or had not) moved to their second camp site, and about the criteria for choosing the second camp site or staying put. The questionnaire was not repeated in its entirety; only the additional questions were posed to participants. Households that did not move only participated in the questionnaire expansion.
In order to determine animal numbers, we counted small and bovine ruminant head per herd, either prior to animals leaving the camp sites in the early morning or upon their return in the evening. The counts were conducted once in late July. Animals unable to be visibly counted were self-reported by participants during the first household interview. All camel and horse numbers (including young) in this study were self-reported. As small ruminants and bovines are often herded jointly between two or more households, animals were counted per khot ail. When the self-reported number of animals was ≥10 percent than the counted number, the reported number was used to determine the number of sheep units (SU; see below) and to subsequently calculate the seasonal stocking rate. Discrepancies only occurred for one small ruminant and two bovine herds where the entire herd did not return prior to darkness. Animal numbers were converted into sheep units (SU) according to Hu and Zhang [37]; however, as it was not possible to distinguish between sheep and goats during head counts, a calculated khot ail specific self-reported sheep-goat ratio was applied to the overall head counts in order to estimate the number of sheep and goats. Bovine young were excluded due to incomplete information on number and grazing area; bovine young graze separately from the main bovine herd to avoid suckling and ensure milk can be collected upon the herd returning to the campsite. For the conversion to SU, the equivalency units used were 7.0, 5.0, 5.0, 4.0, 1.0, 0.9 for adult (≥1 year of age) individuals of camel, horse, cattle, yak, sheep, goat, and 0.4 for young small ruminants (<1 year of age), respectively [37]. Once khot ail SU were determined for small and bovine ruminant herds, shapefiles depicting households’ species-specific pasturing zones were merged together based on khot ail participation for small and bovine ruminants and were further addressed as “grazing areas” (ha); the merging ensured that khot ail animal numbers corresponded with grazing areas per khot ail. By relating animal numbers (SU) to their respective grazing area (ha) and accounting for the duration of stay (days) therein, household- or khot ail-specific “seasonal stocking rates” (SU ha−1) were calculated. These were overlaid in QGIS for all households and khot ail, respectively, to identify heavily stocked areas based on the equal count (quantiles) classification method as prescribed by Murray and Shyy [38] for linear ratio data.
For comprehensive monitoring purposes, the aboveground net primary production (ANPP) of herbaceous dry mass (DM) was determined by destructive sampling prior to livestock grazing at 83 representative sampling locations (surface per plot: 0.25 m2) in June 2014. Thereby, the sampling locations were chosen as in Jordan et al. [5]. The ANPP data (kg DM ha−1) were interpolated via the inverse distance weighting in QGIS. Based on the interpolated ANPP map, we calculated a ‘seasonal grazing pressure index’ as follows: animals’ cumulative fodder demand, that is seasonal stocking rate (SU ha−1) times herbage requirement of 5 kg DM day−1 per SU [37] and season length (1 to 3 month, depending on individual sojourn length), divided by the supply (ANPP; kg DM ha−1). The aggregate rangeland grazing pressure index was mapped in QGIS and depicted as a choropleth map computed into five grazing pressure risk categories based on the equal count (quantiles) classification method, as was done for the stocking rate map.
2.3. Data Analysis
All statistics were conducted using R free open-source statistics package (version 3.3.1), results are depicted as mean and standard deviation (±) unless specified otherwise. A relationship between range size (ha) and stocking rate per khot ail (SU ha−1) was tested using Pearson and Spearman correlation to determine whether smaller ranges were being more heavily stocked, as could be expected for convenience or rangeland access reasons. Questionnaire data was analysed using univariate descriptive statistics with axial coding [35] for open questions. In order to analyse and determine management differences between ethnic groups for the non-normally distributed household data, we used bivariate generalized linear models, where the continuous numerical rangeland and herd characteristics were inputs as the dependent variables and the household binominal ethnicity dummy variables as the independent variable (where 1 represented the ethnicity of interest and 0 the other two ethnicities), in order to determine if one ethnic group had access to more biomass resources (ANPP, kg DM ha−1) or significantly more livestock assets (SU owned) compared to their neighbours. We also analysed if the species composition of a herd is influenced by ethnic group or wealth, using small ruminant herd size as a proxy for wealth in the models [4,8,38].
3. Results
3.1. Rangeland Use and Forage Resources
Households start moving to Tsunhal Nur summer pasture in the beginning of June. However, in 2014 two households from different khot ail moved into the study area in mid-July only. Questionnaire results indicate that a family’s arrival depends on aspects such as weather (rising temperatures and snow melting), learned behaviour of lead small ruminants, dwindling resource availability at the (preceding) spring pasture, and social relations. The khot ail and subsequent households changed camp sites within the summer pasture in late July to early August.
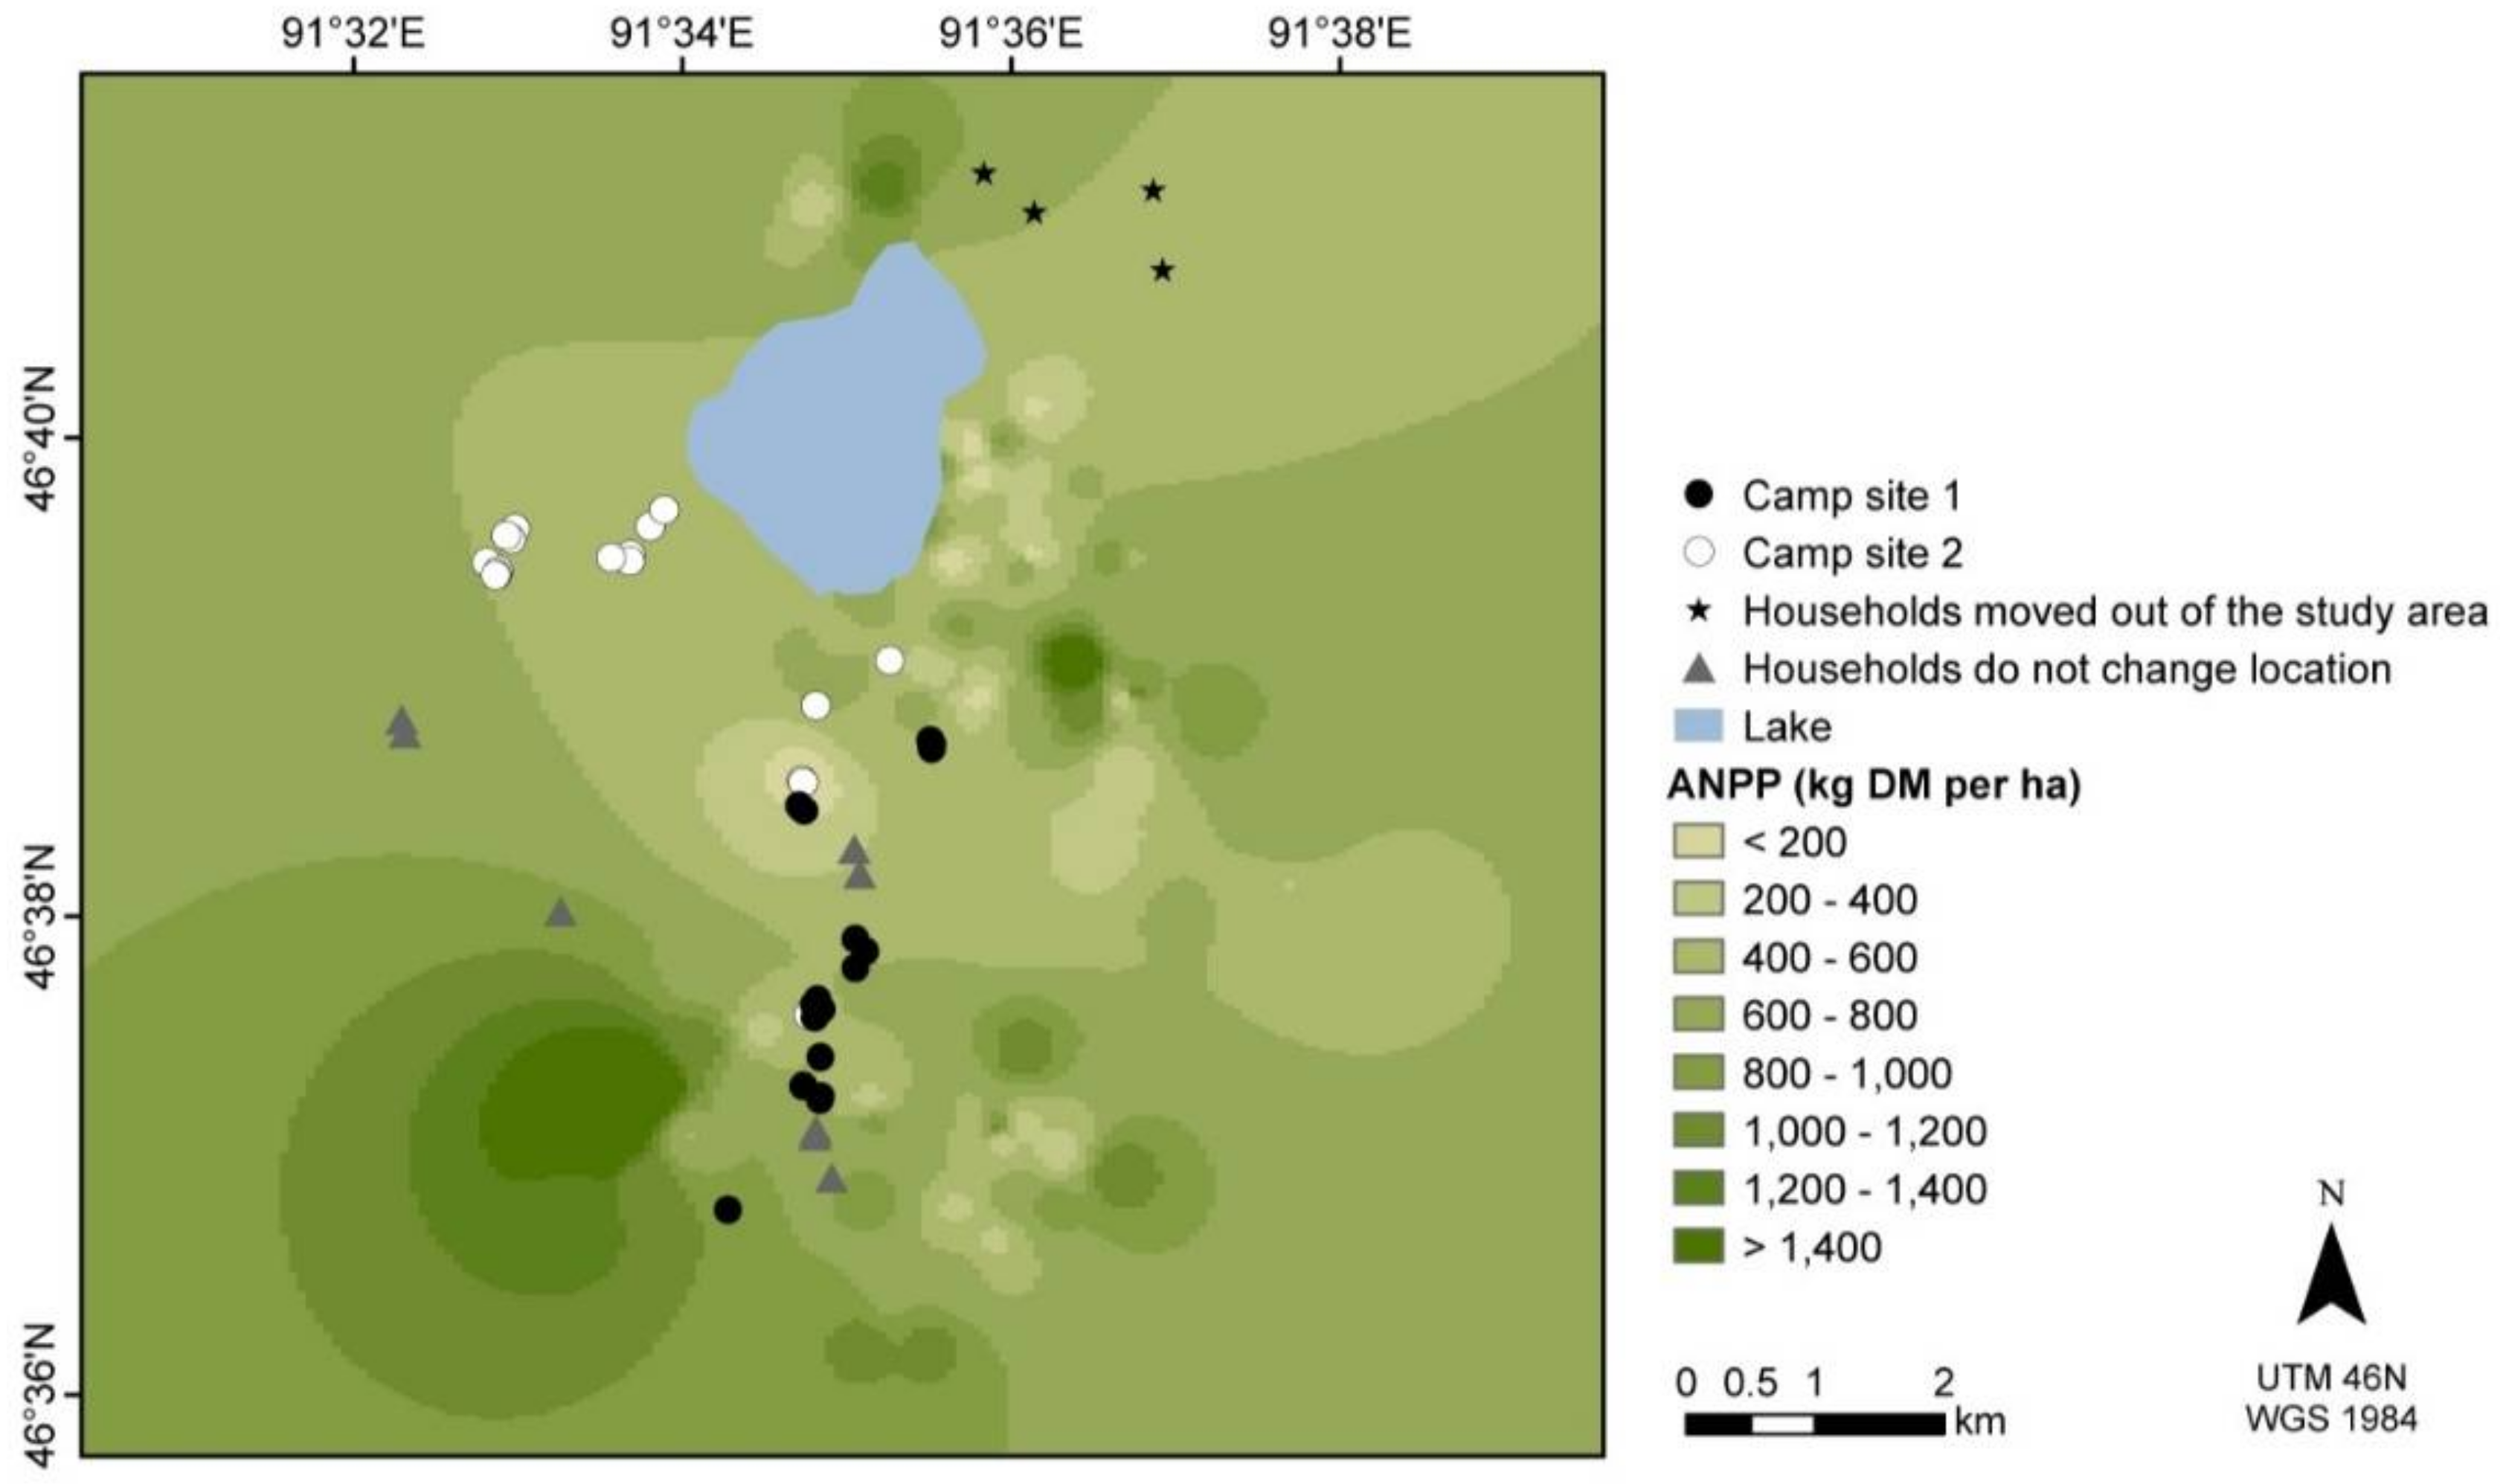
Ninety-four percent of respondents reported coming to Tsunhal Nur every year. Of the 31 households interviewed, two originating from Khovd aimag reported that in summer 2014 their preferred camp site was already occupied when they arrived. The majority of camps were initially set up in one southern valley, with camp sites extending north towards the lake. With their move to camp site 2 (Figure 2, white dots), 19 households travelled 3.2 ± 0.73 km from their first camp sites (Figure 2, black dots). They moved deeper into the valleys and north-westwards towards the lake, whereby most of these areas had already been grazed during camping (of other households) at site 1. In particular, 14 out of the 16 Uriankhai households moved into areas already grazed by horses, camels, and some bovine and small ruminant herds of eight households who did not change camp sites in 2014 (Figure 2, grey triangles). The four households on the north side of the lake moved out of the study area during the site-change period (Figure 2, black stars), among them two Uriankhai households. Five of the six Torguud households moved into areas vacated by the Uriankhai, whereas eight Kazakh households either left the study area or did not move.
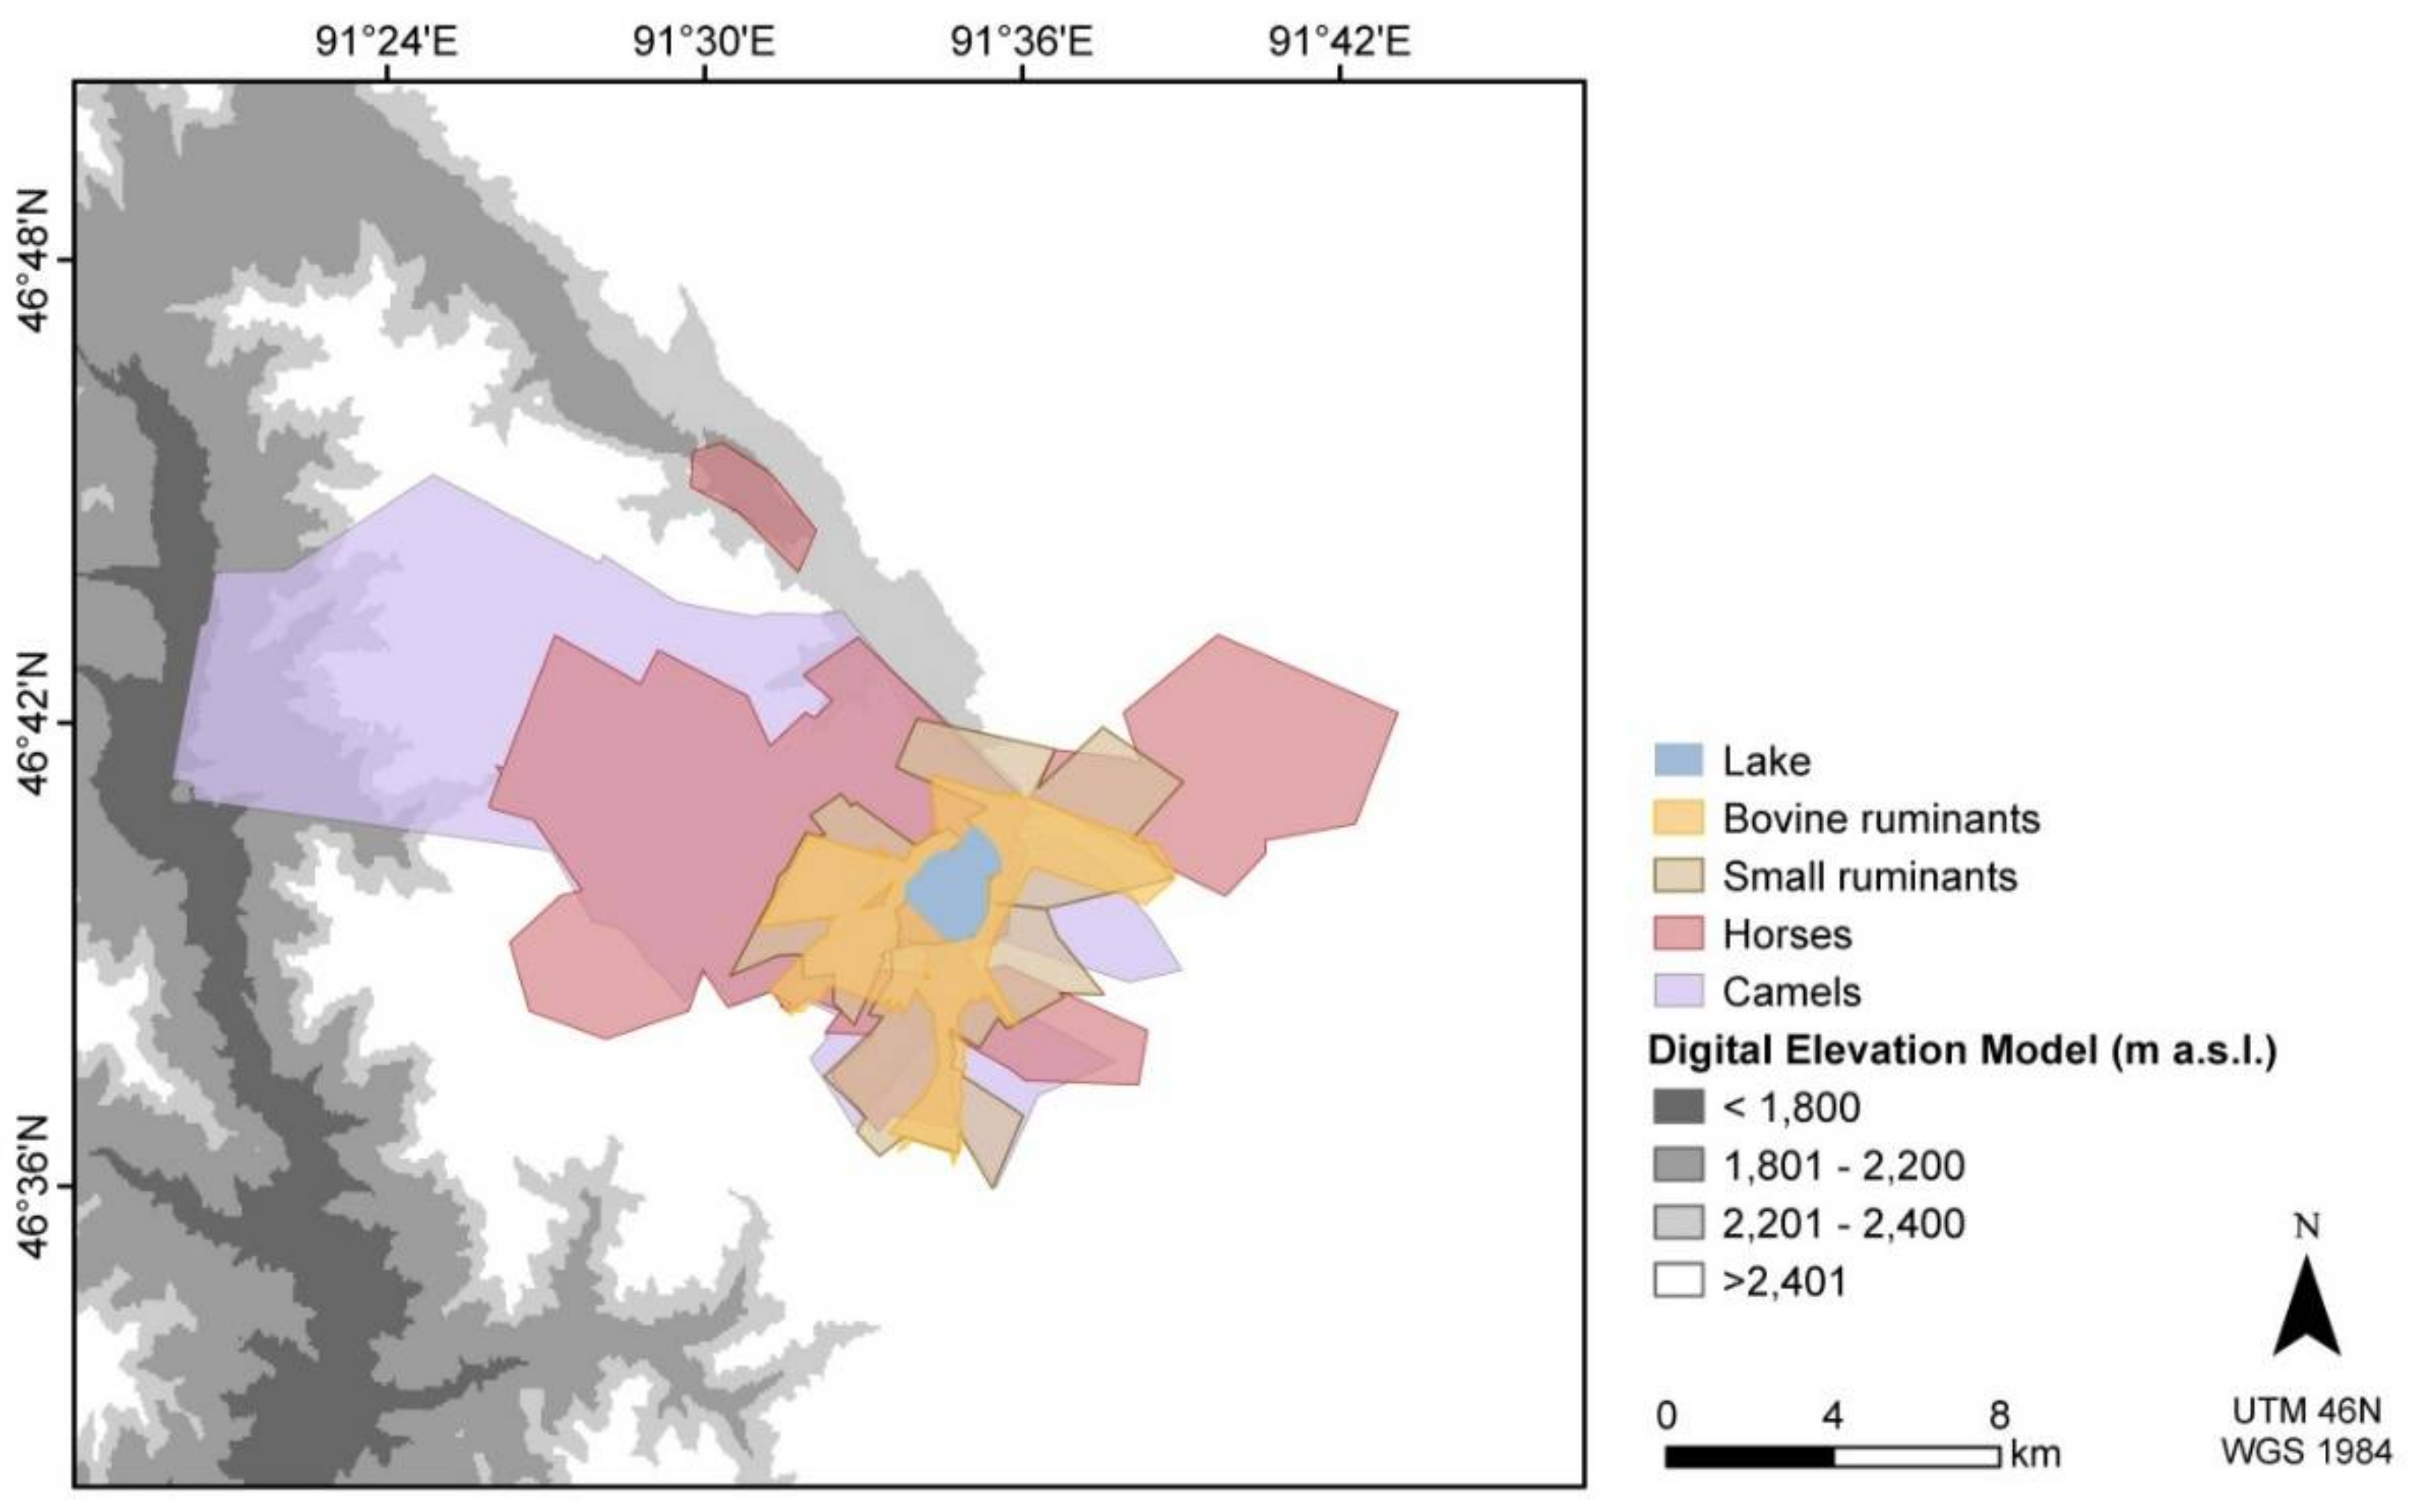
The study area can be loosely divided into grazing areas by animal/herd type, as is represented in Figure 3. In total, 231 km2 of rangeland was used for grazing in summer 2014. Of these, 213 km2 were used in the first half (period 1) of the stay on summer pasture (i.e., around the first camp sites) and 161 km2 in the second half (period 2) of summer pasture stay (i.e., around the second camp sites), leading to an overlap of 159 km2 between period 1 and 2. The small ruminants grazed an area of 45 km2 in the first and 26 km2 in the second half of summer pasture stay, with 20 km2 grazed in both periods. The bovine ruminants grazed 27 km2 and 17 km2 in period 1 and 2, respectively, with the overlap between period 1 and 2 equaling 17 km2. The horse ranges in period 1 and 2 were 117 km2 and 68 km2, with the decrease resulting from families moving out of the study area and taking their horses with them. Horse ranges overlapped substantially with bovine and small ruminant ranges, totaling 34 km2 of overlap over the entire study period. Camels wander for weeks across the countryside and are only re-captured to migrate to a new seasonal pasture; therefore, their ranges made up the largest surface of the identified area, totaling 166 km2 and 127 km2 for period 1 and 2, respectively. Again, the reduction in camel range size was a result of households leaving the study area. Across the whole study period, small ruminants grazed 51 km2, bovine ruminants grazed 27 km2, horses and camels utilized 134 km2 and 171 km2, respectively. Per khot ail, the median small ruminant range size was 197 ha (total: 30,771 ha, n = 19) over the entire study period, and the median bovine ruminant range size was 109 ha (total: 20,751 ha, n = 18). The range sizes of the specific animal groups were not linearly correlated with the seasonal stocking rate of a household or khot ail, respectively.
Above ground net primary production was variable across the landscape (Figure 2), leading to great variation in the biomass on offer as forage on the ranges of different households’ herds. The average ANPP directly prior to the start of the grazing period was 655 ± 46 kg DM ha−1; thereby the highest yields were found at higher elevations and further away from the camp sites, while the lowest values were present for flat areas around the lake and in all low-lying areas. At the onset of the summer grazing period, the average ANPP per khot ail small ruminant range varied between 424 kg DM ha−1 and 1053 kg DM ha−1 with a median of 611 kg DM ha−1 and a mean of 627 ± 169 kg DM ha−1 (n = 19).
3.2. Stocking Rates and Grazing Pressure
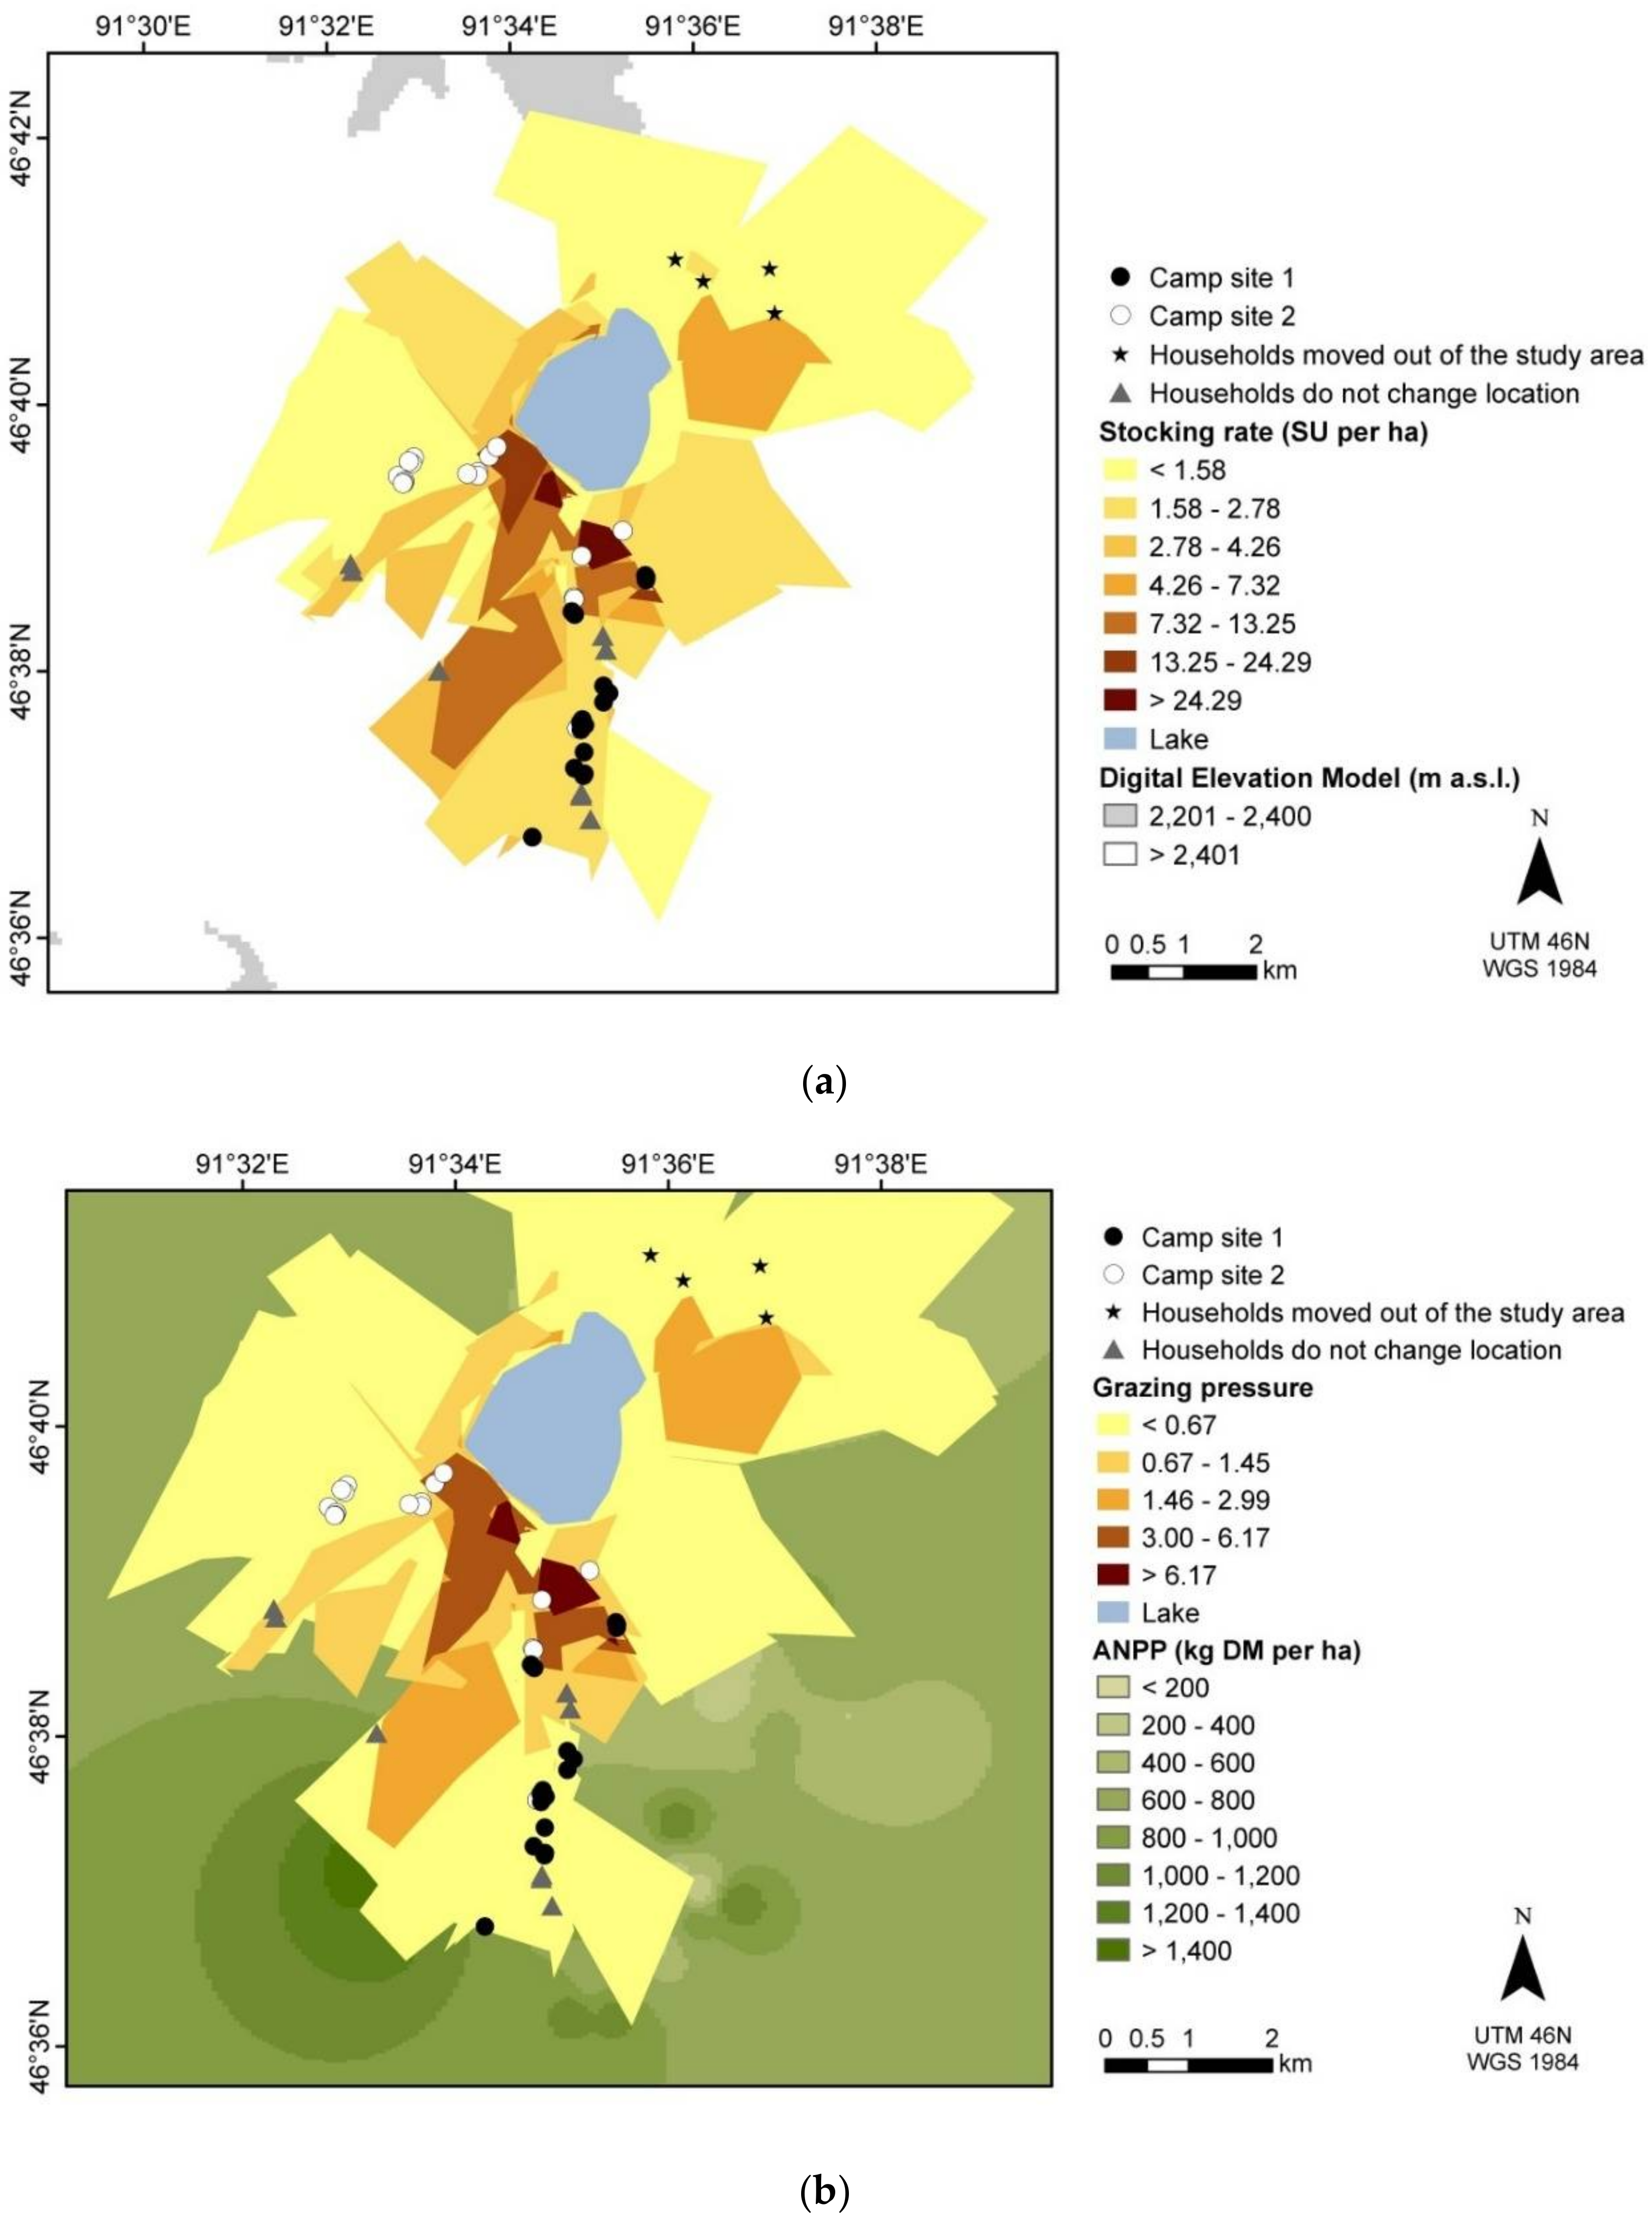
According to the calculated stocking rates, a number of heavily grazed areas can be identified (Figure 4a). Stocking rates were highest near camps and water sources, which are congested and grazed by both small and bovine ruminant herds (Figure 3). Critical areas appear to be those of overlap between period 1 and 2—especially the southern valley was heavily inhabited and supported households and herds throughout the entire summer. By integrating stocking rate information with the ANPP data, grazing pressure around Tsunhal Nur can also be assessed (Figure 4b). Hereby, a grazing pressure index >1 equates to an area where the ANPP is exceeded by the animals’ demand for fodder, pointing thus to the risk of overuse. A total of 1609 ha can be identified where biomass demand exceeded supply in summer 2014; these areas are at risk of (further) degradation. The southern valley and the south and east lakeshore had large pockets of low ANPP (<500 kg DM ha−1; data not shown) indicating high grazing pressure. The east side of the lake is also used as a road.
3.3. Household Herd Management and Decision-Making
The associations between herd management practices and the ethnic groups were tested by regressing various aspects (khot ail size, proportion of livestock assets invested in a given species (Table 1), and stocking densities) on dummy variables for ethnicity using generalized least squares. Notable differences in herd management (Table 2) between the ethnic groups became apparent, but no ethnic group was found to have consistently higher or lower seasonal stocking rates. Interestingly, the Uriankhai khot ails were composed of more households than the Kazakh and Toguud khot ails. The Uriankhai herded in groups that were on average 3.73 households larger than the khot ail of their counterparts (p < 0.001). In addition, average Torguud khot ail were significantly smaller than the overall average of the other two ethnicities (p = 0.009). The mean Kazakh khot ail size was 2.0 ± 0.9 households (n = 6), the mean Torguud khot ail size was 1.4 ± 0.5 households (n = 4), and the mean Uriankhai khot ail size was 4.6 ± 2.9 households (n = 6). Kazakh households kept a larger proportion of their total livestock assets in small ruminants (Table 1)—on average, an additional 13% of the household’s livestock asset was accounted for by small ruminants in Kazakh households as compared to the other ethnic groups (p = 0.007). On the other hand, Uriankhai households possessed 9% fewer small ruminants as a portion of their stock (p = 0.042) and 12% more bovine ruminants (p = 0.002) than the other two groups (Table 2). Uriankhai bovine herds were also different in composition from the average bovine herd at Tsunhal Nur: in pure numbers, Uriankhai households had 14% more yaks in their bovine herd (p = 0.006). Finally, Torguud households possessed 16% more horses (Table 2) than the non-Torguud households (p = 0.012).
Sixty-eight percent of the interviewed herders stated that they believed there was plenty of vegetation for their animals when they arrived at Tsunhal Nur in June 2014. However, the remaining 32% felt that there was scant vegetation available for their herds. Nonetheless, most herders stated that when the range quality and forage availability is poor, their management strategy is to change their camp site and grazing area on the summer pasture (Table 3). Three respondents mentioned leaving the summer pasture and travelling early to the autumn pasture when forage availability on summer pasture declines. Four of the herders reported that they would take no action when grazing resources appear to decrease at Tsunhal Nur. Long-standing tradition was mentioned by 71% of respondents as the leading reason as to why they came to Tsunhal Nur for summer grazing. Households reported choosing their camp site based on: tradition and social capital (move with khot ail), vegetation (quantity) available for herds, altitude (lower altitude with warmer climate was preferred), good terrain (open, relatively flat) for herding activities (i.e., riding horses, riding motorcycles, sightline to herd from ger), and water availability near the camp site, respectively.
4. Discussion
Our study is not the first participatory mapping project working with animal husbandry-based populations. In Botswana, Basupi et al. [23] used a cognitive mapping process and a participatory GIS approach to assess the effect of land subdivision and privatization on pastoralist grazing patterns and spatial mobility. Other studies have used participatory mapping with Borana pastoralists in southern Ethiopia to determine how resource users perceive their surroundings and choose grazing grounds [22], especially under increased resource sharing [21]. However, despite the reported success of participatory mapping, this approach has rarely been applied in Mongolia. To date, there are only two documented cases in the international literature—one of which dates back to 1991 [28] and the other does not fully explain whether a map was used as a part of the survey [29]. Due to the local novelty of the method, as well as its proven suitability for application in pastoralist animal husbandry systems, participatory mapping appeared to be a good fit for surveying the Tsunhal Nur summer pasture.
On the other hand, Tsunhal Nur, with its complex social and administrative setting, also provided a sufficiently challenging platform for testing the usefulness of the participatory mapping approach. Carrying out the mapping required prior training of investigators with GIS software, as well as experience with the household interviews. The majority of respondents appeared eager to participate given that they were able to immediately experience (partial) results, creating a feeling of ownership. As Bauer [25] noted, participatory mapping techniques promote a cooperative environment of equality where participants can easily adjudicate information collected by the researcher. In addition, the process encourages the exchange of information and views between peers [39]. This aspect proved essential to our study, not only at the individual herder-researcher level but also for inter- and intra-khot ail communication.
The usual context of an interview involved a visit over tea in the ger, mostly in the early afternoon. The visits would frequently inspire neighbouring herders to drop in and engage in a discussion about herding practice and rangeland use, which eventually resulted in herders sharing land use information that may not have otherwise been shared. One example from our study includes two herders from the same khot ail who were taking turns in herding the small ruminants of their kinship group but selected completely different ranges. One herder reported that he sent the animals to the west, whereas the second herder stated that when he was responsible for herding, the animals were sent east. Had we encountered this inconsistency of information first during the analytical process off the pasture, we might have assumed that one herder was confused by the satellite photo or that the herders were not part of the same khot ail. Nevertheless, because the results were visualized on site, the spatial breadth and variability of information [25,39] were directly addressed. In turn, the herders also walked away more informed regarding the local rangeland use. Through dialogue we were furthermore able to detect on-site inter-khot ail inconsistencies. For example, the majority of the khot ail leave their horses to graze in the hills west of the lake. Accordingly, if asked, most herders would nonchalantly state that the hills are the designated horse range. However, through our exercise we were able to determine that there are also horse ranges in all other directions that often overlap with bovine and small ruminant ranges. The instant visualization led some respondents to admit that there is no specific horse area, contrary to what was previously perceived. Therefore, jointly creating and viewing the maps motivated the herders to reflect on what they individually assumed to be occurring on the common property pasture, compared to what is cumulatively taking place [39].
In addition, our use of GIS software added a valuable interactive component between researcher and stakeholders. During the revisits at camp site 2, respondents would frequently ask to see the outcome of the study thus far. We were more than willing to comply and would first show them their input from the first visit and afterwards would open the other recorded land use polygons one-by-one (because all polygons were saved separately). Although this gradual addition of polygons was done because of hardware limitations it appeared to make an imposing effect, as herders realized just how much resource overlap was occurring. For example, a herder had mentioned to the interviewer that his pasture use did not overlap much with his neighbours’, because for management reasons it is important to keep the herds apart. Spatial separation is a means to avoid herd mixing [40]; yet, when considering the herd distribution maps it became apparent that temporal separation (time of day and season) predominates over spatial separation. Another example is that although 32% of the herders claimed that forage availability was limiting for their herds, during the survey respondents often commented that few households implement measures to mitigate rangeland degradation. Although migrating further and more frequently was mentioned by approximately 30% of the respondents as a measure to mitigate localized rangeland degradation, the grazing pressure index at Tsunhal Nur was >1 on 1609 ha near the lake. Households coincidentally moved into already grazed areas for their camp site 2, even though these sites had only very recently been vacated by other households (others’ camp site 1). Therefore, the cumulative maps enabled the herders to see the rangeland from a collective perspective [22], which they would have been less likely to perceive without this tool. The simplicity of overlapping individual herd polygons in GIS can assist in the process of jointly rethinking resource use amongst the herders [39].
However, the initiation of dialogue was not the main focus of our research. Using the basic information on animal numbers and their spatial and seasonal or monthly distribution, we were able to successfully identify heavily grazed areas. Based on the ANPP data of the herbaceous vegetation, we also concluded that these areas are being degraded through intense grazing. Intensely used communal grazing areas were also identified by Wario et al. [22], relying on Borana herders’ oral classification of pasture resources. In the Altay Mountains, the highly preferred and thus congested flat terrain is where the majority of animals and families reside throughout the summer and unsurprisingly flat areas were at risk of degradation according to both the seasonal stocking rate (Figure 4a) and grazing pressure index (Figure 4b) maps. In fact, these areas (southern valley and east lakeshore) also had a low ANPP prior to the start of grazing (depicted in Figure 2), which indicates that heavy use in subsequent years has adverse effects on rangeland productivity [41]. The similarity of seasonal stocking rate (Figure 4a) and grazing pressure maps (Figure 4b) illustrates that the use of participatory mapping interviews plus animal counts (alone) or in combination with (remotely-sensed) biomass assessment is a suitable method that can be implemented to prioritize areas for rangeland monitoring [29] and identify zones that need to be set aside for grazing rest and recovery [22].
The next step in the process of contributing to better rangeland management at Tsunhal Nur would involve analytic deliberation and dialogue between scientists and resource users based on environmental and sociological data [42], in order to adjust the traditional rangeland allocation for small ruminants, more advantageously utilize available forage resources, and set aside degraded areas to regenerate, ceteris paribus. For this step, information on household herd management factors, understanding the local perception of the problem [36], as well as knowledge exchange are key to collaboratively developing locally adapted solutions [43]. Procuring information on local diversity and governance complexity is necessary to elaborate sound land use management approaches [22], as underlined by the differences in herd characteristics and camp site choice, especially based on ethnicity. In contrast to Lkhagvadorj et al. [8], who stated that nationally the Kazakh minority have less education and lower incomes compared to the average Mongolian, at Tsunhal Nur, the Kazakh households had similar livestock assets and pasture access as the Uriankhai and Torguud. Nonetheless, it should be noted that the Torguud and Kazakh households originating from Khovd aimag are disadvantaged in their access to pasture, since the Bayan-Ulgii aimag households (mainly Uriankhai and some Kazakh) have priority over camp site choice and pasture access in the study region. These groups choose their grazing areas based on tradition, while the Kazakh and Torguud from Khovd aimag also choose camp sites based on tradition, but only from the remaining areas available. Such complexity needs to be understood and incorporated into local resource management [44].
Participatory mapping, especially in combination with other low-tech approaches, provided a quick and easy way to gather information about natural resource allocation and use in an isolated region; however, we also encountered drawbacks. First, because different kinds of data require different methods, there can be problems of scale and resolution inconsistencies [45]—in our case, between the level of detail a respondent chose to draw his/her ranges. Secondly, the choice of mapping tools can result in more, or less, suitable data for the desired outcomes, i.e., the method should match the level of participant technological literacy [46] to ensure reliable data. In our case, the interview-based areal data needed to be georeferenced to enable overlay with ANPP data. We chose to use a satellite image in order to show the most currently available geographical data to the respondents. Yet, it became clear during the survey that not all respondents were able to orientate their whereabouts consistently on a satellite image. Therefore, we pointed out known land marks on the image throughout every exercise, and multiple households per khot ail were interviewed wherever possible. We also found that the more participants were interviewed, the more discourse was undertaken in the community; however, due to logistical reasons (camp site outside defined study area) or time constraints, not everyone could be interviewed, imparting a possible power- and/or ownership-imbalance [45,47] and spatially diffused data inaccuracies (e.g., for the majority of the horse and camel ranges we have no data on small and bovine ruminants grazing there, although households with herds existed in those (remote) areas).
Looking forward, participatory mapping should be incorporated into local resource monitoring initiatives in order to follow long(er) term rangeland use [23,48]. Further studies should be conducted to determine if the participatory mapping exercise and resulting maps also had a direct effect on local rangeland management (maps were presented to local authorities upon the completion of the study). Follow-up is crucial to fully appreciating the method’s actual impact in addressing rangeland use and access to resources; Fisher et al. [49] were able to take the method one step further and formalize local regulation systems amongst stakeholders. In addition, long term monitoring is especially relevant given that, in our study, a household’s date of arrival on the summer pasture mostly depends on climatic seasonality, and in the face of a changing climate, Mongolia will likely become much warmer and drier [50]. This could lead households to move into the mountains earlier and for longer periods of time, as snow may melt sooner or forage resources may be depleted more quickly on the low-lying, warmer and drier spring pastures. Such changes could add more stress to the local ecosystem, but could possibly be mitigated if accounted for through local monitoring and management [51].
5. Conclusions
GIS-supported participatory mapping was found appropriate to quickly and effectively record spatial information on rangeland use in an otherwise data-poor region of Mongolia. When merged with information on animal numbers, critical areas of high seasonal stocking rates and thus intense grazing could be identified; however, when animals’ forage requirements and spatial data on biomass production are additionally included, areas prone to degradation can be detected with better certitude. Both stocking rate and grazing pressure maps can be used to prioritize areas for rangeland monitoring and help in the identification of more sustainable rangeland use strategies. Although not the main purpose of our study, the participatory mapping exercise encouraged herders to reflect upon and discuss their collective rangeland use; although many herders acknowledged unsustainable grazing practices, their individual perception of this problem sometimes strongly diverged from the collective reality. These differences need to be comprehensively understood and incorporated into the creation of local management plans.
Author Contributions
All authors were involved in the conceptualization of the study. G.J. collected and analysed the biomass (ANPP) data and formatted the figures. Interviews and subsequent data analysis were conducted by B.A. The text was jointly written by all three authors.
Funding
This research was funded by the International Fund for Agricultural Development (IFAD; grant I-R-1284), Rome, Italy.
Acknowledgments
This work was carried out in the framework of the WATERCOPE project funded by the International Fund for Agricultural Development (IFAD; grant I-R-1284), Rome, Italy. The first author was supported with a personal scholarship by DITSL GmbH Witzenhausen, Germany. Special thanks go to the many families at Tsunhal Nur who welcomed us into their homes. We are grateful to Galbadrakh Batochir, Ganzorig Gonchigsumlaa and Munkhnasan Tsevegmed for their superb work as translators and facilitators. We profoundly appreciate the administrative and logistical support by Nyambayar Dashzeveg from the National University of Mongolia and Togtokhbayar Norovsambuu from the Mongolian University of Life Sciences, as well as by Andreas Buerkert and Sven Goenster-Jordan from the University of Kassel, Germany. All households and household members, respectively, who participated in this interview-based study, did so voluntarily after having been informed about the aims and scope of the study and with the insurance that their identity would not be revealed.
Conflicts of Interest
The authors declare no conflict of interest.
References
- Fernández-Giménez, M.E. Spatial and social boundaries and the paradox of pastoral land tenure: A case study from postsocialist Mongolia. Hum. Ecol. 2002, 30, 49–78. [Google Scholar] [CrossRef]
- Badarch, D.; Batsukh, N.; Batmunkh, S. The impacts of industrialization in Mongolia. In Mongolia Today: Science, Culture, Environment and Development; Badarch, D., Zilinskas, R.A., Balint, P.J., Eds.; Routledge Curzon: London, ON, Canada, 2003; pp. 3–20. ISBN 0700715983. [Google Scholar]
- Dashnyam, N. Sustainable livestock development in Mongolia. Int. Rev. Environ. Strateg. 2003, 4, 287–296. [Google Scholar]
- Lkhagvadorj, D.; Hauck, M.; Dulamsuren, C.; Tsogtbaatar, J. Twenty years after decollectivization: Mobile livestock husbandry and its ecological impact in the Mongolian forest-steppe. Hum. Ecol. 2013, 41, 725–735. [Google Scholar] [CrossRef]
- Jordan, G.; Goenster, S.; Tsevegmed, M.; Shabier, A.; Buerkert, A.; Schlecht, E. Spatio-temporal patterns of herbage availability and livestock movements: A cross-border analysis in the Chinese-Mongolian Altay. Pastoralism 2016, 6, 12. [Google Scholar] [CrossRef]
- Addison, J.; Friedel, M.; Brown, C.; Davies, J.; Waldron, S. A critical review of degradation assumptions applied to Mongolia’s Gobi Desert. Rangel. J. 2012, 34, 125–137. [Google Scholar] [CrossRef]
- Fernández-Giménez, M.E. The role of Mongolian nomadic pastoralists’ ecological knowledge in rangeland management. Ecol. Appl. 2000, 10, 1318–1326. [Google Scholar] [CrossRef]
- Lkhagvadorj, D.; Hauck, M.; Dulamsuren, C.; Tsogtbaatar, J. Pastoral nomadism in the forest-steppe of the Mongolian Altai under a changing economy and a warming climate. J. Arid Environ. 2013, 88, 82–89. [Google Scholar] [CrossRef]
- Lee, J.H.; Kakinuma, K.; Okuro, T.; Iwasa, Y. Coupled social and ecological dynamics of herders in Mongolian rangelands. Ecol. Econ. 2015, 114, 208–217. [Google Scholar] [CrossRef]
- Wan, H.; Bai, Y.; Hooper, D.U.; Schönbach, P.; Gierus, M.; Schiborra, A.; Taube, F. Selective grazing and seasonal precipitation play key roles in shaping plant community structure of semi-arid grasslands. Landsc. Ecol. 2015, 30, 1767–1782. [Google Scholar] [CrossRef]
- Kakinuma, K.; Okayasu, T.; Sasaki, T.; Jamsaran, U.; Okuro, T.; Takeuchi, K. Rangeland management in highly variable environments: Resource variations across the landscape mediate the impact of grazing on vegetation in Mongolia. Grassl. Sci. 2013, 59, 44–51. [Google Scholar] [CrossRef]
- Wang, J.; Brown, D.G.; Agrawal, A. Climate adaptation, local institutions, and rural livelihoods: A comparative study of herder communities in Mongolia and Inner Mongolia, China. Glob. Environ. Chang. 2013, 23, 1673–1683. [Google Scholar] [CrossRef]
- Addison, J.; Brown, C. A multi-scaled analysis of the effect of climate, commodity prices and risk on the livelihoods of Mongolian pastoralists. J. Arid Environ. 2014, 109, 54–64. [Google Scholar] [CrossRef]
- Stumpp, M.; Wesche, K.; Retzer, V.; Miehe, G. Impact of grazing livestock and distance from water source on soil fertility in southern Mongolia. Mt. Res. Dev. 2005, 25, 244–251. [Google Scholar] [CrossRef]
- Turner, M.D. Long-term effects of daily grazing orbits on nutrient availability in Sahelian West Africa: I. Gradients in the chemical composition of rangeland soils and vegetation. J. Biogeogr. 1998, 25, 669–682. [Google Scholar] [CrossRef]
- Wang, Y.; Wesche, K. Vegetation and soil responses to livestock grazing in Central Asian grasslands: A review of Chinese literature. Biodivers. Conserv. 2016, 25, 2401–2420. [Google Scholar] [CrossRef]
- Fernández-Giménez, M.E.; Allen-Diaz, B. Testing a non-equilibrium model of rangeland vegetation dynamics in Mongolia. J. Appl. Ecol. 1999, 36, 871–885. [Google Scholar] [CrossRef] [Green Version]
- Ulambayar, T.; Fernández-Giménez, M.E.; Baival, B.; Batjav, B. Social outcomes of community-based rangeland management in Mongolian steppe ecosystems. Conserv. Lett. 2016, 10, 317–327. [Google Scholar] [CrossRef]
- Addison, J.; Davies, J.; Friedel, M.; Brown, C. Do pasture user groups lead to improved rangeland condition in the Mongolian Gobi Desert? J. Arid Environ. 2013, 94, 37–46. [Google Scholar] [CrossRef]
- Yayneshet, T.; Treydte, A.C. A meta-analysis of the effects of communal livestock grazing on vegetation and soils in sub-Saharan Africa. J. Arid Environ. 2015, 116, 18–24. [Google Scholar] [CrossRef]
- Wario, H.T.; Roba, H.G.; Kaufmann, B. Responding to mobility constraints: Recent shifts in resource use practices and herding strategies in the Borana pastoral system, southern Ethiopia. J. Arid Environ. 2016, 127, 222–234. [Google Scholar] [CrossRef]
- Wario, H.T.; Roba, H.G.; Kaufmann, B. Shaping the herders ‘mental maps’: Participatory mapping with pastoralists’ to understand their grazing area differentiation and characterization. Environ. Manag. 2015, 56, 721–737. [Google Scholar] [CrossRef] [PubMed]
- Basupi, L.V.; Quinn, C.H.; Dougill, A.J. Using participatory mapping and a participatory geographic information system in pastoral land use investigation: Impacts of rangeland policy in Botswana. Land Use Policy 2017, 64, 363–373. [Google Scholar] [CrossRef] [Green Version]
- Brown, G.; Raymond, C.M. Methods for identifying land use conflict potential using participatory mapping. Landsc. Urban Plan. 2014, 122, 196–208. [Google Scholar] [CrossRef]
- Bauer, K. On the politics and the possibilities of participatory mapping and GIS: Using spatial technologies to study common property and land use change among pastoralists in Central Tibet. Cult. Geogr. 2009, 16, 229–252. [Google Scholar] [CrossRef]
- Brown, G. Public participation GIS (PPGIS) for regional and environmental planning: Reflections on a decade of empirical research. J. Urban Reg. Inf. Syst. Assoc. 2012, 25, 7–18. [Google Scholar]
- Ykhanbai, H.; Bulgan, E.; Beket, U.; Vernooy, R.; Graham, J. Reversing grassland degradation and improving herders’ livelihoods in the Altai Mountains of Mongolia. Mt. Res. Dev. 2004, 24, 96–100. [Google Scholar] [CrossRef]
- Mearns, R.; Shombodon, D.; Narangerel, G.; Tuul, U.; Enkhamgalan, A.; Bayanjargal, A.; Bekhsuren, B. Natural resource mapping and seasonal variations and stresses in Mongolia. RRA Notes 1994, 20, 95–105. [Google Scholar]
- Joly, F.J.C.; Samdanjigmed, T.; Cottereau, V.; Feh, C. Ecological constraints on and consequences of land use heterogeneity: A case study of the Mongolian Gobi. J. Arid Environ. 2013, 95, 84–91. [Google Scholar] [CrossRef]
- Tsvegemed, M.; Shabier, A.; Schlecht, E.; Jordan, G.; Wiehle, M. Evolution of rural livelihood strategies in a remote Sino-Mongolian border area: A cross-country analysis. Sustainability 2018, 10, 1011. [Google Scholar] [CrossRef]
- Goenster-Jordan, S.; Urban, B.; Buerkert, A. Landscape development and reconstruction of major climate variations in the central Mongolian Altai Mountains during the late Holocene based on pollen and palaeopedological analysis. J. Arid Environ. 2018. under review. [Google Scholar]
- Rudaya, N.; Tarasov, P.; Dorofeyuk, N.; Solovieva, N.; Kalugin, I.; Andreev, A.; Daryin, A.; Diekmann, B.; Riedel, F.; Tserendash, N.; et al. Holocene environments and climate in the Mongolian Altai reconstructed from the Hoton-Nur pollen and diatom records: A step towards better understanding climate dynamics in Central Asia. Quat. Sci. Rev. 2009, 28, 540–554. [Google Scholar] [CrossRef] [Green Version]
- Jarvis, A.; Reuter, A.; Guevara, E. International Centre for Tropical Agriculture (CIAT). Hole-Filled Seamless SRTM Data V4. 2008. Available online: http//srtm.csi.cgiar.org (accessed on 1 November 2014).
- Finke, P. Nomaden im Transformationsprozess: Kasachen in der Post-Sozialistischen Mongolei; LitVerlag: Muenster, Germany, 2005; ISBN 3-8258-6964-4. [Google Scholar]
- Bryman, A.; Teevan, J.J.; Bell, E. Social Research Methods, 2nd ed.; Oxford University Press: Don Mills, ON, Canada, 2009; ISBN 0195429869. [Google Scholar]
- Fernández-Giménez, M.E. The role of ecological perception in indigenous resource management: A case study from the Mongolian forest-steppe. Nomadic People 1993, 33, 31–46. [Google Scholar]
- Hu, Z.; Zhang, D. Country Pasture/Forage Resource Profiles: China; Food and Agriculture Organization of the United Nations (FAO): Rome, Italy, 2006; pp. 1–63. [Google Scholar]
- Murray, A.T.; Shyy, T.K. Integrating attribute and space characteristics in choropleth display and spatial data mining. Int. J. Geogr. Inf. Sci. 2000, 14, 649–667. [Google Scholar] [CrossRef]
- Talen, E. Bottom-up GIS: A new tool for individual and group expression in participatory planning. J. Am. Plan. Assoc. 2000, 66, 279–294. [Google Scholar] [CrossRef]
- Dwyer, M.J.; Istomin, K.V. Theories of nomadic movement: A new theoretical approach for understanding the movement decisions of Nenets and Komi reindeer herders. Hum. Ecol. 2008, 36, 521–533. [Google Scholar] [CrossRef]
- Wang, Y.; Heberling, G.; Görzen, E.; Miehe, G.; Seeber, E.; Wesche, K. Combined effects of livestock grazing and abiotic environment on vegetation and soils of grasslands across Tibet. Appl. Veg. Sci. 2017, 20, 327–339. [Google Scholar] [CrossRef]
- Dietz, T.; Ostrom, E.; Stern, P.C. The struggle to govern the commons. Science 2003, 302, 1907–1912. [Google Scholar] [CrossRef] [PubMed]
- Fernández-Giménez, M.E.; Batkhishig, B.; Batbuyan, B.; Ulambayar, T. Lessons from the Dzud: Community-based rangeland management increases the adaptive capacity of Mongolian herders to winter disasters. World Dev. 2015, 68, 48–65. [Google Scholar] [CrossRef]
- Thakadu, O.T. Success factors in community based natural resources management in northern Botswana: Lessons from practice. Nat. Resour. Forum 2005, 29, 199–212. [Google Scholar] [CrossRef]
- Hauck, J.; Görg, C.; Varjopuro, R.; Ratamäki, O.; Maes, J.; Wittmer, H.; Jax, K. ‘Maps have an air of authority’: Potential benefits and challenges of ecosystem service maps at different levels of decision making. Ecosyst. Serv. 2013, 4, 25–32. [Google Scholar] [CrossRef]
- Corbett, J. Good Practices in Participatory Mapping: A Review Prepared for the International Fund for Agricultural Development (IFAD); International Fund for Agricultural Development (IFAD): Rome, Italy, 2009; ISBN 978-92-9072-065-2. [Google Scholar]
- Sieber, R. Public participation geographic information systems: A literature review and framework. Ann. Assoc. Am. Geogr. 2006, 96, 491–507. [Google Scholar] [CrossRef]
- Adhiambo, M.P.; Kironchi, G.; Mureithi, S.; Kathumo, V. Assessing land use and land cover change using the participatory geographical information system (PGIS) approach in Nguruman Sub-catchment, Kajiado north Sub county, Kenya. J. Geogr. Reg. Plan. 2017, 10, 219–228. [Google Scholar] [CrossRef]
- Fisher, M.R.; Workman, T.; Mulyana, A.; Moeliono, M.; Yuliani, E.L.; Colfer, C.J.P.; Adam, U.E.F.B. Striving for PAR excellence in land use planning: Multi-stakeholder collaboration on customary forest recognition in Bulukumba, South Sulawesi. Land Use Policy 2017. [Google Scholar] [CrossRef]
- Dagvadorj, D.; Natsagdorj, L.; Dorjpurev, J.; Namkhainyam, B. Mongolian Assessment Report on Climate Change 2009; Ministry of Environment, Nature and Tourism: Ulan Bator, Mongolia, 2009. [Google Scholar]
- Angerer, J.; Han, G.; Fujisaki, I.; Havstad, K. Climate change and ecosystems of Asia with emphasis on Inner Mongolia and Mongolia. Rangelands 2008, 30, 46–51. [Google Scholar] [CrossRef]
Figure 1.
Study area within Mongolia ((b) dark grey polygon) including a CGIAR-CSI SRTM digital elevation model [33] and its spatial location around Tsunhal Nur ((a), black oval depicts Tsunhal Nur study area).
Figure 1.
Study area within Mongolia ((b) dark grey polygon) including a CGIAR-CSI SRTM digital elevation model [33] and its spatial location around Tsunhal Nur ((a), black oval depicts Tsunhal Nur study area).

Figure 2.
Above ground net primary production of herbaceous vegetation (ANPP, kg DM ha−1) and location of camp sites (small symbols) of herder households at Tsunhal Nur summer pasture in 2014. Circles depict households that moved from a camp site 1 (black: early June to late July) to a camp site 2 (white: late July–late August). Stars depict households that, after mid-July, moved out of the area, and grey triangles signify households that did not change camp site throughout June to August.

Figure 3.
Spatial distribution of bovine, camel, horse and small ruminants grazing areas at Tsunhal Nur summer pasture, as depicted by their owners in map-based interviews, aggregated across surveys held in June/July and late July for the 2014 summer season. Polygons of grazing areas are projected on a CGIAR-CSI SRTM digital elevation model [33] of the study region.

Figure 4.
Grazing intensity maps at Tsunhal Nur in summer 2014: (a) Spatial variation in seasonal stocking rates, (b) spatial variation in seasonal grazing pressure index and ANPP. For explanation of camp site symbols please refer to Figure 2.
Figure 4.
Grazing intensity maps at Tsunhal Nur in summer 2014: (a) Spatial variation in seasonal stocking rates, (b) spatial variation in seasonal grazing pressure index and ANPP. For explanation of camp site symbols please refer to Figure 2.


Table 1.
Average household property (±standard deviation) of different animal species (in absolute numbers), and total size of the herds (in sheep unit, SU) of the three ethnic groups utilizing Tsunhal Nur summer pasture in 2014.
Table 1.
Average household property (±standard deviation) of different animal species (in absolute numbers), and total size of the herds (in sheep unit, SU) of the three ethnic groups utilizing Tsunhal Nur summer pasture in 2014.
| Livestock Species | Kazakh (n = 8) | Torguud (n = 6) | Uriankhai (n = 16) | All Households (n = 31) | ||||
|---|---|---|---|---|---|---|---|---|
| Sheep and goats (n) | 165 | ±111 | 189 | ±137 | 115 | ±84 | 144 | ±109 |
| Cattle (n) | 18 | ±15 | 24 | ±19 | 19 | ±12 | 20 | ±15 |
| Yaks (n) | 3 | ±7 | 0 | ±0 | 5 | ±7 | 3 | ±6 |
| Horses (n) | 11 | ±7 | 26 | ±27 | 9 | ±4 | 13 | ±15 |
| Camels (n) | 4 | ±5 | 5 | ±5 | 3 | ±3 | 4 | ±4 |
| Total animals (SU) | 333 | ±229 | 457 | ±361 | 284 | ±162 | 332 | ±242 |
Table 2.
Herd management characteristics determined by bivariate generalized linear models, based on 31 households within 19 khot ail over three ethnic groups.
Table 2.
Herd management characteristics determined by bivariate generalized linear models, based on 31 households within 19 khot ail over three ethnic groups.
| Ethnic Group | Trends Compared to Other Households |
|---|---|
| Kazakh | – Larger fraction of small ruminants in household’s livestock asset |
| Torguud | – Favour horses |
| Uriankhai | – Herd in larger khot ail (based on number of households per khot ail) – Smaller fraction of small ruminants in household’s livestock asset – Larger fraction of bovine ruminants in household’s livestock asset – High proportion of bovine ruminants are yaks |
Table 3.
Open question respondent (n = 28) reported activities [A] or necessities [N] to improve rangeland condition on Tsunhal Nur summer pasture as determined by axial coding.
Table 3.
Open question respondent (n = 28) reported activities [A] or necessities [N] to improve rangeland condition on Tsunhal Nur summer pasture as determined by axial coding.
| Recommended Action to Improve Forage Resources | Mentions (#) |
|---|---|
| Change camp site and pasture more often [A] | 10 |
| More rainfall [N]/watering of rangelands [A] | 9 |
| Reduce animal numbers [A] | 3 |
| Manage grazing intensity with fencing [A] | 3 |
| More government regulation and protection of rangelands [N] | 2 |
| Improve livestock reproductive performance [N] | 1 |
| Reduce insect pests [N] | 1 |
| Move further between camp sites [A] | 1 |
| Pray/religious ceremony [A] | 1 |
| Do not know | 4 |
© 2018 by the authors. Licensee MDPI, Basel, Switzerland. This article is an open access article distributed under the terms and conditions of the Creative Commons Attribution (CC BY) license (http://creativecommons.org/licenses/by/4.0/).
Share and Cite
MDPI and ACS Style
Altmann, B.A.; Jordan, G.; Schlecht, E. Participatory Mapping as an Approach to Identify Grazing Pressure in the Altay Mountains, Mongolia. Sustainability 2018, 10, 1960. https://doi.org/10.3390/su10061960
AMA Style
Altmann BA, Jordan G, Schlecht E. Participatory Mapping as an Approach to Identify Grazing Pressure in the Altay Mountains, Mongolia. Sustainability. 2018; 10(6):1960. https://doi.org/10.3390/su10061960
Chicago/Turabian StyleAltmann, Brianne A., Greta Jordan, and Eva Schlecht. 2018. "Participatory Mapping as an Approach to Identify Grazing Pressure in the Altay Mountains, Mongolia" Sustainability 10, no. 6: 1960. https://doi.org/10.3390/su10061960
Note that from the first issue of 2016, this journal uses article numbers instead of page numbers. See further details here.