Article

Investigation of the Relationship among University–Research Institute–Industry Innovations Using a Coupling Coordination Degree Model

1
School of Economics and Management, Beihang University, Beijing 100191, China
2
School of Engineering, Nanjing Agricultural University, Nanjing 210031, China
*
Author to whom correspondence should be addressed.
Sustainability 2018, 10(6), 1954; https://doi.org/10.3390/su10061954
Submission received: 29 April 2018 / Revised: 6 June 2018 / Accepted: 7 June 2018 / Published: 11 June 2018
(This article belongs to the Section Sustainable Education and Approaches)

Abstract

:
With the socio-economic development in China, the central government pays more and more attention to innovations. Universities, research institutes, and industries (URI) are the main bodies of innovation. Therefore, in order to perform sustainable development of innovation, it is essential for Chinese policy makers to better understand the relationship among URI innovations. In this paper, indicators for evaluating URI innovations are collected, which are classified into three subsystems. Utilizing regional data from 2009–2015 in China, the entropy method is subsequently used to examine the contribution of indicators to the relative innovation subsystems. Then, a coupling coordination degree model is developed based on the physical concept “coupling” to investigate the relationship of URI innovation subsystems in China. The results reveal that in the period of study: (1) research and development (R&D) input and output indicators are both important to the regional innovation levels of URI, namely, they are critical for improving the coupling coordination degree among the three innovation subsystems; (2) There is an increasing trend of the coupling coordination of URI innovation system in China; however, the gap between regions/provinces becomes larger due to different innovative resource endowments and socio-economic development conditions. The results shown in this paper can provide important implications for policy makers to obtain the sustainable development of URI innovation subsystems in China.

1. Introduction

It is well known that universities and research institutes play a critical role to modern society through generating knowledge and educating large proportions of the population [1]. In addition to education and research, universities and research institutes have been undertaken different kinds of roles, such as public service, improving regional socio-economic development and national competitiveness, etc. Therefore, a “third mission” has been assigned to many universities and research institutes through strengthening contact with knowledge users and promoting technology transfer, on the initiative of government [2,3,4]. University–research institute–industry (URI) collaboration has been a vital and sustainable element in the innovation system [5]. Over the past 30 years, an innovation-oriented science policy has been adopted by many developed countries to facilitate the connection of universities and industries [6], such as the United States [7], Japan [8], Singapore [9], and European Union countries [10,11,12]. In China, since the 1950s, government has also encouraged universities to participate in the research works of down-stream to improve the quality of industrial outputs. As stated in the report to the 19th National Congress of the Communist Party of China in 2017, an innovative country will accelerate to be constructed, the forefront of science and technology in the world will be targeted, the basic research will be strengthened, and then, breakthroughs in forward-looking basic research and leading original achievements will be achieved [13]. However, there are still existing problems in the development of Chinese URI innovation collaboration. For example, the input structure of research funding in universities is unreasonable, where most of the funding are from governments (63.14% in 2016) and only a small part of the funding is from firms (30.51% in 2016) [14]. The development of URI collaboration is unbalanced among different regions. From the geographical distribution of the 144 winners owed first prize in the 2016 China-Industry-Research Cooperation Innovation Achievement Award, the number of institutions from Beijing, Jiangsu, Guangdong, Zhejiang, and Shanghai accounts for 66.67%; those in central region account for 12.5%, while those from the western region is even smaller. Therefore, strategies and methods are needed to be developed to cope with the problems, effectively transfer research results to Chinese industry to improve its competitiveness and innovation sustainability [15], and improve the effect of URI innovation cooperation. Among the strategies and methods, one of the critical steps is to investigate the dynamic state of coordination relationship of URI innovations in different regions in China. Examining the relationship can further provide diverse strategy for regions to improve the sustainability of URI innovation cooperation.
In the previous researches, numerous methods have been utilized to analyze the field of university–research institute–industry relations, such as regression [16], descriptive methods [17], and network analysis [18]. However, these methods are conducted on the basis of questionnaire or interview or survey, which use subjective data to analyze URI relation. Even though objective data can be obtained through survey, it is costly, laborious, time-consuming, and complex. Usually, the data are on the basis of the micro level. Besides this, after reviewing the previous researches, scholars often study one-way relationship among URI innovations. There is no scholar analyzing coupling relationship through various interactions among URI innovations. Examining this relationship can help policy makers understand the dynamic state of coordination of URI innovations in each region and know which innovation subsystem should be improved before making effective innovation policy. Based on the above analysis, it is essential to investigate coordination degree of the regional URI innovation system with objective data and coupling coordination degree model, which can maintain the innovation development in China to occur with a sustainable manner.
The remainder of this study is organized as follows: The previous researches concerning URI collaborations are mainly reviewed in Section 2. Materials and methods are presented in Section 3, which includes the descriptions of indicators and the computation steps of coupling coordination degree model. Section 4 analyzes the empirical results of coupling coordination degrees of regional URI innovation system in China. Then, based on the analysis, the conclusions and discussion of this study are summarized in Section 5.

2. Literature Review

In the previous researches, many scholars have analyzed the collaboration of the URI innovation system. For example, Feller et al. analyzed the impacts of universities on innovation in industry from surveys and interviews with 355 firms and found that firms mainly obtain the access to upstream modes of knowledge rather than specific products and processes [19]. Relying on a unique data-set sourcing from Capitalia survey, Maietta investigated how university activities effect enterprise innovation inputs and outputs from the perspective of a low-tech industry [20]. Based on the data from a unique firm-level dataset and regression model, Kafouros et al. examined how collaborations with universities and research institutes influence the ability of Chinese emerging market enterprises to develop innovations [21]. However, the researches above mainly discuss the influence of universities and research institutes on industries. Universities and research institutes are not only the contributors to industrial innovation, but also the recipients of industrial research and development (R&D) support [22]. Gulbrandsen and Smeby studied the influence of industry funding on research performance through questionnaire and regression [16]. They found that professors with industrial funding would carry out more applied research, cooperate more with other researchers both in academia and in industry, and report more scientific publications and industry outputs. By collaboration among universities, research institutes, and industries, the most significant benefit obtained by industries is access to new research and discoveries, and that gained by universities is to complement their academic research, such as providing funds for lab equipment, and searching for better insights for research [5]. Ankrah and Omar also elaborated the motivations for universities–industry collaboration [23]. For example, from the perspective of universities, the motivations are responsiveness to government policy [24], access complementary expertise [25], state-of-the art equipment and facilities [26], funding for research [27], test application of theory [28], etc. From the perspective of industry, they are commercializing technologies in universities [4], cost saving [29], solutions to specific problems [30], etc. In this respect, URI subsystems can interactive and benefit with each other through collaboration. In addition, there are also some scholars study the obstacles among the URI innovation system. For instance, drawing on a large-scale survey and public records, Bruneel et al. sought the nature of the obstacles to cooperation between universities and industry, and also explore effect of different mechanisms on lowing barriers [31]. Zhu et al. presented a dynamic analysis of industry–university–research institute cooperation conflict using interval grey numbers provided by decision makers [32]. Overall, scholars have paid much attention to the mutually motivation and obstacles for research collaboration among the URI innovation subsystems, and a lot of advances have been made in the previous researches. However, generally, the data used by these studies are mainly from questionnaire or interview which is subjective, or survey which is costly and time-consuming. Also, the data are mainly based on the micro-level. In addition, there is a lack of understanding concerning the coupling relationship among the URI innovations through various interactions.
Investigation and calculation of the coupling process among URI innovation systems are important for the realization of sustainable form of innovative society. Coupling, originating from physics, is a phenomenon where two or more indicators interact and affect with each other [33]. Due to its effectiveness to analyze the relationship between two or more subsystems, it has been widely used in the field of environment. For example, Li et al. and He et al. developed a coupling coordination degree model to examine the relationship between urbanization and environment in Lianyungang and Shanghai, respectively [33,34]. Also, with this model, Tang evaluates the coupling coordination between tourism and the environment [35]. However, this technique has seldom been applied to exam the relationship among URI innovation system. Considering the urgent requirement for building innovative society in China, it is critical to examine the coupling relationship among URI innovation system in each region, then provide rational innovation policy suggestions for policy makers.
With this physical coupling concept, a coupling coordination degree model concerning URI innovation system is developed, which would enable us to have a deeper insight of the relationship among university–research institute–industry innovations. This model makes it possible to analyze the dynamic coupling process of the three innovation subsystems under the background construction of innovative country in China. Two main objectives are intended to achieved in this study. First, a range of indicators are aimed to be evaluated by their respective contributions to the three innovation subsystems, and the indicators that make the greatest contribution are identified. These indicators are the basis for the coordination of URI innovation system and policy formulation, improving innovation level of the subsystems. Second, the dynamic evolutions of coupling coordination degrees of URI innovation system are aimed to be described, using various regional data during 2009–2015 in China.

3. Materials and Methods

3.1. Innovation Evaluation Indicators and Data Source

To investigate the coupling relationship among the innovation subsystems of university, research institute, and industry in China, indicators evaluating their innovation levels are collected respectively. The indicators should cover the various aspects of university–research institute–industry sustainability, at the same time, they should be the simplest indicators, which can promote data collection, understanding, and dissemination. The indicator subsystems of university, research institute, and industry consist of eight, eight, and eleven indicators, respectively (see Table 1).
The data required for this paper is mainly from the China Statistical Yearbook on Science and Technology [36]. Because the dimensions and magnitudes of the selected indicators in Table 1 are different, they should be normalized to make them comparable and facilitate further analysis. Usually, indicators can be divided into two categories: benefit indicator that is the-bigger-the-better; and cost indicator that is the-bigger-the-worse. In this paper, the indicators in Table 1 are all benefit indicators. Taking the indicators in the university innovation subsystem as an example, the normalization of different types of indicators is as follows:
q i j = x i j min i ( x i j ) max i ( x i j ) min i ( x i j )
where xij is the indicator in the university innovation subsystem. qij represents the normalized form of the indicator xij. Similarly, the indicators in the other two innovation subsystems can also be normalized based on the above equations.

3.2. Methods

Regional URI innovation system is a complicated and dynamic system [37]. The three subsystems participate in the innovative activities based on their own strength of innovation resources. Capitals, researchers, and knowledge effectively exchange among the subsystems; as a result, coordinated relationship can be formed and the system can evolve from disorder to order. Thus, it is critical to understand the interactive coupling relationship among URI innovations. As can be seen in Figure 1, industry is a centralization process of technology and commercialization. Based on the strengths in R&D funds, equipment and facilities, market information acquisition, technology industrialization, etc., it can obtain new production technology and attract experts from universities and research institutes [38]. As a result, production efficiency can be improved, and competitive advantage can be maintained. Universities and research institutes can produce knowledge and technology for regions. On the basis of technology innovation and talent cultivation, they can make the knowledge and technology industrialization by exporting expertise and technical support to industries. Besides this, the difference between universities and research institutes is mainly in the type of research. Universities focus on the fundamental research, while research institutes mainly direct towards applied research. They can cooperate mutually through constructing laboratories and co-operated projects. Therefore, research resources can be totally integrated, communication among talents can be realized, and equipment can be shared mutually.
Based on the above analysis, the system composed of university innovation subsystem, research institute innovation subsystem, and industry innovation subsystem could be defined as a coupling system, where coordinating the coupling relationship is vital to realize a sustainable innovation-oriented society. The coupling relationship of URI innovation system is measured by the coupling coordination degree, which is obtained by a coupling model. The model contains two parts: one is to determine the indicators’ weight and the other one is to obtain the coupling coordination degree. The calculation steps are specified as follows.

3.2.1. Weight Determination

Entropy method is an objective weighting method, which is free from decision makers’ subjective information and has been frequently used in many fields [39]. After collecting the original data of the three innovation subsystems, a data matrix Q is obtained as follows:
Q = [ q 11 q 12 q 1 n q 21 q 22 q 2 n q m 1 q m 2 q m n ]
where q i j represents the value of ith year against the jth indicator (i = 1, 2, …, m; j = 1, 2, …, n). m and n are the numbers of years and indicators, respectively.
Step 1: Normalize the original data matrix
To make the indicators with different scales comparable, the original data matrix is normalized as follows:
p i j = q i j i = 1 m q i j
where pij, belonging to (0, 1), is the normalized form of qij.
Step 2: Calculate the entropy of each indicator
e j = k i = 1 m ( p i j × ln ( p i j ) )
where k is an adjustment factor, and k = 1/lnm. ej is the information entropy of the jth indicator.
Step 3: Obtain each indicator’s weight
Then, we can compute the weight of each indicator by
w j = 1 e j j = 1 n ( 1 e j )
where wj is the weight of jth indicator.

3.2.2. Coupling Coordination Degree Model

Coordinated development is a virtuous cycle to achieve the URI innovation system’s overall evolution, where different subsystems cooperate and promote mutually. Usually, the cycling condition is measured by coupling coordination degree, which can be obtained according to the following steps.
Step 1: Calculate comprehensive evaluation indexes of the three subsystems
Based on Equations (3) and (5), the comprehensive evaluation indexes are calculated by
C E I i d = j = 1 n p i j × w j
where C E I i d represents the comprehensive evaluation index of ith year in the dth subsystem (d = U, R and I).
Step 2: Compute the coupling degree of the three subsystems
The coupling degree can be obtained by
C i = 3 × { C E I i U × C E I i R × C E I i I [ C E I i U + C E I i R + C E I i I ] 3 } 1 / 3
where Ci is the ith year’s coupling degree of URI innovation system.
Step 3: Obtain the comprehensive evaluation index
Then, the comprehensive evaluation index of innovation system of URI can be obtained by
T i = a C E I i U + b C E I i R + c C E I i I
where Ti is the ith year’s comprehensive evaluation index of URI. a, b and c are coefficient, belonging to [0, 1], which represent the contribution of the university, research institute, and industry to the comprehensive system, respectively. In this study, the three innovation subsystems are considered as equally important, so the values of a, b, and c are equivalent, i.e., a = b = c = 1/3.
Step 4: Calculate the degree of coupling coordination among the three subsystems
Based on the above results, the coupling coordination degree model can be established as follows:
D i = C i × T i
where Di is the coupling coordination degree of the URI innovation system.
Then, according to the researches of Li et al. [33] and Liao [40], the development levels of coupling coordination of the URI innovation system are divided into several categories, based on the coupling coordination degree. As can be seen in Table 2, there are three primary classifications, six secondary classifications, and 24 types of tertiary classifications. The tertiary levels are obtained by comparison between the comprehensive evaluation indexes of universities, research institutes, and industries.

4. Empirical Results

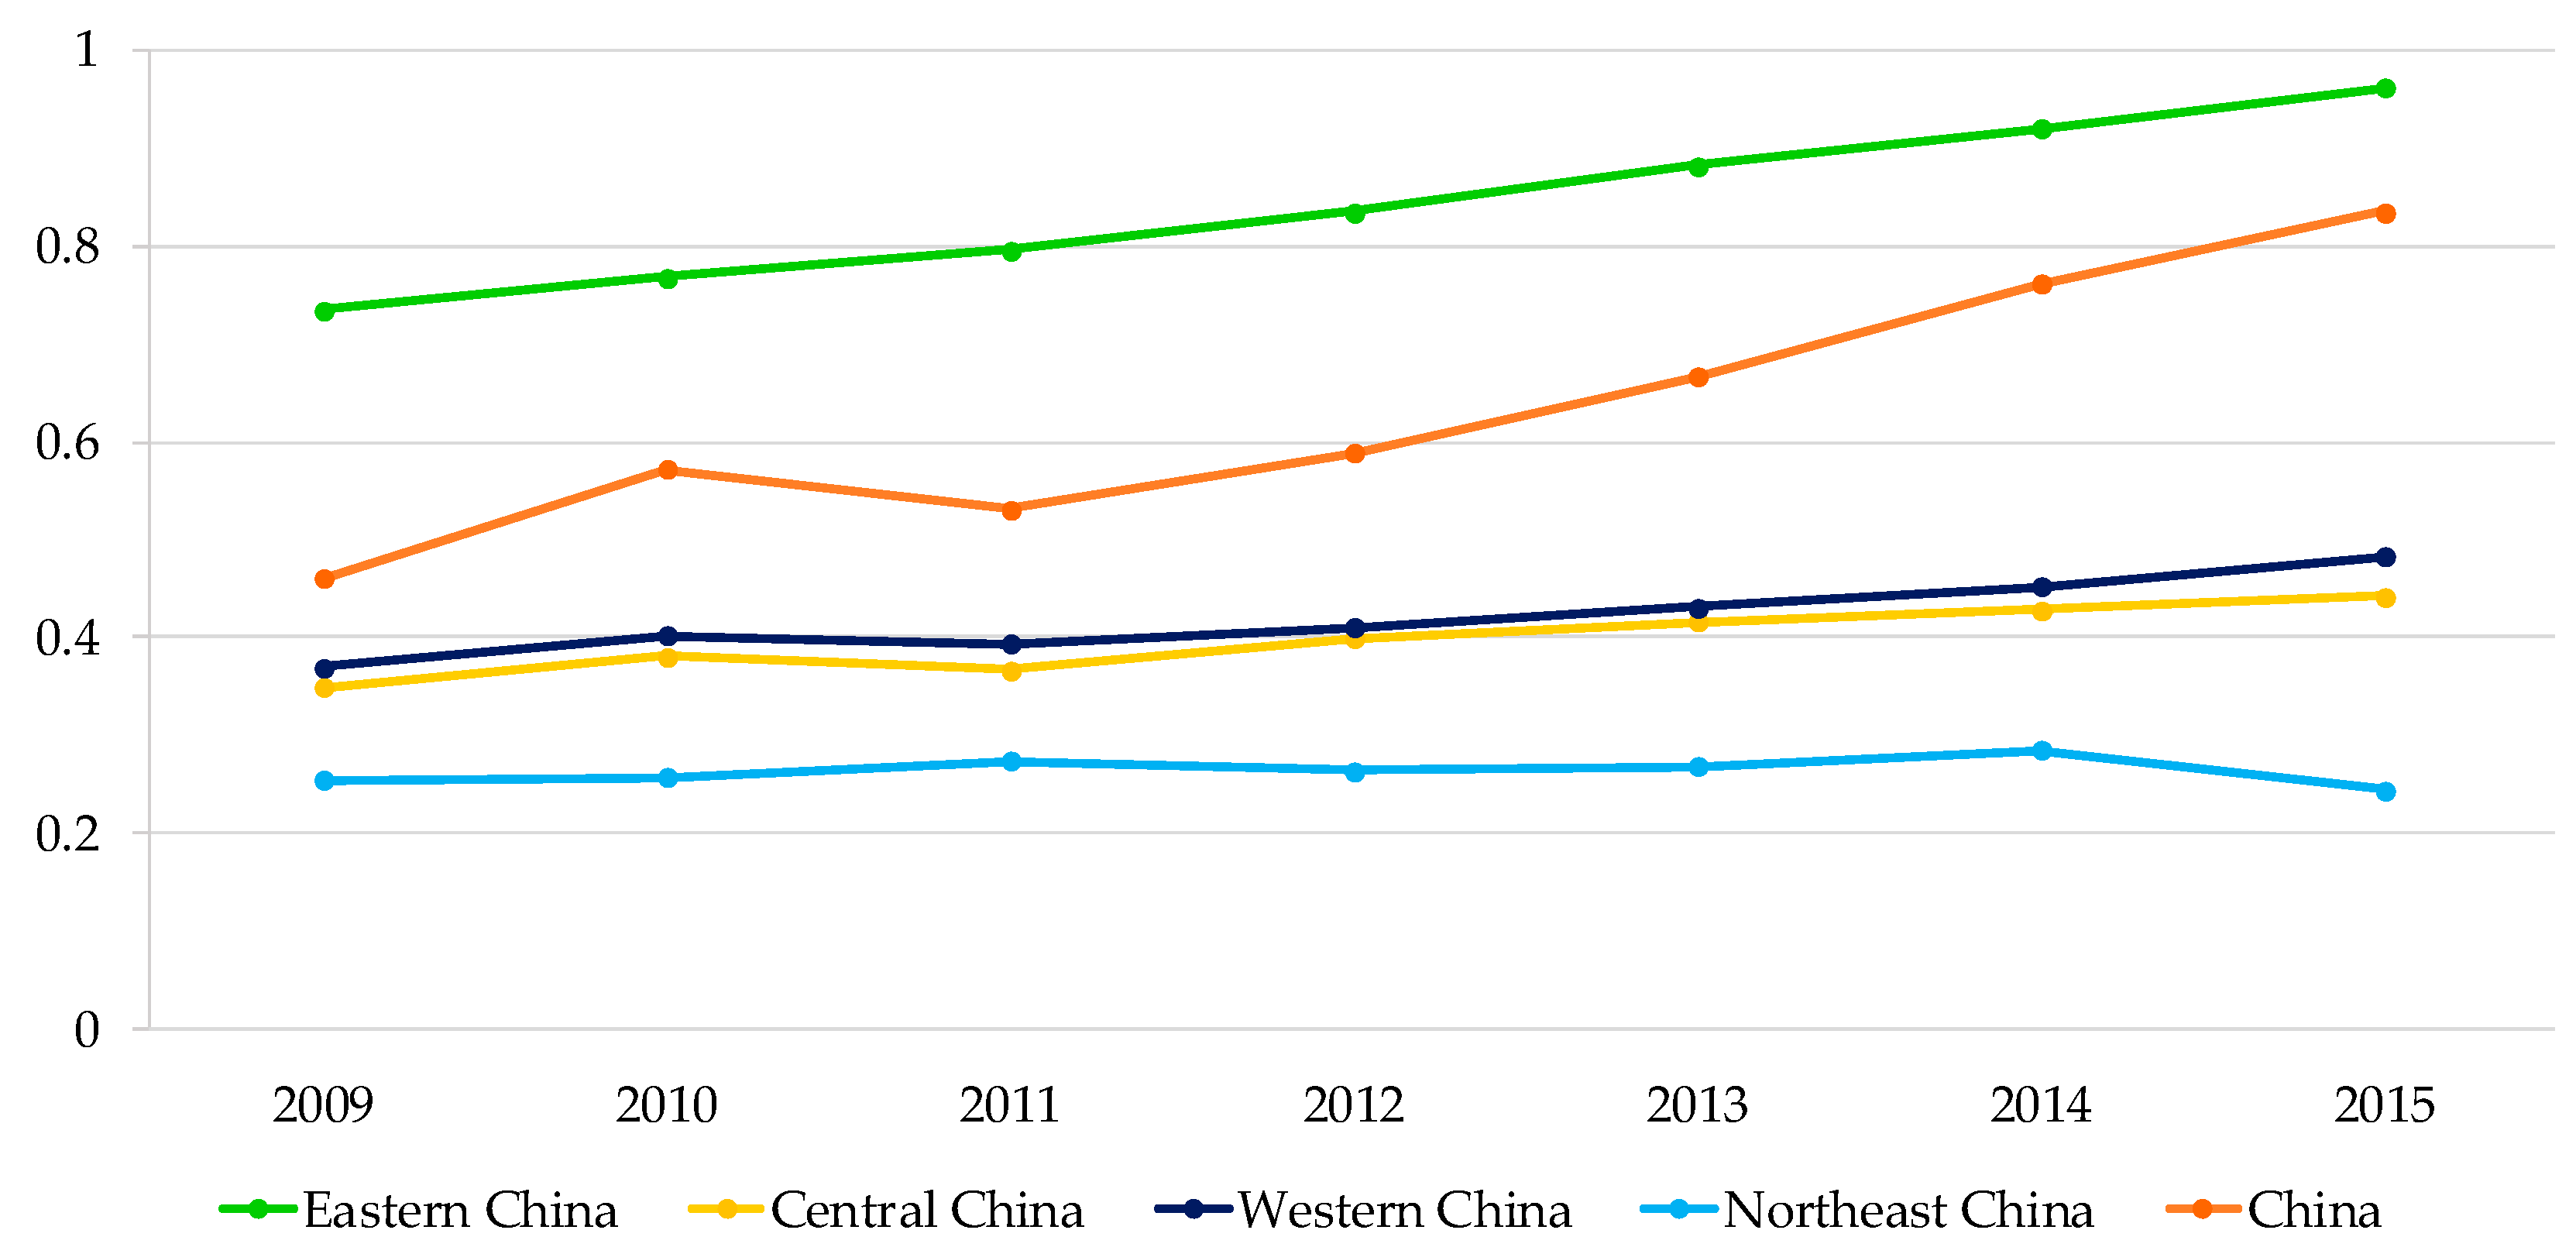
4.1. Analysis of Overall Innovation Level of the URI Subsystems

In this section, using the Equations (1)–(5), the indicators’ weights (see Table 1) and the comprehensive evaluation indexes denoting innovation levels are obtained.
First, as shown in Table 1, the weights of four indicators in the university innovation subsystem, i.e., the number of patents (x6), R&D project funding (x4), R&D internal expenditure (x1), and researchers input (x3), are the greatest, which are 0.268, 0.204, 0.199, and 0.086, respectively. From a point of overall view, these indicators’ weights occupy 75.7% of the total, especially the indicators, x6 and x4, occupying 47.2%. Thus, they have significant influence on the regional university innovation system. As a whole, the number of patents and R&D inputs (i.e., funding and researchers) are the most important factors that have an impact on the universities’ innovative activities in a region. The comprehensive development level of university innovation subsystem in different regions is depicted in Figure 2. As can be seen in Figure 2a, obviously, there is an increasing trend from 2009–2015 in all regions in China. The comprehensive level in eastern China is the highest, followed by western China, central China, and northeast China, successively. This is because that the eastern China occupies many research resources of universities. Figure 2b presents the ratios of the four important indicators’ values in different regions. Eastern China occupies the most in all indicators from 2009 to 2015. For example, in 2015, nearly 59% of R&D internal expenditure, 49% of researchers input, 56% of R&D project funding, and 63% of the number of patents are owned by eastern China. Thus, eastern China’s university innovation level is higher than those in other regions.
Second, in the innovation subsystem of research institute, we can see from Table 1 that the number of patents (y6) has the most important impact, of which the weight is 0.158. It is followed by the number of research institutes (y7), the number of published scientific papers (y5), and R&D project funding (y4), whose weights are 0.139, 0.136, and 0.132, respectively. These four indicators account for 56.5% in the total influence. This means that regional research institutes should not only pay attention to research results (i.e., y5 and y6), but also consider the research investment (i.e., y4 and y7). Figure 3 shows the evolutions of research institutes’ innovation level in different regions from 2009–2015. From Figure 3a, apparently, there is a rising trend in regions except northeast China. From the view of different regions, we can see that the research institute’s innovation level in eastern China is also the highest, just like the university innovation subsystem. The reason for this is that eastern China has the most resources of research institutes. As can be seen in Figure 3b, more than half of the values of indicators (i.e., y4, y5, and y6) are in eastern China. Although the percentage of indicator y7 is not exceed 50% in eastern China, it is still the greatest in all regions. Thus, research institutes’ innovation level of eastern China is also the highest.
Third, in the industry innovation subsystem, it can be clearly seen in Table 1 that the number of enterprises’ R&D institutes (z4), the number of patents (z9), the number of high-tech enterprises (z8), and the expenditures on acquiring external technology (z5) are the indicators whose weights rank top four. They are 0.181, 0.177, 0.121, and 0.115, respectively. Their total influence accounts for 59.4%. This indicates that the input (i.e., z4 and z5) and research output (i.e., z9) have the most important impact on the regional innovation level of industries. Besides this, high-tech enterprises can also facilitate the comprehensive innovation level of industries in a region. Except declining in 2011 due to the changes of statistical standards, industries’ comprehensive innovation levels have a trend of increasing in eastern China, central China, and western China (see Figure 4a). However, the innovation changes in northeast China had two stages: it decreased from 0.11 to 0.06 in 2009–2012, and increased from 0.06 to 0.10 in 2012–2015. Overall, the innovation changes in northeast China declined in the period of research. As can be seen in Figure 4b, the percentages of the four important indicators’ values reduce from 2009 to 2015 in northeast China. For example, the percentages of z4, z5, z8, and z9 in the northeast reduced from 4%, 10%, 6%, and 5% in 2009 into 2%, 8%, 4%, and 3% in 2015, respectively. One of the main reasons is that the industries in northeast China rely much on resources and are investment-driven, leading to its relatively low innovation ability.

4.2. Analysis of the Coupling Coordination Degree

With Equations (6)–(9), the coupling coordination degrees of different regions and provinces are calculated, which are plotted in Figure 5 and Table 3.
Figure 5 describes the evolution path of coupling coordination degrees of the URI innovation system in China and its four regions during the study period. It can clearly be seen that the coupling coordination degree in China increases from 0.46 in 2009 to 0.83 in 2015, developing from slightly unbalanced development (SBD) to superiorly BD (balanced development). In the terms of the four regions, the coupling coordination degree is the greatest in eastern China and has moved into the superiorly BD since 2012. The coupling coordination degrees of western China and central China are between 0.3 (in 2009) and 0.5 (in 2015). Their innovation systems have developed from the stage of moderately UBD (unbalanced development) into slightly UBD, while, compared with that in eastern China, the gap becomes larger. The coupling coordination degree is the lowest and it decreases in northeast China. Apparently, the changing routes are similar with those of comprehensive evaluation indexes, which can explain the divergences between the coupling coordination degrees of regions.
In addition, we also compute the coupling coordination degrees of the 31 provinces in China from 2009–2015 (see Table 3). According to the classification standard of coupling coordination in Table 2, each province’s coordinated development stage of URI innovation system can be divided and marked by different colors. It can be clearly seen that most of the provinces’ coordination degrees rise, and the number of favorably BD also increase. By 2015, there are five provinces of which the coupling coordination being in balanced development, compared with two provinces in 2009. The coupling coordination degree in Beijing is the highest, which has stepped into the stage of favorably balanced development since 2011. Following it are Jiangsu, Shanghai, and Guangdong, which are also in the stage of favorably balanced development in 2015. Then, the coupling coordination in Shandong develops into barely balanced development stage during the research period. These provinces so far are in eastern China. However, the other provinces’ coupling coordination are in unbalanced development with different extents during the study period. For example, although the coupling coordination in Zhejiang increases from 0.387 to 0.499, it still in the phase of unbalanced development (developing from moderately UBD into slightly UBD). This can also be seen in Hubei, Sichuan, Shaanxi, etc.
Further, Figure 6 depicts the URI comprehensive innovation levels and coupling coordination degrees of each province in 2015. Through comparing the values of each subsystems’ comprehensive innovation levels, we can understand which subsystem is lagged in each province, and should be paid more attention to improve the coupling coordination.
(1)
The coupling coordination degree of URI system in Beijing is the greatest, which is in the phase of favorably BD. The values of the universities’, research institutes’, and industries’ comprehensive innovation evaluations are 0.95, 0.92, and 0.17, respectively. Thus, the innovation system in Beijing is classified into universities–research institutions leading type, with industry lagging. This is because that more than half of the researchers and research fund are invested in universities and research institutes. Many famous universities (e.g., Peking University and Tsinghua University) and research institutes (e.g., Chinese Academy of Sciences and Chinese Academy of Social Sciences) are concentrated in Beijing. Through Zhongguancun Science and Technology Park, the innovation resources and results of universities and research institutes can be converted into the practice. However, the comprehensive innovation level of industry is relatively lagged to the other two subsystems. Therefore, in the future, Beijing could focus more on industries’ innovation.
(2)
Except Beijing, the four provinces with balanced development (i.e., Jiangsu, Shanghai, Guangdong, and Shandong) are located in coastal area. Comparing the three comprehensive levels of these four provinces, we find that the coupling coordination in Jiangsu, Guangdong, and Shandong is industries leading type. The corporate innovation development drives the innovation of universities and research institutes in these provinces. In Shanghai, the comprehensive innovation values of the universities, research institutes, and industries are 0.49, 0.25, and 0.25, respectively. Therefore, Shanghai is universities leading type. Its innovation system is hindered by research institutes and industries.
(3)
There are four provinces, i.e., Zhejiang, Hubei, Sichuan, and Shaanxi, whose coupling coordination of URI innovation systems is in stage of slightly unbalanced development. They are mainly in the eastern, central, and western regions. Among them, Hubei, Sichuan, and Shaanxi are universities leading type; Zhejiang is industries leading type. Besides, the coupling coordination in Zhejiang and Hubei is hindered by the innovation of research institutes subsystem, while the coupling coordination in Sichuan and Shaanxi is impeded by industry innovation subsystem. Through promoting the innovation level of the lagged subsystem, these provinces can relative be easy to step into balanced development.
(4)
The coupling coordination of URI innovation system in other 22 provinces is in unbalanced development. Most of them are in the central and western China and northeast China. For example, due to the special background of historical development, northeast China has abundant educational resources, thus, Liaoning, Jilin, and Heilongjiang are universities leading type. While their economic developments rely much on resources and investment, industries’ innovation is relatively low and the universities’ research results cannot be effectively transformed into industries’ products. As a result, the innovation capacity of these provinces is relatively not strong. Fujian and Chongqing are universities–industries leading type. They can improve the innovation level mutually, but their innovation levels of research institutes are lagged, which restricts the enterprises to obtain cutting-edge knowledges and technologies. Meanwhile, this also affects research institutes to gain resources from industries to improve the developments of themselves.

5. Conclusions and Discussion

In the context of building an innovative country in China, effective URI innovation collaboration is critical to improve the national innovation level. However, URI collaboration has some problems in China, such as the unbalanced research funding structure and development level of regional URI collaboration. Before taking actions to increase the sustainability of URI collaboration, the relationship among URI innovations in different regions must be understood. Using the coupling coordination degree model developed in this study makes possible to investigate the dynamic relationship among URI innovations in different regions in China. A valuable evidence base is offered in this empirical work to enhance the innovation levels of URI system, and then, to obtain more sustainable development.
As the analysis results show that the number of patents and R&D project funding are the major indicators both contributing to the regional innovation level of universities and research institutes at the subsystem level. For industries, except the number of patents, the number of enterprises’ R&D institutes is also an important indicator for the regional innovation level. In other words, they are the most important determinants of universities and research institutes in the coupling relationship among URI innovation system in China in the period of 2009–2015. This indicates that measuring regional innovation levels of URI should not only focus on output indicators (i.e., the number of patents). It is advisable to also pay attention to input indicators (i.e., R&D project funding and the number of enterprises’ R&D institutes). In this respect, government policy makers should support more research funding for URI to further improve their innovation levels.
Besides this, we focus on the evolutions of the coupling coordination degree among URI innovation systems in different regions in China. We find that, except northeast China, the coupling coordination level of the URI innovation system has a trend of increasing in China and other regions in the period of study. One of the main reasons is that it is pushed by the national strategy of innovation-driven development. Simultaneously, intermediary organizations, such as national university science park, collaborative innovation center, and strategic alliance of industrial technology innovation, also facilitate the overall increase of URI innovation system. These organizations accelerate the innovative resources (e.g., funds, personals, facilities) to flow among the subsystems, and promote the resource integration, technology cooperation, and achievements conversion. Although the coupling coordination degree continues to rise on the whole, the gap between regions/provinces also increases in the period of study. Eastern China has traced a shift from the favorably BD to superiorly BD; western China and central China shift from the stage of moderately UBD into slightly UBD; northeast China keeps in the stage of moderately UBD. Due to excellent innovation environment and the rich resources of universities and research institutes (e.g., the number of research institutes, R&D projects, patents, R&D project funding, researchers, etc.), eastern China has formed the coordinated URI innovation system with universities–research institutes leading type or industries leading type. Although the innovation level of universities of some provinces in other regions is outstanding, such as Sichuan, Heilongjiang, etc., there is a lack of cooperation and exchange between the universities and industries, leading to relatively low coupling coordination of URI innovation system.
The above discovery contributes to the literature and suggests meaningful policy implications. First, the previous researches mainly focus on one-way effect, namely, studying the influence of universities/research institutes on industries, or the influence from the perspective of opposite direction. Furthermore, they mainly use or collect data in micro level. In this paper, utilizing regional data in China, a coupling coordination degree model is developed to describe the relationship of URI innovations through various interactions. As the analysis results in this study, the dynamic coupling relationship among URI innovation subsystems has been intensified under the background of constructing innovation society in China. Second, on the whole nation, when maintaining the coupling coordination of innovation in eastern China, the central government should provide more favorable policy support for improving innovation level of central and western China and northeast China. From the terms of different provinces, innovation development policies should be made according to the coupling coordination degrees, innovative resource endowments, and socio-economic development conditions. For the provinces with industries leading type (i.e., Jiangsu, Guangdong, Zhejiang, and Shandong), to better improve the innovation level of universities and research institutes, governments can provide more research funding for them, simultaneously, the governments can create communication conditions to strengthen the link among URI. For the provinces with universities/research institutes leading type (e.g., Beijing, Heilongjiang, Sichuan, Hubei, etc.), the provinces in different regions have different strategy: for those in eastern China, the construction of cooperative research platforms should be further strengthened to maintain the balanced development of URI innovation system; for those in the other regions, the communication channels should be built to motivate the innovation demand of enterprises and make the achievements of universities and research institutes industrialize. Besides this, for the provinces with unbalanced development of URI innovation system, the innovation capacities of the three URI subsystems should all be improved through a series of policies to guide the input of innovative elements (e.g., research fund, researchers, etc.) into these provinces.
Although the developed model in this study can investigate the dynamic coupling relationship among innovation subsystems. There are still existing limitations which shall be studied in the future. First, due to the limit of data sourcing, most of the indicators can only measure individual innovation subsystem. The study lacks indicators which can measure the links among the three subsystems in a direct way. In the further research, this type of indicators would be searched through survey. Second, the role of government is also important in the regional innovation system, while the study not considers it. Thus, in the future, we would study if the role of government can be integrated in the model to better understand the interactive relationship among different subsystems.

Author Contributions

This study was conducted under cooperation between all authors. J.L. constructed the method and wrote this paper. H.F. designed this study. S.F. collected the data. S.E.S. calculated the final results using the method. All authors have read and approved the final manuscript.

Acknowledgments

The work described in this paper was supported by the Consultation Project of the Chinese Academy of Engineering (2017-RC-05), National Natural Science Foundation of China (71073007, 71773006), Research Project on Major Issues in the Philosophy and Social Science Research of the Ministry of Education (17JZD023), Special Fund of Postgraduate Education and Development Research (2018-06), Special Project of the Ministry of Education (15JDGC012), and Education Scientific Planning Project of Beijing (AAA12007). The authors also would like to thank the editor and the anonymous reviewers for their helpful comments and suggestions on the drafts of this paper.

Conflicts of Interest

The authors declare no conflict of interest.

References

  1. Perkmann, M.; Tartari, V.; McKelvey, M.; Autio, E.; Broström, A.; D’Este, P.; Krabel, S. Academic engagement and commercialisation: A review of the literature on university–industry relations. Res. Policy 2013, 42, 423–442. [Google Scholar] [CrossRef]
  2. Gulbrandsen, M.; Slipersaeter, S. The third mission and the entrepreneurial university model. In Universities and Strategic Knowledge Creation; Edward Elgar: Cheltenham, UK, 2007; pp. 112–143. [Google Scholar]
  3. Bekkers, R.; Freitas, I.M.B. Analysing knowledge transfer channels between universities and industry: To what degree do sectors also matter? Res. Policy 2008, 37, 1837–1853. [Google Scholar] [CrossRef]
  4. Siegel, D.S.; Waldman, D.; Link, A. Assessing the impact of organizational practices on the relative productivity of university technology transfer offices: An exploratory study. Res. Policy 2003, 32, 27–48. [Google Scholar] [CrossRef]
  5. Lee, Y.S. The sustainability of university-industry research collaboration: An empirical assessment. J. Technol. Transf. 2000, 25, 111–133. [Google Scholar] [CrossRef]
  6. Beesley, L.G. Science policy in changing times: Are governments poised to take full advantage of an institution in transition? Res. Policy 2003, 32, 1519–1531. [Google Scholar] [CrossRef]
  7. Lehrer, M.; Nell, P.; Gärber, L. A national systems view of university entrepreneurialism: Inferences from comparison of the German and US experience. Res. Policy 2009, 38, 268–280. [Google Scholar] [CrossRef]
  8. Woolgar, L. New institutional policies for university–industry links in Japan. Res. Policy 2007, 36, 1261–1274. [Google Scholar] [CrossRef]
  9. Lee, J.; Win, H.N. Technology transfer between university research centers and industry in Singapore. Technovation 2004, 24, 433–442. [Google Scholar] [CrossRef]
  10. Barrett, D.; Austin, J.; McCarthy, S. Cross-sector collaboration: Lessons from the International Trachoma Initiative. In Public-Private Partnerships for Public Health; Harvard University Press: Cambridge, MA, USA, 2000. [Google Scholar]
  11. Gertner, D.; Roberts, J.; Charles, D. University-industry collaboration: A CoPs approach to KTPs. J. Knowl. Manag. 2011, 15, 625–647. [Google Scholar] [CrossRef]
  12. Powers, J.B. Commercializing academic research: Resource effects on performance of university technology transfer. J. Higher Educ. 2003, 74, 26–50. [Google Scholar] [CrossRef]
  13. Xi Jinping’s Report at 19th National Congress of the Communist Party of China (CPC). Available online: http://www.xinhuanet.com/english/special/2017-11/03/c_136725942.htm (accessed on 18 October 2017).
  14. Huang, M.D.; Li, W.W.; Huang, J. Research on the present situation and countermeasures of the industry-university-research cooperation in China. Sci. Technol. Prog. Policy 2017, 34, 22–27. (In Chinese) [Google Scholar]
  15. Hong, W.; Su, Y.S. The effect of institutional proximity in non-local university–industry collaborations: An analysis based on Chinese patent data. Res. Policy 2013, 42, 454–464. [Google Scholar] [CrossRef]
  16. Gulbrandsen, M.; Smeby, J.C. Industry funding and university professors’ research performance. Res. Policy 2005, 34, 932–950. [Google Scholar] [CrossRef]
  17. Walsh, J.P.; Baba, Y.; Goto, A.; Yasaki, Y. Promoting university–industry linkages in Japan: Faculty responses to a changing policy environment. Prometheus 2008, 26, 39–54. [Google Scholar] [CrossRef]
  18. Van Rijnsoever, F.J.; Hessels, L.K.; Vandeberg, R.L. A resource-based view on the interactions of university researchers. Res. Policy 2008, 37, 1255–1266. [Google Scholar] [CrossRef]
  19. Feller, I.; Ailes, C.P.; Roessner, J.D. Impacts of research universities on technological innovation in industry: Evidence from engineering research centers. Res. Policy 2002, 31, 457–474. [Google Scholar] [CrossRef]
  20. Maietta, O.W. Determinants of university–firm R&D collaboration and its impact on innovation: A perspective from a low-tech industry. Res. Policy 2015, 44, 1341–1359. [Google Scholar]
  21. Kafouros, M.; Wang, C.; Piperopoulos, P.; Zhang, M. Academic collaborations and firm innovation performance in China: The role of region-specific institutions. Res. Policy 2015, 44, 803–817. [Google Scholar] [CrossRef] [Green Version]
  22. Mansfield, E.; Lee, J.Y. The modern university: Contributor to industrial innovation and recipient of industrial R&D support. Res. Policy 1996, 25, 1047–1058. [Google Scholar]
  23. Ankrah, S.; Omar, A.T. Universities–industry collaboration: A systematic review. Scand. J. Manag. 2015, 31, 387–408. [Google Scholar] [CrossRef]
  24. Perkmann, M.; King, Z.; Pavelin, S. Engaging excellence? Effects of faculty quality on university engagement with industry. Res. Policy 2011, 40, 539–552. [Google Scholar] [CrossRef] [Green Version]
  25. Sherwood, A.L.; Butts, S.B.; Kacar, S.L. Partnering for knowledge: A learning framework for university-industry collaboration. In Proceedings of the 2004 Annual Meeting of Midwest Academy of Management, Minneapolis, MN, USA, 2–4 October 2004; pp. 1–17. [Google Scholar]
  26. Logar, C.M.; Ponzurick, T.G.; Spears, J.R.; Russo France, K. Commercializing intellectual property: A university-industry alliance for new product development. J. Prod. Brand Manag. 2001, 10, 206–217. [Google Scholar] [CrossRef]
  27. Blumenthal, D. Academic–industrial relationships in the life sciences. N. Engl. J. Med. 2003, 349, 2452–2459. [Google Scholar] [CrossRef] [PubMed]
  28. Cyert, R.M.; Goodman, P.S. Creating effective university-industry alliances: An organizational learning perspective. Organ. Dyn. 1997, 25, 45–57. [Google Scholar] [CrossRef]
  29. George, G.; Zahra, S.A.; Wood, D.R., Jr. The effects of business–university alliances on innovative output and financial performance: A study of publicly traded biotechnology companies. J. Bus. Ventur. 2002, 17, 577–609. [Google Scholar] [CrossRef]
  30. Pavitt, K. The social shaping of the national science base. Res. Policy 1998, 27, 793–805. [Google Scholar] [CrossRef]
  31. Bruneel, J.; d’Este, P.; Salter, A. Investigating the factors that diminish the barriers to university–industry collaboration. Res. Policy 2010, 39, 858–868. [Google Scholar] [CrossRef] [Green Version]
  32. Zhu, Y.; Guan, Y.; Xu, H. Dynamic analysis of industry-university-research cooperation conflict based on interval grey number preference. In Proceedings of the 2017 International Conference on Grey Systems and Intelligent Services (GSIS), Stockholm, Sweden, 8–11 August 2017; pp. 27–32. [Google Scholar]
  33. Li, Y.F.; Li, Y.; Zhou, Y.; Shi, Y.; Zhu, X. Investigation of a coupling model of coordination between urbanization and the environment. J. Environ. Manag. 2012, 98, 127–133. [Google Scholar] [CrossRef] [PubMed]
  34. He, J.; Wang, S.; Liu, Y.; Ma, H.; Liu, Q. Examining the relationship between urbanization and the eco-environment using a coupling analysis: Case study of Shanghai, China. Ecol. Indic. 2017, 77, 185–193. [Google Scholar] [CrossRef]
  35. Tang, Z. An integrated approach to evaluating the coupling coordination between tourism and the environment. Tour. Manag. 2015, 46, 11–19. [Google Scholar] [CrossRef]
  36. National Bureau of Statistics of China. China Statistical Yearbook on Science and Technology; China Statistics Press: Beijing, China, 2010–2016. (In Chinese)
  37. Wei, Q.F.; Gu, Xi. Study on the synergetic innovation process of industry-university-research institute based on knowledge flow. Sci. Technol. Prog. Policy 2013, 30, 133–137. (In Chinese) [Google Scholar]
  38. Wang, J.S.; Zhang, Y.Y.; Su, S.B.; Liu, J.N. Research on the mechanism of CEEUSRO collaborative innovation based on a theoretical research framework. Sci. Technol. Prog. Policy 2013, 30, 1–6. (In Chinese) [Google Scholar]
  39. Wang, S.J.; Fang, C.L.; Wang, Y. Quantitative investigation of the interactive coupling relationship between urbanization and eco-environment. Acta Ecol. Sin. 2015, 35, 2244–2254. [Google Scholar]
  40. Liao, C.B. Quantitative judgement and classification system for coordinated development of environment and economy—A case study of the city group in the Pearl River Delta. Trop. Geogr. 1999, 19, 171–177. [Google Scholar]
Figure 1. The coupling coordination relationship among the URI innovation subsystems.
Sustainability 10 01954 g001
Figure 2. Evolutions of innovation levels of universities in different regions in China.
Sustainability 10 01954 g002
Figure 3. Evolutions of innovation levels of research institutes in different regions in China.
Sustainability 10 01954 g003
Figure 4. Evolutions of innovation levels of industries in different regions in China.
Sustainability 10 01954 g004
Figure 5. Evolutions of coupling coordination degrees of the URI innovation system in different regions in China.
Sustainability 10 01954 g005
Figure 6. URI comprehensive innovation levels and coupling coordination degrees of different provinces in 2015.
Sustainability 10 01954 g006
Table 1. The indicators for evaluating the university–research institute–industry (URI) innovation level.
SubsystemEvaluation IndicatorUnitWeight
University innovationResearch and Development (R&D) internal expenditure x110,000 yuan0.199
Proportion of enterprises funds in R&D internal expenditure x2%0.004
Researchers input x3Persons*years 0.086
R&D project funding x410,000 yuan0.204
The number of the published scientific papers x5 0.085
The number of patents x6 0.268
The number of universities x7 0.038
The number of the scientific publishing works x8 0.116
Research institute innovationR&D internal expenditure y110,000 yuan0.121
Proportion of enterprises funds in R&D internal expenditure y2%0.083
Researchers input y3Persons*years 0.119
R&D project funding y410,000 yuan0.132
The number of published scientific papers y5 0.136
The number of patents y6 0.158
The number of research institutes y7 0.139
The number of scientific publishing works y8 0.112
Industry innovationR&D internal expenditure z110,000 yuan0.105
Proportion of government funds in R&D internal expenditure z2%0.030
Proportion of new products’ R&D expenditure in main business income z3%0.000
The number of enterprises’ R&D institutes z4 0.181
Expenditures on acquiring external technology z510,000 yuan0.115
The number of R&D employees z6 0.104
R&D project funding z710,000 yuan0.113
The number of high-tech enterprises z8 0.121
The number of patents z9 0.177
Proportion of new products’ sales revenue in main business income z10%0.018
Proportion of high-tech enterprises’ income in main business income z11%0.038
Table 2. The classification standard of coupling coordination of URI innovation system.
Primary ClassificationsSecondary ClassificationsTertiary Classifications
Balanced development (BD) (Acceptable interval)0.8 < D ≤ 1Superiorly BDm = min (CEIU, CEIR, CEII)Superiorly BD with m lagged
CEIU = CEIR = CEIISuperiorly BD with synchronous development of the tripartite
0.6 < D ≤ 0.8Favorably BDm = min (CEIU, CEIR, CEII)Favorably BD with m lagged
CEIU = CEIR = CEIIFavorably BD with synchronous development of the tripartite
Transitional development (Transitional interval)0.5 < D ≤ 0.6Barely BDm = min (CEIU, CEIR, CEII)Barely BD with m lagged
CEIU = CEIR = CEIIBarely BD with synchronous development of the tripartite
0.4 < D ≤ 0.5Slightly UBDm = min (CEIU, CEIR, CEII)Slightly BD with m lagged
CEIU = CEIR = CEIISlightly BD with synchronous development of the tripartite
Unbalanced development (UBD) (Unacceptable interval)0.2 < D ≤ 0.4Moderately UBDm = min (CEIU, CEIR, CEII)Moderately UBD with m lagged
CEIU = CEIR = CEIIModerately UBD with synchronous development of the tripartite
0 < D ≤ 0.2Seriously UBDm = min (CEIU, CEIR, CEII)Seriously UBD with m lagged
CEIU = CEIR = CEIISeriously UBD with synchronous development of the tripartite
Table 3. Coupling coordination degrees of the URI innovation system in different provinces in China from 2009–2015.
Provinces2009201020112012201320142015
Eastern China
Beijing (BJ)0.5850.5960.6220.6500.6880.7070.726
Jiangsu (JS)0.5130.5130.5530.5920.6280.6570.670
Shanghai (SH)0.4620.4780.5020.5270.5460.5620.620
Guangdong (GD)0.4640.4800.4940.5070.5320.5490.601
Shandong (SD)0.4160.4230.4430.4560.4770.4970.509
Zhejiang (ZJ)0.3870.3970.4320.4320.4540.4610.499
Tianjin (TJ)0.2930.3030.3080.3200.3410.3530.367
Hebei (HB)0.2640.2850.2930.3000.3110.3410.327
Fujian (FJ)0.2490.2540.2650.2700.2780.2880.307
Hainan (HAN)0.1200.1200.1170.1190.1330.1370.132
Central China
Hubei (HUB)0.3580.3770.3760.3990.4150.4300.446
Anhui (AH)0.2840.2900.3070.3320.3540.3680.386
Hunan (HUN)0.3090.3120.3370.3700.3740.3770.375
Henan (HN)0.2980.3080.3250.3260.3460.3580.374
Shanxi (SX)0.2460.2490.2500.2600.2670.2600.261
Jiangxi (JX)0.2310.2460.2390.2420.2540.2610.278
Western China
Sichuan (SC)0.3530.3660.3830.4050.4080.4270.445
Shaanxi (SNX)0.3250.3280.3500.3540.3810.3960.408
Guangxi (GX)0.2320.2440.2470.2410.2480.2520.260
Chongqing (CQ)0.2160.2280.3030.2720.2840.2920.292
Yunnan (YN)0.2270.2210.2230.2320.2370.2500.272
Gansu (GS)0.2110.2300.2200.2240.2240.2280.227
Guizhou (GZ)0.1790.2130.1980.1880.2140.2270.213
Inner Mongolia (NMG)0.1730.1860.2130.1890.2330.2190.216
Xinjiang (XJ)0.1550.1570.1590.1660.1790.1790.182
Xizang (XZ)0.0630.0860.0590.0530.0530.0690.061
Qinghai (QH)0.1060.1160.0940.1020.1150.1140.088
Ningxia (NX)0.0910.0890.0930.1220.1010.1110.126
Northeast China
Liaoning (LN)0.3810.3660.3860.3860.4060.4100.391
Jilin (JL)0.2830.2700.2740.2780.2770.2890.318
Heilongjiang (HLJ)0.3040.3050.3050.3160.3230.3270.333
Note: Sustainability 10 01954 i001 Superiorly BD; Favorably BD; Barely BD; Slightly UBD; Moderately UBD; Seriously UBD.

